Embed Size (px)
Citation preview

The INL is a U.S. Department of Energy National Laboratory operated by Battelle Energy Alliance
INL/EXT-10-17622
Principle and Uncertainty Quantification of an Experiment Designed to Infer Actinide Neutron Capture Cross-Sections
G. Youinou G. Palmiotti M. Salvatores G. Imel R. Pardo F. Kondev M. Paul
January 2010
INL/EXT-10-17622
Principle and Uncertainty Quantification of an Experiment Designed to Infer Actinide Neutron
Capture Cross-Sections G. Youinou
G. Palmiotti M. Salvatores
G. Imel1R. Pardo2
F. Kondev2
M. Paul21Idaho State University 2Argonne National Laboratory
January 2010
Idaho National Laboratory Idaho Falls, Idaho 83415
http://www.inl.gov
Prepared for the U.S. Department of Energy
Office of Science Under DOE Idaho Operations Office
Contract DE-AC07-05ID14517
Table of Contents
SUMMARY V
1. INTRODUCTION 1 2. GENERAL PRINCIPLES OF NEUTRON CROSS-SECTIONS DETERMINATION THROUGH SAMPLES
IRRADIATION 2
2.1. Nuclides transmutation equations 2 2.2. Determination of the time-integrated neutron flux 5 2.3. Application to the inference of neutron capture cross-sections 6
2.4 Experimental determination of the atom densities of the transmutation products 10
3. UNCERTAINTY QUANTIFICATION – DERIVATION OF THE EXPRESSIONS RELATIVE TO THE INFERRED
CAPTURE CROSS-SECTIONS AND TIME-INTEGRATED FLUX 11 4. NEUTRON FILTERS, FLUX LEVELS AND EFFECTIVE ONE-GROUP CROSS-SECTIONS 14 5. ACTINIDES BUILD-UP CALCULATIONS IN THE PLUTONIUM SAMPLES 17
5.1. Determination of the atom densities after irradiation 17
5.2. Validity of the Taylor development expressions 22 6. INVERSE PROBLEMS: DETERMINATION OF THE MEASUREMENT UNCERTAINTIES NECESSARY TO INFER
THE CAPTURE CROSS-SECTIONS WITH GIVEN UNCERTAINTIES 24
6.1 Estimation of current uncertainties on actinide capture cross-sections – The AFCI 1.2 covariance matrix 24
6.2 Methodology and results 25
7. THE CASE OF HIGHLY PURE SAMPLES 32 8. CONCLUSIONS 35 9. REFERENCES 36 Appendix 1: Description of the ATR 37 Appendix 2: Comparison Exact vs. Taylor expansion 39

v
Executive Summary
Thanks to the impetus given by senior reactor physicists Massimo Salvatores and Giuseppe Palmiotti, an integral reactor physics experiment devoted to infer higher actinide (Am, Cm, Bk, Cf) neutron cross-sections will take place in the US. This report presents the principle of the planned experiment as well as a first exercise aiming at quantifying the uncertainties related to the inferred quantities. It has been funded in part by the DOE Office of Science in the framework of the Recovery Act and has been given the name MANTRA for Measurement of Actinides Neutron TRAnsmutation. The principle is to irradiate different pure actinide samples in the Advanced Test Reactor at INL, and, after a given time, determine the amount of the different transmutation products. The precise characterization of the nuclide densities before and after neutron irradiation allows to infer energy-
integrated neutron cross-sections, i.e. ��
0
)()( dEEE �� ( )(E� is the neutron flux “seen” by the sample),
since the relation between the two are the well-known neutron-induced transmutation equations. This approach has been used in the past and the principal novelty of this experiment is that the atom densities of the different transmutation products will be determined with the Accelerator Mass Spectroscopy (AMS) facility located at ANL. While AMS facilities traditionally have been limited to the assay of low-to-medium atomic mass materials, i.e., A < 100, there has been recent progress in extending AMS to heavier isotopes – even to A > 200. The detection limit of AMS being orders of magnitude lower than that of standard mass spectroscopy techniques, more transmutation products could be measured and, potentially, more cross-sections could be inferred from the irradiation of a single sample. Furthermore, measurements will be carried out at the INL using more standard methods in order to have another set of totally uncorrelated information.
The energy distribution of the neutrons in a reactor is mainly determined by the nature and arrangement of its constituents. Using neutron filters it is however possible to modify this distribution and thus meet specific needs. A MCNP model of the ATR was used to calculate the effective one-group cross-sections and flux levels in the samples. To study the influence of neutron filters, first cadmium was added around the samples and then boron (90% B10). The uncertainty quantification analysis carried out shows that, once a sample has been designed and a neutron filter chosen (i.e. a neutron spectrum), the uncertainty of the inferred neutron capture cross-sections will basically depend on four parameters: the uncertainty of the measured nuclide densities (both in the initial sample and in the irradiated one), the initial sample isotopic composition, the time-integrated neutron flux and the uncertainty of the measured time-integrated neutron flux. Generally speaking, this analysis shows that the determination of the nuclide densities should be more precise for the samples irradiated in a fast boron-filtered neutron spectrum (necessary uncertainty smaller than 1% for most of the cases) than for the ones irradiated in a softer cadmium-filtered neutron spectrum where an uncertainty of a few percent is sufficient. For example, to determine the Pu-238 capture cross-section with an associated uncertainty of 5% after a 50-day irradiation, it is necessary that the Pu-239 atom density be determined with an uncertainty of no more than 0.2% in the Pu-238 sample irradiated with the boron filter, whereas 2.5% should be enough for the Pu-238 sample irradiated with the cadmium filter.

1
Principle and Uncertainty Quantification of an Experiment Designed to Infer Actinide Neutron Capture Cross-Sections
G. Youinou1, G. Palmiotti1, M. Salvatores1,3, G. Imel2, R. Pardo3, F. Kondev3, M. Paul3
1 = Idaho National Laboratory, 2 = Idaho State University, 3 = Argonne National Laboratory 1. INTRODUCTION Thanks to the impetus given by senior reactor physicists Massimo Salvatores and Giuseppe Palmiotti, an integral reactor physics experiment devoted to infer higher actinide (Am, Cm, Bk, Cf) neutron cross-sections will take place in the US. This report presents the principle of the planned experiment as well as a first exercise aiming at quantifying the uncertainties related to the inferred quantities. It has been funded in part by the DOE Office of Science in the framework of the Recovery Act and has been given the name MANTRA for Measurement of Actinides Neutron TRAnsmutation. Neutron cross-sections characterize the way neutrons interact with matter. They are essential to most nuclear engineering projects and, even though theoretical progress has been made as far as the predictability of neutron cross-section models, measurements are still indispensable to meet tight design requirements for reduced uncertainties. Within the field of fission reactor technology, one can identify the following specializations that rely on the availability of accurate neutron cross-sections:
� Fission reactor design � Nuclear fuel cycles � Nuclear safety � Nuclear safeguards � Reactor monitoring and fluence determination � Waste disposal and transmutation
In particular, the assessment of advanced fuel cycles requires an extensive knowledge of TRU cross sections. Pu isotopes, but also Am, Cm and up to Cf isotope data are required with a small uncertainty in order to optimize significant features of the fuel cycle that have an impact on feasibility studies (e.g. neutron doses at fuel fabrication, decay heat in a repository etc.). Different techniques are available to determine neutron cross-sections experimentally with the common denominator that a source of neutrons is necessary. It can either come from an accelerator that produces neutrons as a result of interactions between charged particles and a target or it can come from a nuclear reactor. When the measurements are performed with an accelerator, they are referred to as differential since the analysis of the data provides the cross-sections for different discrete energies, i.e. )( iE� , and for the diffusion cross-sections for different discrete angles. Another approach is to irradiate a very pure sample in a test reactor like the Advanced Test Reactor at INL and, after a given time, determine the amount of the different transmutation products. The precise characterization of the nuclide
densities before and after neutron irradiation allows to infer energy-integrated neutron cross-sections, i.e. ��
0
)()( dEEE �� ,
where )(E� is the neutron flux “seen” by the sample. This approach is referred to as integral and is the object of this report. These two sources of information, i.e. differential and integral, are complementary and are used by the nuclear physicists in charge of producing the evaluated nuclear data files used by the nuclear community (ENDF, JEFF…). This approach has been used in the past and the principal novelty of this experiment is that the atom densities of the different transmutation products will be determined with the Accelerator Mass Spectroscopy (AMS) facility located at ANL. This technique is sensitive for measuring quantities of long-lived, rare isotopes accurately in the presence of more abundant ones using very small amounts of material. While AMS facilities traditionally have been limited to the assay of low-to-medium atomic mass materials, i.e., A < 100, there has been recent progress in extending AMS to heavier isotopes – even to A > 200. The detection limit of AMS being orders of magnitude lower than that of standard mass spectroscopy techniques, more transmutation products can potentially be measured.

2
2. GENERAL PRINCIPLES OF NEUTRON CROSS-SECTIONS DETERMINATION THROUGH SAMPLES IRRADIATION 2.1. Nuclides transmutation equations If a sample containing an isotope of mass number A and atomic number Z is irradiated in a neutron field in position Sr
� , heavier nuclides of mass number A+1, A+2,…. will be produced as a result of successive neutron captures and beta decays. As long as no natural decay occurs, the element, i.e. Z, stays the same and the atom densities of the A+1, A+2… are given by the following set of coupled equations:
........
),(),(~),(),(),(),(),(
),(),(~),(),(),(),(),(
),(),(~),(),(),(),(),(
),(),(~),(),(
,33,223
,22,112
,11,1
,
trtrtrNtrtrtrNdt
trNd
trtrtrNtrtrtrNdt
trNd
trtrtrNtrtrtrNdt
trNd
trtrtrNdt
trNd
SSa
ZASZASS
cZAS
ZA
SZA
SSa
ZASZASS
cZAS
ZA
SZA
SSa
ZASZASS
cZAS
ZA
SZA
SSaZAS
ZA
SZA
�������
�������
�������
����
����
����
����
��
�����
�����
���
�
�
�
where � dEtrEtr SS ),,(),( �� �� is the energy-integrated time-dependant neutron flux in the sample and
�� �
� dEtrE
dEtrErEtr
S
SSckA
SckA ),,(
),,(),(),( �
���
�
��� is the effective one-group capture cross-section. The integral in energy is carried
out over the whole neutron spectrum, i.e. from about 20 MeV down to 0 eV. Finally,
����
���� kAf
kAckA
kAakA
akA
���
��� ���~ takes into account the neutron absorption (essentially capture and fission) as
well as natural decay. The other reactions like (n,2n), (n,3n),…or alpha decays have only an insignificant impact on the evolution of the nuclide densities and can be neglected when determining the A+1, A+2, A+3… nuclide densities. If somewhere along the chain there is a beta decay, the element will change, i.e. Z will change into Z+1. The most important such occurrence for reactor operation is that of U-238 which after one neutron capture followed by two beta decays is transmuted into Pu-239. The corresponding equations are the following:
........
),(),(~),(),(),(
),(),(~),(),(),(
),(),(~),(),(),(),(),(
),(),(~),(),(
94,23994239
9323993,239
94239
93,23993239
9223992,239
93239
92,2399223992,238
92238
92239
92,23892238
92238
trtrtrNtrNdt
trNd
trtrtrNtrNdt
trNd
trtrtrNtrtrtrNdt
trNd
trtrtrNdt
trNd
SSa
SSS
SSa
SSS
SSa
SSSc
SS
SSa
SS
�����
�����
�������
����
���
���
����
��
�
�
�
�
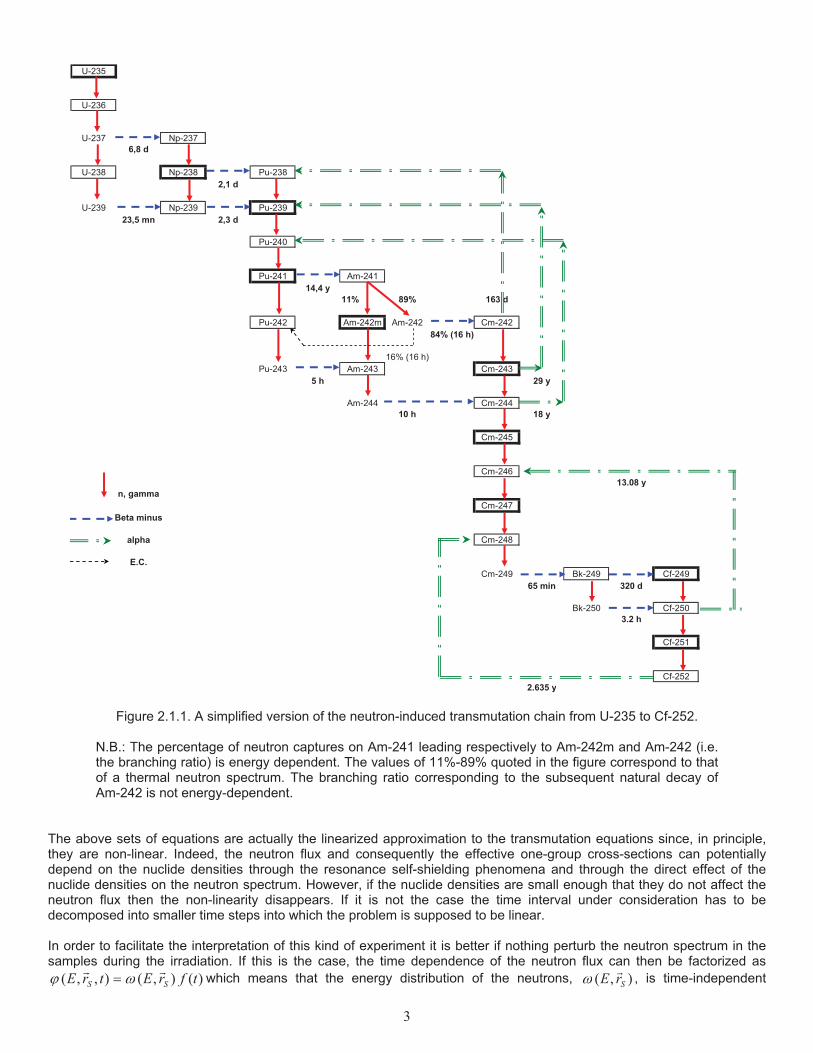
The (simplified) neutron-induced transmutation chain from U-235 to Cf-252 is shown in Figure 2.1.1.
3
U-235
U-236
U-237 Np-2376,8 d
U-238 Np-238 Pu-2382,1 d
U-239 Np-239 Pu-23923,5 mn 2,3 d
Pu-240
Pu-241 Am-24114,4 y
11% 89% 163 d
Pu-242 Am-242m Am-242 Cm-24284% (16 h)
16% (16 h)Pu-243 Am-243 Cm-243
5 h 29 y
Am-244 Cm-24410 h 18 y
Cm-245
Cm-24613.08 y
n, gammaCm-247
Beta minus
alpha Cm-248
E.C.Cm-249 Bk-249 Cf-249
65 min 320 d
Bk-250 Cf-2503.2 h
Cf-251
Cf-2522.635 y
Figure 2.1.1. A simplified version of the neutron-induced transmutation chain from U-235 to Cf-252.
N.B.: The percentage of neutron captures on Am-241 leading respectively to Am-242m and Am-242 (i.e. the branching ratio) is energy dependent. The values of 11%-89% quoted in the figure correspond to that of a thermal neutron spectrum. The branching ratio corresponding to the subsequent natural decay of Am-242 is not energy-dependent.
The above sets of equations are actually the linearized approximation to the transmutation equations since, in principle, they are non-linear. Indeed, the neutron flux and consequently the effective one-group cross-sections can potentially depend on the nuclide densities through the resonance self-shielding phenomena and through the direct effect of the nuclide densities on the neutron spectrum. However, if the nuclide densities are small enough that they do not affect the neutron flux then the non-linearity disappears. If it is not the case the time interval under consideration has to be decomposed into smaller time steps into which the problem is supposed to be linear. In order to facilitate the interpretation of this kind of experiment it is better if nothing perturb the neutron spectrum in the samples during the irradiation. If this is the case, the time dependence of the neutron flux can then be factorized as
)(),(),,( tfrEtrE SS�� � which means that the energy distribution of the neutrons, ),( SrE
� , is time-independent

4
and )(tf is merely a normalization function taking into account local flux level variations due either to total core power fluctuations or flux tilts caused by movements of control mechanisms. Since the flux ),,( trE S
�� appears both at the numerator and the denominator of the expression giving the effective one-group cross-sections, the time-dependence vanishes and it comes that:
�� �
� dErE
dErErEr
S
SSckA
SckA ),(
),(),()( �
���
��
With the neglect of the time-dependence of the effective one-group cross-sections, the general solution to the transmutation equations is as follows (the variable Sr
�has been omitted for purpose of clarity):
��
�
�
��
�
��
�nk
kktnt
t
akA
atA
Tnj
j
cjA
ZA
mZnA
TZA
ZA
akA
aA
eNTN
eNTN
0,
0
~1
0
~
)~~()0()(
)0()(
���
��
��
for n � 1, where T
dttT
� 0
)(��
The superscript m is equal to the number of beta decay occurring between the initial nuclide (A, Z) and the nuclide (A+n, Z+m), i.e. if no beta decay occurs then m = 0 whereas if one beta decay occurs then m = 1… The above expression for
)(TN mZnA
�� can account for beta decays simply by setting
���
�
c where necessary. The first non-zero Taylor
development terms of these expressions are as follows:
nnj
j
cjA
ZA
mZnA
aA
ZA
ZA
TNn
TN
TNTN
][)0(!
1~)(
]~1[)0(~)(1
0
��
��
���
����
�
�
�
��
for n � 1, where T
dttT
� 0
)(��
This shows that, as long as the product of the absorption cross-section by the time-integrated flux is small enough that the Taylor developments are legitimate, then (1) only the capture cross-sections play a role in the build-up of actinides and (2) the A+n atom density increases with the nth power of the time-integrated flux. The values obtained with the exact expressions and those obtained with the Taylor developments will be compared later on (section 5.2). As an example, and in the case where no beta decay occurs, the expressions for the A+1, A+2 and A+3 atom densities are as follows (the superscript Z has been omitted for purpose of clarity):
TNeeNTN cAAa
AaA
T
aA
aA
TcAAA
aA
aA
������
�����
)0(~~~~~)0()(1
~
1
~
1
1
���
����
�
�
�
�
�
�
21
212
~
121
~
21
~
12
][)0(21~
)~~)(~~()~~)(~~()~~)(~~()0()(
21
TN
eeeNTN
cA
cAA
aA
aA
aA
aA
T
aA
aA
aA
aA
T
aA
aA
aA
aA
TcA
cAAA
aA
aA
aA
���
��������������
������
�
���
���
��
�� ���
����
�
�
�
��
5
321
32313
~
23212
~13121
~
321
~
213
][)0(61~
)~~)(~~)(~~()~~)(~~)(~~(
)~~)(~~)(~~()~~)(~~)(~~()0()(
32
1
TN
ee
ee
NTN
cA
cA
cAA
aA
aA
aA
aA
aA
aA
T
aA
aA
aA
aA
aA
aA
T
aA
aA
aA
aA
aA
aA
T
aA
aA
aA
aA
aA
aA
T
cA
cA
cAAA a
AaA
aA
aA
����
������������
���������������
����
����
��
�����
�����
�����
���
���
�����
�
�
�����
�
�
�
�
�
��
�
2.2. Determination of the time-integrated neutron flux
The time-integrated neutron flux TdttT
�� ��0
)( can be determined experimentally from the amount of a fission product
formed during irradiation. Among the fission products, Nd-148 has the following properties [1] to recommend it as an ideal indicator for the time-integrated neutron flux: (1) It is not volatile, does not migrate in solid fuels below their recrystallization temperature, and has no volatile precursors. (2) It is nonradioactive and requires no decay corrections. (3) It has a low destruction cross-section and formation from adjacent mass chains can be corrected for. (4) It has good emission characteristics for mass analysis. (5) Its fission yield is nearly the same for U-235 and Pu-239 and is essentially independent of neutron energy. Neglecting as a first approximation the contribution of Nd-147 captures as well as the potential time-dependence of the U-235 fission cross-section, the Nd-148 atom density in a U-235 sample after an irradiation time T is given by the following expression:
���
�T dxx
UfUNd
T
UfUNdNd dtteNdtttNTN
taU
0
)(
5580
5588 )()0()()()( 05
��������
,
where 8Nd� is the Nd-148 cumulative fission yield, i.e. the number of Nd-148 atoms as well as its short-lived precursors produced per fission, and the other parameters have already been defined. If )(5 tNU is approximated by its first order development it comes that:
}])([)()({)0(])(1[)()0(~)(0 00
55580 0
55588 � ��� � T tT
aUU
fUNd
T taUU
fUNdNd dtdxxtdttNdtdxxtNTN �����������
N.B.: As long as �t
aU dxx
05 )(�� <0.1 the first order development agrees with the exact analytical expression at better than 0.5%.
This condition is fulfilled in most practical applications. Indeed, let’s consider an idealized case where a U-235 sample is irradiated in a pure Maxwellian spectrum with a (rather high) flux level of 5�1013 n.cm-2.s-1. The U-235 absorption cross-section in this
spectrum being of the order of 590 barns, it will still take about 40 days before the term �t
aU dxx
05 )(�� reaches the value of 0.1.
After integrating by part the term dtdxxttT
��00
])([)( �� it comes that:
])[211(])[0(])(
211[)()0(~)( 5558
05
05588 TTNdttdttNTN a
UUfUNd
TaU
T
UfUNdNd ���������� � �� which can be rewritten in
the form of a quadratic equation: 0~)0()(1][][
2 5
8
58
25
U
NdfUNd
aU
NTNTT
����
�� . However since the measurements provide
)()(
5
8
TNTN
U
Nd and not )0()(
5
8
U
Nd
NTN it is better to rewrite the above quadratic equation as:

6
0~)()(1][
)()(1][
2 5
8
585
8
58
525
TNTNT
TNTNT
U
NdfUNdU
NdfUNd
aU
aU
���
�����
���
����
���
The discriminant of this quadratic equation is equal to )()(2
)()(1
5
8
58
5
2
5
8
58
5
TNTN
TNTN
U
NdfUNd
aU
U
NdfUNd
aU
���
���
���
����
��� and since for
most practical applications 1)()(
5
8
58
5 ��TNTN
U
NdfUNd
aU
��� it comes that 1~� . As a quadratic equation, it has two roots,
however only one is consistent with the hypothesis used to derive the equation in the first place, i.e. that TaU �� 5 � 0.1. It
then comes that the time-integrated neutron flux in a U-235 sample can be determined from the measurement of the Nd-148 atom density relative to that of U-235 as:
fUNd
mU
Nd
TNTNT
585
8 1])()([~
���
N.B.: The fission yield 8Nd� is taken directly from existing nuclear data libraries (like ENDF/B-VII for instance) and is only very weakly problem-dependent. On the other hand, the U-235 effective one-group fission cross-
section �
�dEE
dEEEfUf
U )(
)()(55
�� is very strongly problem-dependent because )(E is the neutron spectrum
in the sample ( )(5 EfU� comes from existing libraries and is only very weakly problem-dependent).
2.3. Application to the inference of neutron capture cross-sections As an example, let’s consider a very pure sample containing essentially (i.e. at least 99%) an isotope of mass number A, but also a few tenths of a percent of other isotopes present as impurities (let’s say A-1, A+1, A+2 and A+3). The atom density of isotope A+1 after an irradiation time T can be expressed as:
]}[~1{)0(][)0(][)0(21~)( 11
2111 TNTNTNTN a
AAcAA
cA
cAAA ������� ��� ��
where the first and second terms correspond to the number of A+1 atoms produced by neutron captures on, respectively, the A-1 and A atoms, and the third term corresponds to what is left of the initial A+1 atoms. Since the sample is prepared so that )0(1AN << )0(AN , for most practical applications the first term will be much smaller than the second one and the A+1 atom density can be expressed as:
]}[~1{)0(][)0(~)( 111 TNTNTN aAA
cAAA ���� ��� �
The experimental determination of the atom densities after an irradiation time T, as well as that of the time-integrated neutron flux mT ][� (the subscript m stands for measured) allow to infer the neutron capture cross-section of isotope A as:
m
maAm
A
Am
A
A
cA T
TNN
NTN
][
}][~1{])0()0([]
)0()([
~1
11
�
���
���
However, since at time T the measurement provides mAmA
A TRTNTN )]([])()([ 1
1�
� � and not mA
A
NTN ])0()([ 1� , it comes that:

7
m
maAmAm
aAmA
m
maAm
A
Am
aAm
A
A
cA T
TRTTRT
TNNT
TNTN
][}][~1{)]0([}][~1{)]([
][
}][~1{])0()0([}][~1{]
)()([
~ 1111
11
�����
�
����� ���
���
�
and
since ��
��� AfA
cA
aA ��~ it finally comes that:
� �mAm
maAmAmAm
fAmAc
A TRTTRTTTR
)]([1][}][~1{)]0([}][][1{)]([~
1
111
�
���
�
�������
If the terms {1-…} and {1+…} are approximated by 1 (which is generally a good approximation when T� is not too large, i.e. as long as it is smaller than about 1021 n.cm-2), the expression simplifies as:
m
mAmAcA T
RTR][
)]0([)]([~ 11
�� ��
N.B.: If the capture reaction rate on the isotope A-2 is negligible compared to the (n,2n) reaction rate on the isotope A, then the (n,2n) cross-section of isotope A can be inferred using the same expression as for the capture cross-section where 1�AR is simply replaced by 1AR :
� � m
mAmA
mAm
maAmAmAm
fAmAnn
A TRTR
TRTTRTTTR
][)]0([)]([~
)]([1][}][~1{)]0([}][][1{)]([~ 11
1
1112,
�������
�
�
However, contrary to capture reactions which occur at all neutron energies, the (n,2n) reactions occur only for neutrons with energies higher than about 5 MeV (Figure 2.3.1). Consequently the effective (n,2n) cross-sections can be thousands of times smaller than the effective capture cross-sections and care should be exercised before neglecting the capture reaction rate on the isotope A-2 even when )0(2AN << )0(AN .
Figure 2.3.1. Neutron capture and (n,2n) cross-sections of Pu-238, Pu-239 and Pu-240 as a function of the
incident neutron energy, and taken from the ENDF/B-VII.0 library.
Pu-240
Pu-239
Pu-238
n,2n

8
The )(2 TNA� atom density is given by:
]}[~1{)0(][)0(][)0(21~)( 2211
212 TNTNTNTN a
AAcAA
cA
cAAA ������� ������ ��
and the capture cross-section can be inferred as:
mmA
Am
cA
maAm
A
Am
A
A
cA
TNNT
TNN
NTN
][])0()0([][
21
}][~1{])0()0([]
)0()([
~12
222
1
���
���
�
���
�
�
.
However, since at time T the measurement provides mAmA
A TRTNTN )]([])()([ 2
2�
� � and not m
A
A
NTN
])0()(
[ 2� , it comes that:
� �mAmmAmcA
maAmAmAm
fAmAc
A
TRTRT
TRTTTR
)]([1][)]0([][21
}][~1{)]0([}][][1{)]([~21
2
2221
��
����
����
��� �
���
������
Substituting c
A� by its expression as a function of the measured quantities leads finally to:
� � � �mAmmAmmA
maAmAmAm
fAmA
maAmAmAm
fAmAc
A
TRTRTTR
TRTTTRTRTTTR
)]([1][)]0([][)]([1
}][~1{)]0([}][][1{)]([21
}][~1{)]0([}][][1{)]([~
211
111
2221
���
���
����
����
����
��
�
�������������
If, as previously, the terms {1-…} and {1+…} are approximated by 1, the expression simplifies as:
� � mmAmA
mAmAcA TRTR
RTR][)]0([)]([
)]0([)]([2~11
221 �
���
��� �
,
and if, furthermore, the initial A+1 and A+2 atom densities are negligible in comparison to those at time T (this is very sample-dependent and can be a very bad approximation when T� is not too large), the A+1 capture cross-section is simply equal to:
mmA
mAcA TTR
TR][)]([
)]([2~1
21 �
��
��
Finally, the )(3 TNA� atom density is given by:
]}[~1{)0(
][)0(][)0(21][)0(
61~)(
33
222
2113
213
TN
TNTNTNTN
aAA
cAA
cA
cAA
cA
cA
cAAA
��
���������
��
��������
���

9
and the cross-section by:
� �mAmmAmcAmAm
cA
cA
maAmAmAm
fAmAc
A
TRTRTRT
TRTTTR
)]([1][)]0([][)]0([21][
61
}][~1{)]0([}][][1{)]([~32
211
31
3332
�����
����
����
��� ��
������
������
Substituting c
A� and cA 1�� by their expressions as a function of the measured quantities leads to a somewhat
cumbersome expression and is not reproduced here. However, if, as previously, the terms {1-…} and {1+…} are approximated by 1, the expression simplifies as:
� � � �� � � � ! mmAmAmAmAmAmA
mAmAmAmAcA TRTRRRTRTR
RTRRTR][)]0([)]([2)]0([)]0([2)]([)]([
)]0([)]([)]0([)]([3~221221
11332 �
�������
����� ���
�
and if, furthermore, the initial A+2 and A+3 atom densities are negligible in comparison to those at time T, the A+2 capture cross-section is simply equal to:
mmA
mAcA TTR
TR][)]([
)]([3~2
32 �
��
��
Similarly, if all the initial atom densities are negligible in comparison to those at time T, the A+n capture cross-section is simply equal to:
mmnA
mnAcnA TTR
TRn][)]([
)]([)1(~ 1
��
�
��� �
10
2.4 Experimental determination of the atom densities of the transmutation products The objective of this section is not to give a precise description of the experimental techniques that will be used to determine the atom densities of the transmutation products but simply to point out the originality of this experiment. Indeed, the Accelerator Mass Spectroscopy (AMS) facility located at ANL will be used to determine the amount of transmutation products present in the samples after the irradiation, as well as to characterize the initial samples. While AMS facilities traditionally have been limited to the assay of low-to-medium atomic mass materials, i.e., A < 100, there has been recent progress in extending AMS to heavier isotopes – even to A > 200 [2]. To date this effort has been motivated by the need to provide ultra-sensitive metrology for environmental assay and emerging basic science applications. However, this technique could also potentially be used in other important nuclear energy applications including studies of nuclear fuel cycles and radioactive waste disposal [3]. Most detection systems rely on nuclear processes such as gamma emission in order to detect and identify the isotope being observed. Conversely, AMS counts atoms rather than waiting for radioactive decay events. As a result, long half-lives and low gamma yields are not problems for AMS detection limits. Hence, AMS is a sensitive technique for measuring minute quantities of long-lived isotopes accurately in the presence of more abundant ones (abundances as low as 10-12-10-15 can be detected) using very small amounts of material [2,3]. The precision of AMS measurements is typically between 0.5% and 2% for standard applications like carbon dating [4]. The detection limit of AMS being orders of magnitudes lower than that of standard mass spectroscopy techniques, more transmutation products could be measured and, potentially, more cross-sections could be inferred from the irradiation of a single sample containing only a few mg of material. However, since the capture cross-sections are inferred from differences between initial actinide atom densities and those after irradiation (see previous chapter), the extremely high sensitivity of AMS will serve our purpose only if the uncertainty of the AMS measurements allows to determine the terms mnAmnA RTR )]0([)]([ �� with a sufficient precision. For instance, if mAR )]0([ 1� = 0.001 and mA TR )]([ 1� = 0.001005, and the uncertainty of the AMS measurements is 1%, then, even though the atom densities are well above the AMS detection limit, they can not be used to infer the capture cross-section of isotope A because the A+1 atom density after the irradiation is only 0.5% higher than the initial one, i.e. the difference is smaller than the uncertainty of the measurements. On the other hand, if mAR )]0([ 1� = 10-10 and mA TR )]([ 1� = 10-9, the AMS measurements can be used to infer the capture cross-section of isotope A. As will be shown later in the report, the cases where mnAmnA RTR )]0([)]([ �� "" are the ones where the high sensitivity of AMS should be the most valuable for our purpose.
Furthermore, in addition to AMS, more measurements will be carried out at the INL using more standard methods in order to have another set of totally uncorrelated information.

11
3. UNCERTAINTY QUANTIFICATION – DERIVATION OF THE EXPRESSIONS RELATIVE TO THE INFERRED CAPTURE CROSS-SECTIONS AND TIME-INTEGRATED FLUX
As shown above, the inferred capture cross-sections are all expressed as ratios like YXc ~� . Using the recommended,
and widely accepted, laws of propagation of uncertainties (see for example [5] and [6]), the relative uncertainty of the inferred cross-sections can be expressed as a function of the relative uncertainties of X and Y as:
���
���
���
����
��
�����
��
���
YYu
XXur
YYu
XXuu
XYc
c )()(2)()()( 22
��
where XYr = 0 if X and Y are not correlated, i.e. if they are independent, and -1� XYr �+1 otherwise. Without specific information about the correlations, and as a first guess, X and Y will be considered independent so that the relative uncertainty of the inferred cross-sections can be expressed as:
22 )()()(���
�����
��
���
YYu
XXuu
c
c
��
As examples, let’s consider the uncertainty of the inferred A and A+1 capture cross-sections. Since the inferred capture cross-section of A is expressed as (see previous chapter)
� �mAm
maAmAmAm
fAmAc
A TRTTRTTTR
)]([1][}][~1{)]0([}][][1{)]([~
1
111
�
���
�
������
�
It then comes that: }][~1{)]0([}][][1{)]([ 111 m
aAmAmAm
fAmAA TRTTTRX ����� ���
and � �mAmA TRTY )]([1][ 1�� � . The relative uncertainty of the numerator is then expressed as:
}][~1{)]0([}][][1{)]([
}]][
)]([[]~)~({[}][~{})]0({[}][~1{)})]0(([{
}]][
)]([[])({[}][{})]({[}][][1{)})](([{
)(
111
22
1
121
21
21
21
22221
221
maAmAmAm
fAmA
m
maA
aA
maAmAm
aAmA
m
mfA
fA
mfAmAmAm
fAmA
A
A
TRTTTRTTuuTRTRu
TTuuTTRTTTRu
XXu
�������
������
��
�������
���
�
�����
��
��
���
where the uncertainty of the natural decay term mA T ][� has been neglected because for most practical applications its
uncertainty is much smaller than that of the other terms. Furthermore, as long as T� is not too large, i.e. as long as it is smaller than about 1021 n.cm-2, then for most cases 1][ ��m
fA T�� and 1][~
1 ��� maA T�� and consequently this
expression can be approximated as:

12
}][~1{)]0([}][][1{)]([}][~1{)})]0(([{}][][1{)})](([{)(
111
21
21
221
maAmAmAm
fAmA
maAmAmAm
fAmA
A
A
TRTTTRTRuTTTRu
XXu
����������
���
���
�#
or, simplifying further as
mAmA
mAmA
A
A
RTRRuTRu
XXu
)]0([)]([)})]0(([{)})](([{)(
11
21
21
��
��
�
#
The relative uncertainty of the denominator is simply expressed as: m
m
A
A
TTu
YYu
][)]([)(
��
since the uncertainty of the term
� �mA TR )]([1 1�� is negligible because for most practical applications 1)]([ 1 ��� mA TR . Hence, for most practical
applications the relative uncertainty of cA� can be estimated as:
22
11
21
21
][)]([
)]0([)]([)})]0(([{)})](([{
~)(���
����
��
��
�
�
��
�
�
�
��
��
m
m
mAmA
mAmAcA
cA
TTu
RTRRuTRuu
��
��
Similarly, the expression for the inferred capture cross-section of A+1 being
� � mmAmA
mAmAcA TRTR
RTR][)]0([)]([
)]0([)]([2~11
221 �
���
��� �
it then comes that:
22
11
21
21
2
22
22
22
1
1
][)]([
)]0([)]([)})]0(([{)})](([{
)]0([)]([)})]0(([{)})](([{
~)(���
����
���
�
�
�
��
�
�
��
���
�
�
��
�
�
�
��
��
��
��
�
�
m
m
mAmA
mAmA
mAmA
mAmAcA
cA
TTu
RTRRuTRu
RTRRuTRuu
��
��
Similar expressions can be derived for the A+2, A+3… capture cross-sections, but are not reproduced here because they become quickly cumbersome. They can be used to determine the uncertainty of the inferred cross-sections given the uncertainty of the measurement of the nuclide densities and that of the measurement of the time-integrated flux. Inversely, they can be used as well to determine the experimental uncertainties that are necessary to obtain the inferred cross-sections with a given target uncertainty. This will be presented later in this document. The uncertainty of the time-integrated flux is obtained the same way. Indeed, since the time-integrated flux in a U-235 sample is given by the expression (see section 2.2):
fUNd
mU
Nd
TNTNT
585
8 1])()([~
���

13
it then comes that:
2
5
5
2
8
8
2
8
8 )()()]([
))](([~][
)]([���
����
����
�
����
����
�
����
�fU
fU
Nd
Nd
mNd
mNd
m
m uuTRTRu
TTu
��
��
��
with m
U
NdmNd TN
TNTR ])()([)]([
5
88 �
The uncertainty of the Nd-148 fission yield ( 8Nd� ) and that of the U-235 fission cross-section ( )(5 E
fU� ) are only of the
order of half a percent. However, since the U-235 effective one-group fission cross-section is calculated as
��
dEE
dEEEfUf
U )(
)()(55
�� , where )(E is the neutron spectrum in the sample, the term
fU
fUu
5
5 )(�� should then take into
account the uncertainty of the basic nuclear data )(5 EfU� as well as that of the calculated neutron spectrum )(E .
The latter comes from the calculations themselves (e.g. statistical uncertainty if )(E is calculated with a Monte-Carlo code) and from the uncertainties related to the conditions of the measurement that could potentially impact )(E . This component will be determined by combining the sensitivity coefficients of f
U 5� with regard to specific parameters pi (for example the characteristics of the Be reflector, the characteristics of the neutron filters, the position of the control mechanisms, etc..) and the uncertainties related to these parameters as follows:
� ���
����
�
i i
ii
fUf
U
fU
ppupSu
2
55
5 )(),()( ���
Finally, one must keep in mind that this is only the uncertainty related to the time-integrated flux in the U-235 samples and that a term accounting for its representativity with regard to the other samples should be added to this value when analyzing the results related to the other actinides. The closer the U235 samples from the other actinide samples, the smaller this additional term should be. Indeed, one possibility to effectively minimize it, would be to alternate an actinide sample with a U-235 sample, as shown on the figure below, so that the time-integrated flux in a particular sample can be obtained by averaging that of the two closest U-235 samples. Furthermore, the axial flux gradient should be as small as possible.
U5 Am1 U5 Am3 U5 Cm4 U5 Cm5 U5 Cm7 U5 Cm8 U5
Figure 3.1. Example of a possible configuration that maximizes the representativity of the measured time-integrated flux in
the U-235 samples with regard to that of the other actinides
14
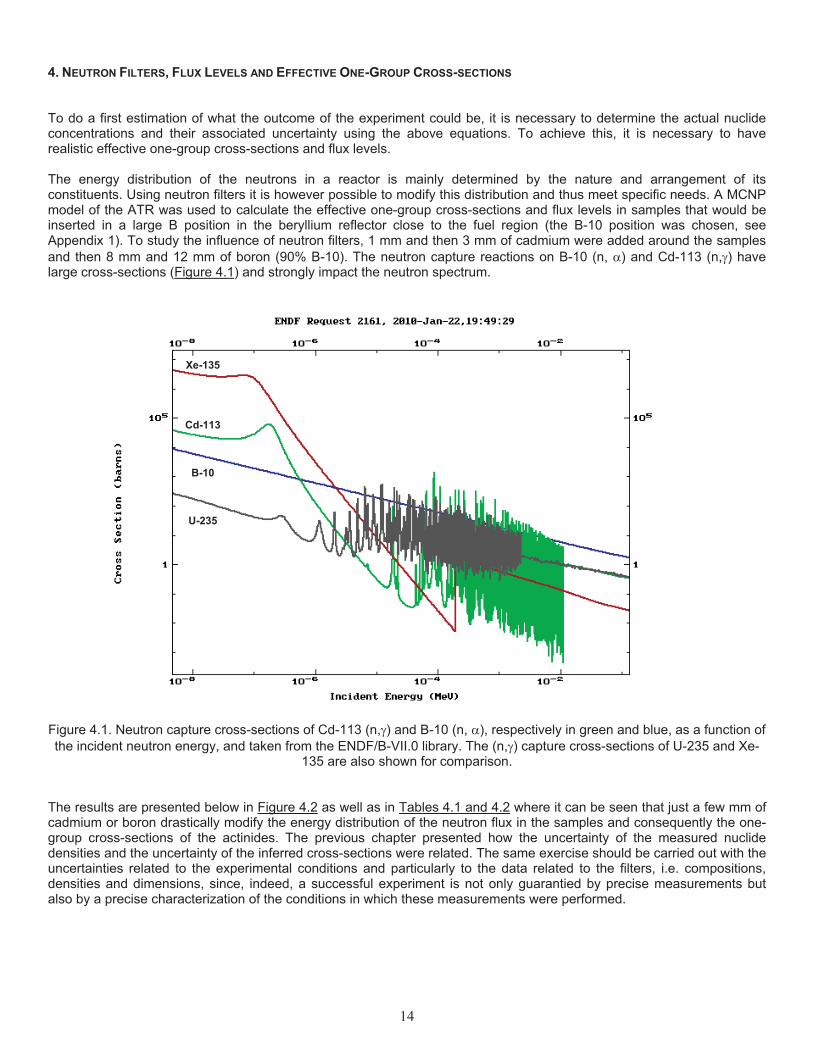
4. NEUTRON FILTERS, FLUX LEVELS AND EFFECTIVE ONE-GROUP CROSS-SECTIONS To do a first estimation of what the outcome of the experiment could be, it is necessary to determine the actual nuclide concentrations and their associated uncertainty using the above equations. To achieve this, it is necessary to have realistic effective one-group cross-sections and flux levels. The energy distribution of the neutrons in a reactor is mainly determined by the nature and arrangement of its constituents. Using neutron filters it is however possible to modify this distribution and thus meet specific needs. A MCNP model of the ATR was used to calculate the effective one-group cross-sections and flux levels in samples that would be inserted in a large B position in the beryllium reflector close to the fuel region (the B-10 position was chosen, see Appendix 1). To study the influence of neutron filters, 1 mm and then 3 mm of cadmium were added around the samples and then 8 mm and 12 mm of boron (90% B-10). The neutron capture reactions on B-10 (n, $) and Cd-113 (n,�) have large cross-sections (Figure 4.1) and strongly impact the neutron spectrum.
Figure 4.1. Neutron capture cross-sections of Cd-113 (n,�) and B-10 (n, $), respectively in green and blue, as a function of the incident neutron energy, and taken from the ENDF/B-VII.0 library. The (n,�) capture cross-sections of U-235 and Xe-
135 are also shown for comparison. The results are presented below in Figure 4.2 as well as in Tables 4.1 and 4.2 where it can be seen that just a few mm of cadmium or boron drastically modify the energy distribution of the neutron flux in the samples and consequently the one-group cross-sections of the actinides. The previous chapter presented how the uncertainty of the measured nuclide densities and the uncertainty of the inferred cross-sections were related. The same exercise should be carried out with the uncertainties related to the experimental conditions and particularly to the data related to the filters, i.e. compositions, densities and dimensions, since, indeed, a successful experiment is not only guarantied by precise measurements but also by a precise characterization of the conditions in which these measurements were performed.
U-235
B-10
Cd-113
Xe-135

15
Furthermore, Table 4.2, which presents the distribution of the capture reaction rates as a function of neutron energy, shows that even though the boron filter decreases the thermal flux by about a factor of 1000, the thermal reaction rates can still be important because the capture cross-sections are much larger in the thermal energy range than in the fast energy range. For instance, for Cf-250 and 251 approximately 90% of the capture reactions happen below 2 eV even with the boron filter. The same is true for the Pu isotopes for which the neutron captures below 2 eV still account for between 45% and 65% of the total captures. Decreasing the thermal flux level by another order of magnitude would require a few extra cm of boron (90% B10).
N.B.: The help provided by Antoine Petiot, summer intern from the École des Mines de Paris supervised by Joseph Nielsen from the Irradiation Testing Department, in running the MCNP calculations is gratefully acknowledged.
1.E-11
1.E-10
1.E-09
1.E-08
1.E-07
1.E-06
1.E-09 1.E-08 1.E-07 1.E-06 1.E-05 1.E-04 1.E-03 1.E-02 1.E-01 1.E+00 1.E+01 1.E+02Neutron energy (MeV)
Neu
tron
flux
(nor
mal
ized
per
sou
rce
part
icle
)
Reference flux in position B-10 without any neutron filter
� = 2.5 1014 n/cm2.s
Flux in position B-10 with 3 mm of Cd
� = 1.4 1014 n/cm2.s
Flux in position B-10 with 8 mm of Boron (90% B10)� = 5.8 1013 n/cm2.s
Flux in position B-10 with 12 mm of Boron (90% B10)
� = 5.1 1013 n/cm2.s
Flux in position B-10 with 1 mm of Cd
� = 1.5 1014 n/cm2.s
Figure 4.2. Neutron flux in the sample as a function of energy with and without filters. The flux levels are averaged over the height of the B-10 position and are normalized to a total core power of 110 MW.

16
Table 4.1. Effective fission and capture one-group cross-sections (expressed in barns � 10-24 cm2)
FISS CAPT FISS CAPT FISS CAPTU-234 0.331 48.1 0.312 31.1 0.654 0.519U-235 167 31.5 13.9 6.98 2.02 0.443U-236 0.219 12.1 0.319 16.6 0.257 0.410U-238 0.0322 9.60 0.0486 13.9 0.115 0.236NP237 0.211 69.9 0.316 30.3 0.699 1.09NP238 608 132 41.6 8.89 3.39 0.631PU236 75.1 16.7 45.9 12.4 2.53 0.206PU238 5.47 150 1.69 7.89 1.44 0.867PU239 271 123 15.8 10.3 2.43 0.600PU240 0.287 300 0.413 303 0.723 1.00PU241 340 122 29.8 9.92 2.94 0.609PU242 0.169 41.9 0.258 56.8 0.577 0.345AM241 1.48 241 0.552 53.7 0.695 1.67
AM242m 2201 447 85.6 13.2 8.85 1.38AM243 0.157 73.6 0.239 78.4 0.558 0.742CM242 0.96 10.0 0.198 7.57 0.420 0.201CM243 220 41.8 68.9 9.84 2.93 0.454CM244 0.704 24.5 0.658 32.4 0.835 0.536CM245 567 92.6 37.4 5.19 3.71 0.579CM246 0.357 4.00 0.490 5.61 0.620 0.349CM247 63.9 32.4 49.2 24.8 2.34 0.441CM248 0.49 8.49 0.729 12.3 0.683 0.182BK249 2.90 506 0.479 51.8 0.440 1.955CF249 514 150 79.2 19.2 3.49 0.839CF250 0.423 776 0.661 308 1.43 1.96CF251 1627 838 161 54.6 6.13 2.34CF252 12.8 7.21 6.19 2.48 1.14 0.209
ATR no Filter ATR Cd Filter (1 mm) ATR Boron Filter (8 mm)
Table 4.2. Distribution of the capture reaction rates as a function of energy (below 2 eV, between 2 eV and 1 keV and above 1 keV).
No Filter 1 mm Cd 8 mm Boron
capture 2ev 1kev 20Mev 2ev 1kev 20Mev 2ev 1kev 20MevU234 60% 40% 1% 2% 97% 2% 14% 10% 76%U235 87% 12% 1% 8% 86% 6% 16% 6% 78%U236 12% 85% 2% 0% 97% 2% 1% 9% 90%U238 8% 90% 2% 0% 98% 2% 1% 11% 88%NP237 83% 16% 1% 39% 57% 4% 13% 8% 80%NP238 98% 2% 0% 45% 52% 4% 52% 2% 45%PU236 54% 45% 1% 4% 95% 2% 11% 8% 81%PU238 97% 3% 0% 12% 80% 7% 43% 4% 53%PU239 96% 4% 0% 19% 77% 5% 47% 6% 47%PU240 98% 2% 0% 97% 2% 0% 65% 3% 33%PU241 95% 4% 0% 11% 86% 4% 48% 4% 48%PU242 14% 85% 1% 1% 98% 1% 4% 18% 78%AM241 94% 5% 0% 60% 37% 3% 32% 5% 64%AM242m 99% 1% 0% 41% 56% 3% 83% 2% 15%AM243 82% 17% 1% 74% 25% 1% 12% 10% 78%CM242 48% 50% 2% 1% 95% 4% 6% 14% 80%CM243 88% 11% 1% 19% 77% 4% 20% 5% 74%CM244 18% 81% 1% 0% 98% 2% 2% 11% 87%CM245 97% 2% 0% 23% 69% 8% 39% 3% 57%CM246 10% 84% 7% 0% 92% 8% 0% 7% 93%CM247 78% 21% 1% 55% 44% 2% 11% 7% 82%CM248 8% 90% 1% 0% 98% 2% 1% 16% 83%BK249 97% 2% 0% 61% 36% 2% 57% 4% 40%CF249 98% 2% 0% 77% 21% 2% 44% 2% 54%CF250 99% 1% 0% 96% 4% 0% 86% 2% 12%CF251 100% 0% 0% 89% 11% 0% 91% 1% 9%CF252 79% 19% 2% 4% 87% 9% 7% 5% 88%

17
5. ACTINIDES BUILD-UP CALCULATIONS IN THE PLUTONIUM SAMPLES 5.1. Determination of the atom densities after irradiation Several enriched isotopes are available at INL with masses ranging from a few milligrams to a few grams. The isotopic compositions of the different plutonium samples are presented in the table below. The relative uncertainty of these values is 0.5%. The americium and curium contamination of these plutonium samples can be kept extremely low (relative abundance less than 10-8) [7] and can thus be neglected as a first approximation. The characterization of the other enriched isotopes (U, Np, Am and Cm) is under way.
Table 5.1.1. Isotopic composition of the plutonium samples available at INL [7,8]
Enriched Isotope 238 239 240 241 242 244 Pu-238 99.198 0.363 0.414 0.003 0.023 0.0 Pu-239 0.0345 99.077 0.881 0.002 0.005 0.0 Pu-240 0.007 0.735 98.835 0.141 0.282 0.0 Pu-241 0.054 3.61 13.74 74.03 8.56 0.0 Pu-242 0.002 0.016 0.025 0.012 99.943 0.002 Pu-244 0.004 0.034 0.676 0.026 1.326 97.934
Tables 5.1.2 through 5.1.6 present the relative nuclide densities in the different Pu samples after irradiation with a boron filter, i.e. with a hard neutron spectrum. Tables 5.1.7 and 5.1.11 present the same thing but with a cadmium filter, i.e. with an epithermal neutron spectrum. The tables are presented so as to show the contributions of each isotope initially in the sample to the nuclide densities after irradiation. These atom densities are calculated using the analytical expressions derived in section 2.1 together with the cross-sections presented in Table 4.1. These tables show the importance of the level of impurity when inferring the neutron capture cross-sections. Indeed, since the inference is based on differences of nuclide densities (cf. section 2.1) between the initial samples and the irradiated ones, the smaller these differences the more precise the measurements of the nuclides densities have to be. Furthermore, since increasing the irradiation time increases the difference in nuclide densities, it can accommodate somehow less precise measurements. For example, in the case of the Pu-238 sample irradiated 50 days in the hard boron-filtered neutron spectrum (Table 5.1.2), the difference on the Pu-239 nuclide density is about 5.85% whereas the difference on the Pu-240 nuclide density is only 0.03%. Increasing the irradiation time to 200 days increases the difference in nuclide density by about a factor of 4. Finally, a point worth mentioning is that the initial amount of A-1, A-2….isotopes in a sample A, has a negligible contribution to the A+1, A+2…atom densities build-up compared to that of A. For example, the initial amount of Pu-238 and Pu-239 in the Pu-240 samples have a negligible contribution to the Pu-241 and Pu-242 atom densities build-up compared to that of Pu-240 (Tables 5.1.4 and 5.1.9). Consequently, the level of impurity of isotopes lighter than the main one do not matter very much for the inference of cross-sections and thus the heavier long-lived isotope of an element can be considered as being highly pure for our purpose because the inter-element contamination can be kept at a much lower level than the isotopic one. This category of sample comprises U-238, Np-237, Pu-242, Am-243 and Cm-248.

18
Table 5.1.2. Normalized nuclide densities in the Pu-238 sample after 50 and 200 days of irradiation with a flux level equal to 5.8 1013 n.cm-2.s-1 (boron filter = hard spectrum)
Pu8 Pu9 Pu0 Pu1 Pu2 Am3* Initial 9.920E-01 3.63E-03 4.14E-03 3.00E-05 2.30E-04 0.00E+00 50 days
Pu8 9.903E-01 2.15E-04 1.62E-08 1.35E-12 - -Pu9 3.63E-03 5.45E-07 6.83E-11 - -Pu0 4.14E-03 1.04E-06 7.92E-11 -Pu1 2.98E-05 4.56E-09 -Pu2 2.30E-04 1.99E-08
Total 9.903E-01 3.84E-03 4.14E-03 3.08E-05 2.30E-04 1.99E-08 Delta -1.64E-03 2.12E-04 -1.29E-06 8.13E-07 -4.84E-08 1.99E-08
Delta (%) -0.17% 5.85% -0.03% 2.71% -0.02% 200 days
Pu8 9.854E-01 8.58E-04 2.58E-07 8.59E-11 - -Pu9 3.62E-03 2.18E-06 1.08E-09 - -Pu0 4.13E-03 4.10E-06 1.26E-09 -Pu1 2.91E-05 1.80E-08 3.13E-12 Pu2 2.30E-04 7.93E-08
Total 9.854E-01 4.48E-03 4.14E-03 3.32E-05 2.30E-04 7.93E-08 Delta -6.56E-03 8.47E-04 -4.96E-06 3.21E-06 -1.93E-07 7.93E-08
Delta (%) -0.66% 23.32% -0.12% 10.71% -0.08%
* initial value not available but supposed to be negligibly small
Table 5.1.3. Normalized nuclide densities in the Pu-239 sample after 50 and 200 days of irradiation with a flux level equal to 5.8 1013 n.cm-2.s-1 (boron filter = hard spectrum)
Pu8 Pu9 Pu0 Pu1 Pu2 Am3* Initial 3.45E-04 9.91E-01 8.81E-03 2.00E-05 5.00E-05 0.00E+00 50 days
Pu8 3.44E-04 7.48E-08 5.62E-12 - - -Pu9 9.90E-01 1.49E-04 1.87E-08 - -Pu0 8.81E-03 2.21E-06 1.69E-10 -Pu1 1.99E-05 3.04E-09 -Pu2 5.00E-05 4.32E-09
Total 3.44E-04 9.90E-01 8.95E-03 2.21E-05 5.00E-05 1.43E-08 Delta -5.72E-07 -7.52E-04 1.45E-04 2.07E-06 -8.33E-09 4.31E-09
Delta (%) -0.17% -0.08% 1.64% 10.37% -0.02% 200 days
Pu8 3.43E-04 2.98E-07 8.97E-11 - - -Pu9 9.88E-01 5.94E-04 2.96E-07 6.04E-11 -Pu0 8.79E-03 8.72E-06 2.68E-09 -Pu1 1.94E-05 1.20E-08 2.09E-12 Pu2 5.00E-05 1.72E-08
Total 3.43E-04 9.88E-01 9.39E-03 2.84E-05 5.00E-05 2.72E-08 Delta -2.28E-06 -3.00E-03 5.78E-04 8.42E-06 -3.14E-08 1.72E-08
Delta (%) -0.66% -0.30% 6.56% 42.12% -0.06%
* initial value not available but supposed to be negligibly small

19
Table 5.1.4. Normalized nuclide densities in the Pu-240 sample after 50 and 200 days of irradiation with a flux level equal to 5.8 1013 n.cm-2.s-1 (boron filter = hard spectrum)
Pu8 Pu9 Pu0 Pu1 Pu2 Am3* Initial 7.00E-05 7.35E-03 9.88E-01 1.41E-03 2.82E-03 0.00E+00 50 days
Pu8 6.99E-05 1.52E-08 1.14E-12 - - -Pu9 7.34E-03 1.10E-06 1.38E-10 - -Pu0 9.88E-01 2.47E-04 1.89E-08 -Pu1 1.40E-03 2.14E-07 9.27E-12 Pu2 2.82E-03 2.43E-07
Total 6.99E-05 7.34E-03 9.88E-01 1.65E-03 2.82E-03 2.53E-07 Delta -1.16E-07 -5.56E-06 -4.40E-04 2.37E-04 -4.18E-07 2.43E-07
Delta (%) -0.17% -0.08% -0.04% 16.80% -0.01% 200 days
Pu8 6.95E-05 6.05E-08 1.82E-11 - - -Pu9 7.33E-03 4.41E-06 2.19E-09 - -Pu0 9.87E-01 9.78E-04 3.00E-07 3.46E-11 Pu1 1.37E-03 8.48E-07 1.47E-10 Pu2 2.82E-03 9.73E-07
Total 6.95E-05 7.33E-03 9.87E-01 2.35E-03 2.82E-03 9.83E-07 Delta -4.63E-07 -2.22E-05 -1.76E-03 9.36E-04 -1.45E-06 9.73E-07
Delta (%) -0.66% -0.30% -0.18% 66.41% -0.05%
* initial value not available but supposed to be negligibly small
Table 5.1.5. Normalized nuclide densities in the Pu-241 sample after 50 and 200 days of irradiation with a flux level equal to 5.8 1013 n.cm-2.s-1 (boron filter = hard spectrum)
Pu8 Pu9 Pu0 Pu1 Pu2 Am3* Initial 5.40E-04 3.61E-02 1.37E-01 7.403E-01 8.56E-02 0.00E+00 50 days
Pu8 5.39E-04 1.17E-07 8.80E-12 - - -Pu9 3.61E-02 5.42E-06 6.80E-10 - -Pu0 1.37E-01 3.44E-05 2.63E-09 -Pu1 7.348E-01 1.13E-04 4.87E-09 Pu2 8.56E-02 7.39E-06
Total 5.39E-04 3.61E-02 1.37E-01 7.348E-01 8.57E-02 7.39E-06 Delta -8.95E-07 -2.73E-05 -5.59E-05 -5.48E-03 9.28E-05 7.39E-06
Delta (%) -0.17% -0.08% -0.04% -0.74% 0.11% 200 days
Pu8 5.36E-04 4.67E-07 1.40E-10 - - -Pu9 3.60E-02 2.16E-05 1.08E-08 2.20E-12 -Pu0 1.37E-01 1.36E-04 4.17E-08 4.81E-12 Pu1 7.185E-01 4.45E-04 7.72E-08 Pu2 8.55E-02 2.95E-05
Total 5.36E-04 3.60E-02 1.37E-01 7.186E-01 8.60E-02 2.96E-05 Delta -3.57E-06 -1.09E-04 -2.24E-04 -2.17E-02 3.66E-04 2.96E-05
Delta (%) -0.66% -0.30% -0.16% -2.93% 0.43%
* initial value not available but supposed to be negligibly small

20
Table 5.1.6. Normalized nuclide densities in the Pu-242 sample after 50 and 200 days of irradiation with a flux level equal to 5.8 1013 n.cm-2.s-1 (boron filter = hard spectrum)
Pu8 Pu9 Pu0 Pu1 Pu2 Am3* Cm4* Initial 2.00E-05 1.60E-04 2.50E-04 1.20E-04 9.99E-01 0.00E+00 0.00E+00 50 days
Pu8 2.00E-05 4.34E-09 - - - - - Pu9 1.60E-04 2.40E-08 3.01E-12 - - - Pu0 2.50E-04 6.26E-08 4.78E-12 - - Pu1 1.19E-04 1.83E-08 - - Pu2 9.99E-01 8.63E-05 8.00E-09
Total 2.00E-05 1.60E-04 2.50E-04 1.19E-04 9.99E-01 8.63E-05 9.01E-09 Delta -3.32E-08 -1.17E-07 -8.76E-08 -8.32E-07 -2.31E-04 8.63E-05 8.01E-09
Delta (%) -0.17% -0.07% -0.04% -0.69% -0.02% 200 days
Pu8 1.99E-05 1.73E-08 5.20E-12 - - - - Pu9 1.60E-04 9.59E-08 4.78E-11 - - - Pu0 2.50E-04 2.47E-07 7.59E-11 - - Pu1 1.16E-04 7.22E-08 1.25E-11 - Pu2 9.99E-01 3.45E-04 1.27E-07
Total 1.99E-05 1.60E-04 2.50E-04 1.17E-04 9.99E-01 3.45E-04 1.28E-07 Delta -1.32E-07 -4.68E-07 -3.50E-07 -3.29E-06 -9.22E-04 3.45E-04 1.27E-07
Delta (%) -0.66% -0.29% -0.14% -2.74% -0.09%
* initial value not available but supposed to be negligibly small
Table 5.1.7. Normalized nuclide densities in the Pu-238 sample after 50 days of irradiation with a flux level equal to 1.5 1014 n.cm-2.s-1 (cadmium filter = epithermal spectrum)
Pu8 Pu9 Pu0 Pu1 Pu2 Am3* Cm4* Cm5* Initial 9.920E-01 3.63E-03 4.14E-03 3.00E-05 2.30E-04 0.00E+00 0.00E+00 0.00E+00 50 days
Pu8 9.848E-01 5.01E-03 1.57E-05 1.04E-06 1.68E-09 1.24E-11 - - Pu9 3.57E-03 2.18E-05 2.20E-06 4.76E-09 4.40E-11 - - Pu0 3.40E-03 7.27E-04 2.40E-06 2.97E-08 3.81E-10 1.61E-12 Pu1 2.90E-05 1.86E-07 3.41E-09 5.79E-11 - Pu2 2.22E-04 8.11E-06 2.07E-07 1.45E-09
Total 9.848E-01 8.58E-03 3.44E-03 7.59E-04 2.24E-04 8.14E-06 2.08E-07 1.46E-09 Delta -7.21E-03 4.95E-03 -7.03E-04 7.29E-04 -5.77E-06 8.14E-06 2.08E-07 1.46E-09
Delta (%) -0.7% 136.3% -17.0% 2430.3% -2.5%
* initial value not available but supposed to be negligibly small

21
Table 5.1.8. Normalized nuclide densities in the Pu-239 sample after 50 days of irradiation with a flux level equal to 1.5 1014 n.cm-2.s-1 (cadmium filter = epithermal spectrum)
Pu8 Pu9 Pu0 Pu1 Pu2 Am3* Cm4* Cm5* Initial 3.45E-04 9.91E-01 8.81E-03 2.00E-05 5.00E-05 0.00E+00 0.00E+00 0.00E+00 50 days
Pu8 3.42E-04 1.74E-06 5.47E-09 3.62E-10 - - - - Pu9 9.74E-01 5.95E-03 6.00E-04 1.30E-06 1.20E-08 1.23E-10 - Pu0 7.24E-03 1.55E-03 5.10E-06 6.31E-08 8.10E-10 3.43E-12 Pu1 1.94E-05 1.24E-07 2.27E-09 3.86E-11 - Pu2 4.82E-05 1.76E-06 4.50E-08 3.16E-10
Total 3.42E-04 9.74E-01 1.32E-02 2.17E-03 5.47E-05 1.84E-06 4.60E-08 3.20E-10 Delta -2.51E-06 -1.66E-02 4.38E-03 2.15E-03 4.70E-06 1.84E-06 4.60E-08 3.20E-10
Delta (%) -0.73% -1.68% 49.67% 10727% 9.41%
* initial value not available but supposed to be negligibly small
Table 5.1.9. Normalized nuclide densities in the Pu-240 sample after 50 days of irradiation with a flux level equal to 1.5 1014 n.cm-2.s-1 (cadmium filter = epithermal spectrum)
Pu8 Pu9 Pu0 Pu1 Pu2 Am3* Cm4* Cm5* Initial 7.00E-05 7.35E-03 9.88E-01 1.41E-03 2.82E-03 0.00E+00 0.00E+00 0.00E+00 50 days
Pu8 6.95E-05 3.53E-07 1.11E-09 7.35E-11 - - - - Pu9 7.23E-03 4.41E-05 4.45E-06 9.63E-09 8.90E-11 - - Pu0 8.12E-01 1.74E-01 5.72E-04 7.08E-06 9.09E-08 3.84E-10 Pu1 1.37E-03 8.75E-06 1.60E-07 2.72E-09 1.43E-11 Pu2 2.72E-03 9.94E-05 2.54E-06 1.78E-08
Total 6.95E-05 7.23E-03 8.12E-01 1.75E-01 3.30E-03 1.07E-04 2.63E-06 1.82E-08 Delta -5.08E-07 -1.23E-04 -1.77E-01 1.73E-01 4.78E-04 1.07E-04 2.63E-06 1.82E-08
Delta (%) -0.73% -1.67% -17.87% 12303% 16.95%
* initial value not available but supposed to be negligibly small
Table 5.1.10. Normalized nuclide densities in the Pu-241 sample after 50 days of irradiation with a flux level equal to 1.5 1014 n.cm-2.s-1 (cadmium filter = epithermal spectrum)
Pu8 Pu9 Pu0 Pu1 Pu2 Am3* Cm4* Cm5* Initial 5.40E-04 3.61E-02 1.37E-01 7.403E-01 8.56E-02 0.00E+00 0.00E+00 0.00E+00 50 days
Pu8 5.36E-04 2.73E-06 8.56E-09 5.67E-10 - - - - Pu9 3.55E-02 2.17E-04 2.18E-05 4.73E-08 4.37E-10 4.47E-12 - Pu0 1.13E-01 2.41E-02 7.95E-05 9.85E-07 1.26E-08 5.34E-11 Pu1 7.17E-01 4.59E-03 8.41E-05 1.43E-06 7.52E-09 Pu2 8.25E-02 3.02E-03 7.71E-05 5.41E-07
Total 5.36E-04 3.55E-02 1.13E-01 7.41E-01 8.72E-02 3.10E-03 7.85E-05 5.49E-07 Delta -3.92E-06 -6.02E-04 -2.43E-02 5.85E-04 1.57E-03 3.10E-03 7.85E-05 5.49E-07
Delta (%) -0.7% -1.7% -17.7% 0.1% 1.8%
* initial value not available but supposed to be negligibly small
22
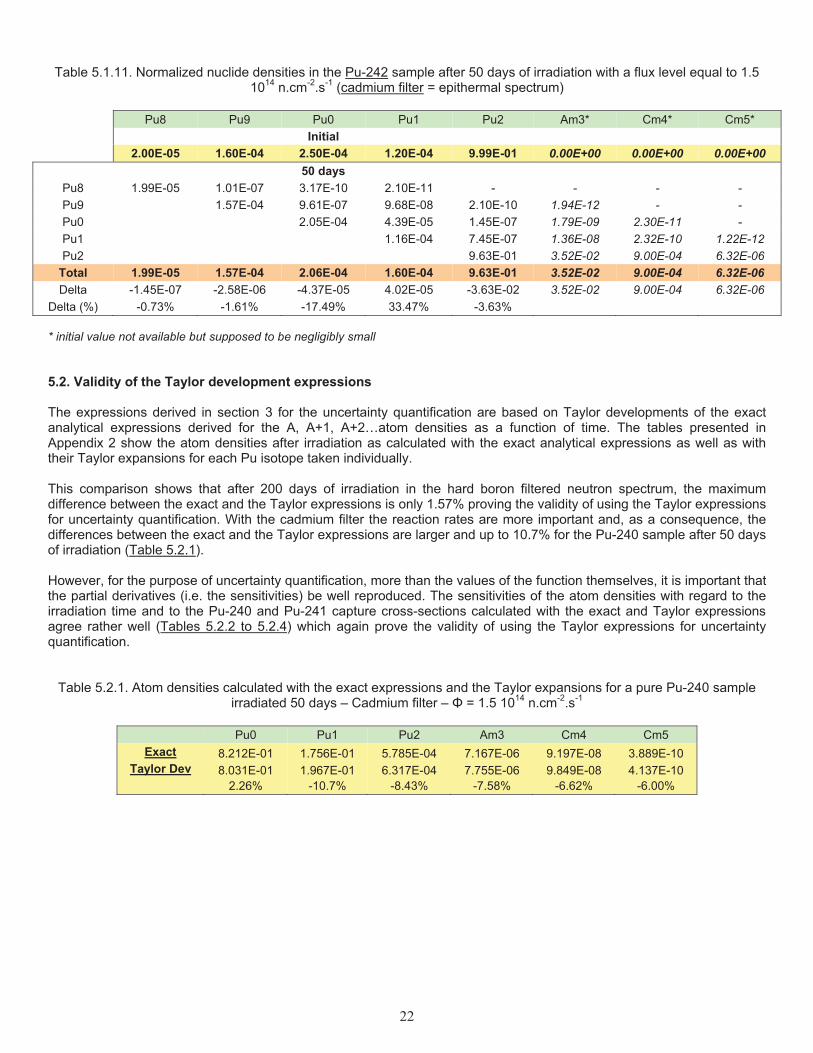
Table 5.1.11. Normalized nuclide densities in the Pu-242 sample after 50 days of irradiation with a flux level equal to 1.5 1014 n.cm-2.s-1 (cadmium filter = epithermal spectrum)
Pu8 Pu9 Pu0 Pu1 Pu2 Am3* Cm4* Cm5* Initial 2.00E-05 1.60E-04 2.50E-04 1.20E-04 9.99E-01 0.00E+00 0.00E+00 0.00E+00 50 days
Pu8 1.99E-05 1.01E-07 3.17E-10 2.10E-11 - - - - Pu9 1.57E-04 9.61E-07 9.68E-08 2.10E-10 1.94E-12 - - Pu0 2.05E-04 4.39E-05 1.45E-07 1.79E-09 2.30E-11 - Pu1 1.16E-04 7.45E-07 1.36E-08 2.32E-10 1.22E-12 Pu2 9.63E-01 3.52E-02 9.00E-04 6.32E-06
Total 1.99E-05 1.57E-04 2.06E-04 1.60E-04 9.63E-01 3.52E-02 9.00E-04 6.32E-06 Delta -1.45E-07 -2.58E-06 -4.37E-05 4.02E-05 -3.63E-02 3.52E-02 9.00E-04 6.32E-06
Delta (%) -0.73% -1.61% -17.49% 33.47% -3.63%
* initial value not available but supposed to be negligibly small 5.2. Validity of the Taylor development expressions The expressions derived in section 3 for the uncertainty quantification are based on Taylor developments of the exact analytical expressions derived for the A, A+1, A+2…atom densities as a function of time. The tables presented in Appendix 2 show the atom densities after irradiation as calculated with the exact analytical expressions as well as with their Taylor expansions for each Pu isotope taken individually. This comparison shows that after 200 days of irradiation in the hard boron filtered neutron spectrum, the maximum difference between the exact and the Taylor expressions is only 1.57% proving the validity of using the Taylor expressions for uncertainty quantification. With the cadmium filter the reaction rates are more important and, as a consequence, the differences between the exact and the Taylor expressions are larger and up to 10.7% for the Pu-240 sample after 50 days of irradiation (Table 5.2.1). However, for the purpose of uncertainty quantification, more than the values of the function themselves, it is important that the partial derivatives (i.e. the sensitivities) be well reproduced. The sensitivities of the atom densities with regard to the irradiation time and to the Pu-240 and Pu-241 capture cross-sections calculated with the exact and Taylor expressions agree rather well (Tables 5.2.2 to 5.2.4) which again prove the validity of using the Taylor expressions for uncertainty quantification.
Table 5.2.1. Atom densities calculated with the exact expressions and the Taylor expansions for a pure Pu-240 sample irradiated 50 days – Cadmium filter – � = 1.5 1014 n.cm-2.s-1
Pu0 Pu1 Pu2 Am3 Cm4 Cm5
Exact 8.212E-01 1.756E-01 5.785E-04 7.167E-06 9.197E-08 3.889E-10 Taylor Dev 8.031E-01 1.967E-01 6.317E-04 7.755E-06 9.849E-08 4.137E-10
2.26% -10.7% -8.43% -7.58% -6.62% -6.00%

23
Table 5.2.2. Sensitivities of the atom densities with regard to the irradiation time calculated with the exact and Taylor expressions for a pure Pu-240 sample – Cadmium filter – � = 1.5 1014 n.cm-2.s-1
Pu0 Pu1 Pu2 Am3 Cm4 Cm5 Exact
TRef = 50 days 8.212E-01 1.756E-01 5.785E-04 7.167E-06 9.197E-08 3.889E-10 TRef + 10% 8.052E-01 1.910E-01 6.939E-04 9.465E-06 1.337E-07 6.225E-10
-2.0% 8.8% 19.9% 32.1% 45.4% 60.1% Taylor
TRef = 50 days 8.031E-01 1.967E-01 6.317E-04 7.755E-06 9.849E-08 4.137E-10 TRef + 10% 7.834E-01 2.163E-01 7.644E-04 1.032E-05 1.442E-07 6.663E-10
-2.5% 10.0% 21.0% 33.1% 46.4% 61.1%
Table 5.2.3. Sensitivities of the atom densities with regard to the Pu-240 capture cross-section calculated with the exact and Taylor expressions for a pure Pu-240 sample irradiated 50 days – Cadmium filter – � = 1.5 1014 n.cm-2.s-1
Pu0 Pu1 Pu2 Am3 Cm4 Cm5 Exact
Ref 8.212E-01 1.756E-01 5.785E-04 7.167E-06 9.197E-08 3.889E-10 cPu0� + 10% 8.052E-01 1.913E-01 6.323E-04 7.846E-06 1.008E-07 4.265E-10
-1.9% 9.0% 9.3% 9.5% 9.6% 9.7% Taylor
Ref 8.031E-01 1.967E-01 6.317E-04 7.755E-06 9.849E-08 4.137E-10 cPu0� + 10% 7.834E-01 2.163E-01 6.949E-04 8.531E-06 1.083E-07 4.551E-10
-2.5% 10.0% 10.0% 10.0% 10.0% 10.0%
Table 5.2.4. Sensitivities of the atom densities with regard to the Pu-241 capture cross-section calculated with the exact
and Taylor expressions for a pure Pu-240 sample irradiated 50 days – Cadmium filter – � = 1.5 1014 n.cm-2.s-1
Pu0 Pu1 Pu2 Am3 Cm4 Cm5 Exact
Ref 8.212E-01 1.756E-01 5.785E-04 7.167E-06 9.197E-08 3.889E-10 cPu1� + 10% 8.212E-01 1.755E-01 6.362E-04 7.883E-06 1.012E-07 4.278E-10
0.00% -0.03% 9.98% 9.98% 9.99% 10.00% Taylor
Ref 8.031E-01 1.967E-01 6.317E-04 7.755E-06 9.849E-08 4.137E-10 cPu1� + 10% 8.031E-01 1.967E-01 6.949E-04 8.531E-06 1.083E-07 4.551E-10
0.00% 0.00% 10.00% 10.00% 10.00% 10.00%

24
6. INVERSE PROBLEMS: DETERMINATION OF THE MEASUREMENT UNCERTAINTIES NECESSARY TO INFER THE CAPTURE CROSS-SECTIONS WITH GIVEN UNCERTAINTIES 6.1 Estimation of current uncertainties on actinide capture cross-sections – The AFCI 1.2 covariance matrix Requirements for covariance data for advanced technologies of nuclear energy applications are steadily growing. The evaluation of covariance data is, however, difficult and normally requires more effort than the cross-section evaluation itself [9]. To provide the covariance data for nuclear data users is to give a qualitative assessment of the data library. Major customers of the covariance data are the reactor core calculations (estimation of uncertainty in the keff, criticality safety study, adjustment of nuclear data libraries) and radiation shielding designs. The AFCI 1.2 covariance matrix which was released in August 2009 [10] is the result of the collaborative efforts of evaluators and reactor physicists from different US National Laboratories and is the latest such attempt to assess the quality of neutron cross-section data. The overall impact of these uncertainties on important parameters of advanced reactors and fuel cycles is presented in Ref [11]. Table 6.1.1 below reproduces the diagonal values of the AFCI 1.2 covariance matrix (i.e. the variances) for a few actinide neutron capture cross-sections and in the energy group structure used for fast reactor calculations. Among other things, it shows that, above a few keV, the uncertainty associated to most actinide capture cross-section is larger than 5%. Consequently, and as a first guess, the target uncertainty of the inferred capture cross-sections used in the next section to work out the inverse problems is set equal to 5%.
Table 6.1.1 Diagonal values of the AFCI 1.2 covariance matrix (i.e. the variances) for a few actinide neutron capture cross-sections
E (eV) U235 U236 U238 NP237 PU238 PU239 PU240 PU241 PU242 AM241 AM243 CM244 CM245 CM246
1.96E+07 60.6% 50.0% 22.3% 50.0% 100.0% 36.3% 55.0% 55.0% 100.0% 80.0% 60.0% 100.0% 80.0% 80.0%1.00E+07 62.7% 42.9% 21.2% 42.9% 100.0% 39.9% 40.8% 55.0% 100.0% 58.7% 45.8% 100.0% 51.6% 45.4%6.07E+06 46.4% 40.0% 19.9% 40.0% 100.0% 42.0% 35.0% 55.1% 100.0% 50.0% 40.0% 100.0% 40.0% 41.9%3.68E+06 26.5% 27.5% 5.9% 33.8% 100.0% 34.2% 35.0% 83.1% 100.0% 37.5% 27.5% 100.0% 33.8% 38.6%2.23E+06 19.1% 20.0% 6.1% 30.0% 100.0% 26.6% 35.0% 100.0% 100.0% 30.0% 20.0% 100.0% 30.0% 31.3%1.35E+06 16.2% 8.0% 3.1% 30.0% 50.0% 20.5% 100.0% 80.0% 100.0% 30.0% 15.0% 100.0% 25.0% 19.2%8.21E+05 16.8% 8.0% 1.7% 42.4% 43.8% 15.5% 56.5% 48.9% 68.9% 23.8% 11.9% 68.9% 21.9% 17.8%4.98E+05 19.6% 8.0% 1.5% 49.9% 39.9% 12.1% 29.9% 30.0% 50.0% 20.0% 10.0% 50.0% 20.0% 17.3%3.02E+05 20.0% 6.1% 1.5% 23.7% 21.2% 11.3% 17.5% 30.0% 43.8% 13.8% 10.0% 50.0% 20.0% 17.4%1.83E+05 20.0% 5.0% 1.7% 8.0% 10.0% 9.6% 10.0% 30.0% 40.0% 10.0% 10.0% 50.0% 20.0% 19.1%1.11E+05 20.0% 5.0% 1.7% 7.4% 10.0% 10.8% 10.0% 23.8% 36.9% 8.8% 10.0% 50.0% 16.9% 24.2%6.74E+04 20.0% 5.0% 1.7% 7.0% 10.0% 11.4% 10.0% 20.0% 35.0% 8.0% 10.0% 50.1% 15.0% 33.7%4.09E+04 20.0% 5.0% 1.6% 6.4% 13.1% 8.9% 10.0% 13.8% 35.0% 8.0% 8.8% 81.2% 11.9% 50.3%2.48E+04 20.0% 5.0% 3.2% 6.0% 15.0% 7.2% 10.0% 10.0% 35.0% 8.0% 8.0% 100.0% 10.0% 50.3%1.50E+04 20.0% 4.4% 3.9% 6.0% 18.1% 7.8% 6.9% 10.0% 38.1% 8.0% 8.0% 100.0% 10.0% 49.3%9.12E+03 20.0% 4.0% 3.3% 6.0% 20.0% 16.5% 5.0% 10.0% 40.0% 8.0% 8.0% 99.9% 10.0% 44.4%5.53E+03 20.0% 4.0% 2.8% 5.5% 17.5% 16.5% 5.0% 10.0% 29.9% 8.0% 8.0% 74.7% 10.0% 11.7%3.35E+03 18.3% 4.0% 2.9% 5.2% 15.9% 10.7% 5.0% 10.0% 23.7% 8.0% 8.0% 59.3% 10.0% 5.9%2.03E+03 13.1% 4.0% 2.9% 5.0% 15.0% 1.5% 5.0% 10.0% 20.0% 8.0% 8.0% 49.8% 10.0% 5.9%1.23E+03 5.2% 4.0% 2.8% 5.0% 12.5% 1.5% 5.0% 10.0% 15.9% 8.0% 6.0% 29.6% 10.0% 5.9%7.49E+02 2.5% 4.0% 2.7% 5.0% 10.9% 1.6% 5.0% 10.0% 13.5% 8.0% 4.7% 17.4% 10.0% 5.9%4.54E+02 1.6% 4.0% 3.4% 5.0% 10.0% 1.6% 5.0% 10.0% 12.0% 8.0% 4.0% 10.0% 10.0% 5.9%3.04E+02 1.3% 4.0% 2.9% 5.0% 10.0% 1.6% 4.7% 10.0% 12.0% 8.0% 4.0% 10.0% 10.0% 5.9%1.49E+02 1.1% 4.0% 4.1% 5.0% 10.0% 1.9% 4.3% 10.0% 12.0% 8.0% 4.0% 10.0% 10.0% 5.9%9.17E+01 1.3% 4.0% 5.1% 5.0% 10.0% 5.5% 4.2% 10.0% 12.0% 8.0% 4.0% 10.0% 10.0% 5.9%6.79E+01 1.1% 4.0% 3.6% 5.0% 10.0% 3.2% 4.1% 10.0% 12.0% 8.0% 4.0% 10.0% 10.0% 5.9%4.02E+01 1.1% 4.0% 3.6% 5.0% 10.0% 2.1% 4.0% 10.0% 12.0% 8.0% 4.0% 10.0% 10.0% 5.9%2.26E+01 1.0% 4.0% 3.6% 5.0% 10.0% 1.3% 4.0% 10.0% 12.0% 8.0% 4.0% 10.0% 10.0% 5.9%1.37E+01 1.2% 4.0% 2.7% 5.0% 10.0% 0.7% 4.0% 10.0% 12.0% 8.0% 4.0% 10.0% 10.0% 5.9%8.32E+00 1.8% 4.0% 1.0% 5.0% 10.0% 1.1% 4.0% 10.0% 12.0% 8.0% 4.0% 10.0% 10.0% 5.9%4.00E+00 2.2% 4.0% 2.8% 5.0% 10.0% 1.5% 4.0% 10.0% 12.0% 8.0% 4.0% 10.0% 10.0% 5.9%5.40E-01 1.6% 2.0% 2.0% 8.0% 4.0% 1.3% 1.0% 2.0% 4.0% 5.0% 3.0% 10.0% 5.0% 11.5%1.00E-01 1.7% 2.0% 1.8% 8.0% 4.0% 1.5% 1.0% 2.0% 4.0% 5.0% 3.0% 10.0% 5.0% 12.6%

25
6.2 Methodology and results As mentioned earlier, the expressions derived in section 3 can be used to determine the experimental uncertainties that would allow the inferred cross-sections to be determined with a given target uncertainty. Indeed, once a sample has been designed and a neutron filter chosen (i.e. a neutron spectrum), the uncertainty of the inferred neutron capture cross-sections will basically depend on four parameters: the uncertainty of the measured actinide atom densities (both in the initial sample and in the irradiated one), the initial sample isotopic composition, the time-integrated neutron flux and the uncertainty of the measured time-integrated neutron flux. For instance, let’s consider the case of the capture cross-section of isotope A. If the relative uncertainty of the measured
A+1 atom densities in the initial as well as in the irradiated samples are the same, i.e. if mA
mA
RRu
)]0([))]0(([
1
1
�
� = mA
mA
TRTRu)]([
))](([
1
1
�
� =
m
m
RRu][
)]([ , the expression givingcA
cAu
�� )( (see section 3) can be rewritten as:
22
11
21
21
2
][)]([
)]0([)]([)]0([)]([
][)]([~)(
���
����
���
�
�
�
��
�
�
�
���
����
�
��
��
m
m
mAmA
mAmA
m
mcA
cA
TTu
RTRRTR
RRuu
��
��
Now, if the relative uncertainty of the inferred capture cross-section,cA
cAu
�� )( , is assigned a target value then the necessary
relative uncertainty of the measured actinide atom densities,m
m
RRu][
)]([ , can be determined as a function of the relative
uncertainty of the measured time-integrated flux m
m
TTu][
)]([�� as:
��
�
�
��
�
�
�
���
����
���
�
����
�
��
��
mAmA
mAmA
m
mcA
cA
m
m
RTRRTR
TTuu
RRu
)]0([)]([)]0([)]([
][)]([)(
~][
)]([
11
21
21
22
��
��
Similarly, if the relative uncertainty of the measured A+1 and A+2 atom densities are the same in the initial as well as in the irradiated samples, then it can be determined as a function of the relative uncertainty of the measured time-integrated
flux m
m
TTu][
)]([�� so that it allows inferring the A+1 capture cross-section with a given uncertainty as:
��
�
�
��
�
�
�
���
�
�
��
�
�
�
���
����
���
�
����
�
��
��
��
��
�
mAmA
mAmA
mAmA
mAmA
m
mcA
cA
m
m
RTRRTR
RTRRTR
TTuu
RRu
)]0([)]([)]0([)]([
)]0([)]([)]0([)]([
][)]([)(
~][
)]([
22
22
22
11
21
21
22
1
��
��
26
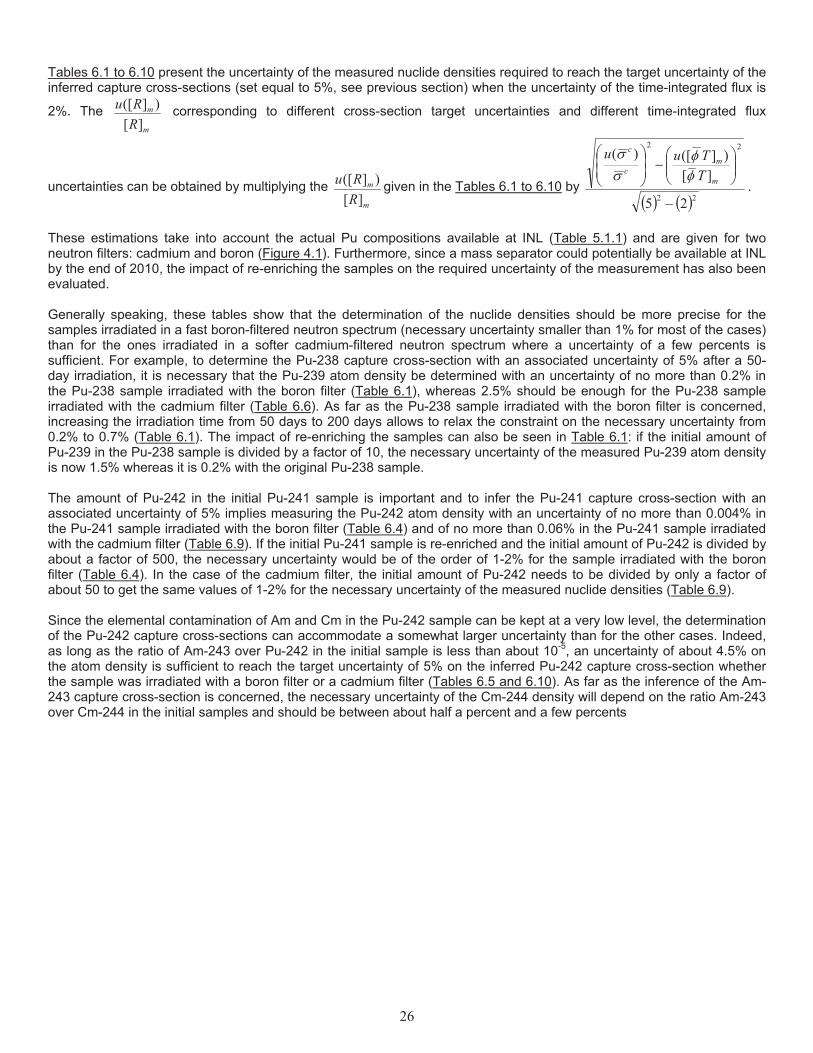
Tables 6.1 to 6.10 present the uncertainty of the measured nuclide densities required to reach the target uncertainty of the inferred capture cross-sections (set equal to 5%, see previous section) when the uncertainty of the time-integrated flux is
2%. The m
m
RRu][
)]([ corresponding to different cross-section target uncertainties and different time-integrated flux
uncertainties can be obtained by multiplying the m
m
RRu][
)]([ given in the Tables 6.1 to 6.10 by� � � �22
22
25
][)]([)(
���
����
��
��
����
�
m
mc
c
TTuu
��
��
.
These estimations take into account the actual Pu compositions available at INL (Table 5.1.1) and are given for two neutron filters: cadmium and boron (Figure 4.1). Furthermore, since a mass separator could potentially be available at INL by the end of 2010, the impact of re-enriching the samples on the required uncertainty of the measurement has also been evaluated. Generally speaking, these tables show that the determination of the nuclide densities should be more precise for the samples irradiated in a fast boron-filtered neutron spectrum (necessary uncertainty smaller than 1% for most of the cases) than for the ones irradiated in a softer cadmium-filtered neutron spectrum where a uncertainty of a few percents is sufficient. For example, to determine the Pu-238 capture cross-section with an associated uncertainty of 5% after a 50-day irradiation, it is necessary that the Pu-239 atom density be determined with an uncertainty of no more than 0.2% in the Pu-238 sample irradiated with the boron filter (Table 6.1), whereas 2.5% should be enough for the Pu-238 sample irradiated with the cadmium filter (Table 6.6). As far as the Pu-238 sample irradiated with the boron filter is concerned, increasing the irradiation time from 50 days to 200 days allows to relax the constraint on the necessary uncertainty from 0.2% to 0.7% (Table 6.1). The impact of re-enriching the samples can also be seen in Table 6.1: if the initial amount of Pu-239 in the Pu-238 sample is divided by a factor of 10, the necessary uncertainty of the measured Pu-239 atom density is now 1.5% whereas it is 0.2% with the original Pu-238 sample. The amount of Pu-242 in the initial Pu-241 sample is important and to infer the Pu-241 capture cross-section with an associated uncertainty of 5% implies measuring the Pu-242 atom density with an uncertainty of no more than 0.004% in the Pu-241 sample irradiated with the boron filter (Table 6.4) and of no more than 0.06% in the Pu-241 sample irradiated with the cadmium filter (Table 6.9). If the initial Pu-241 sample is re-enriched and the initial amount of Pu-242 is divided by about a factor of 500, the necessary uncertainty would be of the order of 1-2% for the sample irradiated with the boron filter (Table 6.4). In the case of the cadmium filter, the initial amount of Pu-242 needs to be divided by only a factor of about 50 to get the same values of 1-2% for the necessary uncertainty of the measured nuclide densities (Table 6.9). Since the elemental contamination of Am and Cm in the Pu-242 sample can be kept at a very low level, the determination of the Pu-242 capture cross-sections can accommodate a somewhat larger uncertainty than for the other cases. Indeed, as long as the ratio of Am-243 over Pu-242 in the initial sample is less than about 10-5, an uncertainty of about 4.5% on the atom density is sufficient to reach the target uncertainty of 5% on the inferred Pu-242 capture cross-section whether the sample was irradiated with a boron filter or a cadmium filter (Tables 6.5 and 6.10). As far as the inference of the Am-243 capture cross-section is concerned, the necessary uncertainty of the Cm-244 density will depend on the ratio Am-243 over Cm-244 in the initial samples and should be between about half a percent and a few percents

27
Table 6.1. Pu-238 sample irradiated with a boron filter (flux level = 5.8 1013 n.cm-2.s-1, neutron spectrum shown on Figure 4.1). Uncertainty of time-integrated neutron flux = 2%.
Target uncertainty Irradiation days Initial composition of the sample Necessary uncertainty of nuclide density
cPu
cPuu
238
238 )(
�� = 5%
50 as available at INL (see Table 5.1.1)
mPu
mPu
RRu
][)]([
239
239
= 0.2%
200 mPu
mPu
RRu
][)]([
239
239
= 0.7%
50 Re-enriched sample: Pu-239 initial % 10 mPu
mPu
RRu
][)]([
239
239
= 1.5%
50 Re-enriched sample: Pu-239 initial % 100 mPu
mPu
RRu
][)]([
239
239
= 3.9%
cPu
cPuu
239
239 )(
�� =5%
200 as available at INL (see Table 5.1.1) mPu
mPu
RRu
][)]([
239
239
=mPu
mPu
RRu
][)]([
240
240
= 0.004%
50 Re-enriched sample:
Pu-239 initial % 10 Pu-240 initial % 10,000 mPu
mPu
RRu
][)]([
239
239
=mPu
mPu
RRu
][)]([
240
240
= 0.5%
Table 6.2. Pu-239 sample irradiated with a boron filter (flux level = 5.8 1013 n.cm-2.s-1, neutron spectrum shown on Figure 4.1). Uncertainty of time-integrated neutron flux = 2%.
Target uncertainty Irradiation days Initial composition of the sample Necessary uncertainty of nuclide density
cPu
cPuu
239
239 )(
�� = 5%
50 as available at INL (see Table 5.1.1)
mPu
mPu
RRu
][)]([
240
240
= 0.05%
200 mPu
mPu
RRu
][)]([
240
240
= 0.2%
50 Re-enriched sample:
Pu-240 initial % 10 mPu
mPu
RRu
][)]([
240
240
= 0.5%
200 mPu
mPu
RRu
][)]([
240
240
= 1.6%
50 Re-enriched sample: Pu-240 initial % 100
mPu
mPu
RRu
][)]([
240
240
= 2.7%
200 mPu
mPu
RRu
][)]([
240
240
= 4.0%
cPu
cPuu
240
240)(
�� = 5%
50 as available at INL (see Table 5.1.1)
mPu
mPu
RRu
][)]([
240
240
=mPu
mPu
RRu
][)]([
241
241
= 0.3%
200 mPu
mPu
RRu
][)]([
240
240
=mPu
mPu
RRu
][)]([
241
241
= 1.1%
50
Re-enriched sample: Pu-240 initial % 10 Pu-241 initial % 10 mPu
mPu
RRu
][)]([
240
240
=mPu
mPu
RRu
][)]([
241
241
= 0.4%
Re-enriched sample: Pu-240 initial % 10 Pu-241 initial % 100 mPu
mPu
RRu
][)]([
240
240
=mPu
mPu
RRu
][)]([
241
241
= 2.2%

28
Table 6.3. Pu-240 sample irradiated with a boron filter (flux level = 5.8 1013 n.cm-2.s-1, neutron spectrum shown on Figure 4.1). Uncertainty of time-integrated neutron flux = 2%.
Target uncertainty Irradiation days Initial composition of the sample Necessary uncertainty of nuclide density
cPu
cPuu
240
240 )(
�� = 5%
50 as available at INL (see Table 5.1.1)
mPu
mPu
RRu
][)]([
241
241
= 0.5%
200 mPu
mPu
RRu
][)]([
241
241
= 1.6%
50
Re-enriched sample: Pu-241 initial % 5 mPu
mPu
RRu
][)]([
241
241
= 1.9%
Re-enriched sample: Pu-241 initial % 10 mPu
mPu
RRu
][)]([
241
241
= 2.8%
Re-enriched sample: Pu-241 initial % 100 mPu
mPu
RRu
][)]([
241
241
= 4.4%
cPu
cPuu
241
241)(
�� = 5%
50 as available at INL (see Table 5.1.1)
mPu
mPu
RRu
][)]([
241
241
=mPu
mPu
RRu
][)]([
242
242
= 0.0005%
200 mPu
mPu
RRu
][)]([
241
241
=mPu
mPu
RRu
][)]([
242
242
= 0.002%
50
Re-enriched sample: Pu-241 initial % 5 Pu-242 initial % 5 mPu
mPu
RRu
][)]([
241
241
=mPu
mPu
RRu
][)]([
242
242
= 0.0004%
Re-enriched sample: Pu-241 initial % 5
Pu-242 initial % 1000 mPu
mPu
RRu
][)]([
241
241
=mPu
mPu
RRu
][)]([
242
242
= 0.07%
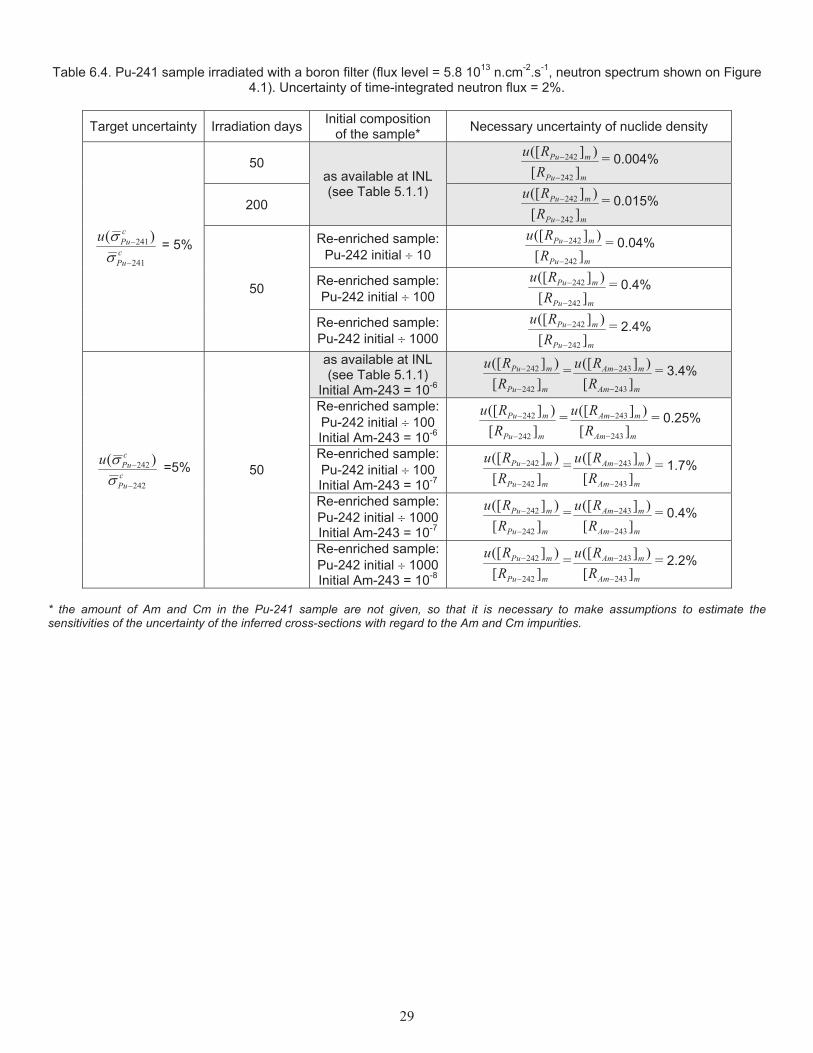
29
Table 6.4. Pu-241 sample irradiated with a boron filter (flux level = 5.8 1013 n.cm-2.s-1, neutron spectrum shown on Figure 4.1). Uncertainty of time-integrated neutron flux = 2%.
Target uncertainty Irradiation days Initial composition of the sample* Necessary uncertainty of nuclide density
cPu
cPuu
241
241)(
�� = 5%
50 as available at INL (see Table 5.1.1)
mPu
mPu
RRu
][)]([
242
242
= 0.004%
200 mPu
mPu
RRu
][)]([
242
242
= 0.015%
50
Re-enriched sample: Pu-242 initial % 10 mPu
mPu
RRu
][)]([
242
242
= 0.04%
Re-enriched sample: Pu-242 initial % 100 mPu
mPu
RRu
][)]([
242
242
= 0.4%
Re-enriched sample: Pu-242 initial % 1000 mPu
mPu
RRu
][)]([
242
242
= 2.4%
cPu
cPuu
242
242 )(
�� =5% 50
as available at INL (see Table 5.1.1)
Initial Am-243 = 10-6 mPu
mPu
RRu
][)]([
242
242
=mAm
mAm
RRu
][)]([
243
243
= 3.4%
Re-enriched sample: Pu-242 initial % 100 Initial Am-243 = 10-6 mPu
mPu
RRu
][)]([
242
242
=mAm
mAm
RRu
][)]([
243
243
= 0.25%
Re-enriched sample: Pu-242 initial % 100 Initial Am-243 = 10-7 mPu
mPu
RRu
][)]([
242
242
=mAm
mAm
RRu
][)]([
243
243
= 1.7%
Re-enriched sample: Pu-242 initial % 1000 Initial Am-243 = 10-7 mPu
mPu
RRu
][)]([
242
242
=mAm
mAm
RRu
][)]([
243
243
= 0.4%
Re-enriched sample: Pu-242 initial % 1000 Initial Am-243 = 10-8 mPu
mPu
RRu
][)]([
242
242
=mAm
mAm
RRu
][)]([
243
243
= 2.2%
* the amount of Am and Cm in the Pu-241 sample are not given, so that it is necessary to make assumptions to estimate the sensitivities of the uncertainty of the inferred cross-sections with regard to the Am and Cm impurities.

30
Table 6.5. Pu-242 sample irradiated with a boron filter (flux level = 5.8 1013 n.cm-2.s-1, neutron spectrum shown on Figure 4.1). Uncertainty of time-integrated neutron flux = 2%.
Target uncertainty Irradiation days Initial composition of the sample* Necessary uncertainty of nuclide density
cPu
cPuu
242
242 )(
�� = 5% 50
as available at INL (see Table 5.1.1)
Initial Am-243 = 10-4 mAm
mAm
RRu
][)]([
243
243
= 1.9%
as available at INL (see Table 5.1.1)
Initial Am-243 = 10-6 mAm
mAm
RRu
][)]([
243
243
= 4.5%
cAm
cAmu
243
243 )(
�� = 5% 50
as available at INL (see Table 5.1.1)
Initial Am-243 = 10-4
Initial Cm-244 = 10-5 mAm
mAm
RRu
][)]([
243
243
=mCm
mCm
RRu
][)]([
244
244
= 0.009%
as available at INL (see Table 5.1.1)
Initial Am-243 = 10-4
Initial Cm-244 = 10-7 mAm
mAm
RRu
][)]([
243
243
=mCm
mCm
RRu
][)]([
244
244
= 0.75%
as available at INL (see Table 5.1.1)
Initial Am-243 = 10-4
Initial Cm-244 = 10-9 mAm
mAm
RRu
][)]([
243
243
=mCm
mCm
RRu
][)]([
244
244
= 3.6%
as available at INL (see Table 5.1.1)
Initial Am-243 = 10-6
Initial Cm-244 = 10-7 mAm
mAm
RRu
][)]([
243
243
=mCm
mCm
RRu
][)]([
244
244
= 0.25%
as available at INL (see Table 5.1.1)
Initial Am-243 = 10-6
Initial Cm-244 = 10-9 mAm
mAm
RRu
][)]([
243
243
=mCm
mCm
RRu
][)]([
244
244
= 3.1%
* the amount of Am and Cm in the Pu-242 sample are not given, so that it is necessary to make assumptions to estimate the sensitivities of the uncertainty of the inferred cross-sections with regard to the Am and Cm impurities.
Table 6.6. Pu-238 sample irradiated with a cadmium filter (flux level = 1.5 1014 n.cm-2.s-1, neutron spectrum shown on Figure 4.1). Uncertainty of time-integrated neutron flux = 2%.
Target uncertainty Irradiation days Initial composition of the sample Necessary uncertainty of nuclide density
cPu
cPuu
238
238 )(
�� = 5%
50 as available at INL(see Table 5.1.1)
mPu
mPu
RRu
][)]([
239
239
= 2.5%
cPu
cPuu
239
239 )(
�� = 5%
mPu
mPu
RRu
][)]([
239
239
=mPu
mPu
RRu
][)]([
240
240
= 0.6%

31
Table 6.7. Pu-239 sample irradiated with a cadmium filter (flux level = 1.5 1014 n.cm-2.s-1, neutron spectrum shown on Figure 4.1). Uncertainty of time-integrated neutron flux = 2%.
Target uncertainty Irradiation days Initial composition of the sample Necessary uncertainty of nuclide density
cPu
cPuu
239
239 )(
�� = 5%
50 as available at INL(see Table 5.1.1)
mPu
mPu
RRu
][)]([
240
240
= 1.3%
cPu
cPuu
240
240 )(
�� = 5%
mPu
mPu
RRu
][)]([
240
240
=mPu
mPu
RRu
][)]([
241
241
= 3.7%
Table 6.8. Pu-240 sample irradiated with a cadmium filter (flux level = 1.5 1014 n.cm-2.s-1, neutron spectrum shown on Figure 4.1). Uncertainty of time-integrated neutron flux = 2%.
Target uncertainty Irradiation days Initial composition of the sample Necessary uncertainty of nuclide density
cPu
cPuu
240
240 )(
�� = 5%
50 as available at INL(see Table 5.1.1)
mPu
mPu
RRu
][)]([
241
241
= 4.5%
cPu
cPuu
241
241)(
�� = 5%
mPu
mPu
RRu
][)]([
241
241
=mPu
mPu
RRu
][)]([
242
242
= 0.5%
Table 6.9. Pu-241 sample irradiated with a cadmium filter (flux level = 1.5 1014 n.cm-2.s-1, neutron spectrum shown on Figure 4.1). Uncertainty of time-integrated neutron flux = 2%.
Target uncertainty Irradiation days Initial composition of the sample Necessary uncertainty of nuclide density
cPu
cPuu
241
241)(
�� = 5%
50
as available at INL (see Table 5.1.1) mPu
mPu
RRu
][)]([
242
242
= 0.06%
Re-enriched sample: Pu-242 initial % 10 mPu
mPu
RRu
][)]([
242
242
= 1.3%
Re-enriched sample: Pu-242 initial % 100 mPu
mPu
RRu
][)]([
242
242
= 3.8%
cPu
cPuu
242
242 )(
�� = 5% as available at INL
(see Table 5.1.1) mPu
mPu
RRu
][)]([
242
242
=mAm
mAm
RRu
][)]([
243
243
= 3.7%*
* the uncertainty is independent of the initial concentration of Am-243 in the Pu-241 sample as long as it is smaller than about 10-4.

32
Table 6.10. Pu-242 sample irradiated with a cadmium filter (flux level = 1.5 1014 n.cm-2.s-1, neutron spectrum shown on Figure 4.1). Uncertainty of time-integrated neutron flux = 2%.
Target uncertainty Irradiation days Initial composition of the sample Necessary uncertainty of nuclide density
cPu
cPuu
242
242 )(
�� = 5%
50 as available at INL(see Table 5.1.1)
mAm
mAm
RRu
][)]([
243
243
= 4.6%*
cAm
cAmu
243
243 )(
�� = 5%
mAm
mAm
RRu
][)]([
243
243
=mCm
mCm
RRu
][)]([
244
244
= 3.3%*
* the uncertainty is independent of the initial concentrations of Am-243 or Cm-244 in the Pu-241 sample as long as they are smaller than about 10-4. 7. THE CASE OF HIGHLY PURE SAMPLES As mentioned in section 5, the level of impurity of isotopes lighter than the main one do not matter very much for the inference of cross-sections and thus the heavier long-lived isotope of an element can be considered as being highly pure for our purpose because the inter-element contamination can be kept at a much lower level than the isotopic one. This category of samples comprises U-238, Np-237, Pu-242, Am-243 and Cm-248. Tables 7.1 to 7.5 present the relative atom densities after irradiation of these samples calculated using the analytical expressions derived in section 2.1. The initial samples are considered 100% pure.
Table 7.1a Normalized nuclide densities in a pure U-238 sample after 50 days of irradiation with a flux level equal to 1.5 1014 n.cm-2.s-1 (cadmium filter = epithermal spectrum).
U8 Np9 Pu9 Pu0 Pu1 Pu2 Am1 Am2m Am3 Cm2
50 days 9.91E-01 6.06E-04 8.30E-03 2.45E-05 1.53E-06 2.33E-09 2.39E-09 1.69E-12 1.63E-11 1.15E-11
Table 7.1b Normalized nuclide densities in a pure U-238 sample after 50 and 200 days of irradiation with a flux level equal
to 5.8 1013 n.cm-2.s-1 (boron filter = hard spectrum).
U8 Np9 Pu9 Pu0 Pu1 Pu2 50 days 1.00E+00 4.02E-06 5.52E-05 3.89E-09 3.06E-13 -
200 days 1.00E+00 4.02E-06 2.33E-04 6.87E-08 2.25E-11 3.38E-15
Table 7.2a. Normalized nuclide densities in a pure Np237 sample after 50 days of irradiation with a flux level equal to 1.5
1014 n.cm-2.s-1 (cadmium filter = epithermal spectrum).
Np7 Np8 Pu8 Pu9 Pu0 Pu1 Pu2 Am1 50 days 9.80E-01 1.18E-03 1.82E-02 4.38E-05 8.84E-08 4.15E-09 5.09E-12 5.22E-12
Table 7.2b. Normalized nuclide densities in a pure Np237 sample after 50 and 200 days of irradiation with a flux level equal to 5.8 1013 n.cm-2.s-1 (boron filter = hard spectrum).
Np7 Np8 Pu8 Pu9 Pu0 Pu1
50 days 1.00E+00 1.67E-05 2.57E-04 2.63E-08 1.25E-12 - 200 days 9.98E-01 1.67E-05 1.08E-03 4.60E-07 9.09E-11 2.24E-14

33
Table 7.3a. Normalized nuclide densities in a pure Pu-242 sample after 50 days of irradiation with a flux level equal to 1.5 1014 n.cm-2.s-1 (cadmium filter = epithermal spectrum).
Pu2 Am3 Cm4 Cm5 Cm6 Cm7 Cm8
50 days 9.64E-01 3.52E-02 9.00E-04 6.32E-06 5.34E-09 3.87E-12 1.04E-14
Table 7.3b. Normalized nuclide densities in a pure Pu-242 sample after 50 and 200 days of irradiation with a flux level
equal to 5.8 1013 n.cm-2.s-1 (boron filter = hard spectrum).
Pu2 Am3 Cm4 Cm5 Cm6 Cm7 50 days 1.00E+00 8.63E-05 8.01E-09 3.59E-13 - -
200 days 9.99E-01 3.45E-04 1.27E-07 2.28E-11 3.31E-15 -
Table 7.4a. Normalized nuclide densities in a pure Am-243 sample after 50 days of irradiation with a flux level equal to 1.5
1014 n.cm-2.s-1 (cadmium filter = epithermal spectrum).
Am3 Cm4 Cm5 Cm6 Cm7 Cm8 50 days 9.64E-01 3.52E-02 9.00E-04 6.32E-06 5.34E-09 3.87E-12
Table 7.4b. Normalized nuclide densities in a pure Am-243 sample after 50 and 200 days of irradiation with a flux level equal to 5.8 1013 n.cm-2.s-1 (boron filter = hard spectrum).
Am3 Cm4 Cm5 Cm6 Cm7 Cm8
50 days 1.00E+00 1.85E-04 1.25E-08 6.03E-13 - - 200 days 9.99E-01 7.35E-04 1.98E-07 3.84E-11 3.36E-15 -
Table 7.5a. Normalized nuclide densities in a pure Cm-248 sample after 50 days of irradiation with a flux level equal to 1.5 1014 n.cm-2.s-1 (cadmium filter = epithermal spectrum).
Cm8 Bk9 Cf9 Cf0 Cf1 Cf2
50 days 9.92E-01 7.39E-03 4.02E-04 1.20E-04 7.95E-06 7.13E-08
Table 7.5b. Normalized nuclide densities in a pure Cm-248 sample after 50 and 200 days of irradiation with a flux level
equal to 5.8 1013 n.cm-2.s-1 (boron filter = hard spectrum).
Cm8 Bk9 Cf9 Cf0 Cf1 Cf2 50 days 1.00E+00 4.31E-05 2.38E-06 1.09E-08 1.79E-12 -
200 days 9.99E-01 1.48E-04 3.42E-05 1.63E-07 1.09E-10 6.29E-14 As long as the initial level of A+1, A+2…impurity is negligible, i.e. as long as )()0( 11 TRR AA �� �� , )()0( 22 TRR AA �� �� , etc… the uncertainties associated to the inferred cross-sections are expressed as:
� 22
1
1
][)]([
)]([))](([~)(
���
����
����
�
����
�
�
�
m
m
mA
mAcA
cA
TTu
TRTRuu
��
��
� 22
1
1
2
2
2
1
1
][)]([
)]([))](([
)]([))](([~)(
���
����
����
�
����
����
�
����
�
�
�
�
�
�
�
m
m
mA
mA
mA
mAcA
cA
TTu
TRTRu
TRTRuu
��
��

34
� 22
2
2
2
3
3
2
2
][)]([
)]([))](([
)]([))](([~)(
���
����
����
�
����
����
�
����
�
�
�
�
�
�
�
m
m
mA
mA
mA
mAcA
cA
TTu
TRTRu
TRTRuu
��
��
� 22
3
3
2
4
4
3
3
][)]([
)]([))](([
)]([))](([~)(
���
����
����
�
����
����
�
����
�
�
�
�
�
�
�
m
m
mA
mA
mA
mAcA
cA
TTu
TRTRu
TRTRuu
��
�� ………
An interesting consequence of these expressions is that in the case of samples with negligible A+1, A+2…initial contaminations the uncertainties associated with the inferred cross-sections are neither actinide-specific, nor spectrum-dependant, nor time-dependant. As long as the atom densities are above the detection limit of the apparatus used to measure them, and as long as the uncertainties of the measured densities do not depend on the densities themselves, then the uncertainties of the A+1 capture cross-sections will be the same whatever the sample or the irradiation time or the neutron filter used. The same will apply to the other capture cross-sections. Finally, if the relative uncertainty of the measured atom density does not depend on the mass number of the isotopes
considered, i.e. if mA
mA
TRTRu)]([
))](([
1
1
�
� = mA
mA
TRTRu)]([
))](([
2
2
�
� =…=mnA
mnA
TRTRu)]([
))](([
�
� �m
m
RRu][
)]([ then it comes:
22
2
2
1
1
][)]([
][)]([2~)(...)()(
���
����
����
�
����
�
�
�
�
�
�
�
m
m
m
mcnA
cnA
cA
cA
cA
cA
TTu
RRuuuu
��
��
��
��
Hence, if the uncertainty of the measured atom densities is, let’s say 2%, and the uncertainty of the time-integrated flux is 2% as well, the uncertainty of the capture cross-section of A should be around 2.8% and that on the cross-sections of A+1, A+2…A+n should be of the order of 3.5%. With these very pure samples, the high sensitivity of AMS is an important asset. For instance, with a Cm-248 sample, atom densities up to Cf-252 could be measured and thus the capture cross-sections of isotopes from Cm-248 to Cf-252 could be inferred. These data would be extremely useful since the capture cross-sections of Bk-249, Cf-249, Cf-250 are based essentially on models. Indeed there is only one experimental data at 0.025 eV for these isotopes.

35
8. CONCLUSIONS Thanks to the impetus given by senior reactor physicists Massimo Salvatores and Giuseppe Palmiotti, an integral reactor physics experiment devoted to infer higher actinide (Am, Cm, Bk, Cf) neutron cross-sections will take place in the US. This report presents the principle of the planned experiment as well as a first exercise aiming at quantifying the uncertainties related to the inferred quantities. It has been funded in part by the DOE Office of Science in the framework of the Recovery Act and has been given the name MANTRA for Measurement of Actinides Neutron TRAnsmutation. The principle is to irradiate different pure actinide samples in the Advanced Test Reactor at INL, and, after a given time, determine the amount of the different transmutation products. The precise characterization of the nuclide densities before
and after neutron irradiation allows to infer energy-integrated neutron cross-sections, i.e. ��
0
)()( dEEE �� ( )(E� is the
neutron flux “seen” by the sample), since the relation between the two are the well-known neutron-induced transmutation equations. This approach has been used in the past and the principal novelty of this experiment is that the atom densities of the different transmutation products will be determined with the Accelerator Mass Spectroscopy (AMS) facility located at ANL. While AMS facilities traditionally have been limited to the assay of low-to-medium atomic mass materials, i.e., A < 100, there has been recent progress in extending AMS to heavier isotopes – even to A > 200. The detection limit of AMS being orders of magnitude lower than that of standard mass spectroscopy techniques, more transmutation products could be measured and, potentially, more cross-sections could be inferred from the irradiation of a single sample. Furthermore, measurements will be carried out at the INL using more standard methods in order to have another set of totally uncorrelated information.
The energy distribution of the neutrons in a reactor is mainly determined by the nature and arrangement of its constituents. Using neutron filters it is however possible to modify this distribution and thus meet specific needs. A MCNP model of the ATR was used to calculate the effective one-group cross-sections and flux levels in the samples. To study the influence of neutron filters, first cadmium was added around the samples and then boron (90% B10). The uncertainty quantification analysis carried out shows that, once a sample has been designed and a neutron filter chosen (i.e. a neutron spectrum), the uncertainty of the inferred neutron capture cross-sections will basically depend on four parameters: the uncertainty of the measured nuclide densities (both in the initial sample and in the irradiated one), the initial sample isotopic composition, the time-integrated neutron flux and the uncertainty of the measured time-integrated neutron flux. Generally speaking, this analysis shows that the determination of the nuclide densities should be more precise for the samples irradiated in a fast boron-filtered neutron spectrum (necessary uncertainty smaller than 1% for most of the cases) than for the ones irradiated in a softer cadmium-filtered neutron spectrum where an uncertainty of a few percents is sufficient. For example, to determine the Pu-238 capture cross-section with an associated uncertainty of 5% after a 50-day irradiation, it is necessary that the Pu-239 atom density be determined with an uncertainty of no more than 0.2% in the Pu-238 sample irradiated with the boron filter, whereas 2.5% should be enough for the Pu-238 sample irradiated with the cadmium filter.

36
9. REFERENCES [1] ASTM International E 321 – 96 (Reapproved 2005), “Standard Test Method for Atom Percent Fission in Uranium and Plutonium Fuel (Neodymium-148 Method)” [2] M. Paul, D. Berkovits, I. Ahmad, F. Borasi, J. Caggiano, C.N. Davids, J.P. Greene, B. Harss, A. Heinz, W. Henning, C.L. Jiang, R.C. Pardo, K.E. Rehm, R. Rejoub, D. Seweryniak, A. Sonzogni, J. Uusitalo and R. Vondrasek, “AMS of Heavy Elements with an ECR Ion Source and the ATLAS Linear Accelerator”, Nuclear Instruments and Methods in Physics Research B 172 (2000) 688-692. [3] S. M. Whitney, S. Biegalski, B. Buchholz, “Analyzing Nuclear Fuel Cycles from Isotopic Ratios of Waste Products Applicable to Measurement by Accelerator Mass Spectrometry”, Nuclear Science and Engineering, 157, 200–209 (2007) [4] C. Tuniz, J. R. Bird, D. Fink, G. F. Herzog, “Accelerator Mass Spectroscopy – Ultrasensitive Analysis for Global Science”, CRC Press 1998. [5] ISO, Guide to the Expression of Uncertainty in Measurement, International Organization for Standardization, Geneva, Switzerland, 1993. Several supplements have been published; see Bich, W., Cox, M. C., and Harris, P. M., “Evolution of the Guide to the Expression of Uncertainty in Measurement,” Metrologia 43, S161, 2006. [6] Taylor, B. N., and Kuyatt, C. E., Guidelines for Evaluating and Expressing the Uncertainty of NIST Measurement Results, NIST Technical Note 1297, National Institute of Standards and Technology, Gaithersburg, MD, 1994; www.physics.nist.gov/cuu/Uncertainty/bibliography.html. [7] Personal Communication, C. McGrath (INL-MFC) [8] J. D. Baker, C. A. McGrath, T. S. Hill, R. Reifarth, F. Tovesson, “Actinide targets for neutron cross section measurements”, Journal of Radioanalytical and Nuclear Chemistry, Vol. 276, No.2 (2008) 555–560 [9] “Covariance Matrix Evaluation and Processing in the Resolved/Unresolved Resonnance Regions”, a report by the Working Party on International Evaluation Co-operation of the NEA Nuclear Science Committee, NEA No. 6198 (2006); www.nea.fr/html/science/wpec/volume20/volume20.pdf [10] C.M. Mattoon, “The AFCI 1.2 Covariance Library”, Annual Meeting of the Cross Section Evaluation Working Group (Nov. 2009); www.nndc.bnl.gov/proceedings/2009csewgusndp/Thursday/csewg/Mattoon_AFCI_1.2_CovLib.pdf [11] G. Aliberti, W.S. Yang, R.D. McKnight, “Uncertainty Analysis with the AFCI1.2 Covariance Matrix”, Annual Meeting of the Cross Section Evaluation Working Group (Nov. 2009); www.nndc.bnl.gov/proceedings/2009csewgusndp/Thursday/csewg/csewg.afci1.2.uncertainties.pdf

37
Appendix 1: Description of the ATR
The ATR is located at the ATR Complex on the INL site and has been operating continuously since 1967. The primary mission of this versatile facility was initially to serve the U.S. Navy in the development and refinement of nuclear propulsion systems, however, in recent years the ATR has been used for a wider variety of government- and privately-sponsored research. Even though the ATR now also serves a range of other research and isotope production customers, it currently operates at approximately 60% of its experiment loading capacity. DOE’s designation of the ATR as a NSUF enables DOE to facilitate research that would not have been feasible for many researchers and allows for fuller utilization of the ATR as a government asset. The ATR design exploits a unique serpentine core configuration that offers a large number of test positions. The primary operating characteristics are listed in the table below.
ATR General Characteristics.
The ATR has large test volumes in high-flux areas. Designed to permit simulation of long neutron radiation exposures in a short period of time, the maximum thermal power rating is 250 MWth with a maximum unperturbed thermal neutron flux of 1.0 x 10¹⁵ n/cm2–s. Since most contemporary experimental objectives generally do not require the limits of its operational capability, the ATR typically operates at much lower power levels. Occasionally, some lobes of the reactor are operated at higher powers that generate higher neutron flux. The ATR is cooled by pressurized (2.5 MPa [360 psig]) water that enters the reactor vessel bottom at an average temperature of 52°C (125°F), flows up outside cylindrical tanks that support and contain the core, passes through concentric thermal shields into the open upper part of the vessel, then flows down through the core to a flow distribution tank below the core. When the reactor is operating at full power, the primary coolant exits the vessel at a temperature of 71°C (160°F). The unique design of ATR control devices (the control drums) permits large power variations among its nine flux traps using a combination of control cylinders (drums) and neck shim rods. The beryllium control cylinders contain hafnium plates that can be rotated toward and away from the core, and hafnium shim rods, which withdraw vertically, can be individually inserted or withdrawn for minor power adjustments. Within bounds, the power level in each corner lobe of the reactor can be controlled independently to allow for different power and flux levels in the four corner lobes during the same operating cycle.

38

39
Appendix 2: Comparison Exact vs. Taylor expansion
Atom densities calculated with the exact expressions and the Taylor expansions for a pure Pu-238 sample irradiated 200 days – Boron filter – � = 5.8 1013 n.cm-2.s-1
Pu8 Pu9 Pu0 Pu1 Pu2
Exact 9.934E-01 8.646E-04 2.601E-07 8.658E-11 1.325E-14 Taylor Dev 9.934E-01 8.687E-04 2.611E-07 8.748E-11 1.336E-14
0.002% -0.48% -0.38% -1.03% -0.84%
Atom densities calculated with the exact expressions and the Taylor expansions for a pure Pu-239 sample irradiated 200
days – Boron filter – � = 5.8 1013 n.cm-2.s-1
Pu9 Pu0 Pu1 Pu2 Am3
Exact 9.970E-01 5.996E-04 2.986E-07 6.096E-11 5.271E-15 Taylor Dev 9.970E-01 6.010E-04 3.021E-07 6.150E-11 5.310E-15
0.000% -0.24% -1.15% -0.89% -0.74%
Atom densities calculated with the exact expressions and the Taylor expansions for a pure Pu-240 sample irradiated 200
days – Boron filter – � = 5.8 1013 n.cm-2.s-1
Pu0 Pu1 Pu2 Am3 Cm4
Exact 9.982E-01 9.895E-04 3.037E-07 3.504E-11 6.496E-15 Taylor Dev 9.982E-01 1.005E-03 3.070E-07 3.534E-11 6.570E-15
0.000% -1.57% -1.08% -0.84% -1.12%
Atom densities calculated with the exact expressions and the Taylor expansions for a pure Pu-241 sample irradiated 200
days – Boron filter – � = 5.8 1013 n.cm-2.s-1
Pu1 Pu2 Am3 Cm4 Cm5
Exact 9.705E-01 6.014E-04 1.043E-07 2.579E-11 3.469E-15 Taylor Dev 9.701E-01 6.108E-04 1.055E-07 2.614E-11 3.510E-15
0.046% -1.53% -1.06% -1.35% -1.17%
Atom densities calculated with the exact expressions and the Taylor expansions for a pure Pu-242 sample irradiated 200
days – Boron filter – � = 5.8 1013 n.cm-2.s-1
Pu2 Am3 Cm4 Cm5 Cm6
Exact 9.991E-01 3.450E-04 1.274E-07 2.282E-11 3.314E-15 Taylor Dev 9.991E-01 3.454E-04 1.284E-07 2.299E-11 3.337E-15
0.000% -0.11% -0.82% -0.72% -0.71%
Atom densities calculated with the exact expressions and the Taylor expansions for a pure Pu-238 sample irradiated 50 days – Cadmium filter – � = 1.5 1014 n.cm-2.s-1
Pu8 Pu9 Pu0 Pu1 Pu2 Am3
Exact 9.927E-01 5.049E-03 1.586E-05 1.050E-06 1.695E-09 1.250E-11 Taylor Dev 9.927E-01 5.110E-03 1.705E-05 1.118E-06 1.796E-09 1.323E-11
0.003% -1.20% -7.02% -6.08% -5.60% -5.50%
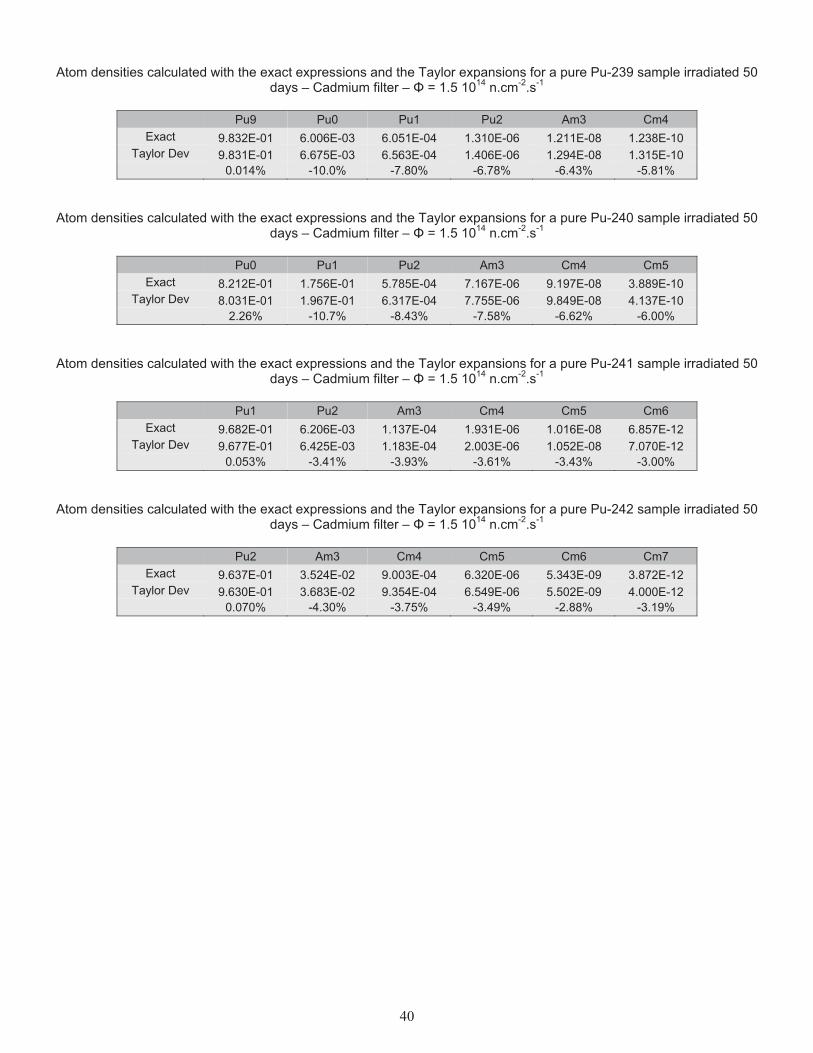
40
Atom densities calculated with the exact expressions and the Taylor expansions for a pure Pu-239 sample irradiated 50 days – Cadmium filter – � = 1.5 1014 n.cm-2.s-1
Pu9 Pu0 Pu1 Pu2 Am3 Cm4
Exact 9.832E-01 6.006E-03 6.051E-04 1.310E-06 1.211E-08 1.238E-10 Taylor Dev 9.831E-01 6.675E-03 6.563E-04 1.406E-06 1.294E-08 1.315E-10
0.014% -10.0% -7.80% -6.78% -6.43% -5.81%
Atom densities calculated with the exact expressions and the Taylor expansions for a pure Pu-240 sample irradiated 50
days – Cadmium filter – � = 1.5 1014 n.cm-2.s-1
Pu0 Pu1 Pu2 Am3 Cm4 Cm5
Exact 8.212E-01 1.756E-01 5.785E-04 7.167E-06 9.197E-08 3.889E-10 Taylor Dev 8.031E-01 1.967E-01 6.317E-04 7.755E-06 9.849E-08 4.137E-10
2.26% -10.7% -8.43% -7.58% -6.62% -6.00%
Atom densities calculated with the exact expressions and the Taylor expansions for a pure Pu-241 sample irradiated 50
days – Cadmium filter – � = 1.5 1014 n.cm-2.s-1
Pu1 Pu2 Am3 Cm4 Cm5 Cm6
Exact 9.682E-01 6.206E-03 1.137E-04 1.931E-06 1.016E-08 6.857E-12 Taylor Dev 9.677E-01 6.425E-03 1.183E-04 2.003E-06 1.052E-08 7.070E-12
0.053% -3.41% -3.93% -3.61% -3.43% -3.00%
Atom densities calculated with the exact expressions and the Taylor expansions for a pure Pu-242 sample irradiated 50 days – Cadmium filter – � = 1.5 1014 n.cm-2.s-1
Pu2 Am3 Cm4 Cm5 Cm6 Cm7
Exact 9.637E-01 3.524E-02 9.003E-04 6.320E-06 5.343E-09 3.872E-12 Taylor Dev 9.630E-01 3.683E-02 9.354E-04 6.549E-06 5.502E-09 4.000E-12
0.070% -4.30% -3.75% -3.49% -2.88% -3.19%