Embed Size (px)
Citation preview
Principal component analysis
Principal component analysis
Strategy for solving problems
Sample problem
Steps in principal component analysis
Principal components factor analysis
Obtaining a factor solution through principal components analysis is an iterative process that usually requires repeating the SPSS factor analysis procedure a number of times to reach a satisfactory solution.
We begin by identifying a group of variables whose variance we believe can be represented more parsimoniously by a smaller set of factors, or components. The end result of the principal components analysis will tell us which variables can be represented by which components, and which variables should be retained as individual variables because the factor solution does not adequately represent their information.
Strategy for solving problems - 1
A principal component factor analysis requires: The variables included must be metric level or
dichotomous (dummy-coded) nominal level The sample size must be greater than 50 (preferably
100) The ratio of cases to variables must be 5 to 1 or larger The correlation matrix for the variables must contain 2 or
more correlations of 0.30 or greater Variables with measures of sampling adequacy less than
0.50 must be removed The overall measure of sampling adequacy is 0.50 or
higher The Bartlett test of sphericity is statistically significant.
The first phase of a principal component analysis is devoted to verifying that we meet these requirements. If we do not meet these requirements, factor analysis is not appropriate.

Strategy for solving problems - 2
The second phase of a principal component factor analysis focuses on deriving a factor model, or pattern of relationships between variables and components, that satisfies the following requirements: The derived components explain 50% or more of the
variance in each of the variables, i.e. have a communality greater than 0.50
None of the variables have loadings, or correlations, of 0.40 or higher for more than one component, i.e. do not have complex structure
None of the components has only one variable in it
To meet these requirements, we remove problematic variables from the analysis and repeat the principal component analysis procedure in SPSS.

Strategy for solving problems - 3
If, at the conclusion of this process, we can substitute the components for the variables in further analyses if: the components have more than one variable loading
on them, the components explain at least 50% of the variance
in each of the included variables, and components that collectively explain more than 60%
of the variance in the set of included variables.
Variables that were removed in the analysis should be included individually in further analyses.
Substituting components for variables
Substitution of components for individual variables is accomplished by : using only the highest loading variable in
place of the other variables loading on the component,
or by combining the variables loading on each component to create a new variable.
Notes - 1
When evaluating measures of sampling adequacy, communalities, or factor loadings, we ignore the sign of the numeric value and base our decision on the size or magnitude of the value.
The sign of the number indicates the direction of the relationship (direct or inverse).
A loading of -0.732 is just as strong as a loading of 0.732. The minus sign indicates an inverse or negative relationship; the absence of a sign is meant to imply a plus sign indicating a direct or positive relationship.
Notes - 2
If there are two or more components in the component matrix, the pattern of loadings is based on the SPSS Rotated Component Matrix. If there is only one component in the solution, the Rotated Component Matrix is not computed, and the pattern of loadings is based on the Component Matrix.
It is possible that the analysis will break down and we will have too few variables in the analysis to support the use of principal component analysis.
Question 1
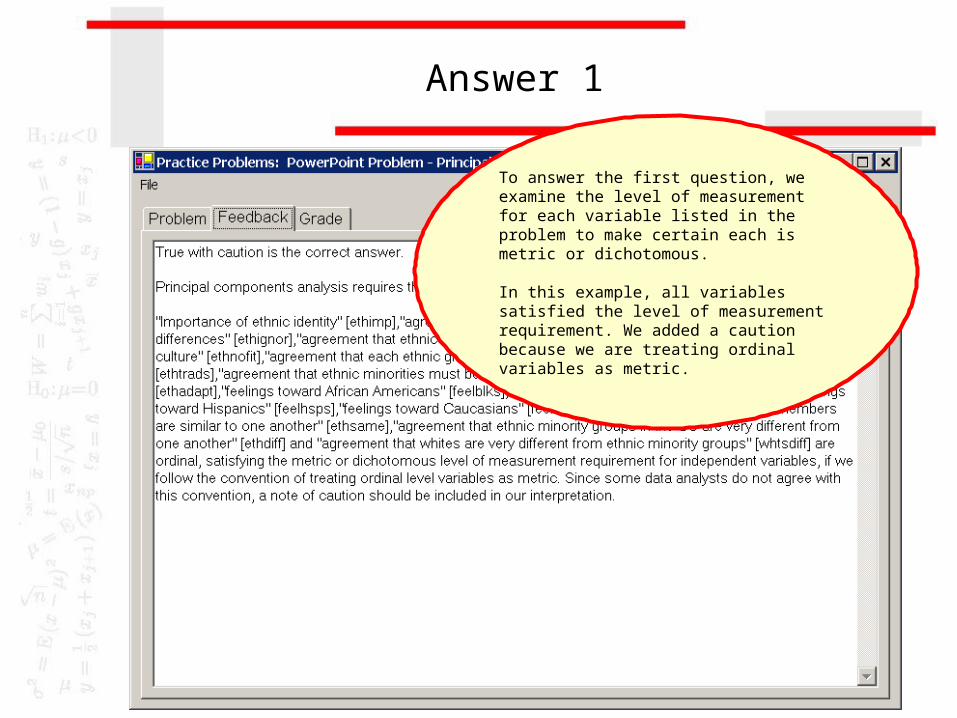
Answer 1
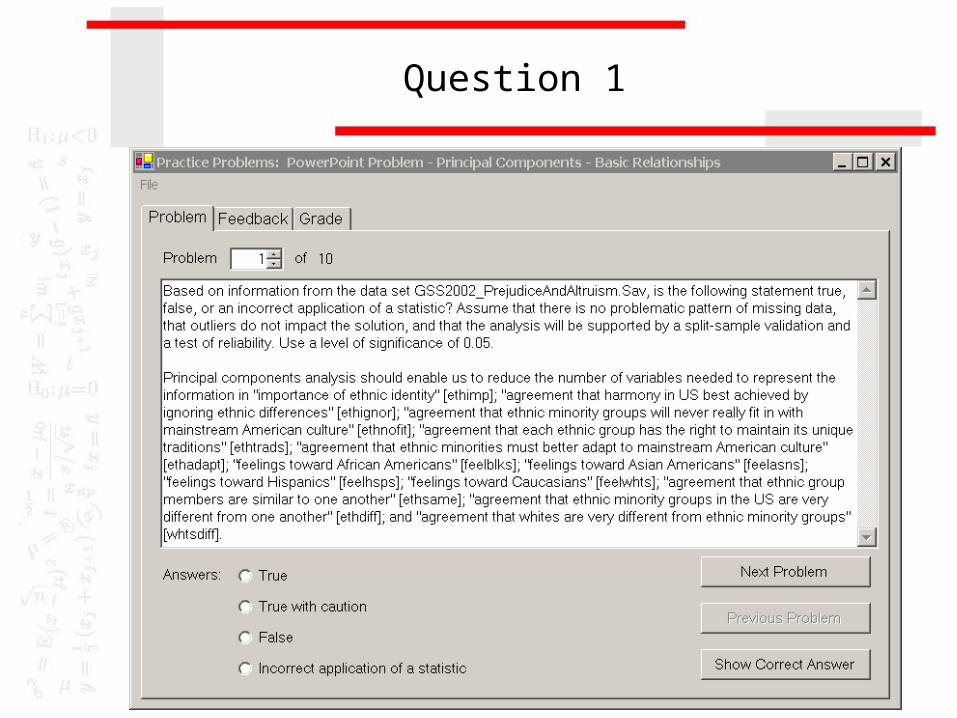
To answer the first question, we examine the level of measurement for each variable listed in the problem to make certain each is metric or dichotomous.
In this example, all variables satisfied the level of measurement requirement. We added a caution because we are treating ordinal variables as metric.
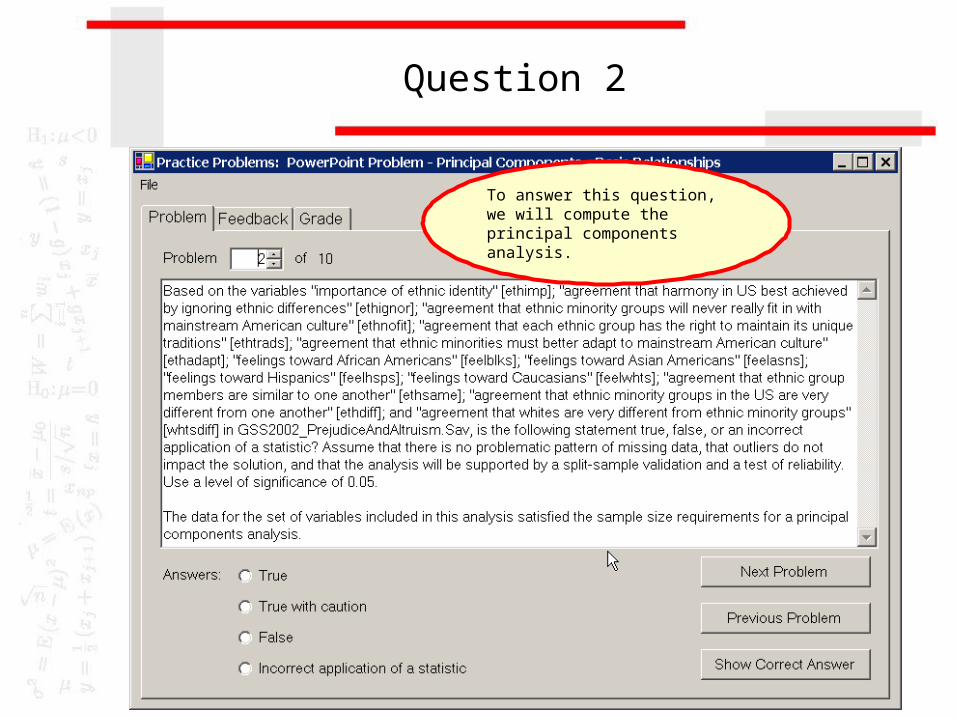
Question 2
To answer this question, we will compute the principal components analysis.
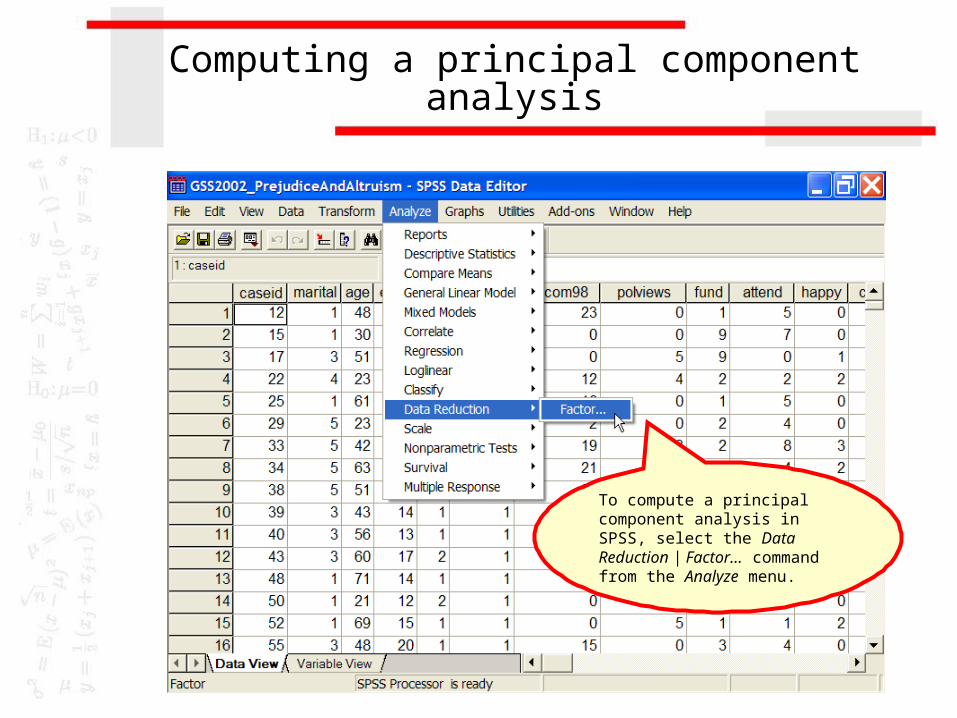
Computing a principal component analysis
To compute a principal component analysis in SPSS, select the Data Reduction | Factor… command from the Analyze menu.
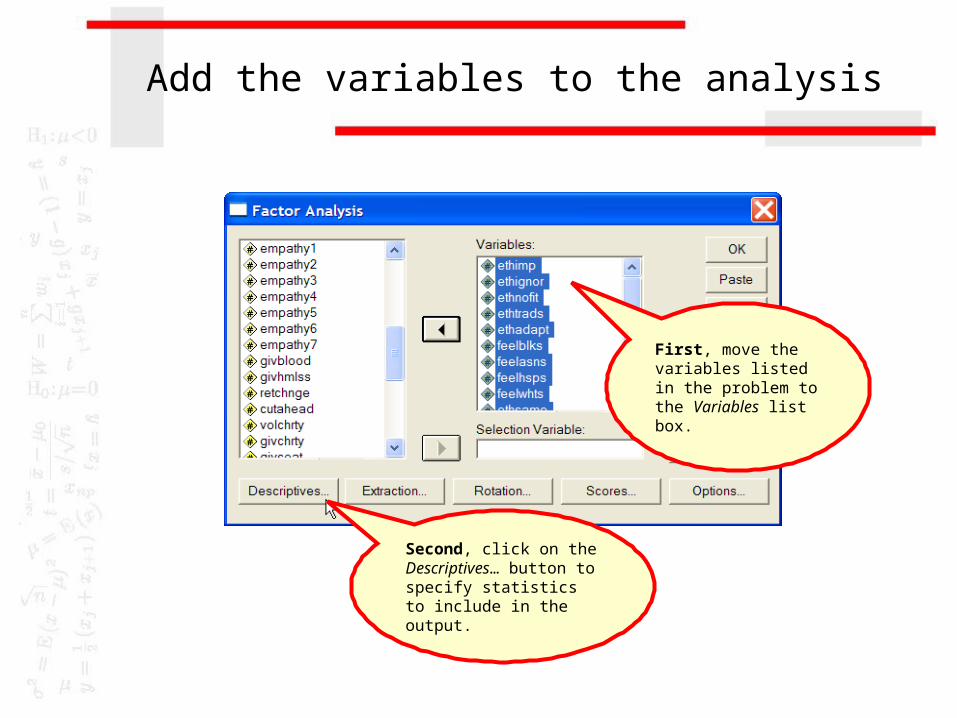
Add the variables to the analysis
First, move the variables listed in the problem to the Variables list box.
Second, click on the Descriptives… button to specify statistics to include in the output.
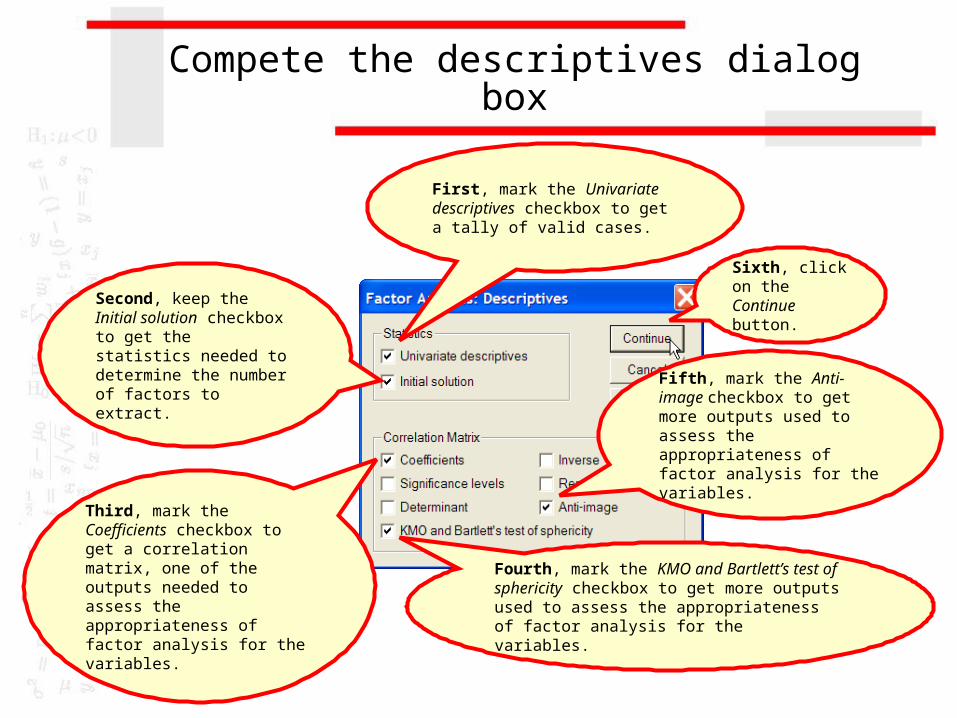
Compete the descriptives dialog box
First, mark the Univariate descriptives checkbox to get a tally of valid cases.
Third, mark the Coefficients checkbox to get a correlation matrix, one of the outputs needed to assess the appropriateness of factor analysis for the variables.
Second, keep the Initial solution checkbox to get the statistics needed to determine the number of factors to extract.
Fourth, mark the KMO and Bartlett’s test of sphericity checkbox to get more outputs used to assess the appropriateness of factor analysis for the variables.
Fifth, mark the Anti-image checkbox to get more outputs used to assess the appropriateness of factor analysis for the variables.
Sixth, click on the Continue button.
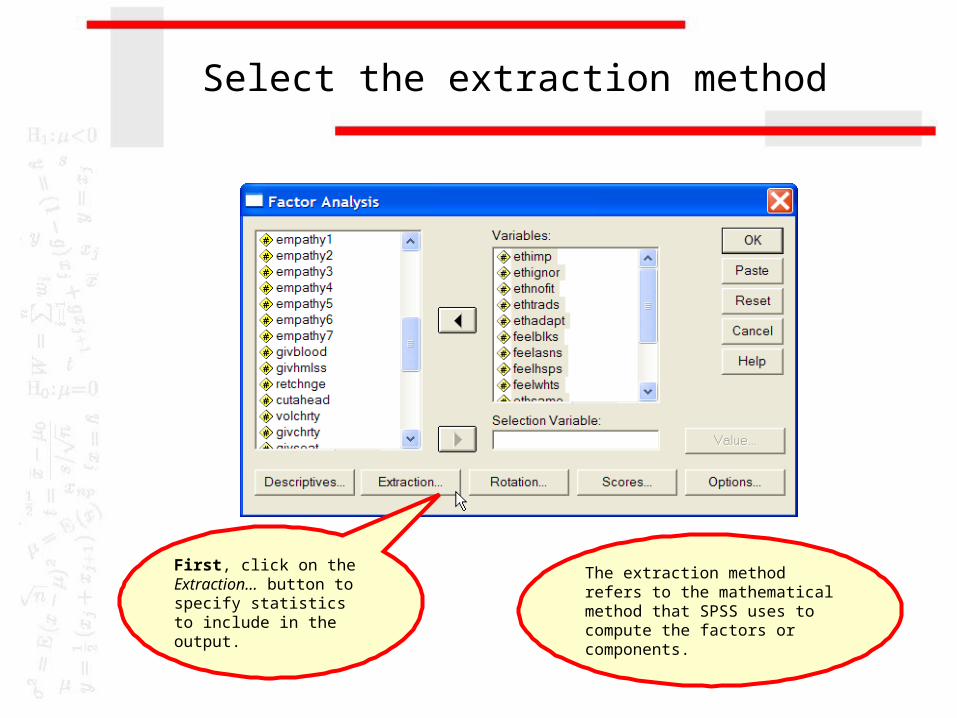
Select the extraction method
First, click on the Extraction… button to specify statistics to include in the output.
The extraction method refers to the mathematical method that SPSS uses to compute the factors or components.
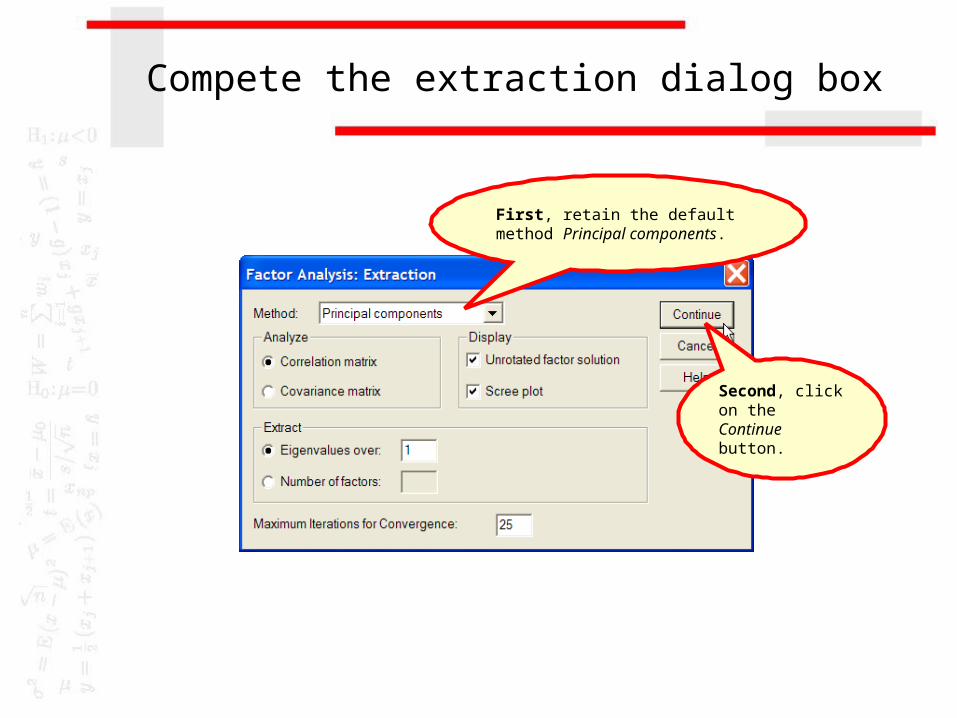
Compete the extraction dialog box
First, retain the default method Principal components.
Second, click on the Continue button.
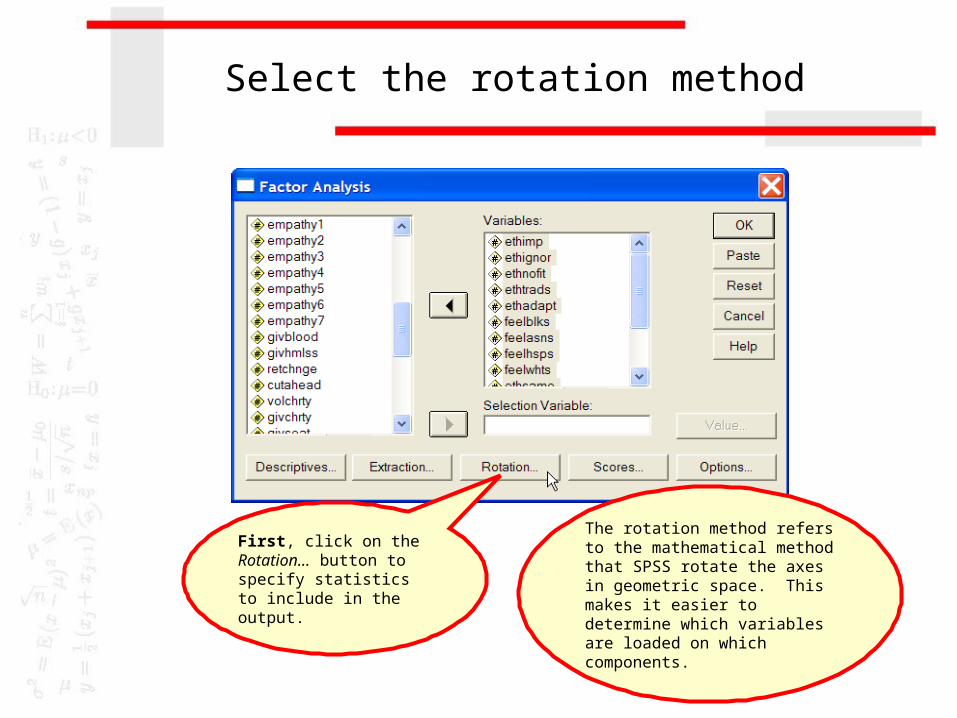
Select the rotation method
First, click on the Rotation… button to specify statistics to include in the output.
The rotation method refers to the mathematical method that SPSS rotate the axes in geometric space. This makes it easier to determine which variables are loaded on which components.

Compete the rotation dialog box
First, mark the Varimax method as the type of rotation to used in the analysis.
Second, click on the Continue button.
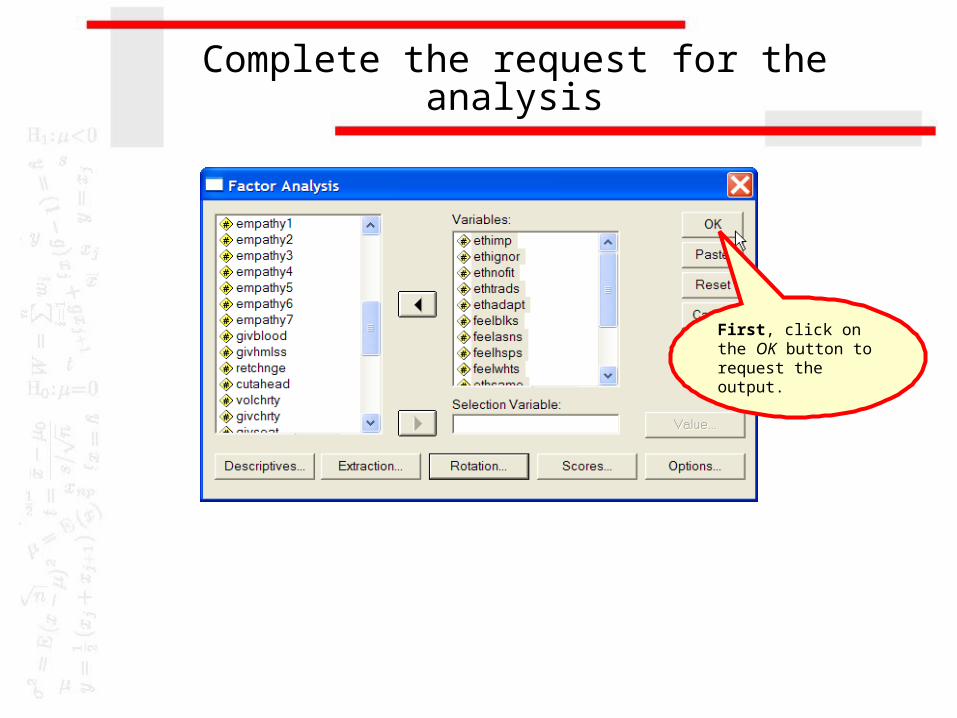
Complete the request for the analysis
First, click on the OK button to request the output.
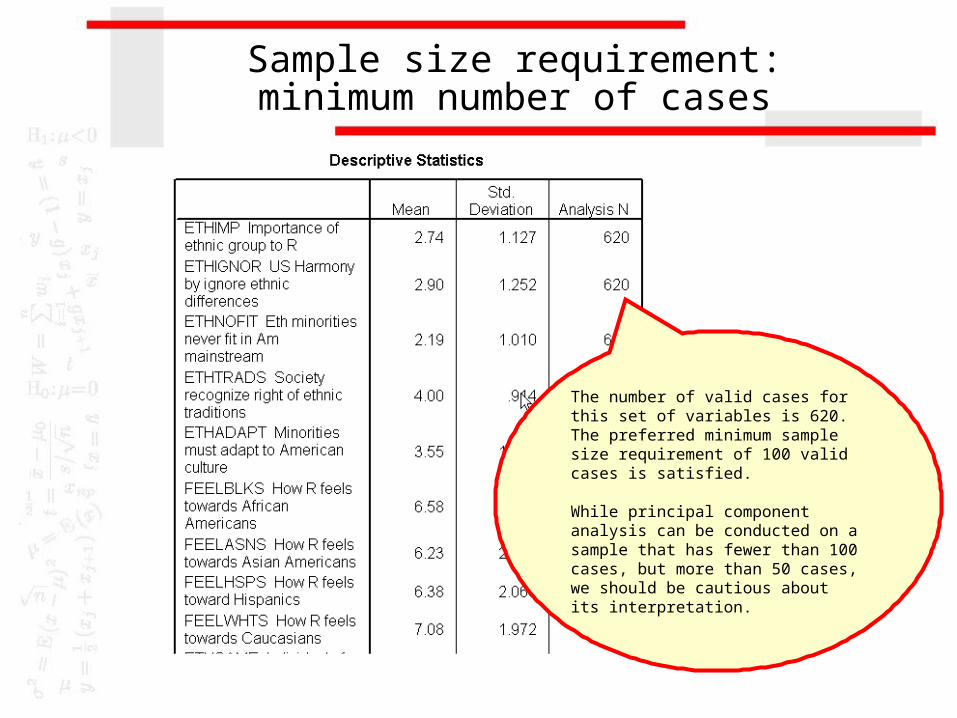
Sample size requirement:minimum number of cases
The number of valid cases for this set of variables is 620. The preferred minimum sample size requirement of 100 valid cases is satisfied.
While principal component analysis can be conducted on a sample that has fewer than 100 cases, but more than 50 cases, we should be cautious about its interpretation.
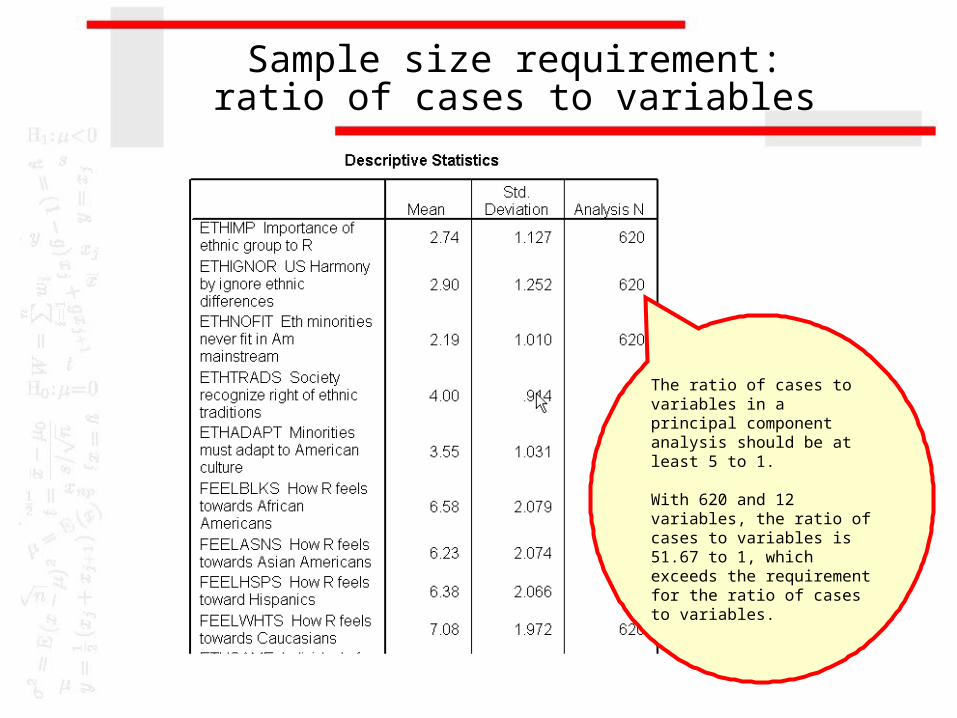
Sample size requirement:ratio of cases to variables
The ratio of cases to variables in a principal component analysis should be at least 5 to 1.
With 620 and 12 variables, the ratio of cases to variables is 51.67 to 1, which exceeds the requirement for the ratio of cases to variables.
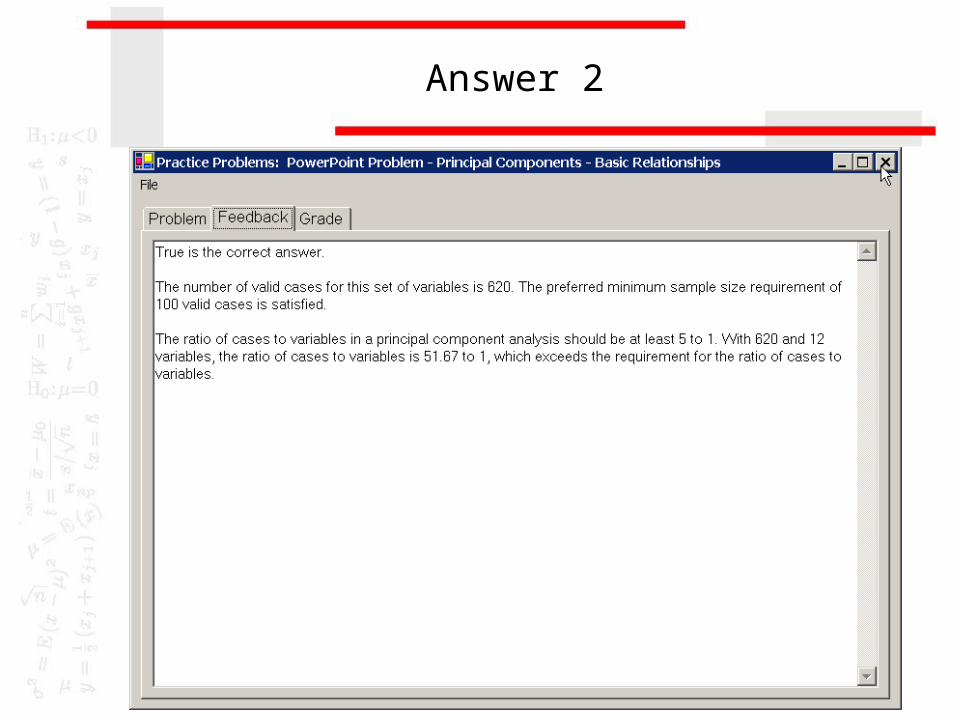
Answer 2

Question 3
Appropriateness of factor analysis:Presence of substantial correlations
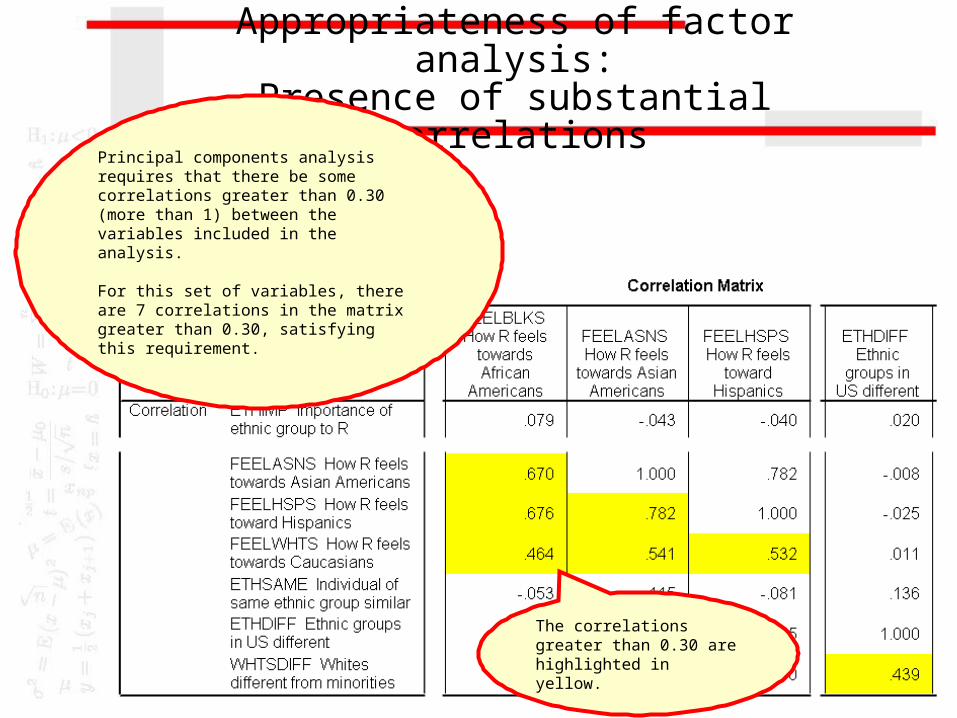
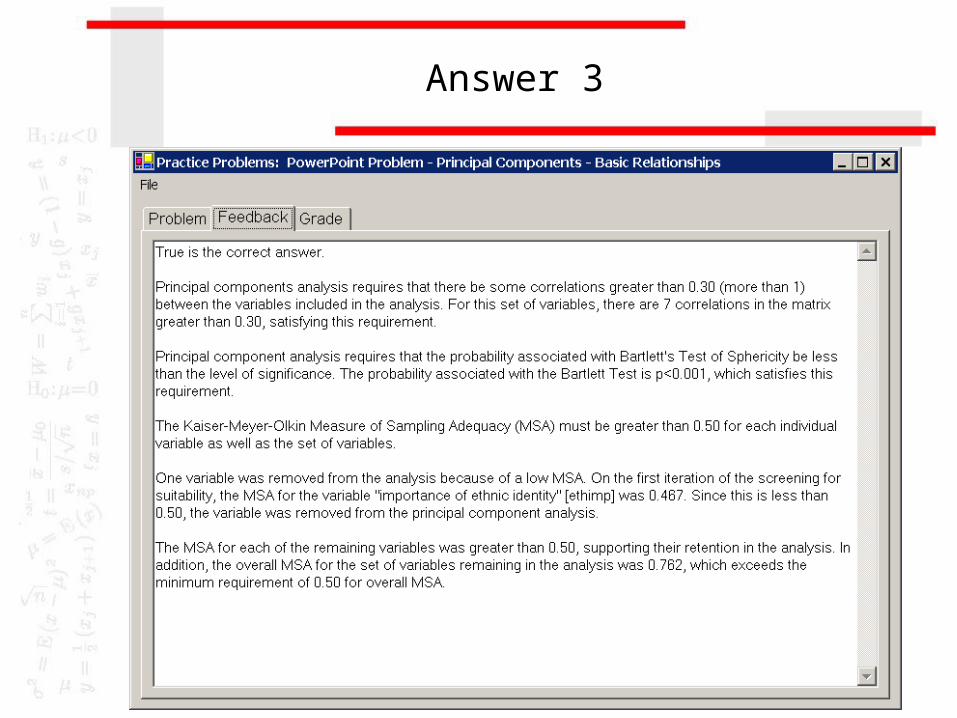
Principal components analysis requires that there be some correlations greater than 0.30 (more than 1) between the variables included in the analysis.
For this set of variables, there are 7 correlations in the matrix greater than 0.30, satisfying this requirement.
The correlations greater than 0.30 are highlighted in yellow.
Appropriateness of factor analysis:Sampling adequacy of individual
variables
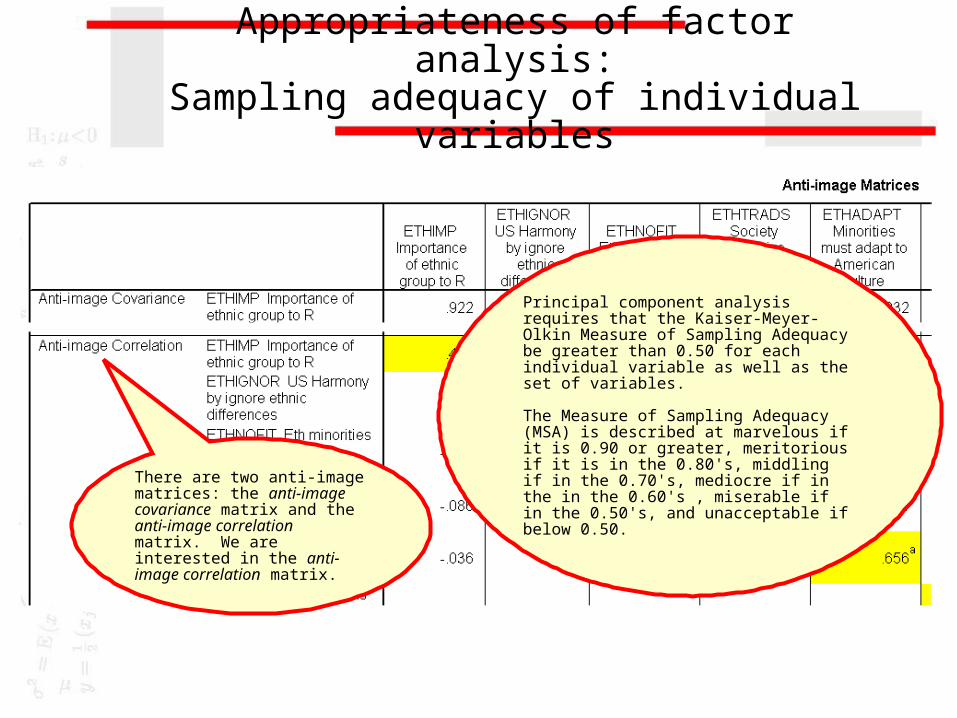
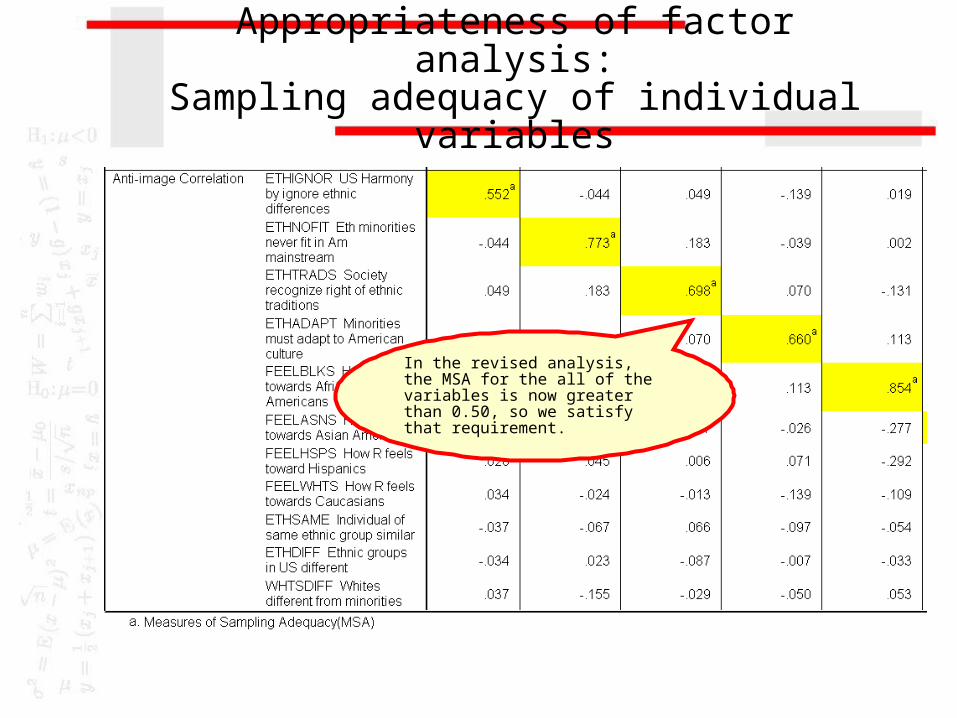
Principal component analysis requires that the Kaiser-Meyer-Olkin Measure of Sampling Adequacy be greater than 0.50 for each individual variable as well as the set of variables.
The Measure of Sampling Adequacy (MSA) is described at marvelous if it is 0.90 or greater, meritorious if it is in the 0.80's, middling if in the 0.70's, mediocre if in the in the 0.60's , miserable if in the 0.50's, and unacceptable if below 0.50.
There are two anti-image matrices: the anti-image covariance matrix and the anti-image correlation matrix. We are interested in the anti-image correlation matrix.
Appropriateness of factor analysis:Sampling adequacy of individual
variables
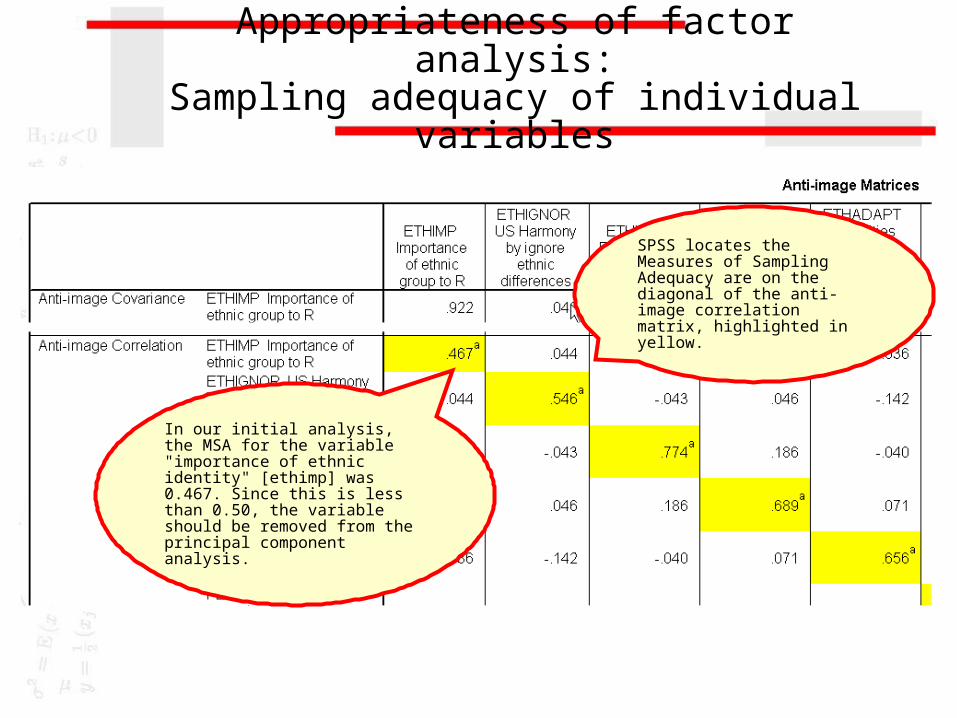
In our initial analysis, the MSA for the variable "importance of ethnic identity" [ethimp] was 0.467. Since this is less than 0.50, the variable should be removed from the principal component analysis.
SPSS locates the Measures of Sampling Adequacy are on the diagonal of the anti-image correlation matrix, highlighted in yellow.

Re-running the principal components analysis
To re-run the analysis, click on the Dialog Recall button and select Factor Analysis from the pop-up menu.
The dialog box from the last factor analysis run will be displayed.
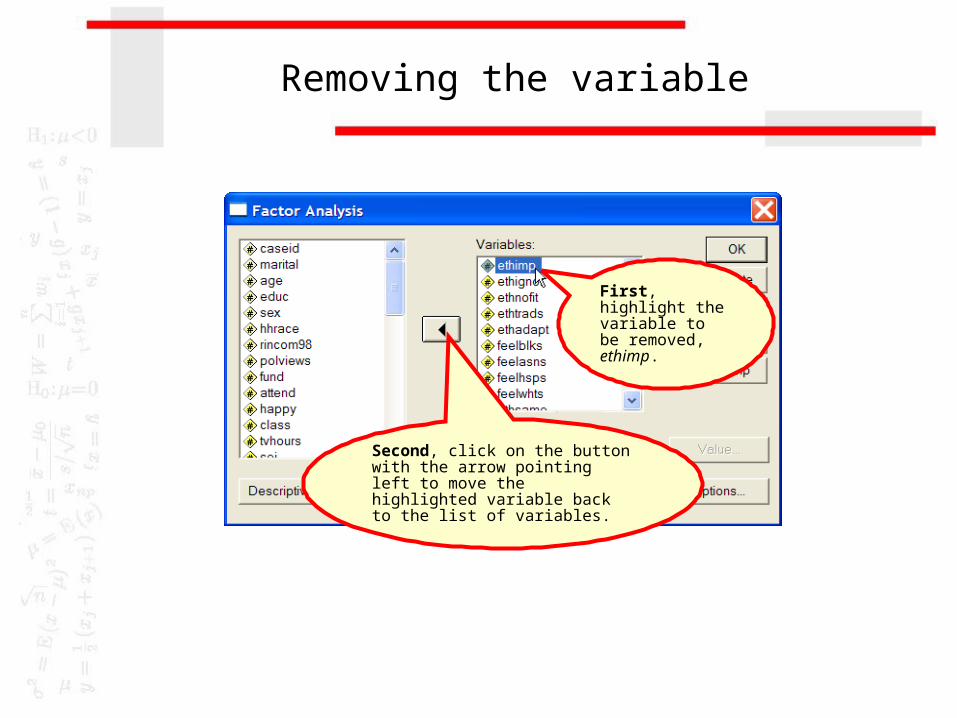
Removing the variable
Second, click on the button with the arrow pointing left to move the highlighted variable back to the list of variables.
First, highlight the variable to be removed, ethimp.

Producing the revised output
First, click on the OK button to request the revised output.
Appropriateness of factor analysis:Sampling adequacy of individual
variables
In the revised analysis, the MSA for the all of the variables is now greater than 0.50, so we satisfy that requirement.
Appropriateness of factor analysis:Sample adequacy for set of variables
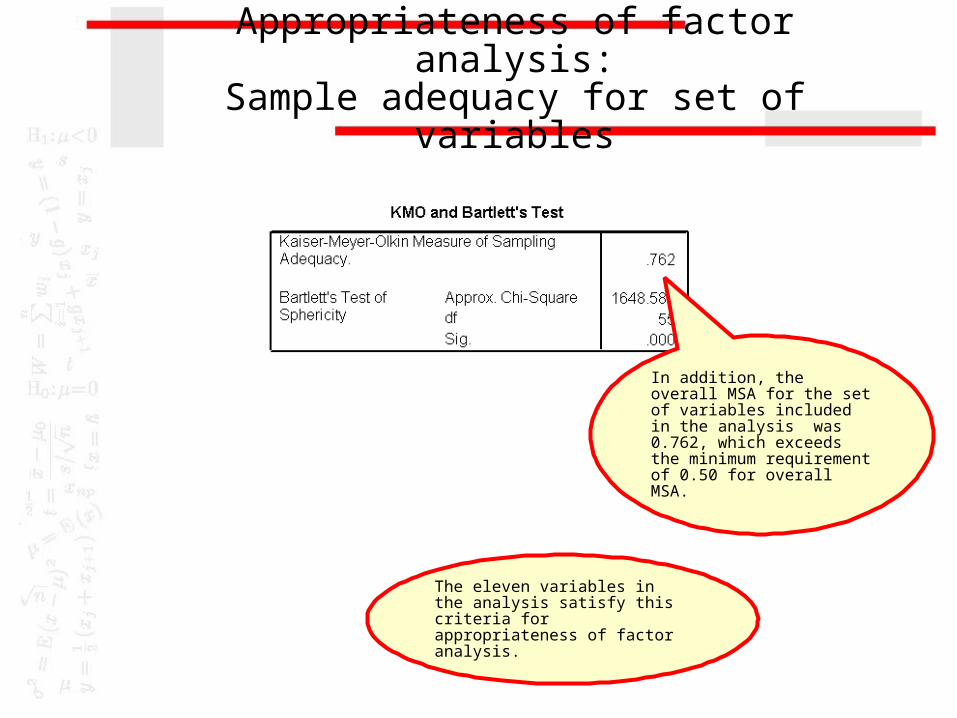
In addition, the overall MSA for the set of variables included in the analysis was 0.762, which exceeds the minimum requirement of 0.50 for overall MSA.
The eleven variables in the analysis satisfy this criteria for appropriateness of factor analysis.
Appropriateness of factor analysis:Bartlett test of sphericity
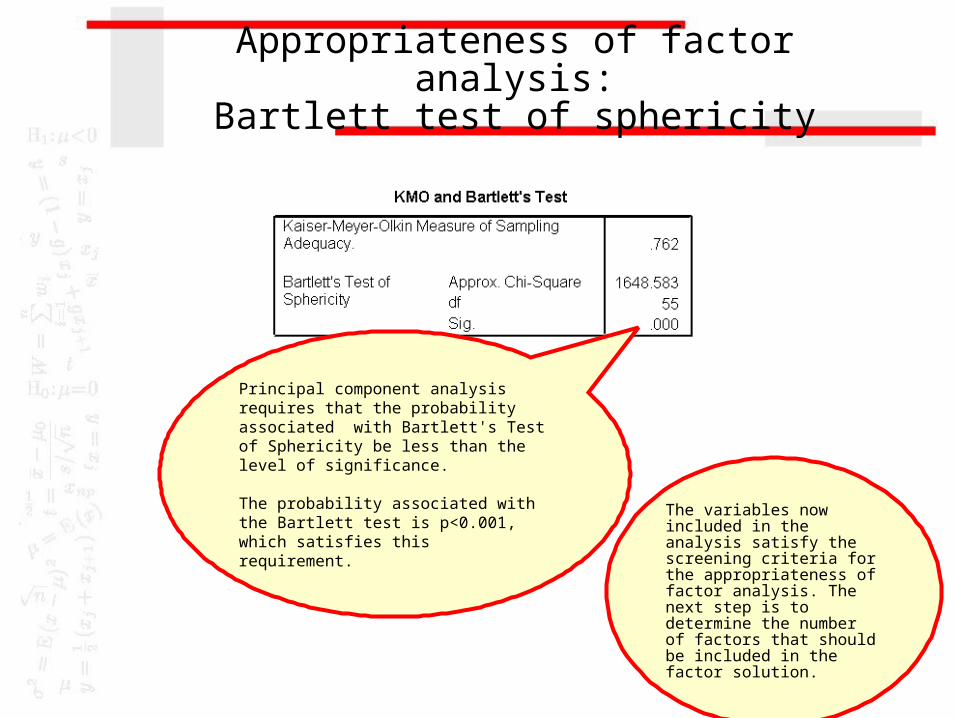
Principal component analysis requires that the probability associated with Bartlett's Test of Sphericity be less than the level of significance.
The probability associated with the Bartlett test is p<0.001, which satisfies this requirement.
The variables now included in the analysis satisfy the screening criteria for the appropriateness of factor analysis. The next step is to determine the number of factors that should be included in the factor solution.
Answer 3

Question 4
Number of factors to extract
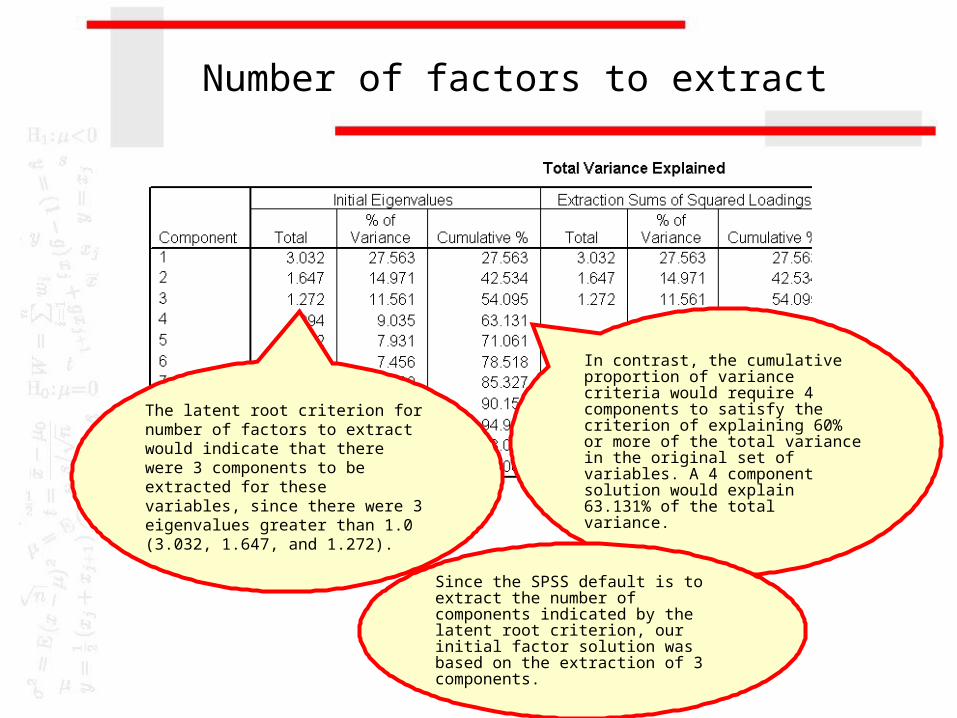
The latent root criterion for number of factors to extract would indicate that there were 3 components to be extracted for these variables, since there were 3 eigenvalues greater than 1.0 (3.032, 1.647, and 1.272).
In contrast, the cumulative proportion of variance criteria would require 4 components to satisfy the criterion of explaining 60% or more of the total variance in the original set of variables. A 4 component solution would explain 63.131% of the total variance.
Since the SPSS default is to extract the number of components indicated by the latent root criterion, our initial factor solution was based on the extraction of 3 components.
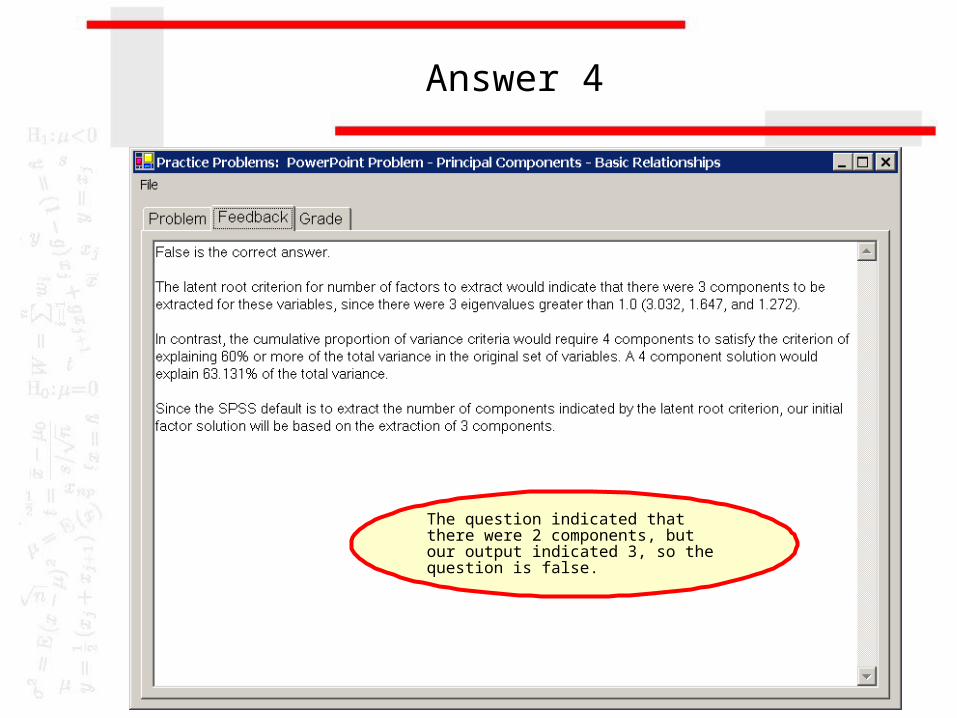
Answer 4
The question indicated that there were 2 components, but our output indicated 3, so the question is false.
Question 5
Evaluating communalities
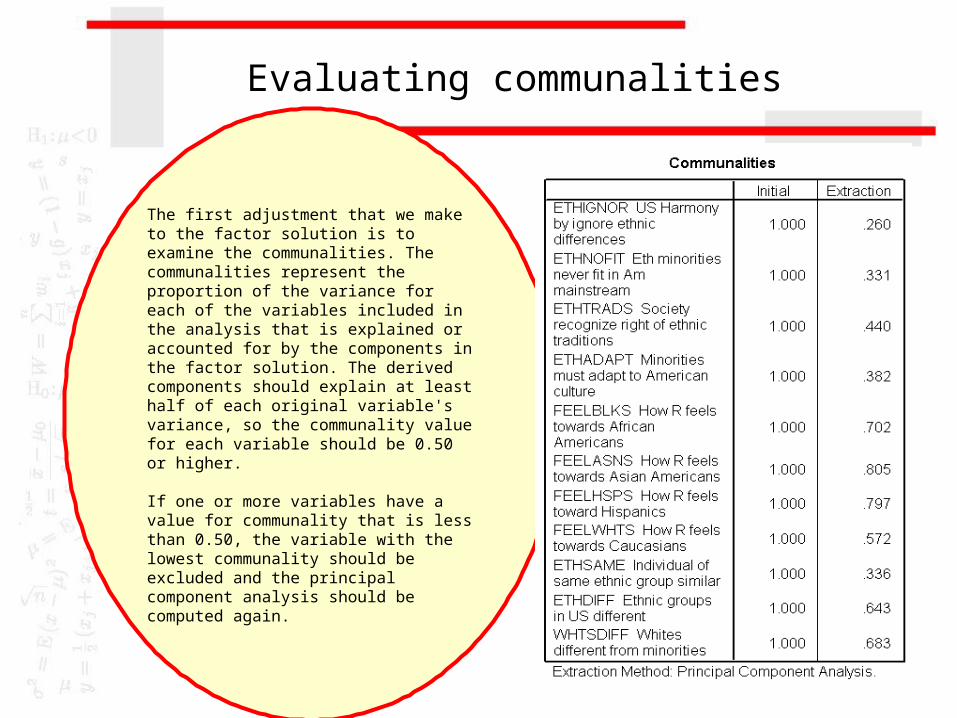
The first adjustment that we make to the factor solution is to examine the communalities. The communalities represent the proportion of the variance for each of the variables included in the analysis that is explained or accounted for by the components in the factor solution. The derived components should explain at least half of each original variable's variance, so the communality value for each variable should be 0.50 or higher.
If one or more variables have a value for communality that is less than 0.50, the variable with the lowest communality should be excluded and the principal component analysis should be computed again.
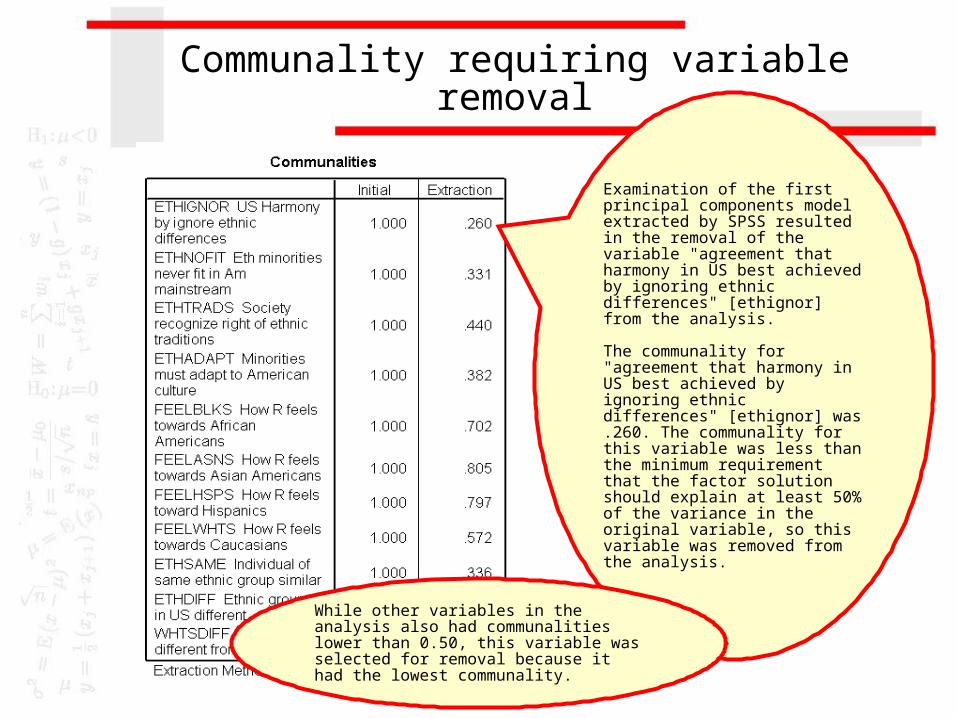
Communality requiring variable removal
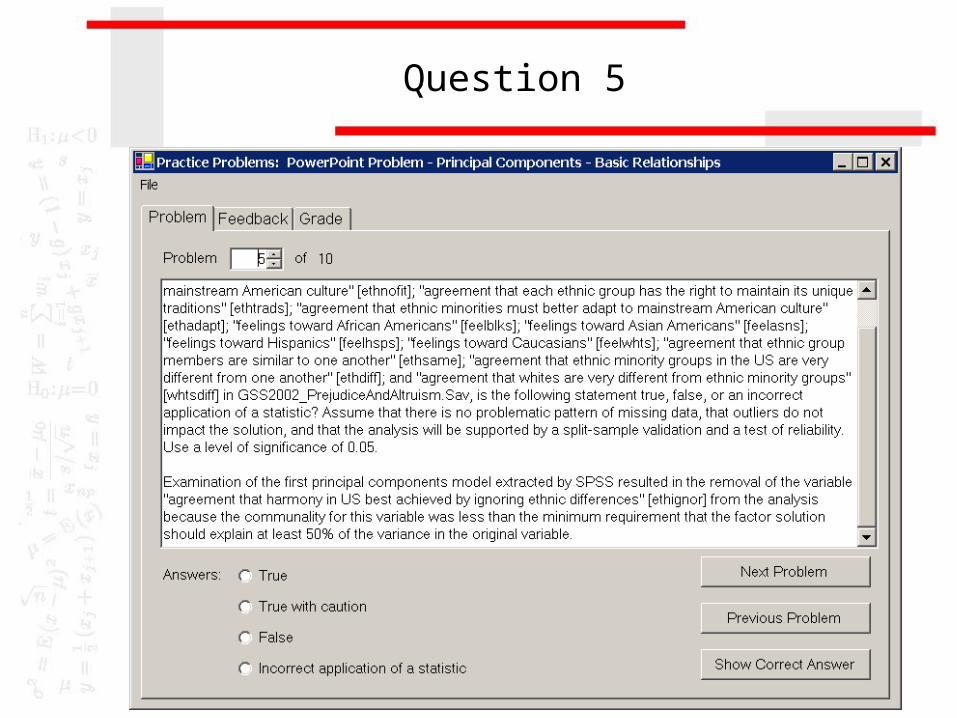
Examination of the first principal components model extracted by SPSS resulted in the removal of the variable "agreement that harmony in US best achieved by ignoring ethnic differences" [ethignor] from the analysis.
The communality for "agreement that harmony in US best achieved by ignoring ethnic differences" [ethignor] was .260. The communality for this variable was less than the minimum requirement that the factor solution should explain at least 50% of the variance in the original variable, so this variable was removed from the analysis.
While other variables in the analysis also had communalities lower than 0.50, this variable was selected for removal because it had the lowest communality.
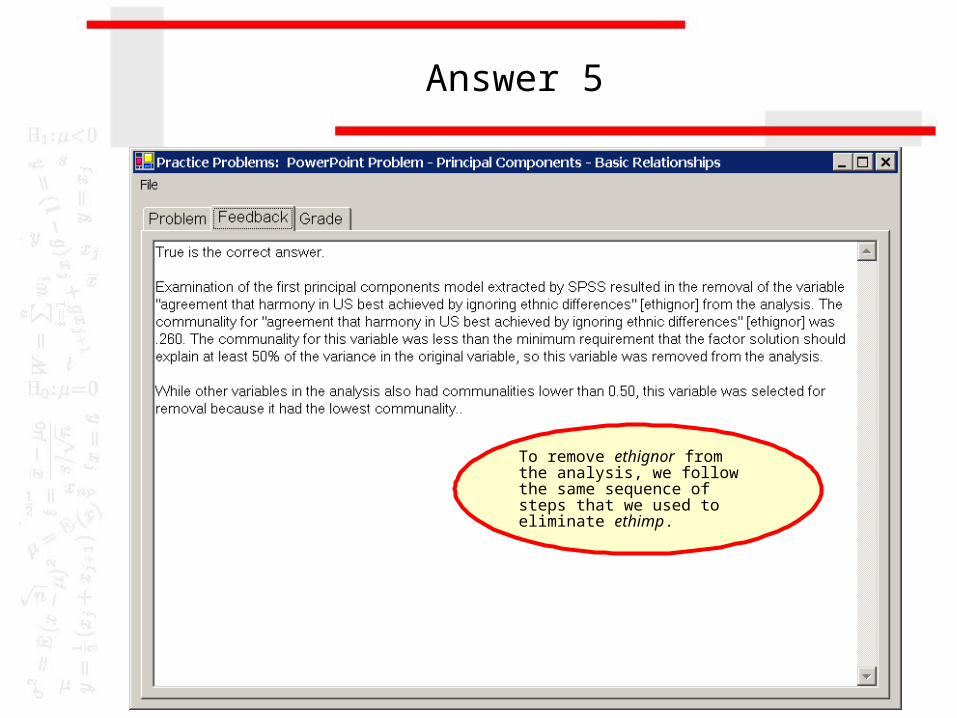
Answer 5
To remove ethignor from the analysis, we follow the same sequence of steps that we used to eliminate ethimp.

Question 6

Communality requiring variable removal
Examination of the second principal components model extracted by SPSS resulted in the removal of the variable "agreement that ethnic minorities must better adapt to mainstream American culture" [ethadapt] from the analysis.
The communality for "agreement that ethnic minorities must better adapt to mainstream American culture" [ethadapt] was .338. The communality for this variable was less than the minimum requirement that the factor solution should explain at least 50% of the variance in the original variable, so this variable was removed from the analysis.

Answer 6
To remove ethadapt from the analysis, we follow the same sequence of steps that we used to eliminate ethimp.
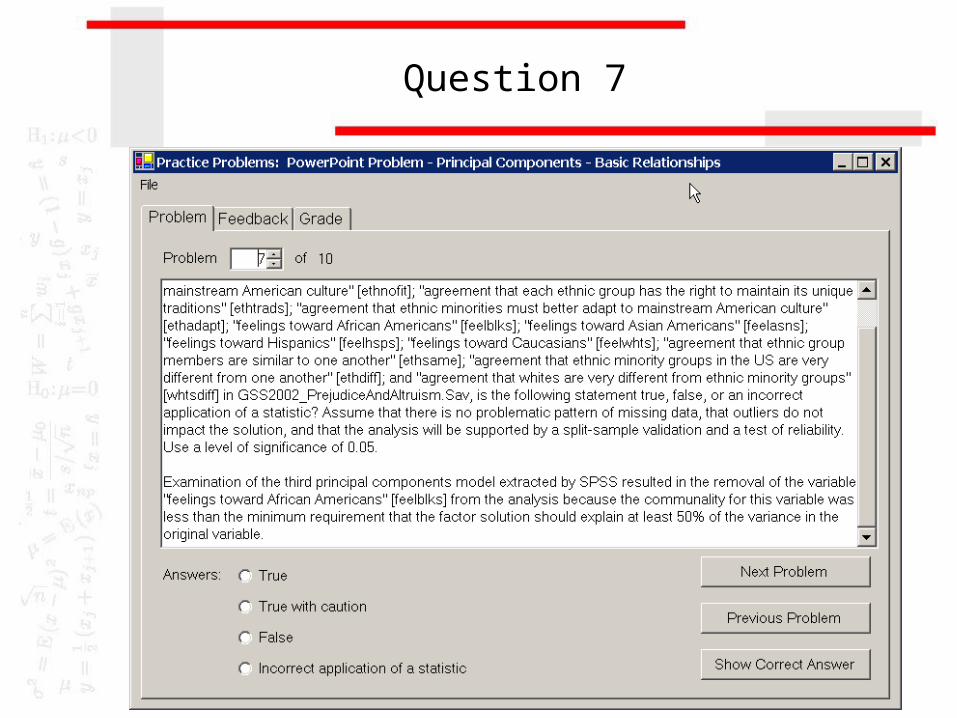
Question 7
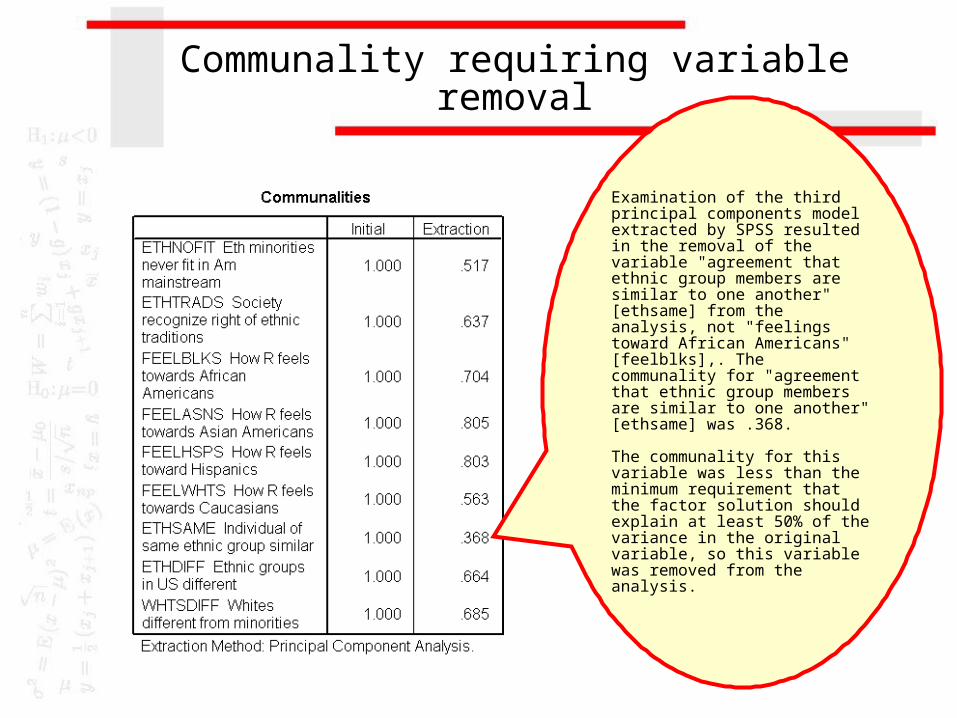
Communality requiring variable removal
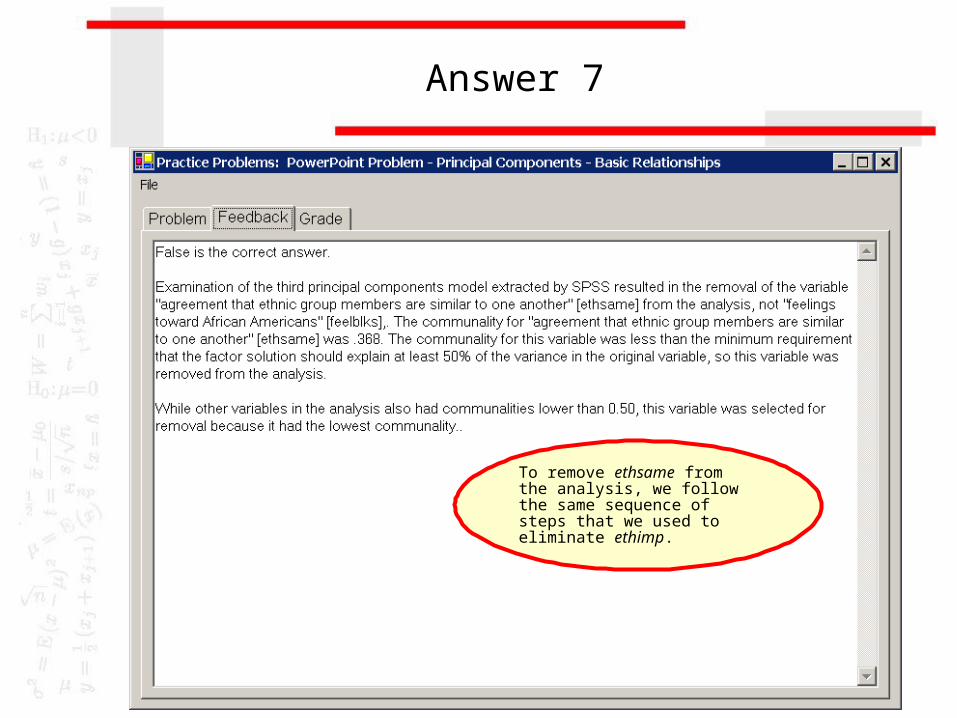
Examination of the third principal components model extracted by SPSS resulted in the removal of the variable "agreement that ethnic group members are similar to one another" [ethsame] from the analysis, not "feelings toward African Americans" [feelblks],. The communality for "agreement that ethnic group members are similar to one another" [ethsame] was .368.
The communality for this variable was less than the minimum requirement that the factor solution should explain at least 50% of the variance in the original variable, so this variable was removed from the analysis.
Answer 7
To remove ethsame from the analysis, we follow the same sequence of steps that we used to eliminate ethimp.
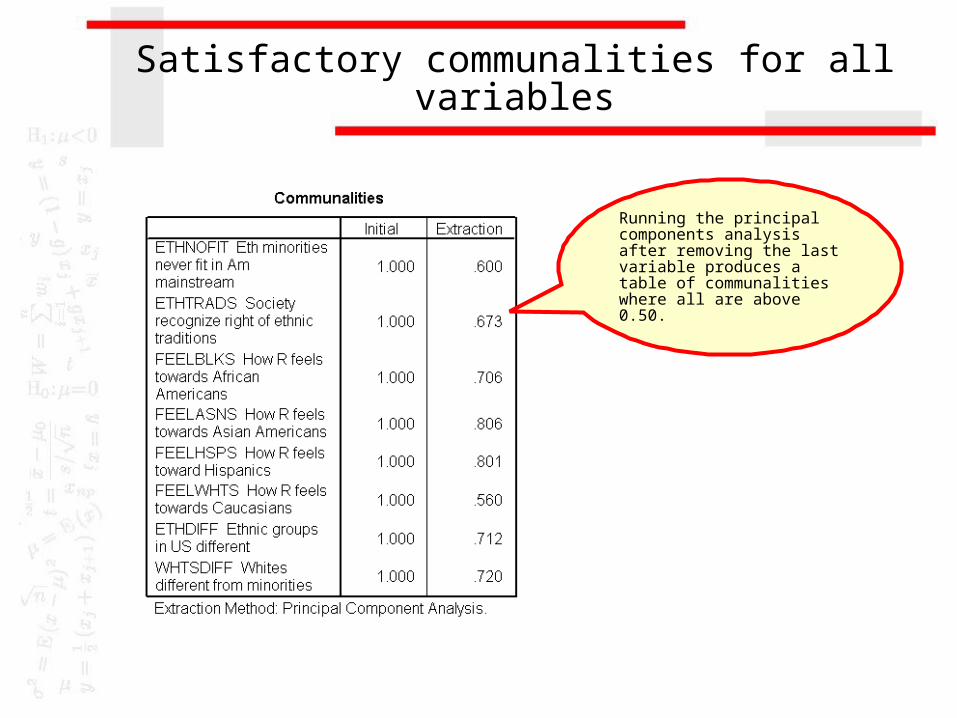
Satisfactory communalities for all variables
Running the principal components analysis after removing the last variable produces a table of communalities where all are above 0.50.
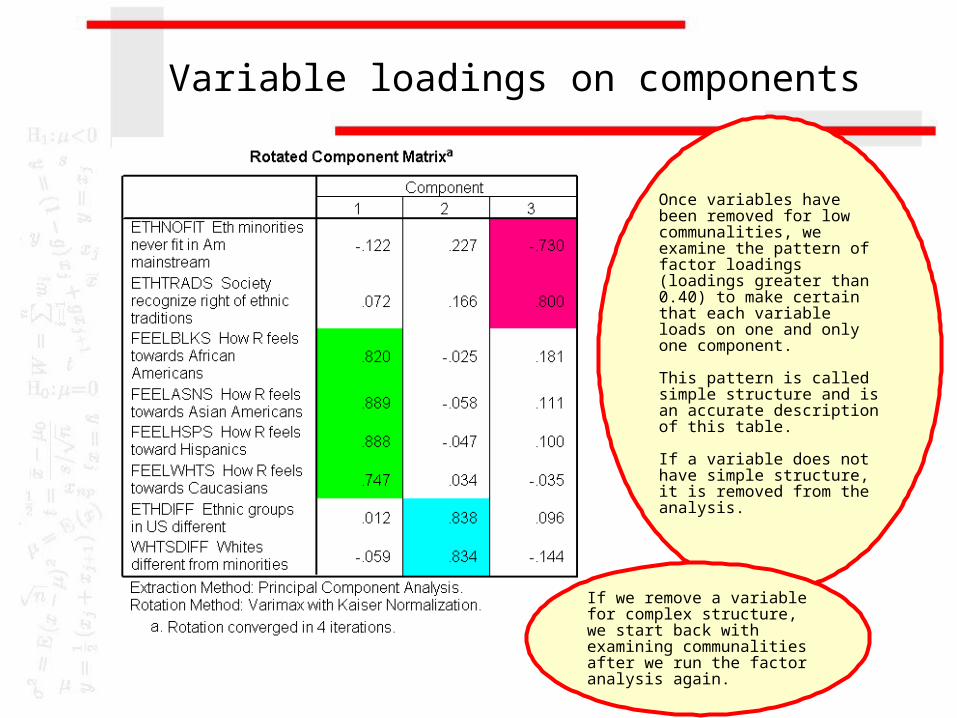
Variable loadings on components
Once variables have been removed for low communalities, we examine the pattern of factor loadings (loadings greater than 0.40) to make certain that each variable loads on one and only one component.
This pattern is called simple structure and is an accurate description of this table.
If a variable does not have simple structure, it is removed from the analysis.
If we remove a variable for complex structure, we start back with examining communalities after we run the factor analysis again.
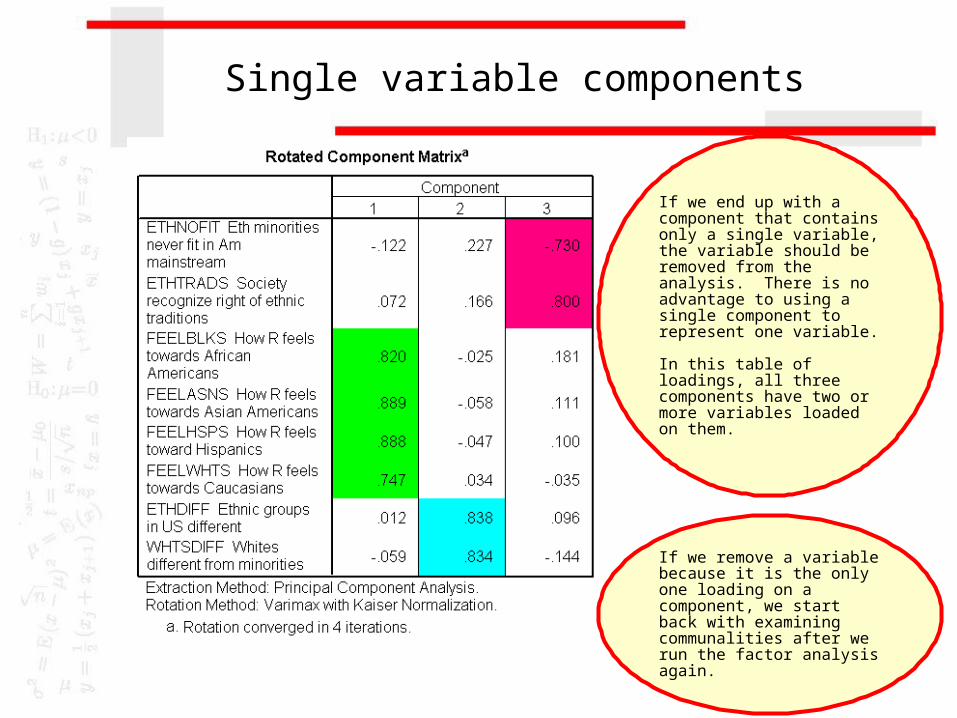
Single variable components
If we end up with a component that contains only a single variable, the variable should be removed from the analysis. There is no advantage to using a single component to represent one variable.
In this table of loadings, all three components have two or more variables loaded on them.
If we remove a variable because it is the only one loading on a component, we start back with examining communalities after we run the factor analysis again.
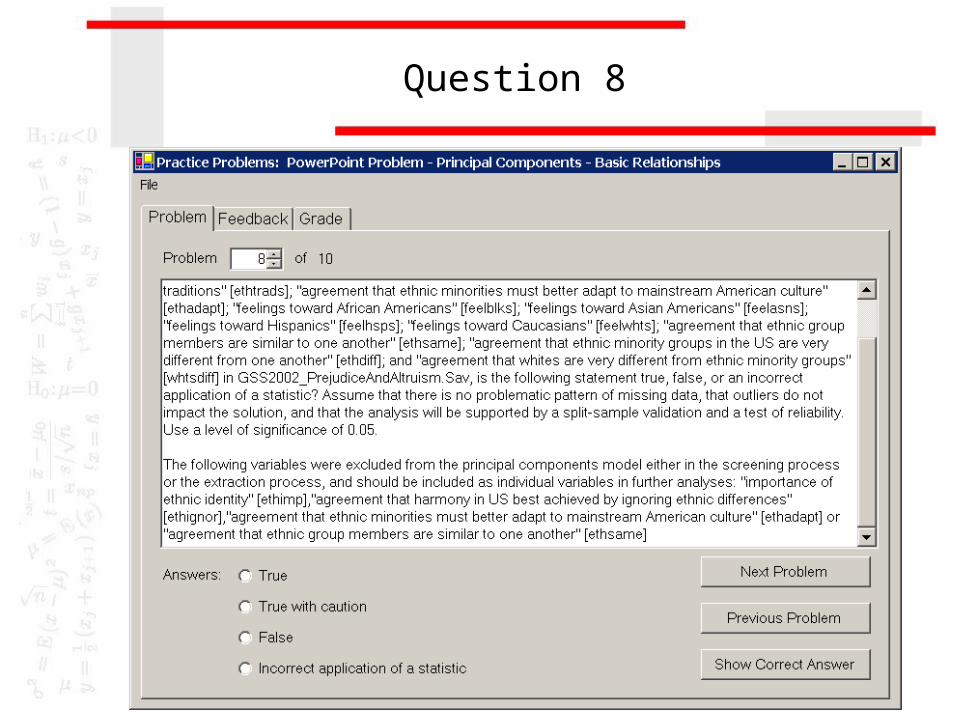
Question 8
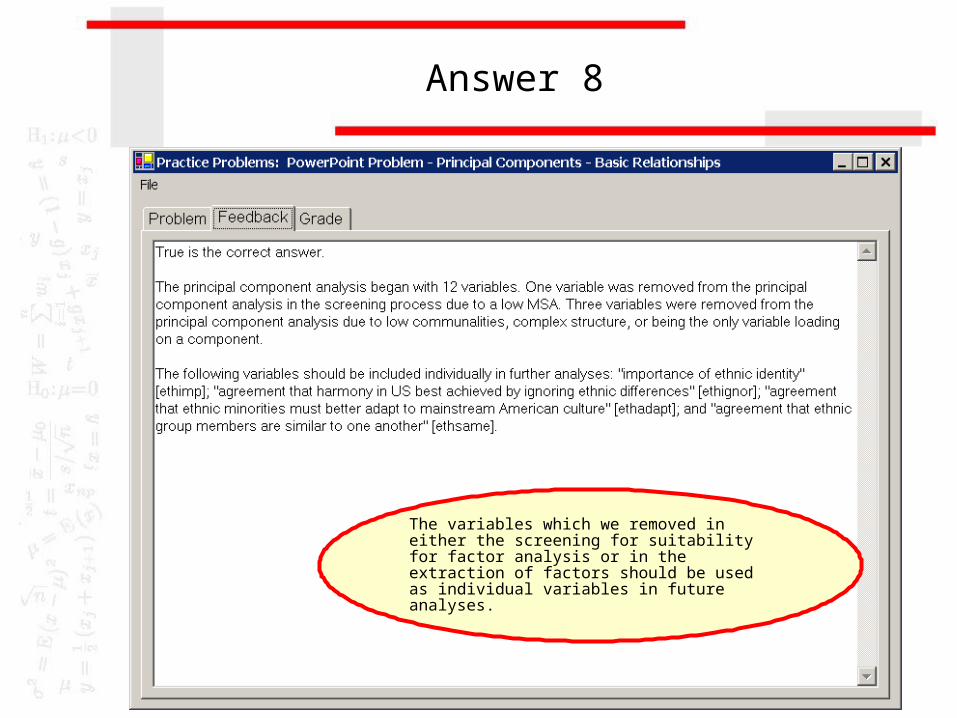
Answer 8
The variables which we removed in either the screening for suitability for factor analysis or in the extraction of factors should be used as individual variables in future analyses.
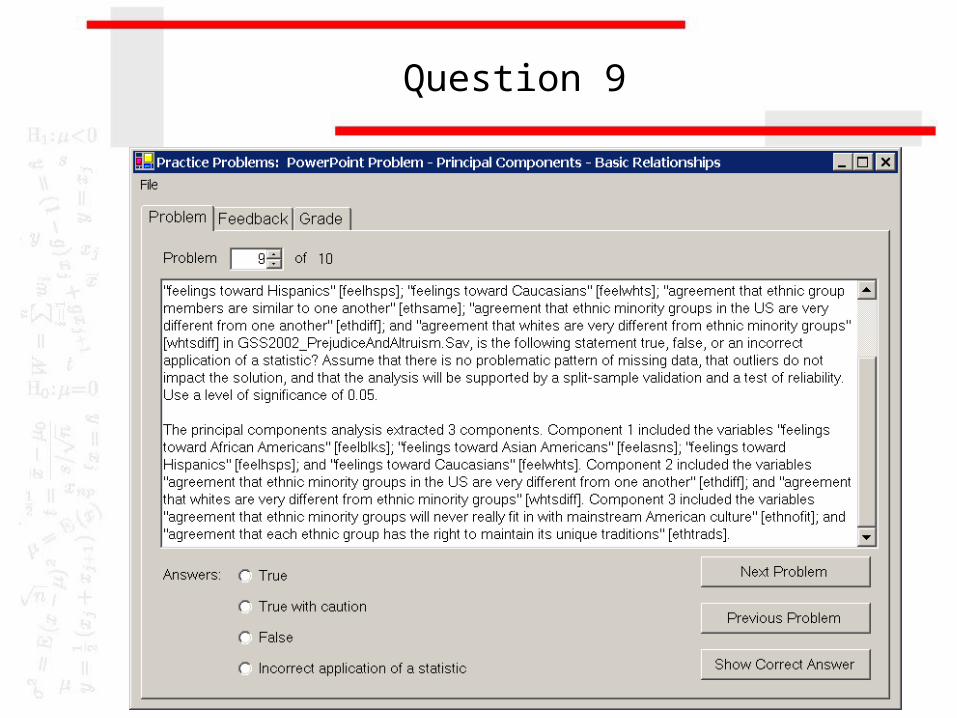
Question 9

Pattern of factor loadings
The components and variables which they contain must match the table of component loadings in order for this question to be true.
In this example, the pattern of loadings is correctly described.

Answer 9
The components and variables which they contain must match the table of component loadings in order for this question to be true.
In this example, the pattern of loadings is correctly described.
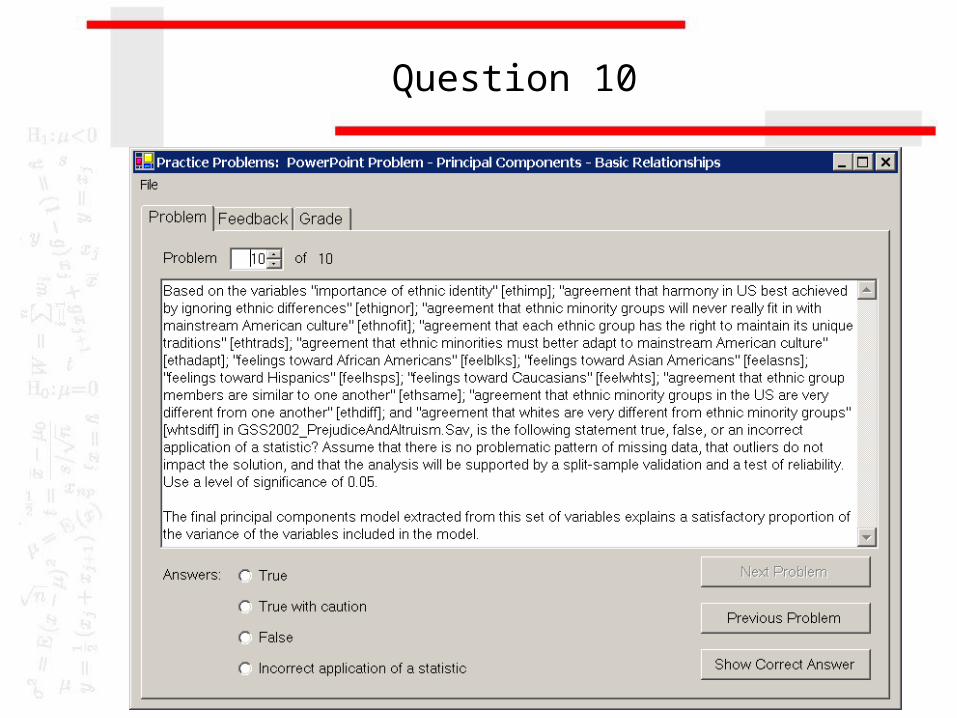
Question 10
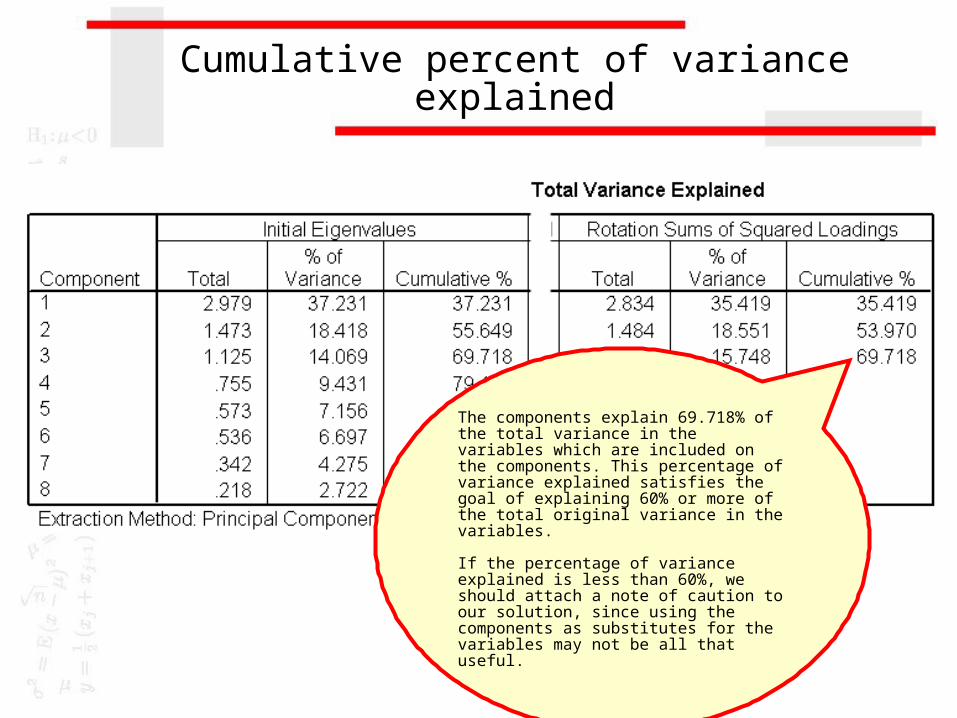
Cumulative percent of variance explained
The components explain 69.718% of the total variance in the variables which are included on the components. This percentage of variance explained satisfies the goal of explaining 60% or more of the total original variance in the variables.
If the percentage of variance explained is less than 60%, we should attach a note of caution to our solution, since using the components as substitutes for the variables may not be all that useful.

Answer 10
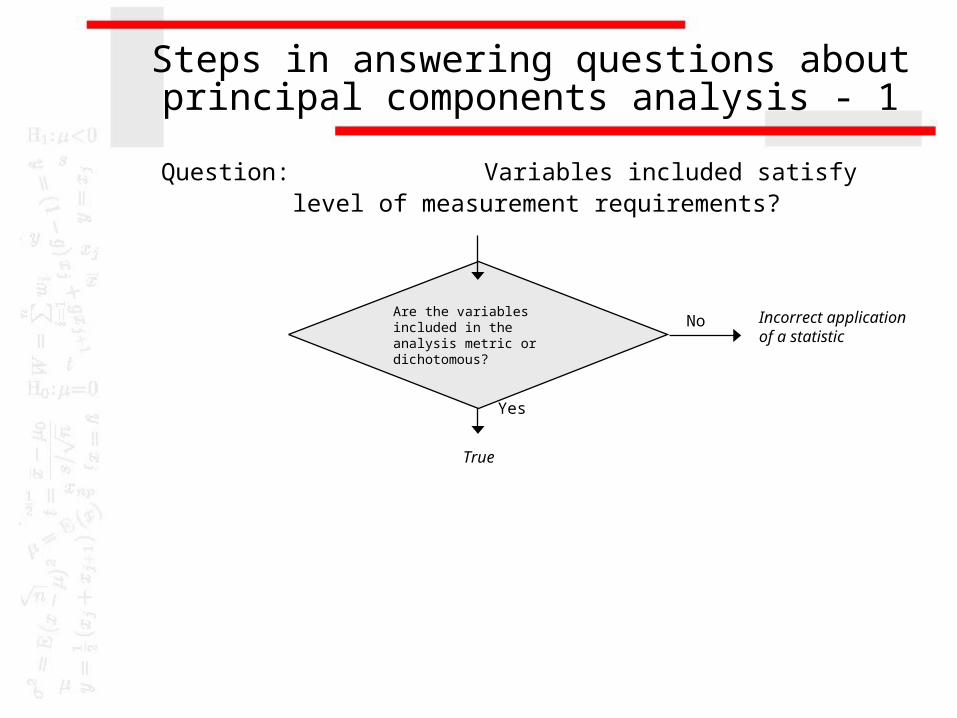
Steps in answering questions about principal components analysis - 1
Question: Variables included satisfy level of measurement requirements?
Incorrect application of a statistic
Yes
NoAre the variables included in the analysis metric or dichotomous?
True
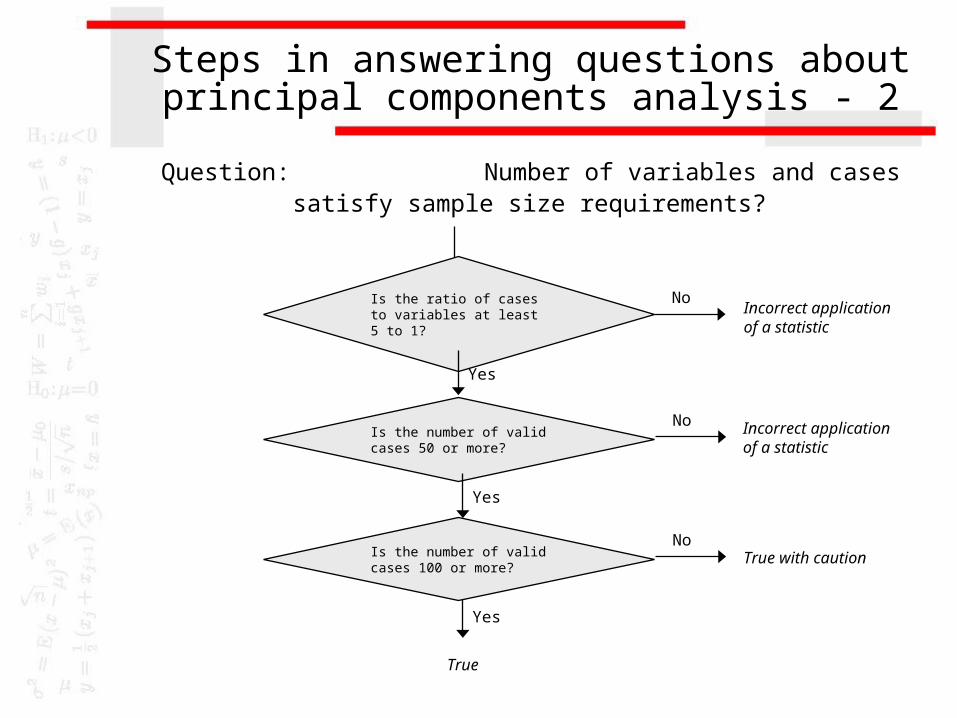
Steps in answering questions about principal components analysis - 2
Question: Number of variables and cases satisfy sample size requirements?
Is the number of valid cases 50 or more?
Yes
No
Is the ratio of cases to variables at least 5 to 1?
Yes
No
Incorrect application of a statistic
Incorrect application of a statistic
Is the number of valid cases 100 or more?
No
Yes
True
True with caution
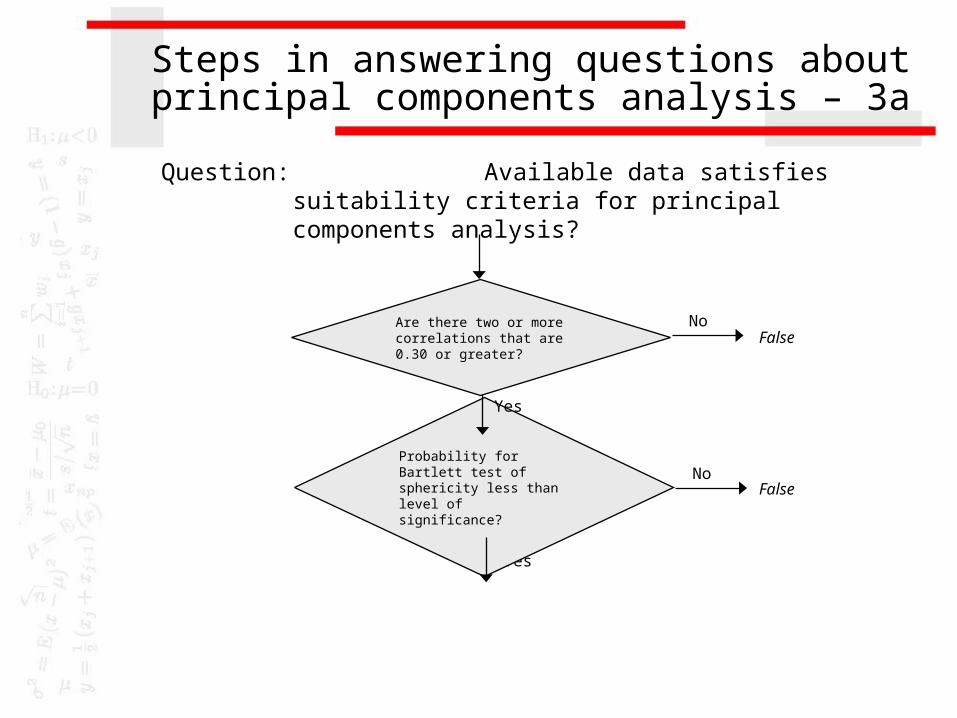
Steps in answering questions about principal components analysis – 3a
Question: Available data satisfies suitability criteria for principal components analysis?
FalseNo
False
Yes
NoProbability for Bartlett test of sphericity less than level of significance?
Yes
Are there two or more correlations that are 0.30 or greater?
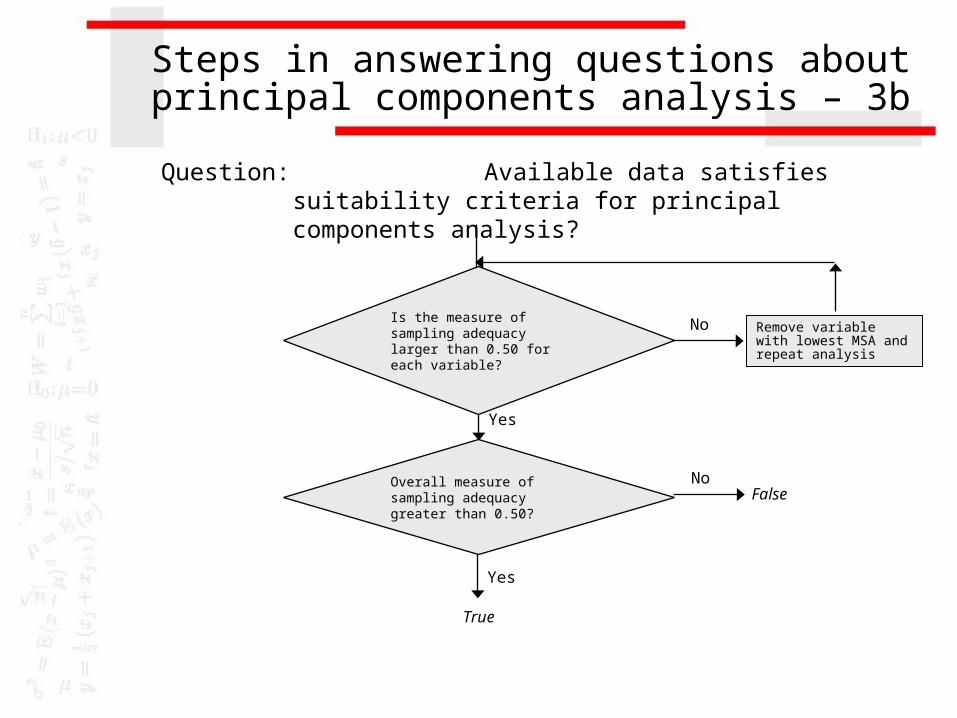
Steps in answering questions about principal components analysis – 3b
Question: Available data satisfies suitability criteria for principal components analysis?
True
Yes
No
Yes
NoFalse
Remove variable with lowest MSA and repeat analysis
Is the measure of sampling adequacy larger than 0.50 for each variable?
Overall measure of sampling adequacy greater than 0.50?
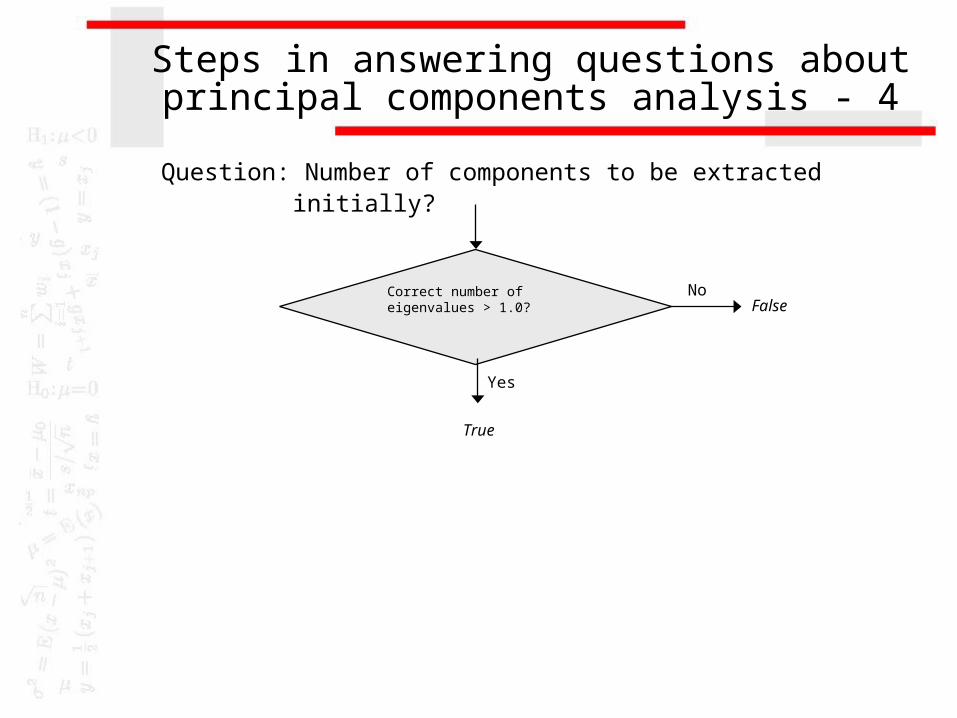
Steps in answering questions about principal components analysis - 4
Question: Number of components to be extracted initially?
Correct number of eigenvalues > 1.0?
True
No
Yes
False
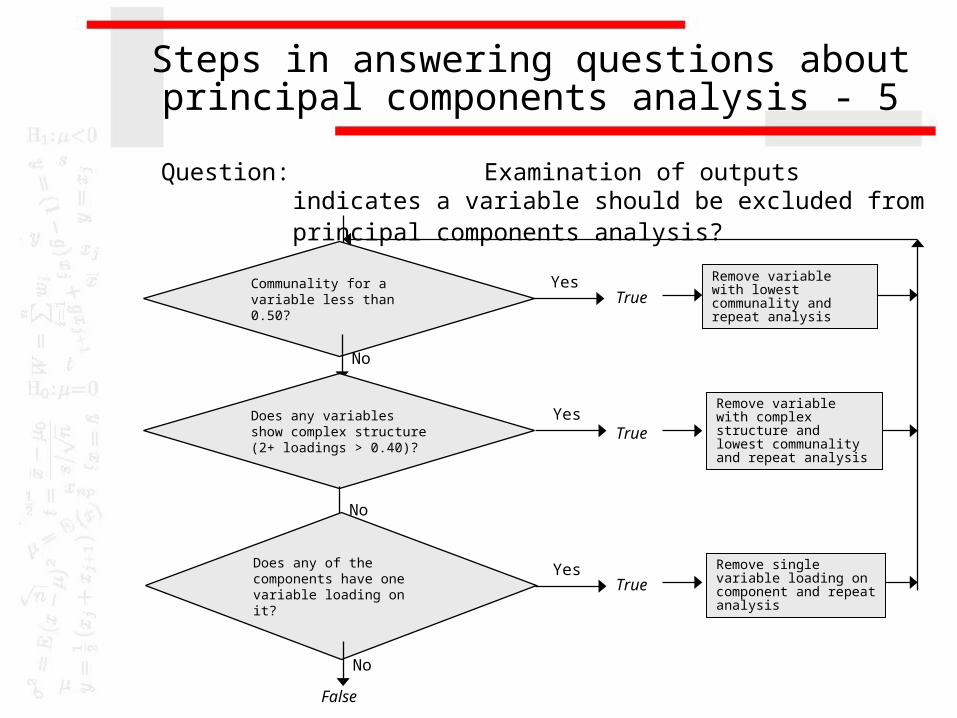
Steps in answering questions about principal components analysis - 5
Question: Examination of outputs indicates a variable should be excluded from principal components analysis?
Communality for a variable less than 0.50?
No
Yes Remove variable with lowest communality and repeat analysis
Does any variables show complex structure (2+ loadings > 0.40)?
No
Yes
Does any of the components have one variable loading on it?
No
Yes
False
True
True
TrueRemove single variable loading on component and repeat analysis
Remove variable with complex structure and lowest communality and repeat analysis
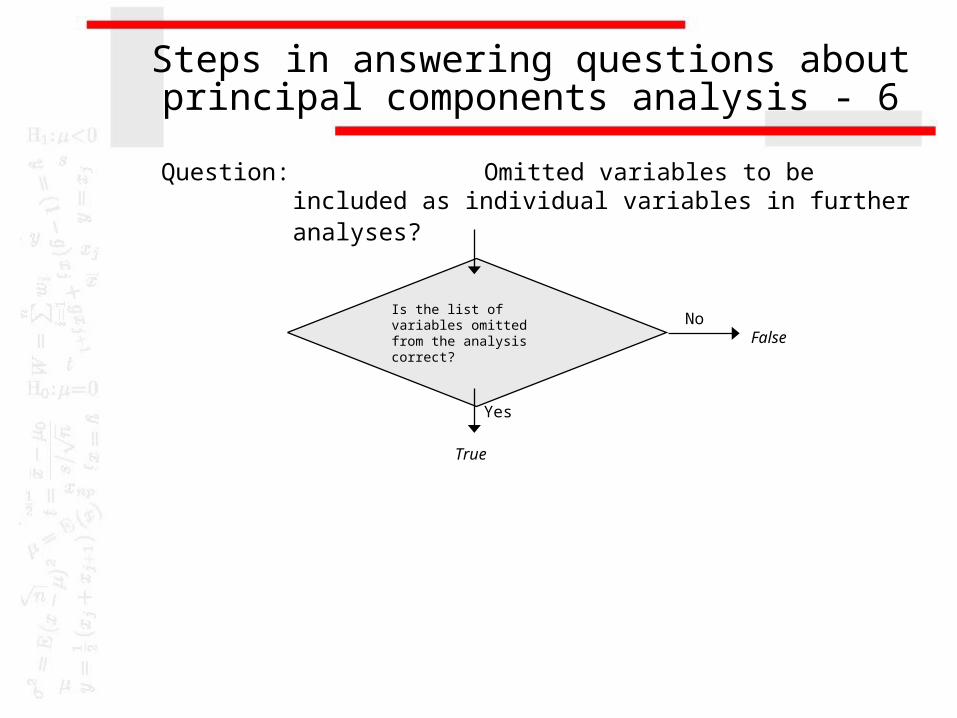
Steps in answering questions about principal components analysis - 6
Question: Omitted variables to be included as individual variables in further analyses?
FalseNoIs the list of variables
omitted from the analysis correct?
Yes
True
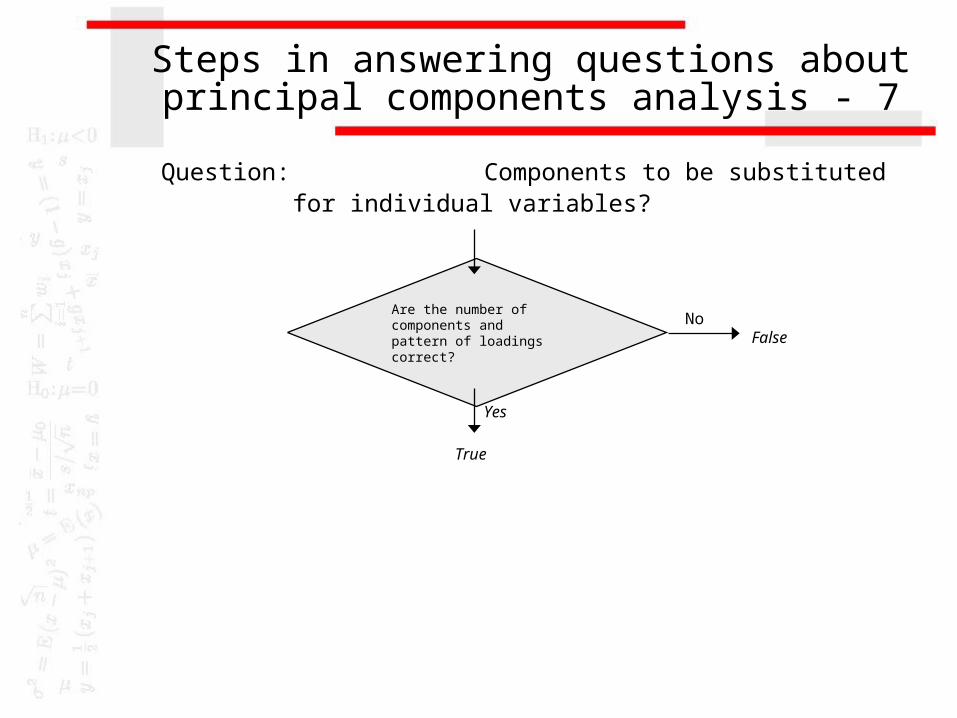
Steps in answering questions about principal components analysis - 7
Question: Components to be substituted for individual variables?
FalseNoAre the number of
components and pattern of loadings correct?
Yes
True
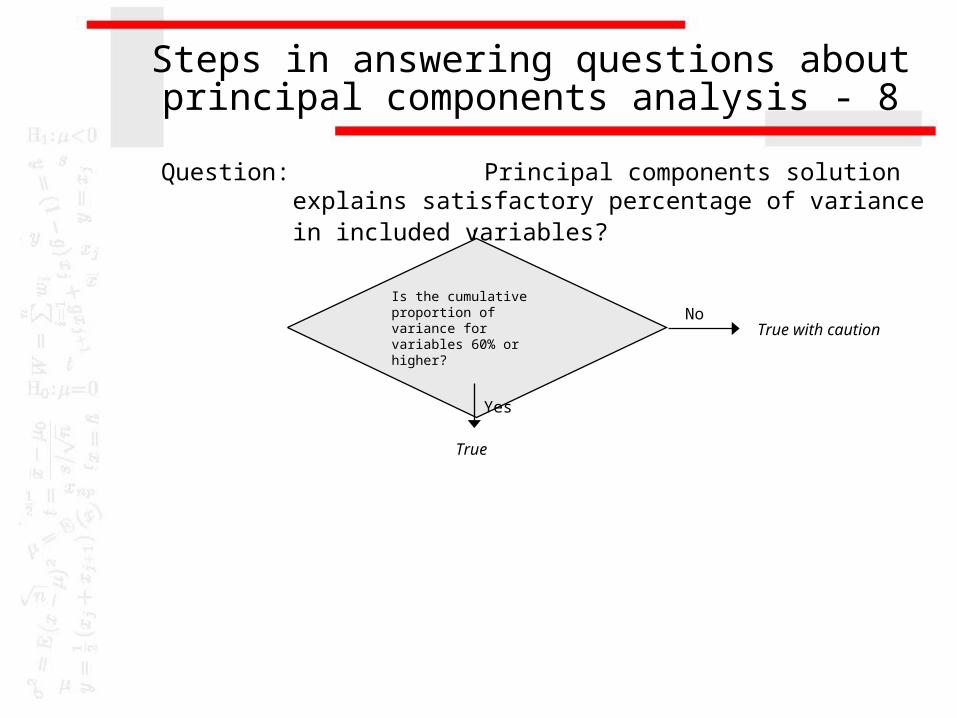
Steps in answering questions about principal components analysis - 8
Question: Principal components solution explains satisfactory percentage of variance in included variables?
True with cautionNoIs the cumulative
proportion of variance for variables 60% or higher?
Yes
True