Embed Size (px)
Citation preview

PRIMER: THE WORK TO DEFINE THE DIRECT VISION
STANDARD DR STEVE SUMMERSKILL, DR RUSSELL MARSHALL, IAIN KNIGHT, JAMES NIX
VRU-Proxi-18-03

OBJECTIVES
The aim of this presentation is to provide a succinct overview of the development of the Direct Vision Standard.
References are provided to allow access to documents that have a more detailed description.

WHY AND HOW THE DIRECT VISION STANDARD WAS
DEFINED

• Analysis of 19 truck designs highlighted large differences in direct vison performance based upon vehicle design
RESULTS TFL PROJECT 2013-2015 – EXAMPLE OF EXPLORING THE IMPORTANT DESIGN VARIABLES
WHY AND HOW THE LONDON DIRECT VISION STANDARD WAS DEFINED
CONCERN ABOUT THE NUMBER OF ACCIDENTS IN LONDON: ACCIDENT DATA ANALYSIS SUPPORTING THE REQUIREMENT
FOR A DVS
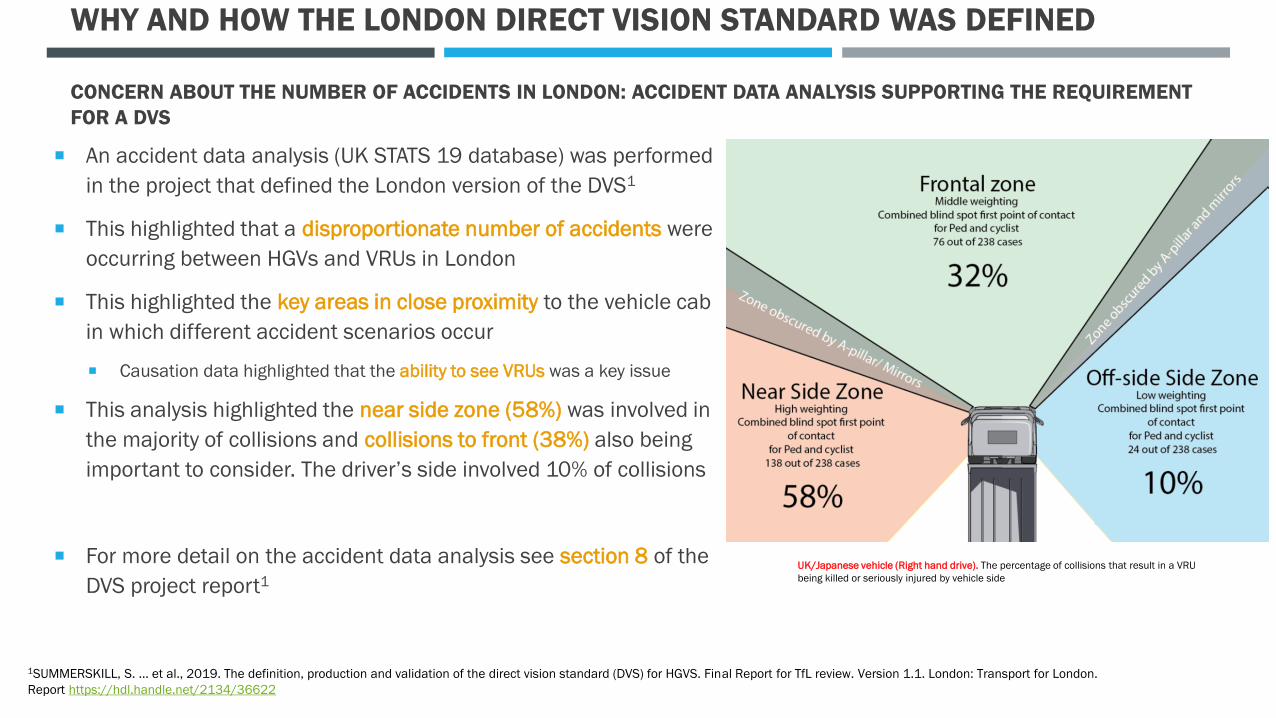
An accident data analysis (UK STATS 19 database) was performed
in the project that defined the London version of the DVS1
This highlighted that a disproportionate number of accidents were
occurring between HGVs and VRUs in London
This highlighted the key areas in close proximity to the vehicle cab
in which different accident scenarios occur
Causation data highlighted that the ability to see VRUs was a key issue
This analysis highlighted the near side zone (58%) was involved in
the majority of collisions and collisions to front (38%) also being
important to consider. The driver’s side involved 10% of collisions
For more detail on the accident data analysis see section 8 of the
DVS project report1
UK/Japanese vehicle (Right hand drive). The percentage of collisions that result in a VRU
being killed or seriously injured by vehicle side
1SUMMERSKILL, S. ... et al., 2019. The definition, production and validation of the direct vision standard (DVS) for HGVS. Final Report for TfL review. Version 1.1. London: Transport for London.
Report https://hdl.handle.net/2134/36622

WHY AND HOW THE LONDON DIRECT VISION STANDARD WAS DEFINED
ACCIDENT DATA ANALYSIS SUPPORTING THE REQUIREMENT FOR A DVS - CAUSATION DATA
National causation data for the top 90% of accidents with
pedestrians and HGVs above 7.5 tonnes (2010 – 2015)
No. of accidents Causation category
284 Failed to look properly
125 Vehicle blind spot105 Poor turn or manoeuvre
101 Passing too close to cyclist
80 Careless
50 Failed to judge other person’s path or speed
39 Other – Please specify below
31 Overloaded or poorly loaded vehicle or trailer
26 Stationary or parked vehicle(s)
23 Road layout (eg. bend
12 Temporary road layout (eg. contraflow)
12 Vehicle travelling along pavement
11 Disobeyed pedestrian crossing facility
11 Junction restart (moving off at junction)
10 Travelling too fast for conditions
Causation data for the top 95% of accidents with
and HGVs above 7.5 tonnes (2010 – 2015)
No. of accidents Causation category
723 Failed to look properly357 Failed to judge other person’s path or speed
321 Passing too close to cyclist horse rider or pedestrian
257 Poor turn or manoeuvre
219 Careless reckless or in a hurry
159 Vehicle blind spot77 Loss of control
58 Cyclist entering road from pavement
39 Cyclist wearing dark clothing at night
36 Following too close
34 Other – Please specify below
33 Swerved
28 Road layout (eg. Bend hill narrow carriageway)
27 Junction restart (moving off at junction)
26 Vehicle door opened or closed negligently
24 Travelling too fast for conditions
23 Not displaying lights at night or in poor visibility
22 Failed to signal or misleading signal
21 Dazzling sun
19 Disobeyed 'Give Way' or 'Stop' sign or markings
18 Impaired by alcohol
17 Sudden braking
16 Stationary or parked vehicle(s)
16 Slippery road (due to weather)
16 Disobeyed automatic traffic signal
15 Nervous uncertain or panic
15 Aggressive driving
12 Rain sleet snowor fog
11 Vehicle travelling along pavement
10 Junction overshoot
10 Learner or inexperienced driver/rider
10 Poor or defective road surface
10 Fatigue

Accidents to the passenger side mostly involved cyclists on
the passenger side and the truck turning left
Accidents to the front mostly involved pedestrians being hit
when the vehicle pulled away from stand still
The pedestrians involved are mostly over the age of 65
The cyclists are younger as one might expect.
WHY AND HOW THE LONDON DIRECT VISION STANDARD WAS DEFINED
ACCIDENT DATA ANALYSIS SUPPORTING THE REQUIREMENT FOR A DVS

WHY AND HOW THE LONDON DIRECT VISION STANDARD WAS DEFINED
THE VOLUMETRIC METHOD
The assessment method that has been defined in the London DVS, and adopted in the UNECE version involves the simple premise of constructing a volume of space around the vehicle (assessment volume) which is defined by the area of greatest risk
The proportion of this volume that can be seen directly from a standardised set of eye points defines a score for the vehicle.
The more that can be seen, the better the vehicle in terms of direct vision.
The principle is that making any volume within this assessment volume visible in direct vision has a safety benefit and should be encouraged. This based upon issues with using multiple mirrors to gain situational awareness.
Hence Volume is proposed as the sole metric for measuring direct vision performance. It rewards all innovations that result in more direct vision in a safety critical zone close to the vehicle. It is accurate with high resolution.
For more detail on the Volumetric method including the definition of the standardised eye point rig please the following
UNECE WIKI of meeting records from the UNECE VRU Proxy Working Group. See meeting 6, first presentation from LDS https://wiki.unece.org/display/trans/VRU-Proxi+6th+session
Section 9.4. Project report. SUMMERSKILL, S. ... et al., 2019. The definition, production and validation of the direct vision standard (DVS) for HGVS. Final Report for TfL review. Version 1.1. London: Transport for London. Report https://hdl.handle.net/2134/36622
For more detail on the physical test method see the following presentation. UNECE WIKI of meeting records from the UNECE VRU Proxy Working Group. Meeting 15, presentation of testing results for the physical method. https://wiki.unece.org/download/attachments/109347936/VRU-Proxi-15-02%20Rev1%20%28LDS%29%20LDS%20Presentation%20-%20%20UNECE%20VRU%20PROXI%2014th%20meeting_DraftV2.pptx?api=v2
UK/Japanese vehicle (Right hand drive). The plan view of
the assessment volume showing the coverage matches the
class V & VI mirrors on the passenger side and front. A 2m
zone has been added to the driver’s side. This is mirrored
for left hand drive vehicles
How the Direct Vision Standard defines the volume of the
assessment volume that is visible to the driver
WHY AND HOW THE LONDON DIRECT VISION STANDARD WAS DEFINED
STANDARDISED EYE POINT
Cab design Assessment volume aligned to the cab
The visible volumes through windows are created
The visible volumes are intersected with the assessment volume
The volume of the assessment volume that is visible is the
performance metric
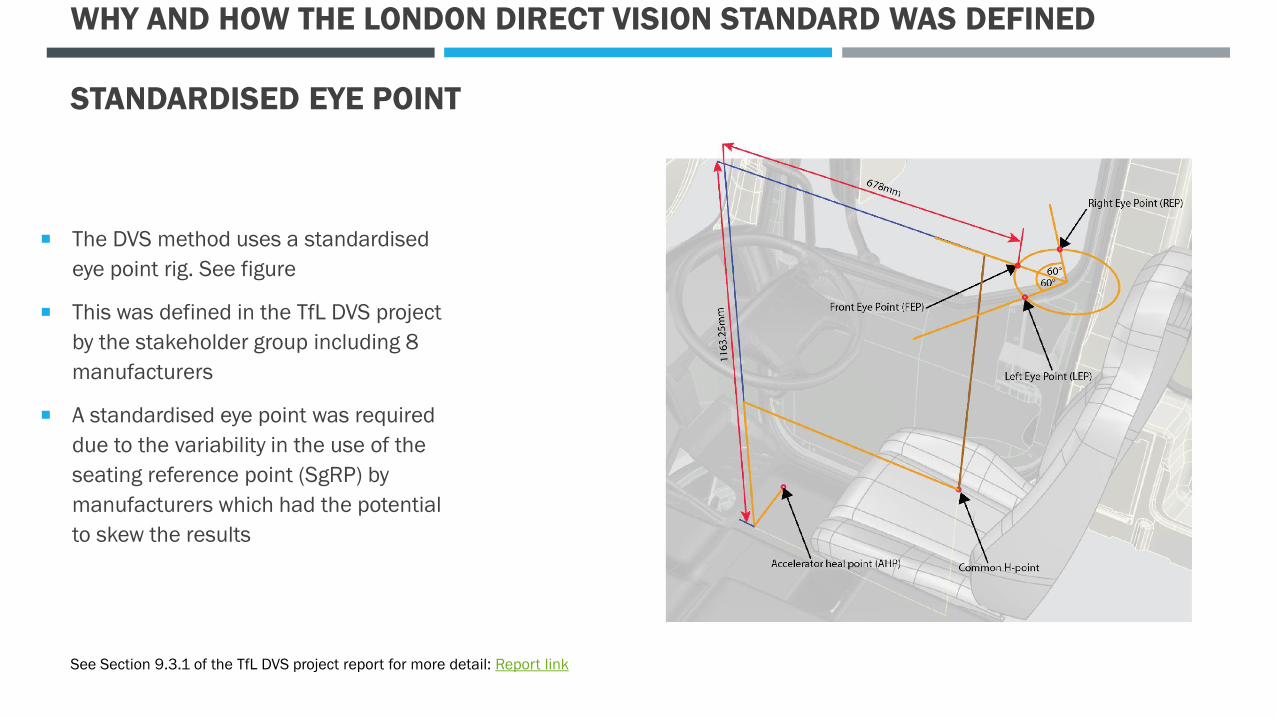
The DVS method uses a standardised
eye point rig. See figure
This was defined in the TfL DVS project
by the stakeholder group including 8
manufacturers
A standardised eye point was required
due to the variability in the use of the
seating reference point (SgRP) by
manufacturers which had the potential
to skew the results
See Section 9.3.1 of the TfL DVS project report for more detail: Report link

THE VOLUMETRIC METHOD – WORKED EXAMPLE RESULTS
The simulated driver can see 2.4m3 or 4.65% of the
assessment volume where the majority of this volume
is seen to the driver’s side which is the area of least
risk
Cab design Assessment volume aligned to the cab
The visible volumes through windows are created
The visible volumes are intersected with the assessment volume
The volume of the assessment volume that is visible is the
performance metric

THE VOLUMETRIC METHOD
The graph shows the range of
volumetric performance in 52
examples of highest or lowest
mounting positions across a range of
make models
The size of the assessment volume
varies by cab width, a 2.5m wide cab
will have assessment volume of
approx. 50m3
Note: In the London DVS cab designs were assessed at the
maximum possible height (H) and minimum possible height
(L) for that model. See graph. This was not weighted by sales
or freight sector. So, 7 of 52 (13%) specifications assessed
had volumes of less than 5m3 but this does not mean 13%
of vehicles on the road have this level of visibility

HOW DO WE GIVE CONTEXT FOR THE ABSTRACT
VOLUMETRIC SCORE? Using simulations of VRU distance, i.e. the distance away from the cab that a number of VRU simulations are located at whilst just
allowing the head and neck to be visible.

WHY DO WE USE VRU DISTANCE?
Considered in isolation, volumetric scores are abstract
A need was perceived for a simplified measure to help illustrate what
the visible volumes related to in terms of something more visibly
related to safety
Following a methodology originally applied in projects from 20112 and
20153 a set of VRU simulations were created which allows VRU
visibility to be assessed at 13 points around the vehicle.
The figure shows the arrangement of the VRUs around the cab.
2 COOK, S., SUMMERSKILL, S., MARSHALL. R., ... et al., 2011. The development of improvements to drivers' direct and indirect vision from vehicles - phase 2. Report for Department for
Transport DfT TTS Project Ref: S0906 / V8. Loughborough: Loughborough University and MIRA Ltd. See section 2.5 https://hdl.handle.net/2134/8873
3SUMMERSKILL, S. Marshall, R; Paterson, A; Reed, S (2015): Understanding direct and indirect driver vision in heavy goods vehicles. Report. https://hdl.handle.net/2134/21028

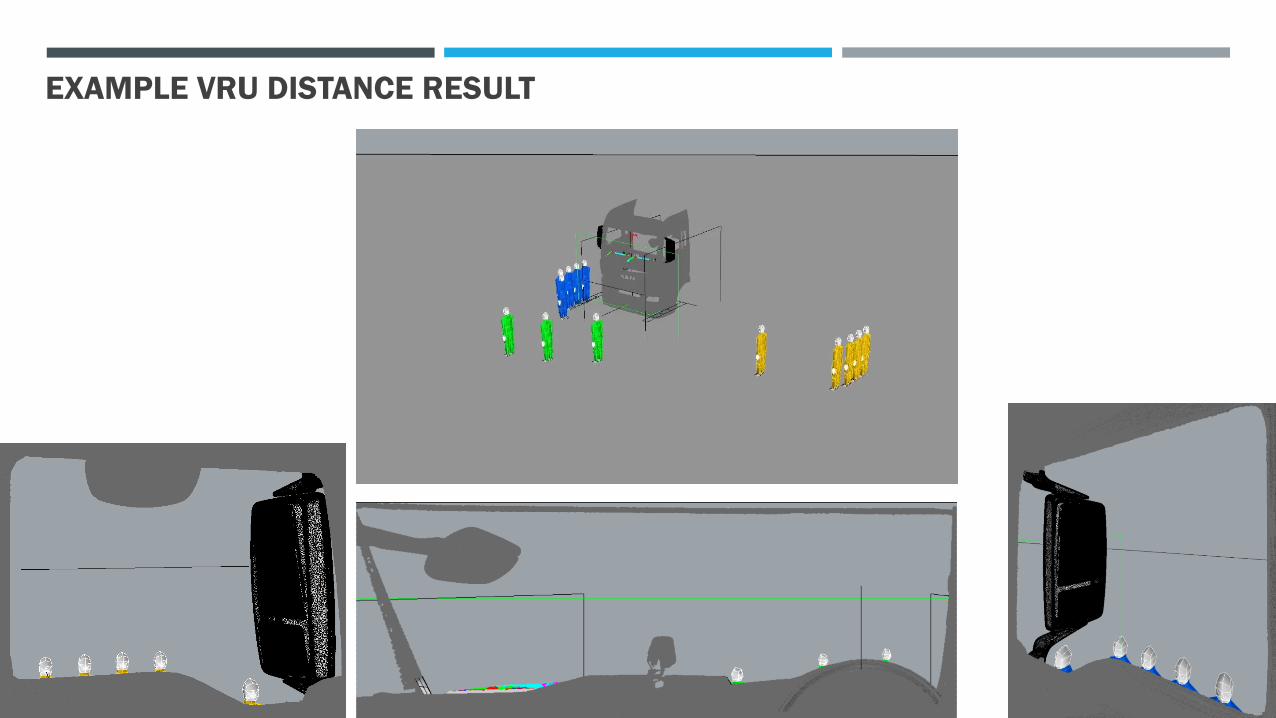
HOW ARE THE VRU SIMULATIONS DEFINED AND USED
As per the diagram, an array of VRU simulations is arranged
around the vehicle using a consistent method. Each VRU is
then moved away from the side of the truck in one axis only
The portion of the VRU that must be visible was originally
proposed as head and shoulders but head and neck is now
agreed
This is followed by example results for the VRU distances
2COOK, S., SUMMERSKILL, S., MARSHALL. R., ... et al., 2011. The development of improvements to drivers' direct and indirect vision from vehicles - phase 2. Report for Department for
Transport DfT TTS Project Ref: S0906 / V8. Loughborough: Loughborough University and MIRA Ltd. See section 2.5 https://hdl.handle.net/2134/8873
3SUMMERSKILL, S. Marshall, R; Paterson, A; Reed, S (2015): Understanding direct and indirect driver vision in heavy goods vehicles. Report. https://hdl.handle.net/2134/21028

EXAMPLE VRU DISTANCE RESULT
The bottom images shows the placement of the VRU simulations
to the front and sides of the vehicle for head and neck visibility
from the simulated eyepoint.
Top right shows a plan view of VRU positions
EXAMPLE VRU DISTANCE RESULT

• There has been a consistent misunderstanding where it has been assumed that changing the average VRU distances changes the assessment volume
• This is not the case. Changing the average VRU distance changes the amount of the assessment volume that must be seen in the DVS test
THE USE OF VRU SIMULATIONS (5TH%ILE ITALIAN FEMALE)

5 star 3 star EMSR ZERO Star 1 star2 star
• Note: average VRU distance to any one side (e.g. front) set at the mirror boundary does
not guarantee elimination of blind spots between direct and indirect vision.
• One VRU at the front may be invisible in both direct and indirect vision provided others
are visible sufficiently far inside the mirror boundary for the average to be equal to 2m or
less
EXAMPLE VRU DISTANCES FOR VEHICLES IN THE STAR BOUNDARY CATEGORIES
(NEW VERSION, HEAD & NECK ONLY VISIBLE) TFL VERSION
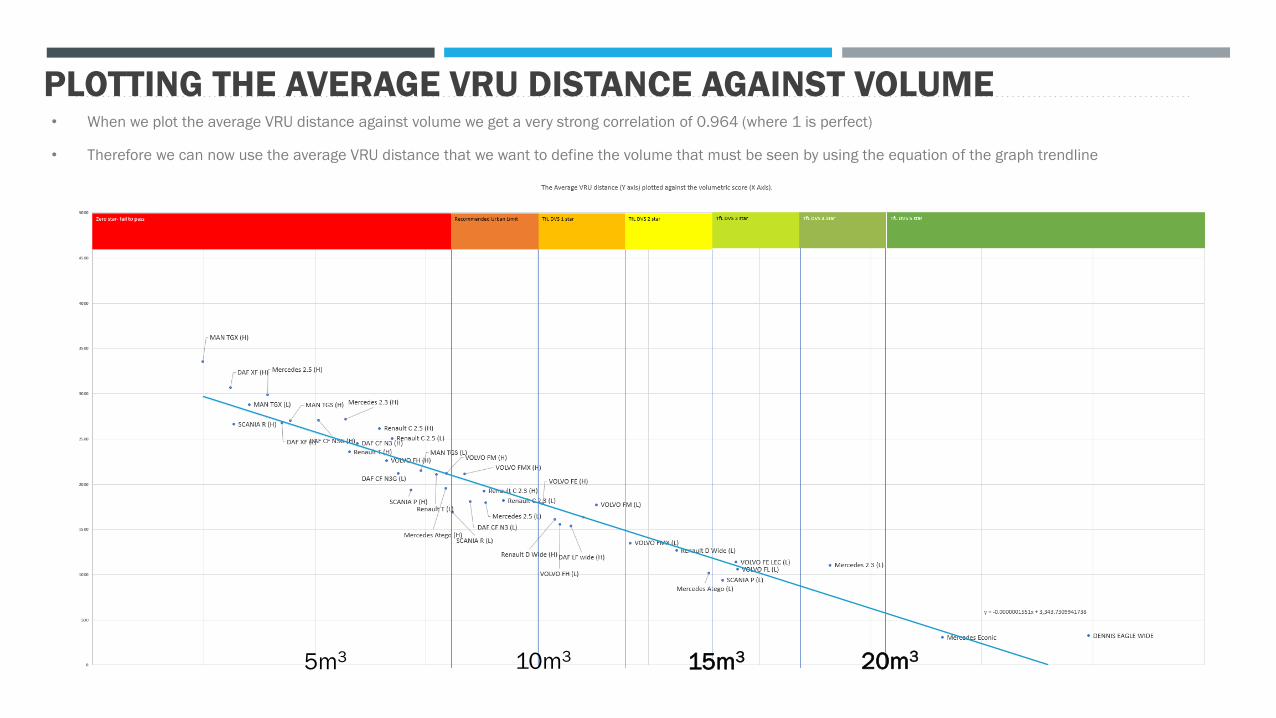
• When we plot the average VRU distance against volume we get a very strong correlation of 0.964 (where 1 is perfect)
PLOTTING THE AVERAGE VRU DISTANCE AGAINST VOLUME
5m3 15m310m3 20m3
• Therefore we can now use the average VRU distance that we want to define the volume that must be seen by using the equation of the graph trendline

• The accident data highlights that ‘not seeing’ is the main causation factor for accidents
• And yet the mirrors cover the area in close proximity to the vehicle in a comprehensive manner
• A study by the UK DfT highlighted that the mandatory introduction of the Class VI mirror which covered
the front of the vehicle has not reduced accidents when the vehicle pulls away from a crossing or
junction
• A driver must use 6 mirrors (indirect vision) and the windows (direct vision) to gain situational
awareness. In some scenarios we suggest that this is too challenging
• A study by Leeds University highlighted that indirect vision increases reaction time by 0.7 seconds
compared to direct vision
• Therefore in our view the DIRECT VISION blind spot is any area currently covered by a mirror in close
proximity to the vehicle cab
• We therefore want to see minimum volume requirements which allow as much direct vision of the area
of greatest risk, or the assessment volume as possible which is defined by the VRU distance
• ACEA present the idea that indirect vision can supplement direct vision – we disagree due to the points
above.
• Also see the next slide
WHAT IS A BLIND SPOT? OUR VIEW

WHAT IS A BLIND SPOT?
• A row of VRU simulations
• 5th%ile Italian female
• VRUs inside the class VI mirror
zone (yellow area)
• Class VI mirror covers the
required zone (UNECE reg 46)
• VRUs can’t be seen through
direct vision from a
standardised seating posture
• Only a small portion of VRUs
are visible at edge of a mirror
with radius of curvature of
300mm (distorted image)
• Therefore we do not find it
acceptable to say that VRUs
can be at the edge of the
mirror coverage zone and can
effectively be seen through
indirect vision
• The VRU distance should be
closer to the cab than 2m in
our view

WHAT IS A BLIND SPOT?
• We therefore want to see minimum volume requirements which
allow as much direct vision of the area of greatest risk, or the
assessment volume, as possible.
• This is defined by the VRU distance

COMBINED OR SEPARATED APPROACH? The London DVS used a combined approach.
The combined approach would allow the required visible volume to be gained from any side of the vehicle BUT a manufacturer may improve
performance substantially to the driver and passenger sides by replacing mirrors with a camera system, but make no improvements to the front
visibility as long as the total volume requirement is met. This may leave an area to the front of the vehicle where VRUs are visible in neither direct
or indirect vision. Evidence for this has been shown in a number of VRU Proxi meetings (14 and 16)
A separated approach has been defined to avoid a situation where vehicles still have blind spots to the front. The separated approach would
require a minimum requirement to be met for each side individually, potentially requiring improved vehicle designs to the front. See right hand
figure below

HYBRID APPROACH
A hybrid approach has therefore been suggested which requires a specific amount of visible volume to the front to counter the issue of the
combined approach
ACEA have stated that the current method of defining the volumes to the front, left and right (the A-pillars as separators) is not technology neutral
and therefore the separated approach in the current form is not acceptable
i.e. a design which uses a tapered front end with closer a-pillars would be penalised as the inter A-pillar distance would be smaller and therefore one would see less of the
assessment volume through the front window.
We agree. Therefore we have offered to look at the definition of the front volume in a new way to avoid this problem
If this work is not done to redefine how the assessment volume is seen, there are two options available
1. Use the combined approach which we are against
2. Use the separated approach which ACEA are against
CPs will have the choice
This is covered in the T&E proposal from the 17th meeting of the VRU Proxi group.
The End.