Embed Size (px)
Citation preview

Version 2.0 – 20th September 2017 1
Catalogue
Version 2.0
20th September 2017
PRIME Key Performance Indicators for performance benchmarking
Version 2.0, 20th September 2017 PRIME – Platform of Railway Infrastructure Managers in Europe

Version 2.0 – 20th September 2017 2
Contents
1. Introduction ......................................................................................................................................... 3
2. Background .......................................................................................................................................... 3
3. PRIME KPI system ................................................................................................................................. 4
4. Performance Indicators ........................................................................................................................ 9
Context ........................................................................................................................... 9
Safety, Security & Environment .................................................................................... 10
Performance ................................................................................................................. 13
Delivery ........................................................................................................................ 16
Financial ....................................................................................................................... 18
Growth .......................................................................................................................... 21
Appendix 1: Data items .............................................................................................................................. 24
Context ......................................................................................................................... 24
Safety, Security & Environment .................................................................................... 24
Performance ................................................................................................................. 26
Delivery ........................................................................................................................ 30
Financial ....................................................................................................................... 31
Growth .......................................................................................................................... 33
Appendix 2: Background information ......................................................................................................... 35
Appendix 3: Causes for delays and cancelled services ................................................................................ 45
Appendix 4: Charges for using the infrastructure and related services ........................................................ 46
Appendix 5: Glossary of terms.................................................................................................................... 48
3
1. Introduction This Catalogue contains a clear and concise documentation of the PRIME (Platform of Rail Infrastructure Managers in Europe) key performance indicators (KPIs) and their definitions, set out in a structured and prioritised way following the concept of the balanced scorecard.
The KPIs have been developed over a three year period, in a consultative manner with all of the participant Infrastructure Managers and tested in 3 pilot exercises.
The KPIs set out in this version of the KPI Catalogue are those agreed at the most recent PRIME KPI Sub Group meeting. These KPIs will be fixed for use in the initial Dashboard tool, but it is expected that they will be developed further and improved on a regular basis in the future.
2. Background PRIME is a forum composed of rail infrastructure managers from EU Member States and EFTA states, and the European Commission. The European Union Agency for Railways and industry associations participate as observers. PRIME fulfils the tasks of the European Network of Infrastructure Managers as provided for in Article 7f of Directive 2012/34/EU1. Its objective is to cooperate with a view to facilitating the provision of efficient and effective rail services within the Union, including performance monitoring and best practice benchmarking. It also serves as an "early warning mechanism" for infrastructure managers to alert the European Commission on the main challenges and advise the Commission on both operational and regulatory activities. The work of PRIME should lead towards a better mutual understanding between Infrastructure Managers (IMs) and the Commission, as well as better services to the customers of IMs and a better functioning European network.
The added value for using common KPIs and performance benchmarking is;
· As a learning and improvement tool for railway IMs. · KPIs provide a better understanding of the costs associated with each process and underlying
reasons. · Cross-sectional benchmarking enables to compare performance with the aim to identify
performance gaps and learn. · More informed management decisions can be taken in comparison to peers. · Access to data can be used to support negotiations with public authorities and trade unions,
and it also be used for engagement with regulators. · Provides evidence to monitor whether national or EU policies are working or not. · Is a communication tool vis-à-vis customers and business partners to indicate trends (if you
can’t measure results, you can’t tell success from failure!)
An additional important outcome of the PRIME KPI work is a good quality, comparable and easily accessible, cross-sector, dataset.
1 Directive 2012/34/EU of the European Parliament and of the Council of 21 November 2012 establishing a single
European railway area, as amended by Directive (EU) 2016/2370.

4
Objectives The ultimate objective of developing KPIs and benchmarking practices is to enhance the performance and business development of IMs. The developed KPIs will support the IMs in:
· Providing a foundation for benchmarking. · Supporting exchange of best practice. · Increasing performance of IMs.
The KPIs that are suggested should be beneficial for both the IMs and the industry at large. Some further guidelines for the work has been to:
· Focus on business development for the IMs. · Keep it simple. · Clear definitions. · Avoid duplications of existing work and reuse.
3. PRIME KPI system In establishing the KPI system for the PRIME IMs it was important to create a consistent and integrated set of indicators which reflects all relevant aspects of an IM’s operations.
It was essential in developing the indicators to be absolutely clear about their purpose: in the case of PRIME, the ultimate objective of the project to develop KPIs and benchmarking practices is to enhance the performance and business development of each IM2. The PRIME KPI system will support this overall objective by addressing all aspects of an IM’s business, with a comprehensive but balanced set of performance dimensions.
The choice of KPIs reflects the needs and key decisions to be made by each individual IM. Many of the key decisions, for example around maintenance strategy or operational efficiencies, will be common to most if not all IMs. Therefore the KPI system, in reflecting all parts of an IM’s operations and wider business, addresses the key decision making areas for an IM. The value of the KPI system is in providing each IM with a structured set of indicators which allows each of them to understand its business and its performance in relation to the other IMs.
Each of the IMs has its own priorities and the importance of different decisions will vary within the group. All IMs also have their own set of management metrics and performance indicators, used to manage their own business. The common set of indicators which has been developed by the PRIME sub-group, whilst almost certainly overlapping considerably with each IM’s own set of management metrics, provides a common set of indicators and definitions, which allows good, clear and robust comparisons between IMs and enables benchmarking if desired.
Whilst different performance indicators have varying priority for the different IMs, there is a core of indicators - Key Performance Indicators (KPIs) - which are of common interest and value to all IMs. It is also beneficial to the process of benchmarking to define a common set of core indicators which
2 J. Pettersson, General Presentation RU Dialogue PRIME - KPIs and benchmarking, Vienna, June 2016

5
can be used consistently and on an ongoing basis for robust comparisons between the IMs. A wider set of indicators can be used for their own purposes by individual IMs, as they require. To achieve this, the PRIME performance indicator framework is tiered into a hierarchy which includes a relatively small set of KPIs distributed into a primary ‘High Level Industry’ Dashboard and a secondary ‘Benchmarking’ Dashboard, as well as a wider set of other Performance Indicators (PIs) and other supporting data. This is illustrated in Figure 1 below.
Figure 1. PRIME performance indicator hierarchy
Data collected by IMs will be used to support all four levels of the hierarchy, but it will be clustered and presented in different ways. The ‘High Level Industry’ KPIs provide a small set of high level KPIs for use by the High Level Industry team of each IM. A wider set of KPIs, covering all aspects of the IM’s business, is available for use by the benchmarking teams in each IM. Both of these groupings of KPIs are presented in the PRIME dashboard tool, which is available online and will be updated on an annual basis. The full set of performance indicators, supporting indicators and data is available for use by active participants in the PRIME benchmarking activities in the form of simple reports.
Dashboard structure
In order to be effective and useful to the management of the IMs, the indicators, in particular the KPIs included in the two dashboards, are aligned as far as possible with the decision making processes of the IMs. This requires that they are aligned not with the organisational structure of the IMs but with the key strategic decisions that an IM is likely to have to make. The PRIME dashboards have been developed with a common structure, for use as a benchmark tool between IMs, but it it is envisaged and hoped that individual IMs will develop linkages between the common PRIME dashboards and their own management KPIs and management scorecards.
Typically a management performance scorecard reflects the high level objectives of the organisation, along the line of which success or failure is defined. Very often for a private sector organisation, this aligns with long or short term shareholder value. For a railway infrastructure manager this definition of ‘success’ has a much broader and more complex definition.
The KPI structure defined for the PRIME project is based on the well-known Balanced Scorecard, developed by the American academics Robert Kaplan and David Norton, and published in the
6
Harvard Business Review in 19923. This concept has been developed further over the years in different sectors, and additional dimensions have been added and amended to reflect the needs and priorities of different sectors and different organisations.
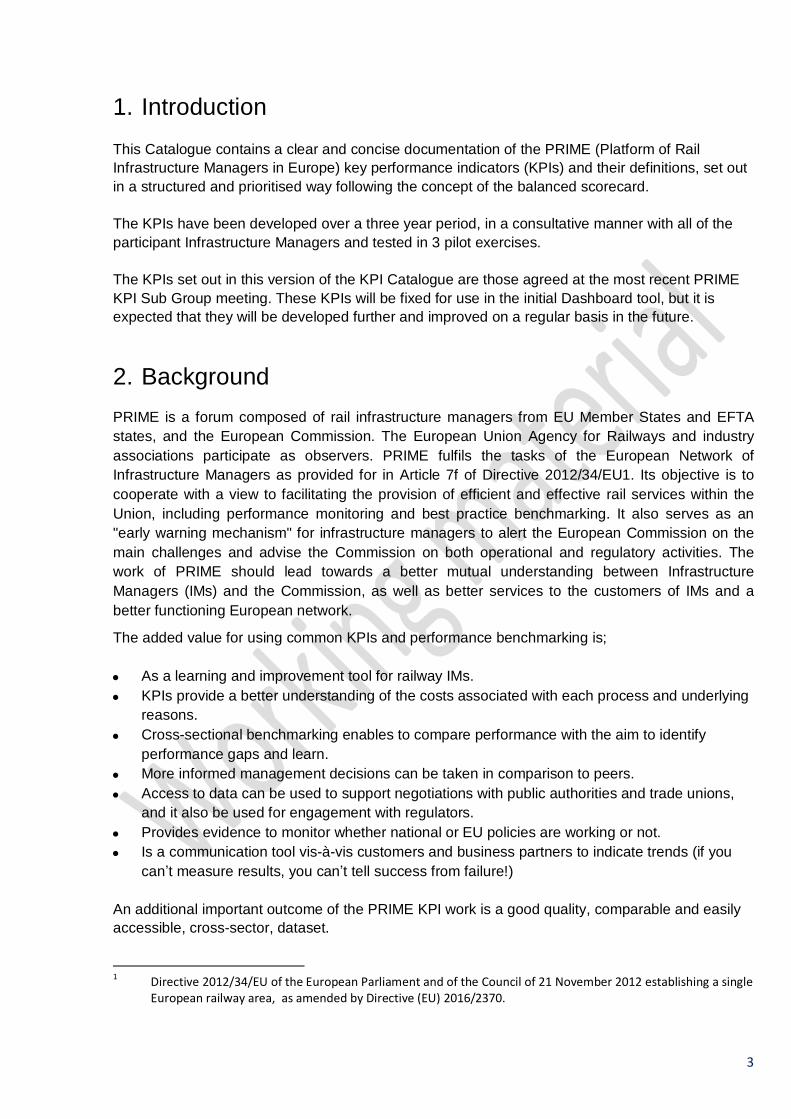
The PRIME KPI structure, which reflects the needs and priorities of a railway IM has five dimensions, as illustrated in Figure 2 below. These five dimensions reflect the activities and outputs of a railway IM, and the needs and demands of its stakeholders and customers.
Figure 2. PRIME Scorecard Dimensions
· Safety & Environment – the management and delivery of safety, security and environmental behaviours and standards.
· Performance – the performance of the IM’s assets and network and resulting impact on operators and customers.
· Delivery – the effectiveness of the IM’s internal processes and management of the IMs assets and provision of a fit for purpose network, including the delivery of contractors and suppliers.
· Financial – the financial performance of the IM, including its cost effectiveness and revenues, including track access charges.
· Growth – the level of use of the existing network, network improvement and expansion, integration with other transport modes and use of technology to improve delivery.
In addition to the five scorecard dimensions, a small number of indicators have been included to provided context to the other dimensions. ‘Context’ provides an overview of the characteristics of each IM and background on the size, relative significance and the market for railway services in each country. This provides useful background to understand the structural differences between the railways, particularly when interpreting other KPIs.
3 R.S. Kaplan and D.P. Norton, The Balanced Scorecard: Measures that Drive Performance, Harvard Business Review. 1992
7
The KPI structure is aligned specifically to these dimensions, as these are dimensions which reflect management objectives and decision making, rather than reflecting specific functions or capabilities. For example, the scorecard could have focused on dimensions such as customer, staff, stakeholders, however good management does not focus directly on these parties, but rather on how it delivers to each of these parties. Management focus on its customers, reflects the customers’ needs and priorities, through safety and security, availability, punctuality and performance and charges. Stakeholders needs are met through, for example, safety and environment, performance and growth.
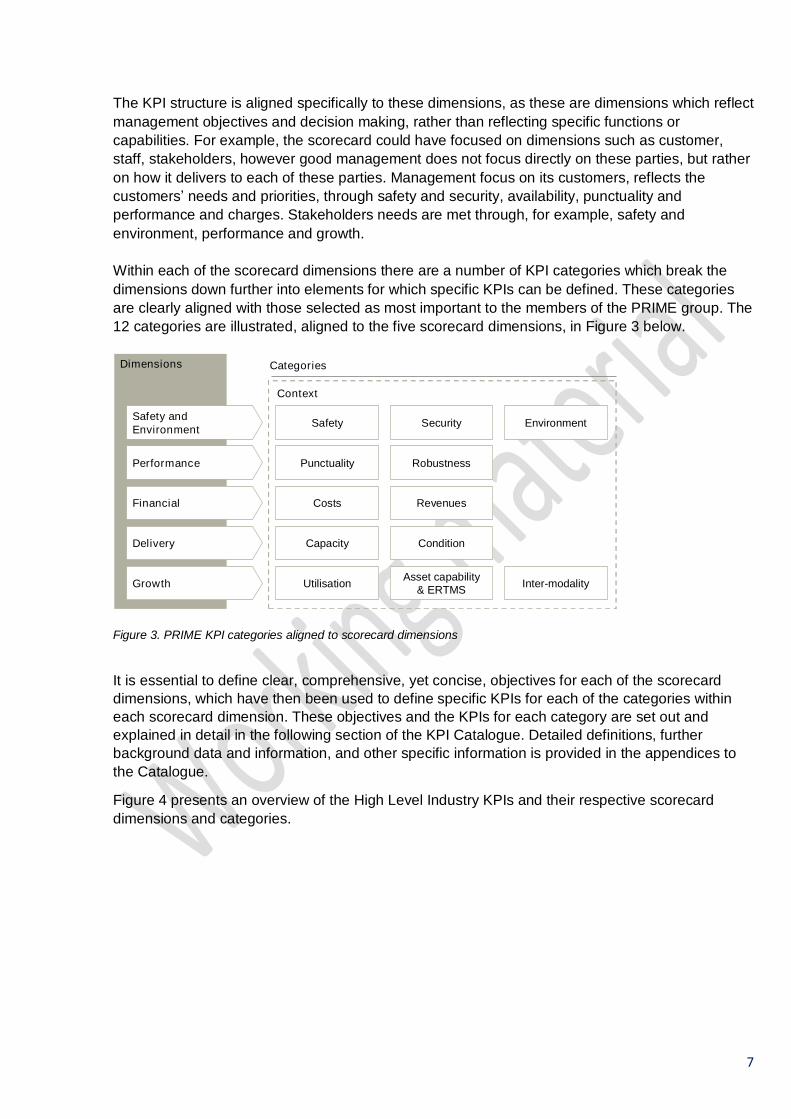
Within each of the scorecard dimensions there are a number of KPI categories which break the dimensions down further into elements for which specific KPIs can be defined. These categories are clearly aligned with those selected as most important to the members of the PRIME group. The 12 categories are illustrated, aligned to the five scorecard dimensions, in Figure 3 below.
Figure 3. PRIME KPI categories aligned to scorecard dimensions
It is essential to define clear, comprehensive, yet concise, objectives for each of the scorecard dimensions, which have then been used to define specific KPIs for each of the categories within each scorecard dimension. These objectives and the KPIs for each category are set out and explained in detail in the following section of the KPI Catalogue. Detailed definitions, further background data and information, and other specific information is provided in the appendices to the Catalogue.
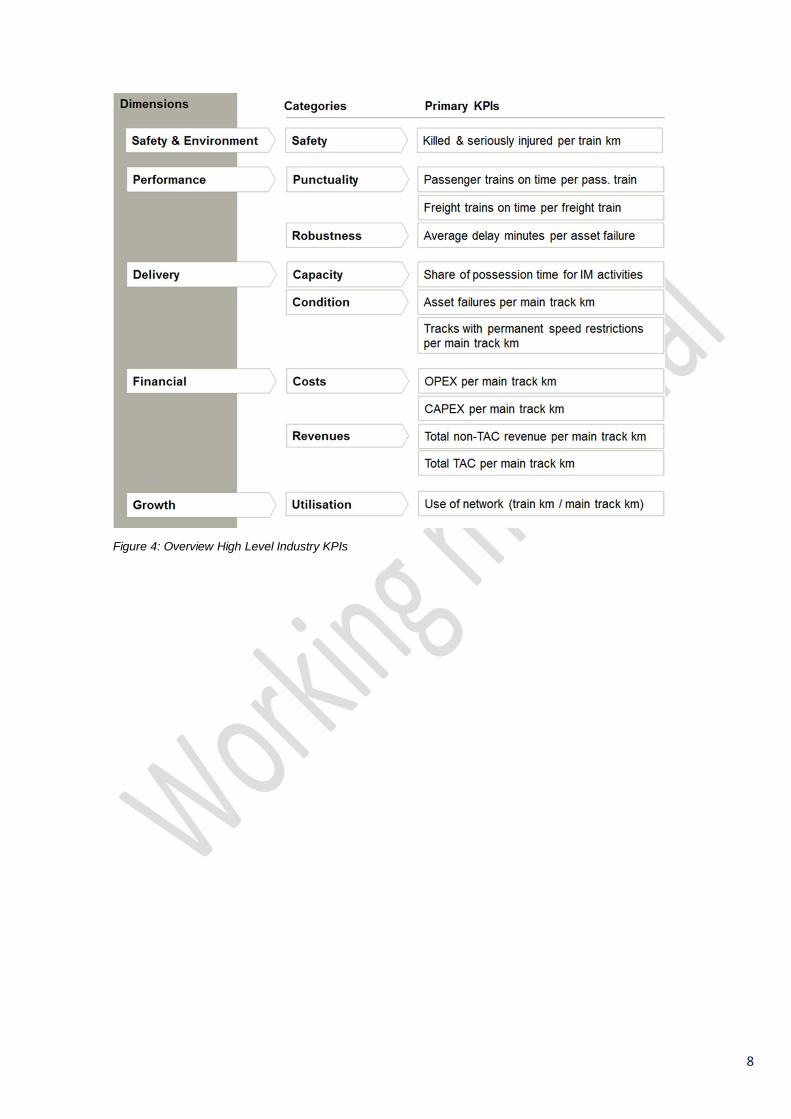
Figure 4 presents an overview of the High Level Industry KPIs and their respective scorecard dimensions and categories.
Dimensions
Performance Punctuality Robustness
Delivery Capacity Condition
Financial Costs Revenues
Safety and Environment Safety Security Environment
Categories
Growth Utilisation Asset capability & ERTMS Inter-modality
Context
8
Figure 4: Overview High Level Industry KPIs
9
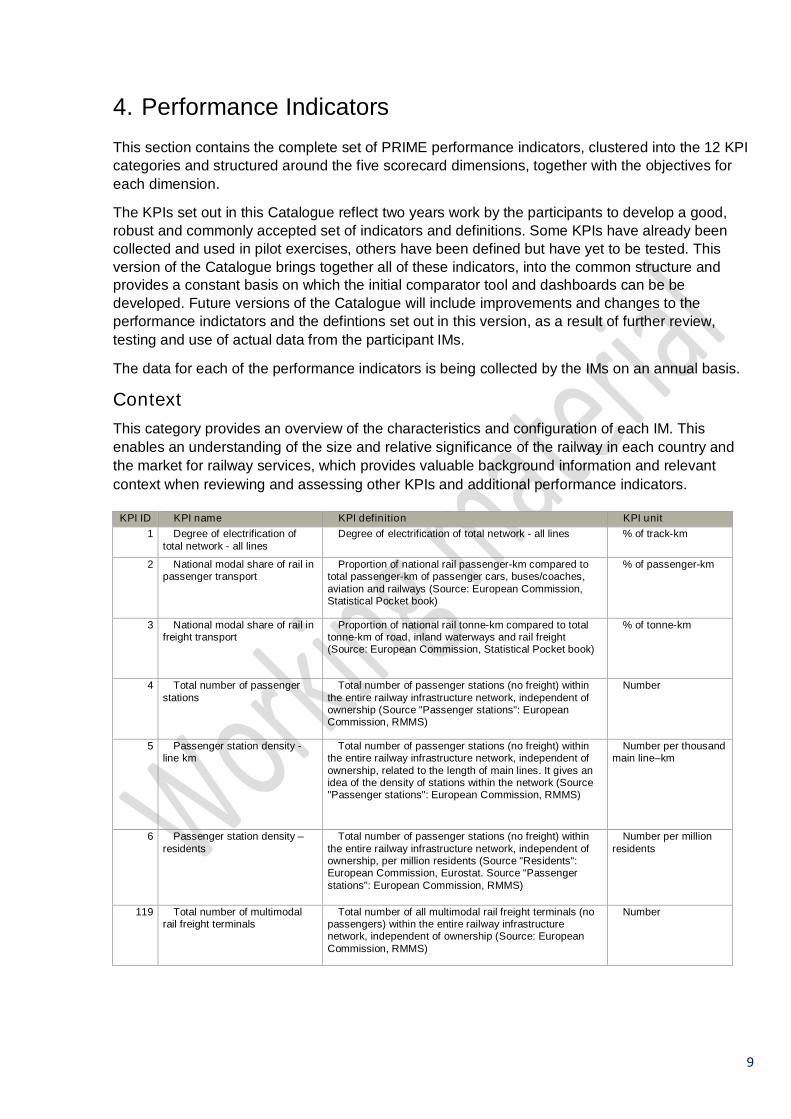
4. Performance Indicators This section contains the complete set of PRIME performance indicators, clustered into the 12 KPI categories and structured around the five scorecard dimensions, together with the objectives for each dimension.
The KPIs set out in this Catalogue reflect two years work by the participants to develop a good, robust and commonly accepted set of indicators and definitions. Some KPIs have already been collected and used in pilot exercises, others have been defined but have yet to be tested. This version of the Catalogue brings together all of these indicators, into the common structure and provides a constant basis on which the initial comparator tool and dashboards can be be developed. Future versions of the Catalogue will include improvements and changes to the performance indictators and the defintions set out in this version, as a result of further review, testing and use of actual data from the participant IMs.
The data for each of the performance indicators is being collected by the IMs on an annual basis.
Context This category provides an overview of the characteristics and configuration of each IM. This enables an understanding of the size and relative significance of the railway in each country and the market for railway services, which provides valuable background information and relevant context when reviewing and assessing other KPIs and additional performance indicators.
KPI ID KPI name KPI definition KPI unit 1 Degree of electrification of
total network - all lines Degree of electrification of total network - all lines % of track-km
2 National modal share of rail in passenger transport
Proportion of national rail passenger-km compared to total passenger-km of passenger cars, buses/coaches, aviation and railways (Source: European Commission, Statistical Pocket book)
% of passenger-km
3 National modal share of rail in freight transport
Proportion of national rail tonne-km compared to total tonne-km of road, inland waterways and rail freight (Source: European Commission, Statistical Pocket book)
% of tonne-km
4 Total number of passenger stations
Total number of passenger stations (no freight) within the entire railway infrastructure network, independent of ownership (Source "Passenger stations": European Commission, RMMS)
Number
5 Passenger station density - line km
Total number of passenger stations (no freight) within the entire railway infrastructure network, independent of ownership, related to the length of main lines. It gives an idea of the density of stations within the network (Source "Passenger stations": European Commission, RMMS)
Number per thousand main line–km
6 Passenger station density – residents
Total number of passenger stations (no freight) within the entire railway infrastructure network, independent of ownership, per million residents (Source "Residents": European Commission, Eurostat. Source "Passenger stations": European Commission, RMMS)
Number per million residents
119 Total number of multimodal rail freight terminals
Total number of all multimodal rail freight terminals (no passengers) within the entire railway infrastructure network, independent of ownership (Source: European Commission, RMMS)
Number
10
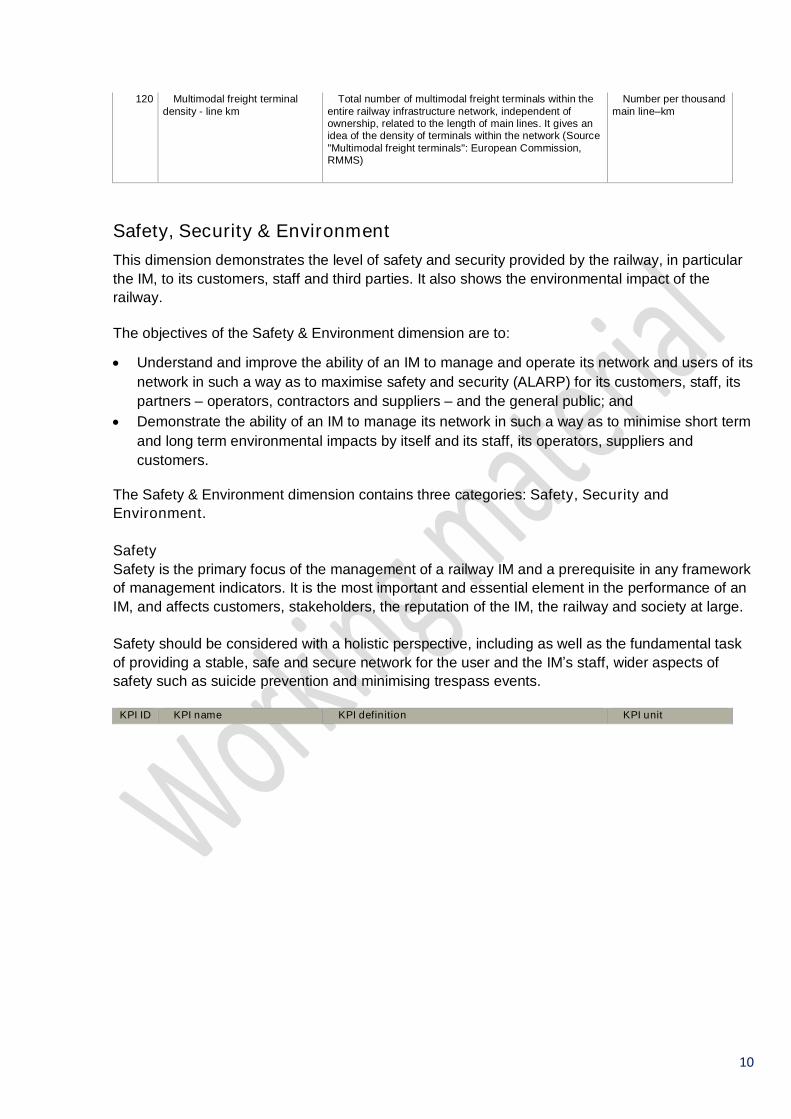
120 Multimodal freight terminal density - line km
Total number of multimodal freight terminals within the entire railway infrastructure network, independent of ownership, related to the length of main lines. It gives an idea of the density of terminals within the network (Source "Multimodal freight terminals": European Commission, RMMS)
Number per thousand main line–km
Safety, Security & Environment This dimension demonstrates the level of safety and security provided by the railway, in particular the IM, to its customers, staff and third parties. It also shows the environmental impact of the railway.
The objectives of the Safety & Environment dimension are to:
· Understand and improve the ability of an IM to manage and operate its network and users of its network in such a way as to maximise safety and security (ALARP) for its customers, staff, its partners – operators, contractors and suppliers – and the general public; and
· Demonstrate the ability of an IM to manage its network in such a way as to minimise short term and long term environmental impacts by itself and its staff, its operators, suppliers and customers.
The Safety & Environment dimension contains three categories: Safety, Security and Environment.
Safety Safety is the primary focus of the management of a railway IM and a prerequisite in any framework of management indicators. It is the most important and essential element in the performance of an IM, and affects customers, stakeholders, the reputation of the IM, the railway and society at large.
Safety should be considered with a holistic perspective, including as well as the fundamental task of providing a stable, safe and secure network for the user and the IM’s staff, wider aspects of safety such as suicide prevention and minimising trespass events.
KPI ID KPI name KPI definition KPI unit

11
7 Significant accidents Relative number of significant accidents including sidings, excluding accidents in workshops, warehouses and depots based on the following types of accidents (primary accidents): - Collision of train with rail vehicle - Collision of train with obstacle within the clearance gauge - Derailment of train - Level crossing accident, including accident involving pedestrians at level crossing - Accident to persons involving rolling stock in motion, with the exception of suicides and attempted suicides - Fire on rolling stock - Other accident The boundary is the point at which the railway vehicle leaving the workshop/warehouse/depot/sidings cannot pass without having an authorization to access the mainline or other similar line. This point is usually identified by a signal. For further guidance, please see ERA Implementation Guidance on CSIs.
Number per million train-km
8 Persons seriously injured and killed
Relative number of persons seriously injured (i.e. hospitalised for more than 24 hours, excluding any attempted suicide) and killed (i.e. killed immediately or dying within 30 days, excluding any suicide) by accidents based upon following categories - Passenger - Employee or contractor - Level crossing user - Trespasser - Other person at a platform - Other person not at a platform
Number per million train-km
9 Suicides and attempted suicides
Relative number of suicides and attempted suicides Number per million train-km
10 Suicides Relative number of suicides Number per million train-km
11 Attempted suicides Relative number of attempted suicides Number per million train-km
12 IM related precursors to accidents
Relative number of system failures, sub-system failures, component failures, human errors or operational conditions which could lead to an accident. All precursors are to be included, both resulting and not resulting in accidents.
Number per million train-km
13 Overall workforce safety Relative number of IMs employees, contracted consultants and contractors seriously injured (i.e. hospitalised for more than 24 hours, excluding any attempted suicide) and killed (i.e. killed immediately or dying within 30 days, excluding any suicide) by accidents while at work at IMs premises. (IMs should prepare to present per million worked hours in the future)
Number per thousand main track-km
14 Workforce safety on track or trackside
Relative of IMs employees, contracted consultants and contractors seriously injured (i.e. hospitalised for more than 24 hours, excluding any attempted suicide) and killed (i.e. killed immediately or dying within 30 days, excluding any suicide) by accidents while at work at trackside. (IMs should prepare to present per million worked hours in the future)
Number per thousand main track-km

12
Security The management of railway security includes activities for the protection of the railway, its users and its staff through monitoring, prevention and preparation of responses to security incidents carried out with malicious intent, which have the potential to harm customers and staff, damage railway assets, or generally to impede and disrupt railway operations.
KPI ID KPI name KPI definition KPI unit 15 Delays caused by security
incidents Number of delay minutes due to security incidents
(intentional acts as terrorism, sabotage, cyber-attacks, vandalism, thefts, espionage, unauthorized persons and other acts of aggression or hooliganism) per train km
Minutes per train-km
16 Train cancellations caused by security incidents
Percentage of trains cancelled caused by security incidents (intentional acts as terrorism, sabotage, cyber-attacks, vandalism, thefts, espionage, unauthorized persons and other acts of aggression or hooliganism) per total trains scheduled to be operated
% of scheduled trains
17 People killed or seriously injured due to security incidents
Number of people seriously injured (i.e. hospitalised for more than 24 hours) and killed (i.e. killed immediately or dying within 30 days) due to security incidents (i.e. intentional acts as terrorism, sabotage, cyber-attacks, vandalism, thefts, espionage, unauthorized persons and other acts of aggression or hooliganism)
Number
Environment Monitoring the environmental impact of the IM focuses on two aspects: the influence of the IM in affecting and improving the environmental impact of the whole integrated railway (e.g. through electrification) and the direct environmental impact of the IM’s own activities.
Railways are one of the most environmentally-friendly modes of passenger and freight transport, and the KPIs recognise the opportunity for railways to effect modal shift from more polluting transport modes. They also take account of the environment impact of an IM’s activities, including aspects such as use of electric rolling stock, habitat alteration and fragmentation, emissions to air, wastewater, noise, waste, diesel exhaust emissions, materials, recycling, etc.
KPI ID KPI name KPI definition KPI unit 18 Share of diesel trains Diesel train-kilometres compared to train-kilometres
both for passenger and freight trains % of train-km
19 Share of electric trains Electric train-kilometres compared to train-kilometres both for passenger and freight trains
% of train-km
20 Performance against carbon reduction target
CO2 emission produced from maintenance rolling stock compared to main track-km
gCO2 per main track-km
21 Waste management linked to track and trackside
Amount of reused, recycled and recovered waste compared to total produced waste linked to track and trackside
% of tonnes
22 Environmental Incidents Number of rail related environmental incidents with major and significant impact or effect per main track-km
Number per main track-km
23 Noise exposure at night Total number of citizens exposed to ≥ 50 dB at night Number per main line-km
24 Noise limits Number of not awarded requested trainpaths due to noise divided by total number of requested trainpaths
Number per total number of requested trainpaths
25 Noise measurements - noise barries
Length of noise barriers per line-km % of main line-km

13
26 Noise measurements - absorbers
Length of track equipped with Rail adsorbers per total track-km
% of main track-km
Performance The performance dimension describes the performance of the IMs’ assets and network and the resulting impact on operators and customers. This dimension is used to analyse the performance of the IM network in relation to other IMs.
The objectives of the Performance dimension are to:
· Understand the performance of the IM network in relation to other IMs; · Improve the ability of the IM to enable trains to run on time; and, · Identify opportunities to improve the management of assets to minimise the number of failures,
and the impact of those failures on the operating railway.
The Performance dimension contains two categories: Punctuality and Robustness.
Punctuality Train punctuality is the primary measure of overall railway performance and a key measure of quality of service, driven not only by the IM but also operators and customers. The requirements for punctuality differs between IMs, high-speed routes, core network, customer groups, passenger/freight etc. It is essential to understand both the overall performance of the system through punctuality, as well as the IM’s impact on and responsibility for punctuality.
KPI ID KPI name KPI definition KPI unit 27 Trains punctuality Percentage of national and international passenger and
freight trains (exluding work trains) which arrive at all strategic measuring points with less than 5 minutes delay compared to all trains that ran against the original time plan, including international traffic
% of number of trains
28 Passenger trains punctuality Percentage of national and international passenger trains (exluding freight and work trains) which arrive at all strategic measuring points with less than 5 minutes delay compared to all passenger trains that ran against the original time plan, including international traffic
% of number of trains
29 Freight trains punctuality Percentage of national and international freight trains (exluding passenger and work trains) which arrive at all strategic measuring points with less than 15 minutes delay compared to all freight trains that ran against the original time plan, including international traffic
% of number of trains
30 Minutes of delays caused by IM per train - IM's responsibility
Average delay minutes caused by incidents that are regarded as IMs responsibility according to UIC leaflet 450-R per train
Minutes per train
31 Minutes of delays caused by IM per train-km - IM's responsibility
Average delay minutes caused by incidents that are regarded as IMs responsibility according to UIC leaflet 450-R per train km
Minutes per train-km
32 Minutes of delays caused by IM per train - Weather
Average delay minutes caused by weather incidents which has led to disruptions in the railway infrastructure per train
Minutes per train
33 Minutes of delays caused by IM per train-km - Weather
Average delay minutes caused by weather incidents which has led to disruptions in the railway infrastructure per train km
Minutes per train-km

14
34 Percentage of train cancellations caused by the IM
Percentage of fully or partially cancelled national and international passenger trains that are included in the last time table issued the day before the service (or the time table that is valid when the train service takes place) and are caused by incidents for which the infrastructure manager has the responsibility. All sorts of cancelled trains are to be included.
% of scheduled and cancelled passenger trains
Robustness Robustness of the infrastructure demonstrates the impact of failures. As well as managing its assets in such a way as to minimise the effect of failures on the railway, these indicators also measure the effectiveness and timeliness of the IM in responding to these failures, and returning the network to normal function.
KPI ID KPI name KPI definition KPI unit 35 Average delay minutes per
assets failures Average delay minutes caused by asset failures on
main track according to UIC CODE 450-2, numbers 20-25 and 28-29. Delay causes should include both primary causes and secondary causes. Primary and secondary causes are described in UIC CODE, 450 – 2 Appendix A. Delay data will be collected at all available measuring points. Delays refer to the time the train arrives at the measuring point. The maximum number of measured delay minutes across all available measuring points is counted with a threshold of 5 minutes for passenger services and 15 minutes for freight services. UIC CODE 450 – 2 rounding rule number 2: Round down to full minute until 29 seconds, round up to full minute from 30 seconds on, e.g. 4:30 is considered as 5, 4:29 is considered as 4
Minutes per number of failures
36 Average delay minutes per Signalling failures
Average delay minutes caused by asset failures on main track according to UIC CODE 450-2, numbers 20 & 21 including failures related to Signaling installations and Signaling installations at level crossings. Delay causes should include both primary causes and secondary causes. Primary and secondary causes are described in UIC CODE, 450 – 2 Appendix A. Delay data will be collected at all available measuring points. Delays refer to the time the train arrives at the measuring point. The maximum number of measured delay minutes across all available measuring points is counted with a threshold of 5 minutes for passenger services and 15 minutes for freight services. UIC CODE 450 – 2 rounding rule number 2: Round down to full minute until 29 seconds, round up to full minute from 30 seconds on, e.g. 4:30 is considered as 5, 4:29 is considered as 4
Minutes per number of failures
15
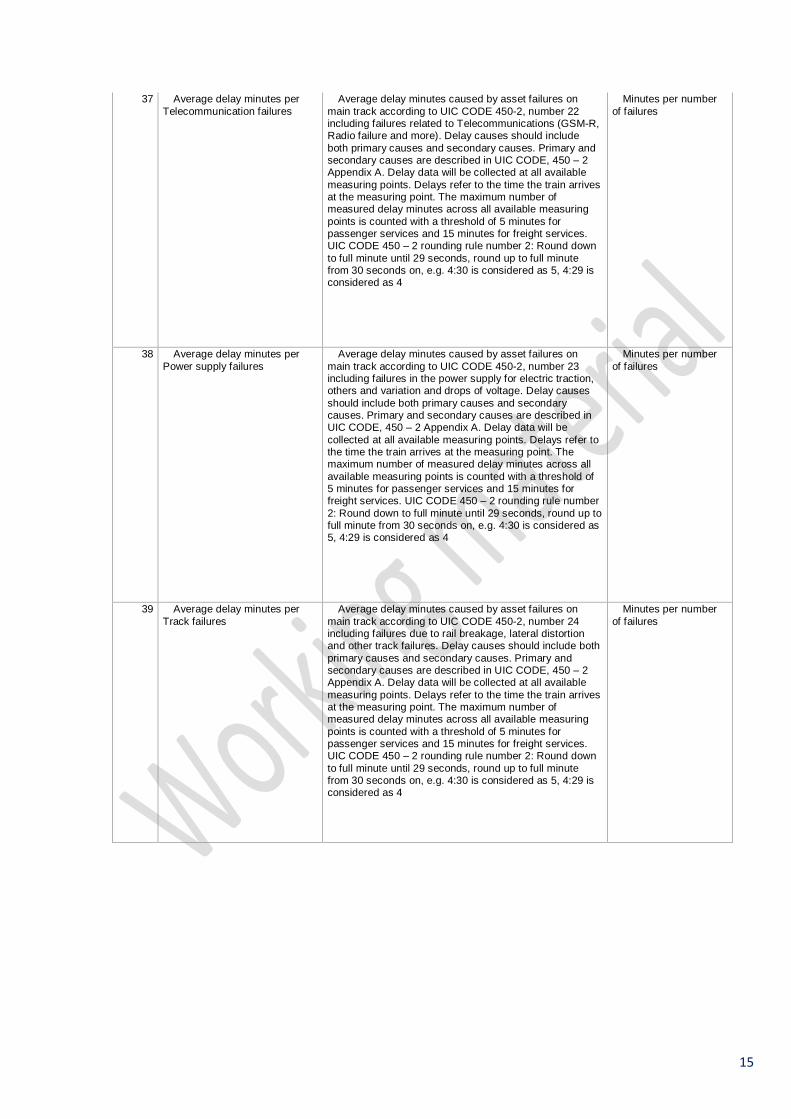
37 Average delay minutes per Telecommunication failures
Average delay minutes caused by asset failures on main track according to UIC CODE 450-2, number 22 including failures related to Telecommunications (GSM-R, Radio failure and more). Delay causes should include both primary causes and secondary causes. Primary and secondary causes are described in UIC CODE, 450 – 2 Appendix A. Delay data will be collected at all available measuring points. Delays refer to the time the train arrives at the measuring point. The maximum number of measured delay minutes across all available measuring points is counted with a threshold of 5 minutes for passenger services and 15 minutes for freight services. UIC CODE 450 – 2 rounding rule number 2: Round down to full minute until 29 seconds, round up to full minute from 30 seconds on, e.g. 4:30 is considered as 5, 4:29 is considered as 4
Minutes per number of failures
38 Average delay minutes per Power supply failures
Average delay minutes caused by asset failures on main track according to UIC CODE 450-2, number 23 including failures in the power supply for electric traction, others and variation and drops of voltage. Delay causes should include both primary causes and secondary causes. Primary and secondary causes are described in UIC CODE, 450 – 2 Appendix A. Delay data will be collected at all available measuring points. Delays refer to the time the train arrives at the measuring point. The maximum number of measured delay minutes across all available measuring points is counted with a threshold of 5 minutes for passenger services and 15 minutes for freight services. UIC CODE 450 – 2 rounding rule number 2: Round down to full minute until 29 seconds, round up to full minute from 30 seconds on, e.g. 4:30 is considered as 5, 4:29 is considered as 4
Minutes per number of failures
39 Average delay minutes per Track failures
Average delay minutes caused by asset failures on main track according to UIC CODE 450-2, number 24 including failures due to rail breakage, lateral distortion and other track failures. Delay causes should include both primary causes and secondary causes. Primary and secondary causes are described in UIC CODE, 450 – 2 Appendix A. Delay data will be collected at all available measuring points. Delays refer to the time the train arrives at the measuring point. The maximum number of measured delay minutes across all available measuring points is counted with a threshold of 5 minutes for passenger services and 15 minutes for freight services. UIC CODE 450 – 2 rounding rule number 2: Round down to full minute until 29 seconds, round up to full minute from 30 seconds on, e.g. 4:30 is considered as 5, 4:29 is considered as 4
Minutes per number of failures
16
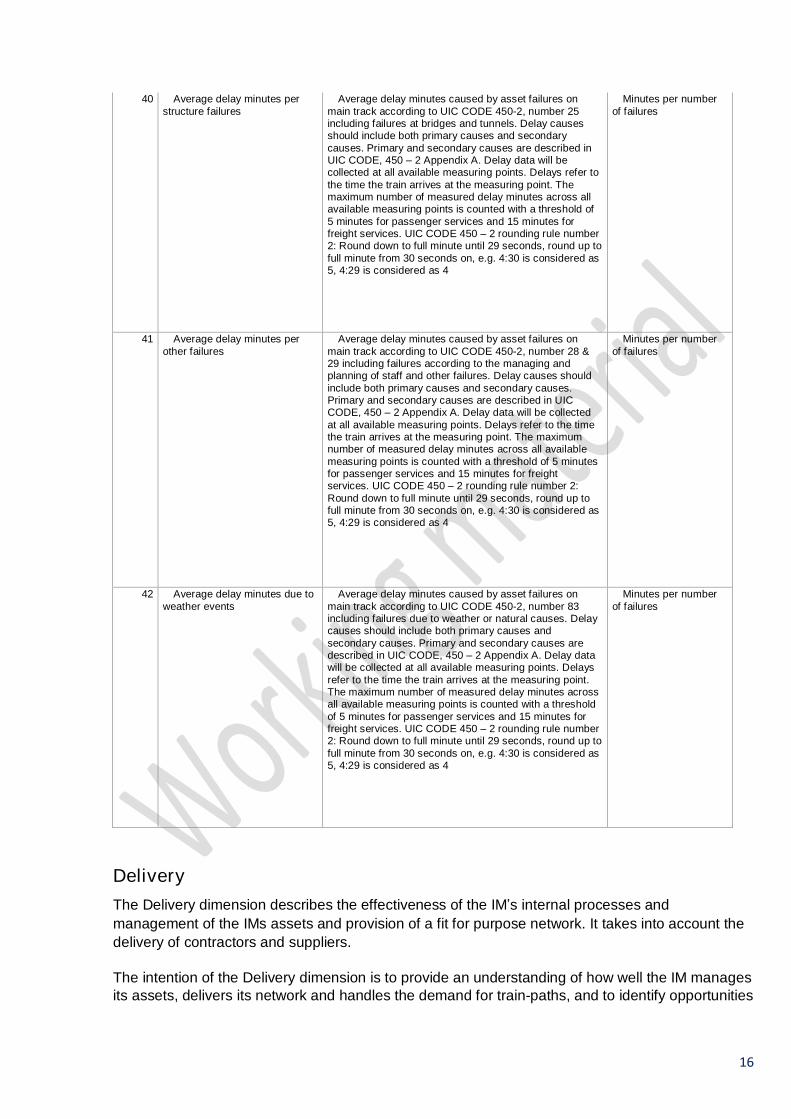
40 Average delay minutes per structure failures
Average delay minutes caused by asset failures on main track according to UIC CODE 450-2, number 25 including failures at bridges and tunnels. Delay causes should include both primary causes and secondary causes. Primary and secondary causes are described in UIC CODE, 450 – 2 Appendix A. Delay data will be collected at all available measuring points. Delays refer to the time the train arrives at the measuring point. The maximum number of measured delay minutes across all available measuring points is counted with a threshold of 5 minutes for passenger services and 15 minutes for freight services. UIC CODE 450 – 2 rounding rule number 2: Round down to full minute until 29 seconds, round up to full minute from 30 seconds on, e.g. 4:30 is considered as 5, 4:29 is considered as 4
Minutes per number of failures
41 Average delay minutes per other failures
Average delay minutes caused by asset failures on main track according to UIC CODE 450-2, number 28 & 29 including failures according to the managing and planning of staff and other failures. Delay causes should include both primary causes and secondary causes. Primary and secondary causes are described in UIC CODE, 450 – 2 Appendix A. Delay data will be collected at all available measuring points. Delays refer to the time the train arrives at the measuring point. The maximum number of measured delay minutes across all available measuring points is counted with a threshold of 5 minutes for passenger services and 15 minutes for freight services. UIC CODE 450 – 2 rounding rule number 2: Round down to full minute until 29 seconds, round up to full minute from 30 seconds on, e.g. 4:30 is considered as 5, 4:29 is considered as 4
Minutes per number of failures
42 Average delay minutes due to weather events
Average delay minutes caused by asset failures on main track according to UIC CODE 450-2, number 83 including failures due to weather or natural causes. Delay causes should include both primary causes and secondary causes. Primary and secondary causes are described in UIC CODE, 450 – 2 Appendix A. Delay data will be collected at all available measuring points. Delays refer to the time the train arrives at the measuring point. The maximum number of measured delay minutes across all available measuring points is counted with a threshold of 5 minutes for passenger services and 15 minutes for freight services. UIC CODE 450 – 2 rounding rule number 2: Round down to full minute until 29 seconds, round up to full minute from 30 seconds on, e.g. 4:30 is considered as 5, 4:29 is considered as 4
Minutes per number of failures
Delivery The Delivery dimension describes the effectiveness of the IM’s internal processes and management of the IMs assets and provision of a fit for purpose network. It takes into account the delivery of contractors and suppliers.
The intention of the Delivery dimension is to provide an understanding of how well the IM manages its assets, delivers its network and handles the demand for train-paths, and to identify opportunities

17
for improvement. The objectives are to understand and support improvements in the ability of the IM to:
· Deliver an available, operable and fully functional network, to the required level of capacity; · Carry out its asset management functions effectively and in a timely manner; and · Maintain and improve asset condition in line with its strategy.
The Delivery dimension contains two categories: Capacity and Condition.
Capacity The Capacity category measures the overall constraints on capacity of the IM’s network. It includes the impact on capacity from the condition of the IM’s infrastructure and the impact of activities undertaken to maintain or improve overall condition. The capacity of the network depends on many different factors and can be described from different perspectives. These KPIs reflect the ability of the railway system to handle the demand for train paths from the RUs, as well as impact of the IMs’ current and historical activities, including the impact of engineering possessions and speed restrictions.
KPI ID KPI name KPI definition KPI unit 43 Planned possessions Share of main track planned for IMs activities, including
maintenance, enhancement and renewals on main tracks. Planned work in the yearly time table. This is calculated as the number of main track-km planned for IMs activities weighted by duration and divided by the total network length
% of main track km-days
44 Possessions utilized Ratio of executed to planned possessions for IMs activities included in the yearly time table, including maintenance, enhancement and renewals on main tracks. This is calculated as the sum of main track km-days divided by sum of main track km-days planned
% of main track km-days
45 Time loss due to permanent speed restrictions
Average time loss in minutes per km (i.e. additional travel time) experienced by trains due to permanent speed restrictions related to the original function of the infrastructure (maximum line speed), included in the yearly timetable
Minutes per thousand main track-km
46 Time loss due to temporary speed restrictions
Average time loss in minutes per km (i.e. additional travel time) experienced by trains due to temporary speed restrictions related to the original function of the infrastructure (maximum line speed), not included in the yearly timetable
Minutes per thousand main track-km
47 Congested tracks Length of main tracks of congested infrastructure according to Article 47(1) of Directive 2012/34/EU (in respect of the situation at the end of the reporting period) (Source: European Commission, RMMS)
Main track-km
48 Congested nodes Number of nodes of congested infrastructure according to Article 47(1) of Directive 2012/34/EU (in respect of the situation at the end of the reporting period). (Source: European Commission, RMMS)
Number
49 Rejected path allocations Number of rejected path allocation requests during the year compared to total number of path allocation requests. Both scheduled and ad hoc requests for passenger and freight train paths should be summarised (Source: European Commission, RMMS)
% of path allocation requests
Condition

18
The measurement of asset condition is complex, and not always straight forward for a single IM, nevermind as a comparative metric for use in benchmarking. Therefore the PRIME condition category describes the condition of the asset primarily in terms of how well it functions (i.e. number of failures) and in terms of the impact of condition of the assets on the expected delivery of the network, in terms of temporary and permanent speed restrictions.
The KPIs for condition are based on earlier work from UIC and EIM. KPIs are reused from working groups within EIM with minor adjustments, and the UIC Code 450- 2 is used to define the type of failures used for each KPI.
KPI ID KPI name KPI definition KPI unit 50 Assets failures per million
train-km Number of asset failures on main track according to UIC
CODE 450-2, numbers 20-25 and 28-29 per million train-km on main track.
Number per million train-km
51 Assets failures per thousand main track-km
Number of asset failures on main track according to UIC CODE 450-2, numbers 20-25 and 28-29 per thousand main track-km.
Number per thousand main track-km
52 Signalling failures per thousand main track-km
Number of asset failures on main track according to UIC CODE 450-2, numbers 20 & 21 per thousand main track-km. Including failures related to Signaling installations and Signaling installations at level crossings.
Number per thousand main track-km
53 Telecommunication failures per thousand main track-km
Number of asset failures on main track according to UIC CODE 450-2, number 22 per thousand main track-km. Including failures related to Telecommunications (GSM-R, Radio failure and more).
Number per thousand main track-km
54 Power supply failures per thousand main track-km
Number of asset failures on main track according to UIC CODE 450-2, number 23 per thousand main track-km. Including failures in the power supply for electric traction, others and variation and drops of voltage.
Number per thousand main track-km
55 Track failures per thousand main track-km
Number of asset failures on main track according to UIC CODE 450-2, number 24 per thousand main track-km. Including failures due to rail breakage, lateral distortion and other track failures.
Number per thousand main track-km
56 Structure failures per thousand main track-km
Number of asset failures on main track according to UIC CODE 450-2, number 25 per thousand main track-km. Including failures at bridges and tunnels.
Number per thousand main track-km
57 Other infrastructure failures per thousand main track-km
Number of asset failures on main track according to UIC CODE 450-2, number 28 & 29 per thousand main track-km. Failures according to the managing and planning of staff and other failures.
Number per thousand main track-km
58 Tracks with permanent speed restrictions
Percentage of tracks with permanent speed restriction due to deteriorating asset condition weighted by the time the restrictions are in place (included in the yearly timetable), related to total main track-km
% of main track-km
59 Tracks with temporary speed restrictions
Percentage of tracks with temporary speed restriction due to deteriorating asset condition weighted by the time the restrictions are in place (not included in the yearly timetable), related to total main track-km
% of main track-km
Financial The Financial dimension covers all elements related to all expenditures and financial income of IM, including track access charges. It is intended to provide understanding of the structure and the level of costs and revenues of IM in relation to other IMs.
19
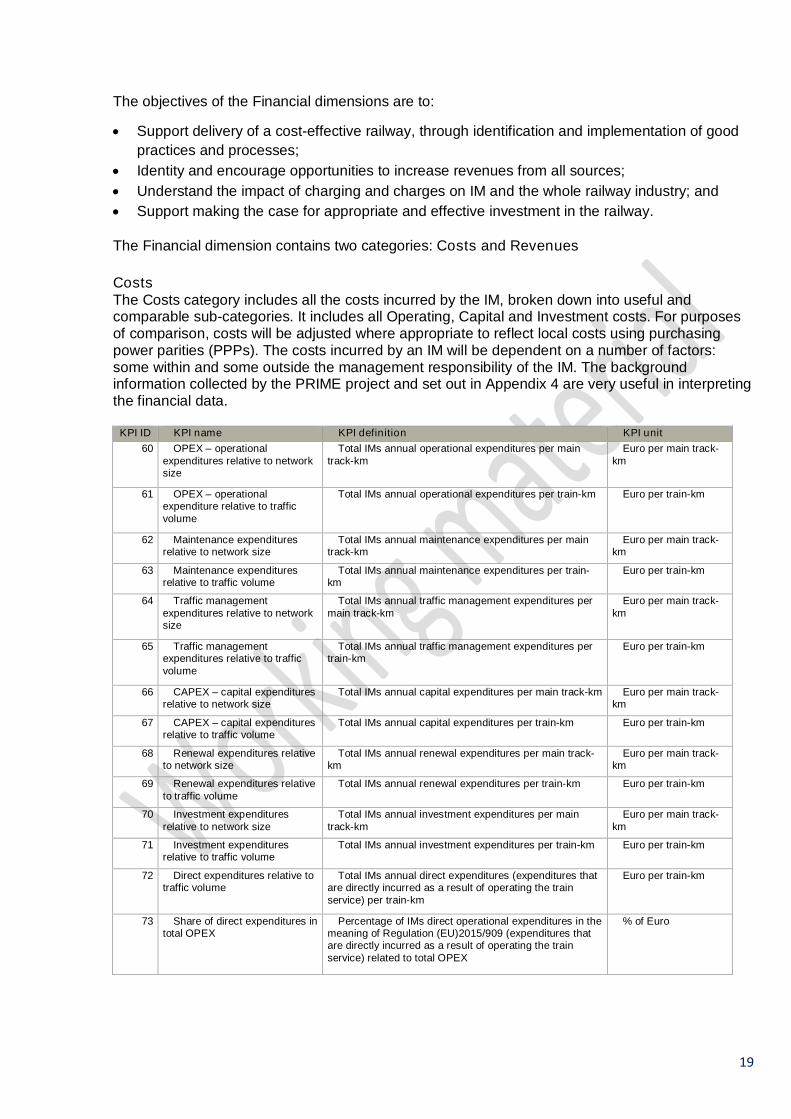
The objectives of the Financial dimensions are to:
· Support delivery of a cost-effective railway, through identification and implementation of good practices and processes;
· Identity and encourage opportunities to increase revenues from all sources; · Understand the impact of charging and charges on IM and the whole railway industry; and · Support making the case for appropriate and effective investment in the railway.
The Financial dimension contains two categories: Costs and Revenues
Costs The Costs category includes all the costs incurred by the IM, broken down into useful and comparable sub-categories. It includes all Operating, Capital and Investment costs. For purposes of comparison, costs will be adjusted where appropriate to reflect local costs using purchasing power parities (PPPs). The costs incurred by an IM will be dependent on a number of factors: some within and some outside the management responsibility of the IM. The background information collected by the PRIME project and set out in Appendix 4 are very useful in interpreting the financial data.
KPI ID KPI name KPI definition KPI unit 60 OPEX – operational
expenditures relative to network size
Total IMs annual operational expenditures per main track-km
Euro per main track-km
61 OPEX – operational expenditure relative to traffic volume
Total IMs annual operational expenditures per train-km Euro per train-km
62 Maintenance expenditures relative to network size
Total IMs annual maintenance expenditures per main track-km
Euro per main track-km
63 Maintenance expenditures relative to traffic volume
Total IMs annual maintenance expenditures per train-km
Euro per train-km
64 Traffic management expenditures relative to network size
Total IMs annual traffic management expenditures per main track-km
Euro per main track-km
65 Traffic management expenditures relative to traffic volume
Total IMs annual traffic management expenditures per train-km
Euro per train-km
66 CAPEX – capital expenditures relative to network size
Total IMs annual capital expenditures per main track-km Euro per main track-km
67 CAPEX – capital expenditures relative to traffic volume
Total IMs annual capital expenditures per train-km Euro per train-km
68 Renewal expenditures relative to network size
Total IMs annual renewal expenditures per main track-km
Euro per main track-km
69 Renewal expenditures relative to traffic volume
Total IMs annual renewal expenditures per train-km Euro per train-km
70 Investment expenditures relative to network size
Total IMs annual investment expenditures per main track-km
Euro per main track-km
71 Investment expenditures relative to traffic volume
Total IMs annual investment expenditures per train-km Euro per train-km
72 Direct expenditures relative to traffic volume
Total IMs annual direct expenditures (expenditures that are directly incurred as a result of operating the train service) per train-km
Euro per train-km
73 Share of direct expenditures in total OPEX
Percentage of IMs direct operational expenditures in the meaning of Regulation (EU)2015/909 (expenditures that are directly incurred as a result of operating the train service) related to total OPEX
% of Euro

20
74 Share of direct expenditures in total CAPEX
Percentage of IMs direct capital expenditures in the meaning of Regulation (EU)2015/909 (expenditures that are directly incurred as a result of operating the train service) related to total CAPEX
% of Euro
75 Renewal expenditures financed with grants
Percentage of IMs renewal expenditures financed with grants related to total renewal expenditures
% of Euro
76 Enhancement expenditures financed with grants
Percentage of IMs enhancement expenditures financed with grants related to total enhancement expenditures
% of Euro
77 Investment expenditures financed with grants
Percentage of IMs investment expenditures financed with grants related to total investment expenditures
% of Euro
78 Proportion of renewal expenditures in total renewal and maintenance expenditures
Percentage of IMs renewal expenditures related to total renewal and maintenance expenditures
% of Euro
79 Proportion of enhancement and investment expenditures in total expenditures
Percentage of IMs enhancement and investment expenditures related to total expenditures
% of Euro
Revenues The Revenue category provides a summary of the total non-track access revenue ‘earned’ by an IM, excluding subsidies and property development. Furthermore, it measures and compares that element of an IM’s revenue that comes from charges from operators using its network and service facilities. To achieve meaningful comparability, the indicators for charging have been simplified and PRIME is using fundamental KPIs that all IMs find common and easy to collect.Together with the Costs KPIs, it provides an indication of to what extent an IM is capable of covering its costs, and to what extent it relies on subsidy.
KPI ID KPI name KPI definition KPI unit 80 Total revenues from non-
access charges in relation to network size
Total IMs annual revenues from non-access charges (e.g. commercial letting, advertising, telecoms but excluding grants or subsidies) related to total main track km
Euro per main track km
81 Proportion of TAC in total revenue
Percentage of IMs annual TAC revenues (including freight, passenger and touristic trains) compared to total revenues
% of Euro
82 TAC revenue in relation to traffic volume
Total IMs annual TAC revenues (including freight, passenger and touristic trains) per train-km
Euro per total train-km
83 TAC revenue in relation to traffic volume - Freight
Total IMs annual freight TAC revenues per freight train-km
Euro per total freight train-km
84 TAC revenue in relation to traffic volume - Passenger
Total IMs annual passenger TAC revenues (including touristic trains) per passenger train-km
Euro per passenger train-km
85 TAC revenue in relation to traffic volume - Passenger conventional
Total IMs annual passenger conventional train TAC revenues (excluding touristic trains) compared to total passenger conventional train-km
Euro per conventional passenger train-km
86 TAC revenue in relation to traffic volume - Passenger high speed
Total IMs annual passenger high speed train TAC revenues (excluding touristic trains) compared to total passenger high speed train-km
Euro per high speed passenger train-km
87 TAC revenue in relation to network size
Total IMs annual TAC revenues (including freight, passenger and touristic trains) compared to total main track-km
Euro per main track-km
88 TAC revenue in relation to network size - Passenger conventional
Total IMs annual passenger conventional train TAC revenues (excluding touristic trains) compared to total conventional main track-km
Euro per conventional main track-km
89 TAC revenue in relation to network size - High speed
Total IMs annual passenger high speed train TAC revenues (excluding touristic trains) compared to total high speed main track-km
Euro per high speed main track-km

21
90 Proportion of revenues for station access
Total IMs annual revenues for station access (including passenger and touristic trains) compared to total revenue
% of Euro
91 Income from incentive regimes in relation to network size
Total IMs annual income from incentive/performance regimes with customers (if applicable, no public grants or state subsidies) per main track-km
Euro per main track-km
Further details are provided in Appendix 4. Growth The dimension Growth describes the level of use of the existing network, network expansion, integration with other transport modes and use of technology such as ERTMS to improve delivery.
The objectives of this dimension are to understand the opportunities to:
· Improve the use of the overall capacity of the railway network; · Encourage modal shift to rail from road and air; · Promote multi-modal transport integration; · Understand and use new technology, such as ERTMS, effectively and efficiently to support the
objectives of the IM and the integrated railway.
Utilisation Utilisation is an essential measure of the performance of an IM. One of the most important objectives for an IM is to use its infrastructure as effectively as possible. This measure also distinguishes between passenger and freight traffic. Utilisation has a major impact on the ability of an IM to cover its costs and the utilisation of the infrastructure will also affect the future performance (other KPIs) of the infrastructure, e.g. overall condition.
KPI ID KPI name KPI definition KPI unit 92 Degree of utilisation – all
trains Average daily train-km on main track (passenger and
freight revenue service only, no shunting, no work trains) related to main track-km
Daily train km per main track-km
93 Degree of utilisation – passenger trains
Average daily passenger train-km on main track (revenue service only, no shunting, no work trains) related to main track-km
Daily passenger train–km per main track-km
94 Degree of utilisation – freight trains
Average daily freight train-km on main track (revenue service only, no shunting, no work trains) related to main track-km
Daily freight train–km per main track-km
95 Degree of utilisation – gross tonne-km
Average daily gross tonne-km on main track (passenger and freight revenue service only, no shunting, no work trains) related to main track-km
Daily gross tonne-km per main track–km
96 Degree of utilisation - double track
Double track line: track km with traffic volumes >= 200 trains per day (average)
Track km with traffic >= 200 trains a day per total double track km
97 Degree of utilisation - single Track
Single track line: track km with traffic volumes >= 70 trains per day (average)
Track km with traffic >= 70 trains a day per total single track km
Asset Capability & ERTMS Asset capability describes the functionality of the IM’s railway network. It provides the overview of the capability of the network and specifically the extent to which the network meets the TEN-T
22
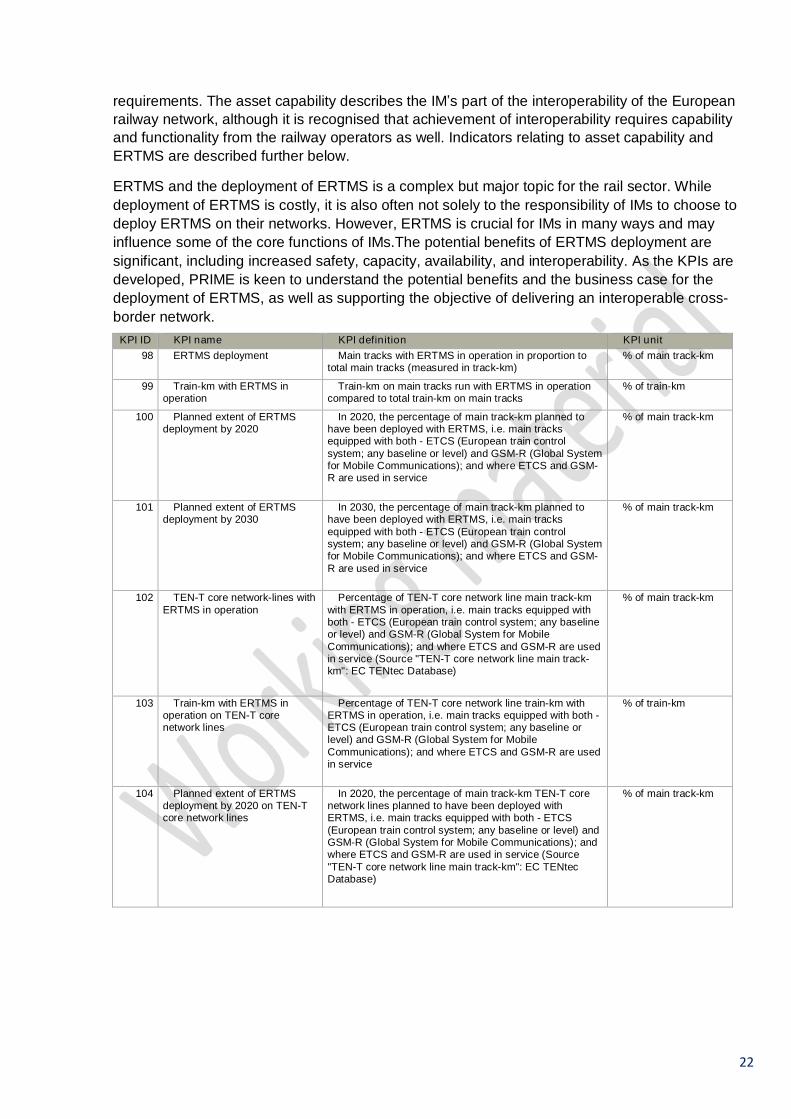
requirements. The asset capability describes the IM’s part of the interoperability of the European railway network, although it is recognised that achievement of interoperability requires capability and functionality from the railway operators as well. Indicators relating to asset capability and ERTMS are described further below.
ERTMS and the deployment of ERTMS is a complex but major topic for the rail sector. While deployment of ERTMS is costly, it is also often not solely to the responsibility of IMs to choose to deploy ERTMS on their networks. However, ERTMS is crucial for IMs in many ways and may influence some of the core functions of IMs.The potential benefits of ERTMS deployment are significant, including increased safety, capacity, availability, and interoperability. As the KPIs are developed, PRIME is keen to understand the potential benefits and the business case for the deployment of ERTMS, as well as supporting the objective of delivering an interoperable cross-border network.
KPI ID KPI name KPI definition KPI unit 98 ERTMS deployment Main tracks with ERTMS in operation in proportion to
total main tracks (measured in track-km) % of main track-km
99 Train-km with ERTMS in operation
Train-km on main tracks run with ERTMS in operation compared to total train-km on main tracks
% of train-km
100 Planned extent of ERTMS deployment by 2020
In 2020, the percentage of main track-km planned to have been deployed with ERTMS, i.e. main tracks equipped with both - ETCS (European train control system; any baseline or level) and GSM-R (Global System for Mobile Communications); and where ETCS and GSM-R are used in service
% of main track-km
101 Planned extent of ERTMS deployment by 2030
In 2030, the percentage of main track-km planned to have been deployed with ERTMS, i.e. main tracks equipped with both - ETCS (European train control system; any baseline or level) and GSM-R (Global System for Mobile Communications); and where ETCS and GSM-R are used in service
% of main track-km
102 TEN-T core network-lines with ERTMS in operation
Percentage of TEN-T core network line main track-km with ERTMS in operation, i.e. main tracks equipped with both - ETCS (European train control system; any baseline or level) and GSM-R (Global System for Mobile Communications); and where ETCS and GSM-R are used in service (Source "TEN-T core network line main track-km": EC TENtec Database)
% of main track-km
103 Train-km with ERTMS in operation on TEN-T core network lines
Percentage of TEN-T core network line train-km with ERTMS in operation, i.e. main tracks equipped with both - ETCS (European train control system; any baseline or level) and GSM-R (Global System for Mobile Communications); and where ETCS and GSM-R are used in service
% of train-km
104 Planned extent of ERTMS deployment by 2020 on TEN-T core network lines
In 2020, the percentage of main track-km TEN-T core network lines planned to have been deployed with ERTMS, i.e. main tracks equipped with both - ETCS (European train control system; any baseline or level) and GSM-R (Global System for Mobile Communications); and where ETCS and GSM-R are used in service (Source "TEN-T core network line main track-km": EC TENtec Database)
% of main track-km

23
105 Planned extent of ERTMS deployment by 2030 on TEN-T core network lines
In 2030, the percentage of main track-km TEN-T core network lines planned to have been deployed with ERTMS, i.e. main tracks equipped with both - ETCS (European train control system; any baseline or level) and GSM-R (Global System for Mobile Communications); and where ETCS and GSM-R are used in service (Source "TEN-T core network line main track-km": EC TENtec Database)
% of main track-km
106 Axle load Proportion of the TEN-T core network permitting at least 22.5 t axle load (INF) (Source EC TENtec Database)
% of main track km
107 Gauge Proportion of the TEN-T core network with nominal track gauge of 1435 mm (INF) (Source EC TENtec Database)
% of main track km
108 Line Speed Proportion of the TEN-T core network permitting 110 km/h line speed (INF) (Source EC TENtec Database)
% of main track km
109 Train length Proportion of the TEN-T core network permitting 740 m train length (INF) (Source EC TENtec Database)
% of main track km
110 Electrification Proportion of the fully electrified TEN-T core network, supported with electrified sidings necessary for electric train operations (INF) (Source EC TENtec Database)
% of main track km
Intermodality A highly functional intermodality between different transport modes can bring traffic and business to the rail network. Since trains rarely offer a door-to-door solution, and rather is a part of the mobility chain, connections between modes become essential for the customers. Intermodality promotes efficiency for both freight and passenger traffic. Intermodality also increases the number of potential customers for rail. For the purposes of PRIME, intermodality also includes a measure of those stations which have access for those who are mobility impaired.
KPI ID KPI name KPI definition KPI unit 112 Electrified multimodal rail
freight terminals Percentage of multimodal rail freight terminals
accessible to electrified trains, i.e. a structure equipped for transhipment rail and other transport modes
% of multimodal freight terminals
113 Core maritime ports connection
Percentage of core maritime ports linked to the TEN-T core network connected to the rail network
% of core maritime ports
114 Core inland waterways connection
Percentage of core inland waterways linked to the TEN-T core network connected to the rail network
% of core inland waterways
115 Core airports connection Percentage of core airports linked to the TEN-T core network connected to the rail network
% of core airports
116 Intermodal stations Percentage of public passenger railway stations with connections to public urban transport (metro, bus, tramways, light rail, ferries etc…) within the entire railway infrastructure network, independent of ownership (Source "Passenger stations": European Commission, RMMS)
% of passenger stations
117 Passengers using accessible stations
Percentage of passengers registered annually in all accessible stations within the entire railway infrastructure network, independent of ownership, related to the total number of passengers. An accessible station is one on which a passenger can, from entering the station, reach the platform via level-access, without steps or equivalent.
% of passengers

24
Appendix 1: Data items
Context Data
ID Data label Data definition Data unit
1 Total track-km Total track-km in operation, such as main track, sidings, depots, stabling tracks and connecting lines
km
2 Total double track-km Total double track-km km 3 Total single track-km Total single track-km km 4 Total electrified track-km Total electrified track-km km 5 Total main track-km Total main track-km km 6 Total passenger conventional
main track-km Total passenger conventional main track-km km
7 Total passenger high speed main track-km
Total passenger high speed main track-km km
8 Total track-km with traffic volumes >= 200 trains a day
Total track-km with traffic volumes >= 200 trains a day km
9 Total track-km with traffic volumes >= 70 trains a day
Total track-km with traffic volumes >= 70 trains a day km
10 Total main line-km Line length of total main track, i.e. double track-km is counted only once
km
Safety, Security & Environment Safety
Data ID
Data label Data definition Data unit
13 Number of significant accidents
Number of significant accidents including sidings, excluding accidents in workshops, warehouses and depots based on the following types of accidents (primary accidents): - Collision of train with rail vehicle - Collision of train with obstacle within the clearance gauge - Derailment of train - Level crossing accident, including accident involving pedestrians at level crossing - Accident to persons involving rolling stock in motion, with the exception of suicides and attempted suicides - Fire on rolling stock - Other accident The boundary is the point at which the railway vehicle leaving the workshop/warehouse/depot/sidings cannot pass without having an authorization to access the mainline or other similar line. This point is usually identified by a signal. For further guidance, please see ERA Implementation Guidance on CSIs.
number
25
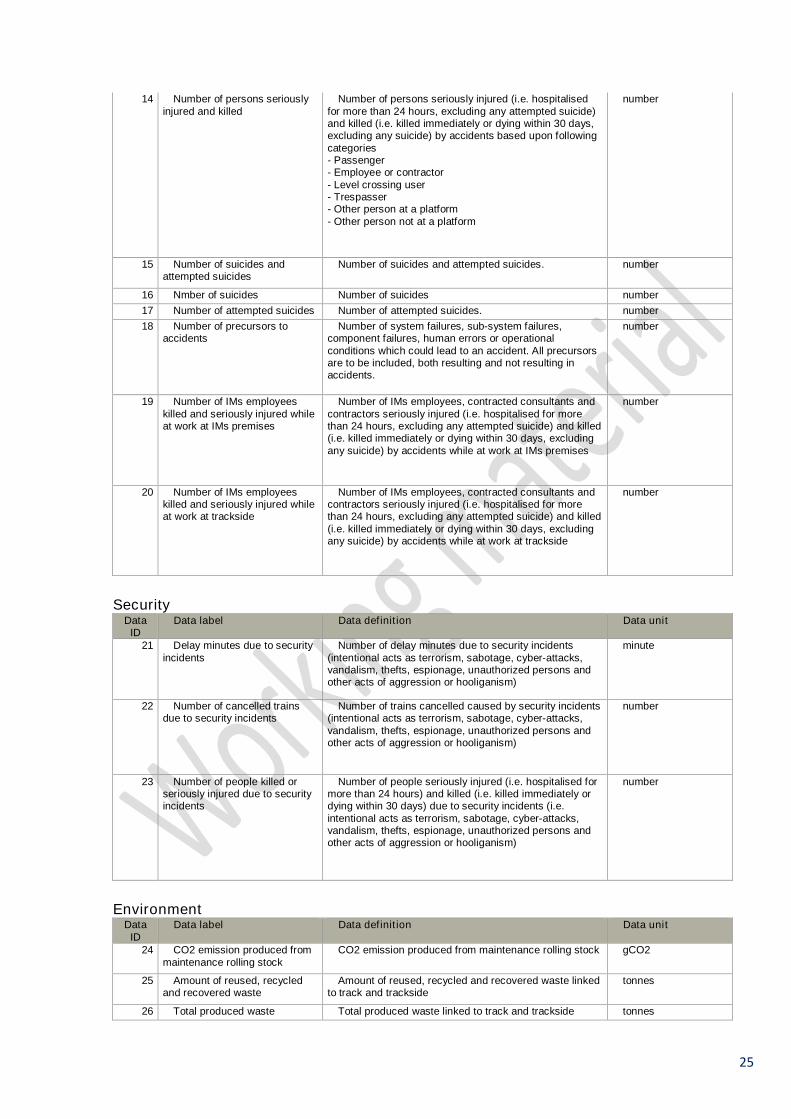
14 Number of persons seriously injured and killed
Number of persons seriously injured (i.e. hospitalised for more than 24 hours, excluding any attempted suicide) and killed (i.e. killed immediately or dying within 30 days, excluding any suicide) by accidents based upon following categories - Passenger - Employee or contractor - Level crossing user - Trespasser - Other person at a platform - Other person not at a platform
number
15 Number of suicides and attempted suicides
Number of suicides and attempted suicides. number
16 Nmber of suicides Number of suicides number 17 Number of attempted suicides Number of attempted suicides. number 18 Number of precursors to
accidents Number of system failures, sub-system failures,
component failures, human errors or operational conditions which could lead to an accident. All precursors are to be included, both resulting and not resulting in accidents.
number
19 Number of IMs employees killed and seriously injured while at work at IMs premises
Number of IMs employees, contracted consultants and contractors seriously injured (i.e. hospitalised for more than 24 hours, excluding any attempted suicide) and killed (i.e. killed immediately or dying within 30 days, excluding any suicide) by accidents while at work at IMs premises
number
20 Number of IMs employees killed and seriously injured while at work at trackside
Number of IMs employees, contracted consultants and contractors seriously injured (i.e. hospitalised for more than 24 hours, excluding any attempted suicide) and killed (i.e. killed immediately or dying within 30 days, excluding any suicide) by accidents while at work at trackside
number
Security
Data ID
Data label Data definition Data unit
21 Delay minutes due to security incidents
Number of delay minutes due to security incidents (intentional acts as terrorism, sabotage, cyber-attacks, vandalism, thefts, espionage, unauthorized persons and other acts of aggression or hooliganism)
minute
22 Number of cancelled trains due to security incidents
Number of trains cancelled caused by security incidents (intentional acts as terrorism, sabotage, cyber-attacks, vandalism, thefts, espionage, unauthorized persons and other acts of aggression or hooliganism)
number
23 Number of people killed or seriously injured due to security incidents
Number of people seriously injured (i.e. hospitalised for more than 24 hours) and killed (i.e. killed immediately or dying within 30 days) due to security incidents (i.e. intentional acts as terrorism, sabotage, cyber-attacks, vandalism, thefts, espionage, unauthorized persons and other acts of aggression or hooliganism)
number
Environment
Data ID
Data label Data definition Data unit
24 CO2 emission produced from maintenance rolling stock
CO2 emission produced from maintenance rolling stock gCO2
25 Amount of reused, recycled and recovered waste
Amount of reused, recycled and recovered waste linked to track and trackside
tonnes
26 Total produced waste Total produced waste linked to track and trackside tonnes

26
27 Number of rail related environmental incidents
Number of rail related environmental incidents with major and significant impact or effect
number
28 Number of citizens exposed to noise
Total number of citizens exposed to ≥ 50 dB at night number
29 Refusal of requested trainpaths due to noise
Number of not awarded requested trainpaths due to noise
number
30 Total number of requested trainpaths
Total number of requested trainpaths number
31 Length of noise barriers Length of noise barriers in main line-km km 32 Length of track equipped with
rail adsorbers Length of track equipped with Rail adsorbers in main
track-km km
Performance Punctuality
Data ID
Data label Data definition Data unit
33 Number of all trains scheduled to be operated
Total number of national and international passenger and freight trains (exluding work trains) scheduled to be operated, including those timetabled at short notice but exluding replacement trains due to cancellations to avoid double counting
number
34 Trains arrived at strategic points with less than 5 minutes delay
Total number of national and international passenger and freight trains (exluding work trains) which arrive at all strategic measuring points with less than 5 minutes delay. UIC CODE 450 – 2 rounding rule number 2: Round down to full minute until 29 seconds, round up to full minute from 30 seconds on, e.g. 4:30 is considered as 5, 4:29 is considered as 4
trains
35 All trains that ran against the original time plan
Total number of national and international passenger and freight trains (exluding work trains) that ran against the original time plan, including those timetabled at short notice
trains
36 Passenger trains arrived at strategic points with less than 5 minutes delay
Total number of national and international passenger trains (exluding freight and work trains) which arrive at all strategic measuring points with less than 5 minutes delay. UIC CODE 450 – 2 rounding rule number 2: Round down to full minute until 29 seconds, round up to full minute from 30 seconds on, e.g. 4:30 is considered as 5, 4:29 is considered as 4
trains
37 All passenger trains that ran against the original time plan
Total number of national and international passenger trains (exluding freight and work trains) that ran against the original time plan, including those timetabled at short notice
trains
38 Freight trains arrived at strategic points with less than 15 minutes delay
Total number of national and international freight trains (exluding passenger and work trains) which arrive at all strategic measuring points with less than 15 minutes delay. UIC CODE 450 – 2 rounding rule number 2: Round down to full minute until 29 seconds, round up to full minute from 30 seconds on, e.g. 4:30 is considered as 5, 4:29 is considered as 4
trains
39 All freight trains that ran against the original time plan
Total number of national and international freight trains (exluding passenger and work trains) that ran against the original time plan, including those timetabled at short notice
trains
27
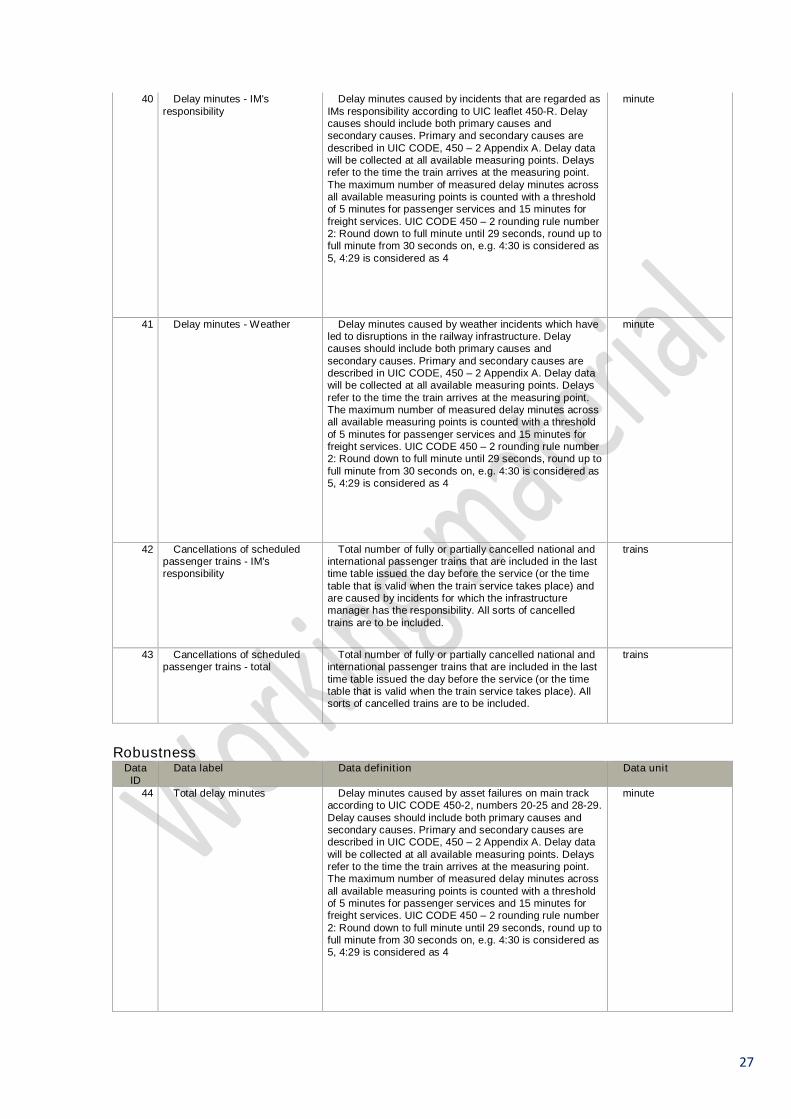
40 Delay minutes - IM's responsibility
Delay minutes caused by incidents that are regarded as IMs responsibility according to UIC leaflet 450-R. Delay causes should include both primary causes and secondary causes. Primary and secondary causes are described in UIC CODE, 450 – 2 Appendix A. Delay data will be collected at all available measuring points. Delays refer to the time the train arrives at the measuring point. The maximum number of measured delay minutes across all available measuring points is counted with a threshold of 5 minutes for passenger services and 15 minutes for freight services. UIC CODE 450 – 2 rounding rule number 2: Round down to full minute until 29 seconds, round up to full minute from 30 seconds on, e.g. 4:30 is considered as 5, 4:29 is considered as 4
minute
41 Delay minutes - Weather Delay minutes caused by weather incidents which have led to disruptions in the railway infrastructure. Delay causes should include both primary causes and secondary causes. Primary and secondary causes are described in UIC CODE, 450 – 2 Appendix A. Delay data will be collected at all available measuring points. Delays refer to the time the train arrives at the measuring point. The maximum number of measured delay minutes across all available measuring points is counted with a threshold of 5 minutes for passenger services and 15 minutes for freight services. UIC CODE 450 – 2 rounding rule number 2: Round down to full minute until 29 seconds, round up to full minute from 30 seconds on, e.g. 4:30 is considered as 5, 4:29 is considered as 4
minute
42 Cancellations of scheduled passenger trains - IM's responsibility
Total number of fully or partially cancelled national and international passenger trains that are included in the last time table issued the day before the service (or the time table that is valid when the train service takes place) and are caused by incidents for which the infrastructure manager has the responsibility. All sorts of cancelled trains are to be included.
trains
43 Cancellations of scheduled passenger trains - total
Total number of fully or partially cancelled national and international passenger trains that are included in the last time table issued the day before the service (or the time table that is valid when the train service takes place). All sorts of cancelled trains are to be included.
trains
Robustness
Data ID
Data label Data definition Data unit
44 Total delay minutes Delay minutes caused by asset failures on main track according to UIC CODE 450-2, numbers 20-25 and 28-29. Delay causes should include both primary causes and secondary causes. Primary and secondary causes are described in UIC CODE, 450 – 2 Appendix A. Delay data will be collected at all available measuring points. Delays refer to the time the train arrives at the measuring point. The maximum number of measured delay minutes across all available measuring points is counted with a threshold of 5 minutes for passenger services and 15 minutes for freight services. UIC CODE 450 – 2 rounding rule number 2: Round down to full minute until 29 seconds, round up to full minute from 30 seconds on, e.g. 4:30 is considered as 5, 4:29 is considered as 4
minute
28
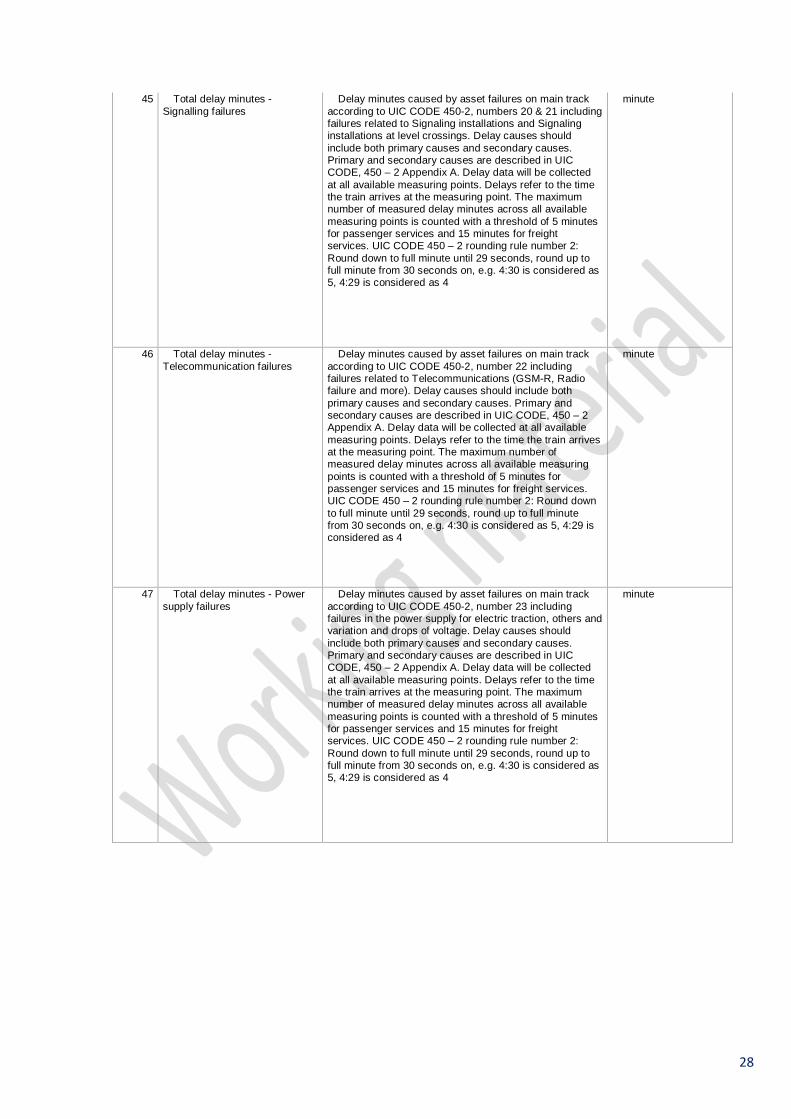
45 Total delay minutes - Signalling failures
Delay minutes caused by asset failures on main track according to UIC CODE 450-2, numbers 20 & 21 including failures related to Signaling installations and Signaling installations at level crossings. Delay causes should include both primary causes and secondary causes. Primary and secondary causes are described in UIC CODE, 450 – 2 Appendix A. Delay data will be collected at all available measuring points. Delays refer to the time the train arrives at the measuring point. The maximum number of measured delay minutes across all available measuring points is counted with a threshold of 5 minutes for passenger services and 15 minutes for freight services. UIC CODE 450 – 2 rounding rule number 2: Round down to full minute until 29 seconds, round up to full minute from 30 seconds on, e.g. 4:30 is considered as 5, 4:29 is considered as 4
minute
46 Total delay minutes - Telecommunication failures
Delay minutes caused by asset failures on main track according to UIC CODE 450-2, number 22 including failures related to Telecommunications (GSM-R, Radio failure and more). Delay causes should include both primary causes and secondary causes. Primary and secondary causes are described in UIC CODE, 450 – 2 Appendix A. Delay data will be collected at all available measuring points. Delays refer to the time the train arrives at the measuring point. The maximum number of measured delay minutes across all available measuring points is counted with a threshold of 5 minutes for passenger services and 15 minutes for freight services. UIC CODE 450 – 2 rounding rule number 2: Round down to full minute until 29 seconds, round up to full minute from 30 seconds on, e.g. 4:30 is considered as 5, 4:29 is considered as 4
minute
47 Total delay minutes - Power supply failures
Delay minutes caused by asset failures on main track according to UIC CODE 450-2, number 23 including failures in the power supply for electric traction, others and variation and drops of voltage. Delay causes should include both primary causes and secondary causes. Primary and secondary causes are described in UIC CODE, 450 – 2 Appendix A. Delay data will be collected at all available measuring points. Delays refer to the time the train arrives at the measuring point. The maximum number of measured delay minutes across all available measuring points is counted with a threshold of 5 minutes for passenger services and 15 minutes for freight services. UIC CODE 450 – 2 rounding rule number 2: Round down to full minute until 29 seconds, round up to full minute from 30 seconds on, e.g. 4:30 is considered as 5, 4:29 is considered as 4
minute

29
48 Total delay minutes - Track failures
Delay minutes caused by asset failures on main track according to UIC CODE 450-2, number 24 including failures due to rail breakage, lateral distortion and other track failures. Delay causes should include both primary causes and secondary causes. Primary and secondary causes are described in UIC CODE, 450 – 2 Appendix A. Delay data will be collected at all available measuring points. Delays refer to the time the train arrives at the measuring point. The maximum number of measured delay minutes across all available measuring points is counted with a threshold of 5 minutes for passenger services and 15 minutes for freight services. UIC CODE 450 – 2 rounding rule number 2: Round down to full minute until 29 seconds, round up to full minute from 30 seconds on, e.g. 4:30 is considered as 5, 4:29 is considered as 4
minute
49 Total delay minutes - Other failures
Delay minutes caused by asset failures on main track according to UIC CODE 450-2, number 28 & 29 including failures according to the managing and planning of staff and other failures. Delay causes should include both primary causes and secondary causes. Primary and secondary causes are described in UIC CODE, 450 – 2 Appendix A. Delay data will be collected at all available measuring points. Delays refer to the time the train arrives at the measuring point. The maximum number of measured delay minutes across all available measuring points is counted with a threshold of 5 minutes for passenger services and 15 minutes for freight services. UIC CODE 450 – 2 rounding rule number 2: Round down to full minute until 29 seconds, round up to full minute from 30 seconds on, e.g. 4:30 is considered as 5, 4:29 is considered as 4
minute
50 Total delay minutes - Structure failures
Delay minutes caused by asset failures on main track according to UIC CODE 450-2, number 25 including failures at bridges and tunnels. Delay causes should include both primary causes and secondary causes. Primary and secondary causes are described in UIC CODE, 450 – 2 Appendix A. Delay data will be collected at all available measuring points. Delays refer to the time the train arrives at the measuring point. The maximum number of measured delay minutes across all available measuring points is counted with a threshold of 5 minutes for passenger services and 15 minutes for freight services. UIC CODE 450 – 2 rounding rule number 2: Round down to full minute until 29 seconds, round up to full minute from 30 seconds on, e.g. 4:30 is considered as 5, 4:29 is considered as 4
minute
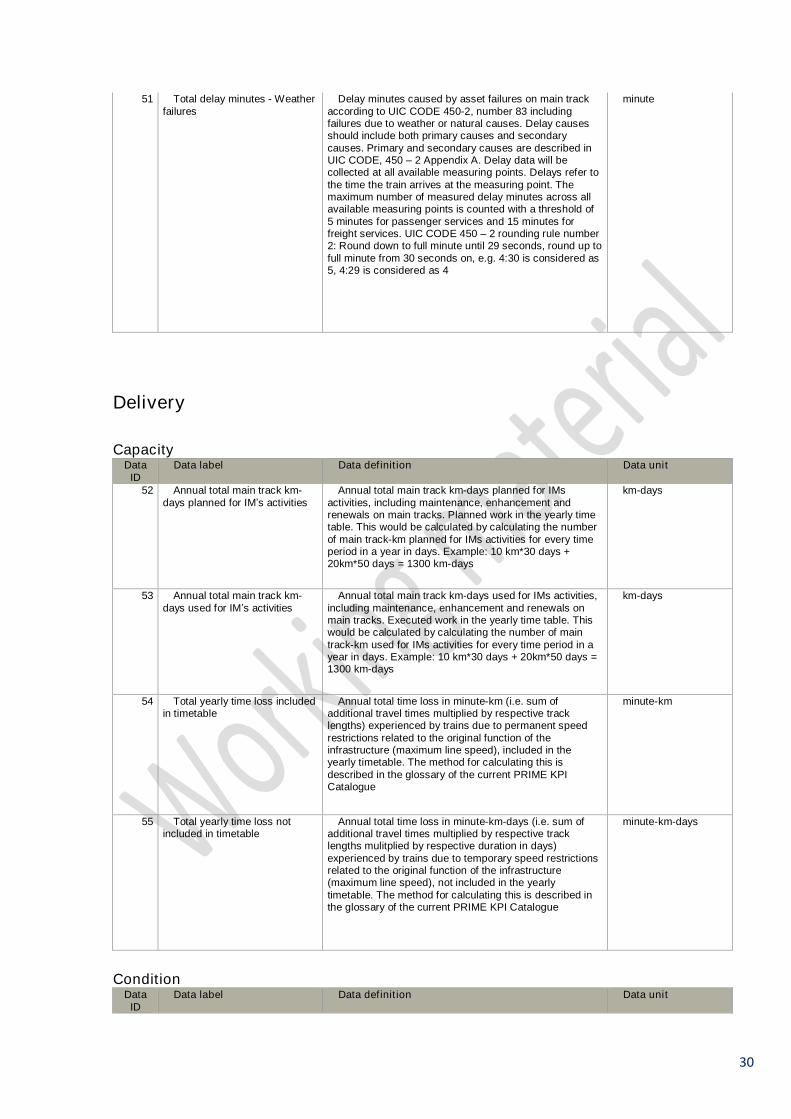
30
51 Total delay minutes - Weather failures
Delay minutes caused by asset failures on main track according to UIC CODE 450-2, number 83 including failures due to weather or natural causes. Delay causes should include both primary causes and secondary causes. Primary and secondary causes are described in UIC CODE, 450 – 2 Appendix A. Delay data will be collected at all available measuring points. Delays refer to the time the train arrives at the measuring point. The maximum number of measured delay minutes across all available measuring points is counted with a threshold of 5 minutes for passenger services and 15 minutes for freight services. UIC CODE 450 – 2 rounding rule number 2: Round down to full minute until 29 seconds, round up to full minute from 30 seconds on, e.g. 4:30 is considered as 5, 4:29 is considered as 4
minute
Delivery Capacity
Data ID
Data label Data definition Data unit
52 Annual total main track km-days planned for IM’s activities
Annual total main track km-days planned for IMs activities, including maintenance, enhancement and renewals on main tracks. Planned work in the yearly time table. This would be calculated by calculating the number of main track-km planned for IMs activities for every time period in a year in days. Example: 10 km*30 days + 20km*50 days = 1300 km-days
km-days
53 Annual total main track km-days used for IM’s activities
Annual total main track km-days used for IMs activities, including maintenance, enhancement and renewals on main tracks. Executed work in the yearly time table. This would be calculated by calculating the number of main track-km used for IMs activities for every time period in a year in days. Example: 10 km*30 days + 20km*50 days = 1300 km-days
km-days
54 Total yearly time loss included in timetable
Annual total time loss in minute-km (i.e. sum of additional travel times multiplied by respective track lengths) experienced by trains due to permanent speed restrictions related to the original function of the infrastructure (maximum line speed), included in the yearly timetable. The method for calculating this is described in the glossary of the current PRIME KPI Catalogue
minute-km
55 Total yearly time loss not included in timetable
Annual total time loss in minute-km-days (i.e. sum of additional travel times multiplied by respective track lengths mulitplied by respective duration in days) experienced by trains due to temporary speed restrictions related to the original function of the infrastructure (maximum line speed), not included in the yearly timetable. The method for calculating this is described in the glossary of the current PRIME KPI Catalogue
minute-km-days
Condition
Data ID
Data label Data definition Data unit

31
60 Total number of asset failures Total number of asset failures on main track according to UIC CODE 450-2, numbers 20-25 and 28-29.
number
61 Total number of signalling failures
Total number of asset failures on main track according to UIC CODE 450-2, numbers 20 & 21. Including failures related to Signaling installations and Signaling installations at level crossings.
number
62 Total number of telecommunication failures
Total number of asset failures on main track according to UIC CODE 450-2, number 22. Including failures related to Telecommunications (GSM-R, Radio failure and more).
number
63 Total number of power supply failures
Total number of asset failures on main track according to UIC CODE 450-2, number 23. Including failures in the power supply for electric traction, others and variation and drops of voltage.
number
64 Total number of track failures Total number of asset failures on main track according to UIC CODE 450-2, number 24. Including failures due to rail breakage, lateral distortion and other track failures.
number
65 Total number of other failures Total number of asset failures on main track according to UIC CODE 450-2, number 28 & 29. Failures according to the managing and planning of staff and other failures.
number
66 Total number of structure failures
Total number of asset failures on main track according to UIC CODE 450-2, number 25. Including failures at bridges and tunnels.
number
67 Total number of weather failures
Total number of asset failures on main track according to UIC CODE 450-2, number 83. Including failures due to weather or natural causes.
number
68 Track-km with permanent speed restriction
Length (km) of tracks with permanent speed restriction due to deteriorating asset condition weighted by the time the restrictions are in place (included in the yearly timetable)
km
69 Track-km with temporary speed restriction
Length (km) of tracks with temporary speed restriction due to deteriorating asset condition weighted by the time the restrictions are in place (not included in the yearly timetable)
km
Financial Costs
Data ID
Data label Data definition Data unit
70 Total OPEX Total IMs annual operational expenditures Local currency unit 71 Total maintenance
expenditures Total IMs annual maintenance expenditures Local currency unit
72 Total maintenance expenditures in stations
Total IMs annual maintenance expenditures in stations Local currency unit
73 Total traffic management expenditures
Total IMs annual traffic management expenditures Local currency unit
74 Total power consumption expenditures
Total IMs annual power consumption expenditures (all power consumption including traction energy)
Local currency unit
75 Total other operating expenditures
Total IMs annual other operating expenditures Local currency unit
76 Total financial expenditures Total IMs annual financial expenditures Local currency unit 77 Total other non operating
expenditures Total IMs annual other non operating expenditures Local currency unit
78 Total CAPEX Total IMs annual capital expenditures Local currency unit 79 Total renewal expenditures Total IMs annual renewal expenditures Local currency unit

32
80 Total renewal expenditures in stations
Total IMs annual renewal expenditures in stations Local currency unit
81 Total enhancements expenditures
Total IMs annual enhancement expenditures Local currency unit
82 Total enhancement expenditures in stations
Total IMs annual enhancement expenditures in stations Local currency unit
83 Total investment expenditures Total IMs annual investment expenditures Local currency unit 84 Total investment expenditures
in stations Total IMs annual investment expenditures in stations Local currency unit
85 Total other capital expenditures
Total IMs annual other capital expenditures Local currency unit
86 Total non operating expenditures
Total IMs annual non operating expenditures (sum of total IMs annual other non operating expenditures and total IMs annual financial expenditures)
Local currency unit
87 Total direct expenditures Total IMs annual direct expenditures in the meaning of Regulation (EU)2015/909 (expenditures that are directly incurred as a result of operating the train service)
Local currency unit
88 Total direct expenditures (OPEX)
Total IMs annual direct operational expenditures in the meaning of Regulation (EU)2015/909 (expenditures that are directly incurred as a result of operating the train service)
Local currency unit
89 Total direct expenditures (CAPEX)
Total IMs annual direct capital expenditures in the meaning of Regulation (EU)2015/909 (expenditures that are directly incurred as a result of operating the train service)
Local currency unit
90 Total renewal expenditures financed with grants
Total IMs annual renewal expenditures financed with grants
Local currency unit
91 Total investment expenditures financed with grants
Total IMs annual investment expenditures financed with grants
Local currency unit
92 Total enhancement expenditures financed with grants
Total IMs annual enhancement expenditures financed with grants
Local currency unit
93 Sum of total renewal and maintenance expenditures
Total IMs annual renewal and maintenance expenditures (sum of total IMs annual renewal expenditures and total IMs annual maintenance expenditures)
Local currency unit
94 Sum of total enhancement and investment expenditures
Total IMs annual enhancement and investment expenditures (sum of total IMs annual enhancement expenditures and total IMs annual investment expenditures)
Local currency unit
95 Total expenditures Total IMs annual expenditures (sum of total IMs annual operational expenditures and total IMs annual non operating expenditures and total IMs annual capital expenditures)
Local currency unit
Revenues
Data ID
Data label Data definition Data unit
96 Total revenues from non-access charges
Total IMs annual revenues from non-access charges (e.g. commercial letting, advertising, telecoms but excluding grants or subsidies)
Local currency unit
97 Total revenues Total IMs annual revenues (excluding grants or subsidies). Categories of access charges are: (1) Minimum Access Charge; (2) Other TAC charges; (3) Other Non-TAC charges (e.g. station access). Other revenues include e.g. commercial letting, advertising, telecoms.
Local currency unit
98 Total TAC revenues Total IMs annual TAC revenues (including freight, passenger and touristic trains)
Local currency unit
99 Total freight TAC revenues Total IMs annual freight TAC revenues Local currency unit

33
100 Total passenger TAC revenues
Total IMs annual passenger TAC revenues (including touristic trains)
Local currency unit
101 Total passenger conventional train TAC revenues
Total IMs annual passenger conventional train TAC revenues (excluding touristic trains)
Local currency unit
102 Total passenger high speed train TAC revenues
Total IMs annual passenger high speed train TAC revenues (excluding touristic trains)
Local currency unit
103 Total revenues for station access
Total IMs annual revenues for station access (including passenger and touristic trains)
Local currency unit
104 Total income from incentive/performance regimes
Total IMs annual income from incentive/performance regimes with customers (if applicable, no public grants or state subsidies)
Local currency unit
Growth Utilisation
Data ID
Data label Data definition Data unit
105 Total train-km Total train-km operated (revenue service + shunting operations to and from depots + IM’s work traffic)
km
106 Total freight train-km Total freight train-km (revenue service only, no shunting, no work trains)
km
107 Total passenger train-km Total passenger train-km (revenue service only, no shunting, no work trains)
km
108 Total passenger conventional train-km
Total passenger conventional train-km (revenue service only, no shunting, no work trains)
km
109 Total passenger high speed train-km
Total passenger high speed train-km (revenue service only, no shunting, no work trains)
km
110 Total diesel train-km Total diesel train-km operated (revenue service + shunting operations to and from depots + IM’s work traffic)
km
111 Total electric train-km Total electric train-km operated (revenue service + shunting operations to and from depots + IM’s work traffic)
km
112 Total train-km on main track Total train-km on main track (passenger and freight revenue service only, no shunting, no work trains)
km
113 Total passenger train-km on main track
Total passenger train-km on main track (revenue service only, no shunting, no work trains)
km
114 Total freight train-km on main track
Total freight train-km on main track (revenue service only, no shunting, no work trains)
km
115 Total gross tonne-km on main track
Total gross tonne-km on main track (passenger and freight revenue service only, no shunting, no work trains)
km
Asset Capability & ERTMS
Data ID
Data label Data definition Data unit
116 Total main track-km with ERTMS
Total main track-km with ERTMS in operation km
117 Total train-km on main tracks run with ERTMS
Total train-km on main tracks run with ERTMS in operation, i.e. main tracks equipped with both - ETCS (European train control system; any baseline or level) and GSM-R (Global System for Mobile Communications); and where ETCS and GSM-R are used in service
km
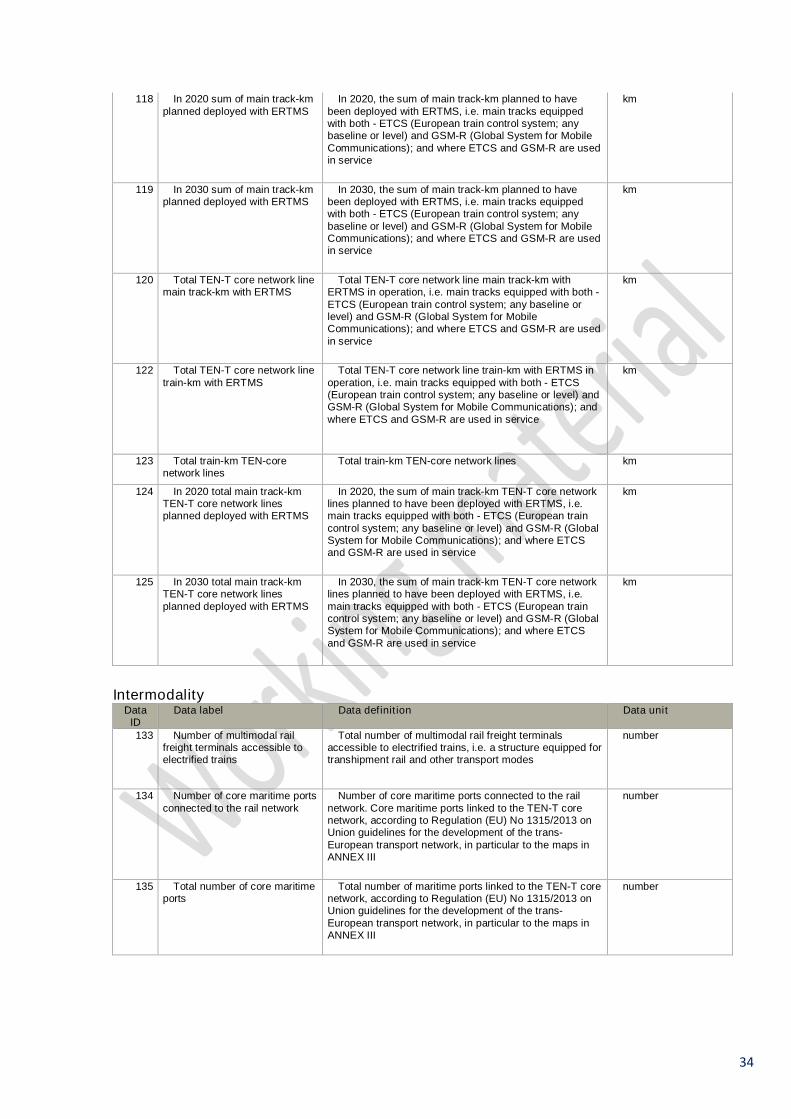
34
118 In 2020 sum of main track-km planned deployed with ERTMS
In 2020, the sum of main track-km planned to have been deployed with ERTMS, i.e. main tracks equipped with both - ETCS (European train control system; any baseline or level) and GSM-R (Global System for Mobile Communications); and where ETCS and GSM-R are used in service
km
119 In 2030 sum of main track-km planned deployed with ERTMS
In 2030, the sum of main track-km planned to have been deployed with ERTMS, i.e. main tracks equipped with both - ETCS (European train control system; any baseline or level) and GSM-R (Global System for Mobile Communications); and where ETCS and GSM-R are used in service
km
120 Total TEN-T core network line main track-km with ERTMS
Total TEN-T core network line main track-km with ERTMS in operation, i.e. main tracks equipped with both - ETCS (European train control system; any baseline or level) and GSM-R (Global System for Mobile Communications); and where ETCS and GSM-R are used in service
km
122 Total TEN-T core network line train-km with ERTMS
Total TEN-T core network line train-km with ERTMS in operation, i.e. main tracks equipped with both - ETCS (European train control system; any baseline or level) and GSM-R (Global System for Mobile Communications); and where ETCS and GSM-R are used in service
km
123 Total train-km TEN-core network lines
Total train-km TEN-core network lines km
124 In 2020 total main track-km TEN-T core network lines planned deployed with ERTMS
In 2020, the sum of main track-km TEN-T core network lines planned to have been deployed with ERTMS, i.e. main tracks equipped with both - ETCS (European train control system; any baseline or level) and GSM-R (Global System for Mobile Communications); and where ETCS and GSM-R are used in service
km
125 In 2030 total main track-km TEN-T core network lines planned deployed with ERTMS
In 2030, the sum of main track-km TEN-T core network lines planned to have been deployed with ERTMS, i.e. main tracks equipped with both - ETCS (European train control system; any baseline or level) and GSM-R (Global System for Mobile Communications); and where ETCS and GSM-R are used in service
km
Intermodality
Data ID
Data label Data definition Data unit
133 Number of multimodal rail freight terminals accessible to electrified trains
Total number of multimodal rail freight terminals accessible to electrified trains, i.e. a structure equipped for transhipment rail and other transport modes
number
134 Number of core maritime ports connected to the rail network
Number of core maritime ports connected to the rail network. Core maritime ports linked to the TEN-T core network, according to Regulation (EU) No 1315/2013 on Union guidelines for the development of the trans-European transport network, in particular to the maps in ANNEX III
number
135 Total number of core maritime ports
Total number of maritime ports linked to the TEN-T core network, according to Regulation (EU) No 1315/2013 on Union guidelines for the development of the trans-European transport network, in particular to the maps in ANNEX III
number

35
136 Number of core inland waterways connected to the rail network
Number of core inland waterways connected to the rail network. Core inland waterways linked to the TEN-T core network, according to Regulation (EU) No 1315/2013 on Union guidelines for the development of the trans-European transport network, in particular to the maps in ANNEX III
number
137 Total number of core inland waterways
Total number of core inland waterways linked to the TEN-T core network, according to Regulation (EU) No 1315/2013 on Union guidelines for the development of the trans-European transport network, in particular to the maps in ANNEX III
number
138 Number of core airports connected to the rail network
Number of core airports connected to the rail network. Core airports linked to the TEN-T core network, according to Regulation (EU) No 1315/2013 on Union guidelines for the development of the trans-European transport network, in particular to the maps in ANNEX III
number
139 Total number of core airports Total number of core airports linked to the TEN-T core network, according to Regulation (EU) No 1315/2013 on Union guidelines for the development of the trans-European transport network, in particular to the maps in ANNEX III
number
140 Number of public passenger railway stations with connections to public urban transport
Number of public passenger railway stations with connections to public urban transport (metro, bus, tramways, light rail, ferries etc…) within the entire railway infrastructure network, independent of ownership
number
141 Total number of passengers registered in accessible stations per year
Total number of passengers registered annually in all accessible stations within the entire railway infrastructure network, independent of ownership. An accessible station is one on which a passenger can, from entering the station, reach the platform via level-access, without steps or equivalent.
number
142 Total number of passengers Total number of passengers number
Appendix 2: Background information Background information is consisting of various data within the areas charging, organisation, human resources, asset information, railway market, country characteristics, policies and plans. Part of background is also finance. In addition to the KPIs, Background information serves as a tool to make good analysis and making the right conclusions.
Unless otherwise stated, data should be provided as it stands on 31 December of the data year. However, if a major in-year change has occurred (e.g. opening of a significant section of new high speed line, the effect of this on, for example, network length, should be pro-rated. Data which is provided by the European Commission are national statistics. Asset information
Data ID
Data label Data definition Data unit
56 Length of main tracks of congested infrastructure
Length of main tracks of congested infrastructure according to Article 47(1) of Directive 2012/34/EU ( in respect of the situation at the end of the reporting period) (Source: European Commission, RMMS)
km
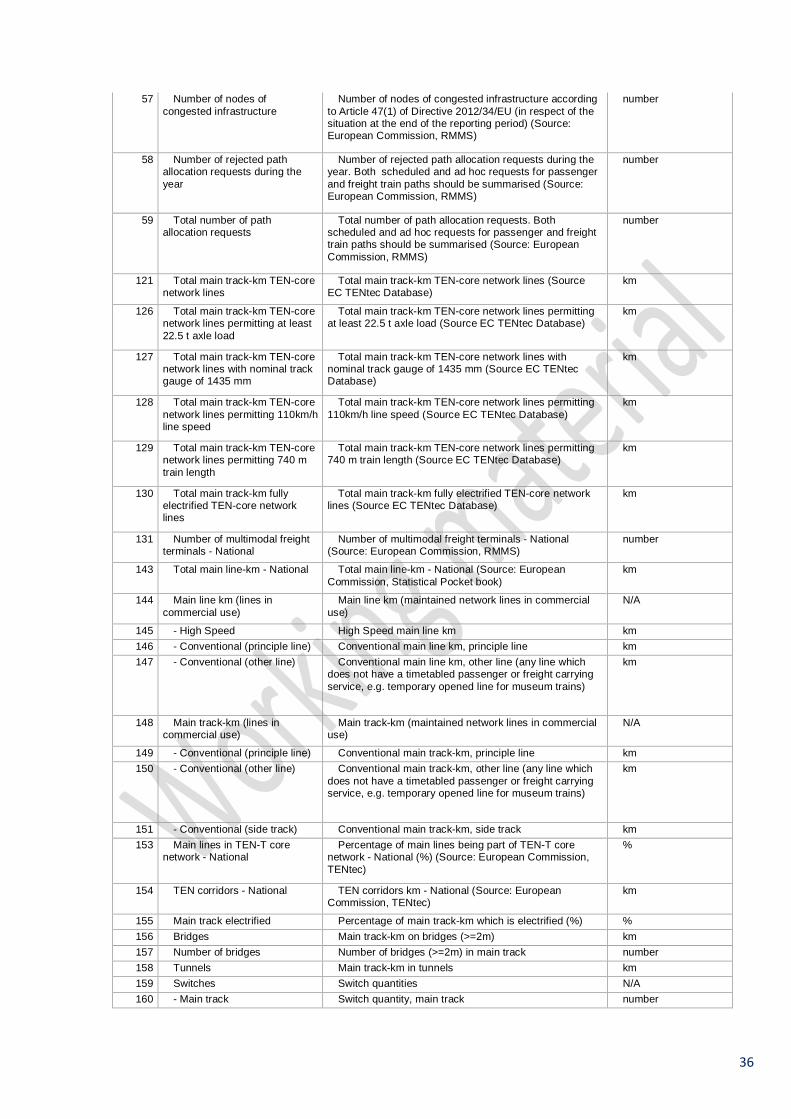
36
57 Number of nodes of congested infrastructure
Number of nodes of congested infrastructure according to Article 47(1) of Directive 2012/34/EU (in respect of the situation at the end of the reporting period) (Source: European Commission, RMMS)
number
58 Number of rejected path allocation requests during the year
Number of rejected path allocation requests during the year. Both scheduled and ad hoc requests for passenger and freight train paths should be summarised (Source: European Commission, RMMS)
number
59 Total number of path allocation requests
Total number of path allocation requests. Both scheduled and ad hoc requests for passenger and freight train paths should be summarised (Source: European Commission, RMMS)
number
121 Total main track-km TEN-core network lines
Total main track-km TEN-core network lines (Source EC TENtec Database)
km
126 Total main track-km TEN-core network lines permitting at least 22.5 t axle load
Total main track-km TEN-core network lines permitting at least 22.5 t axle load (Source EC TENtec Database)
km
127 Total main track-km TEN-core network lines with nominal track gauge of 1435 mm
Total main track-km TEN-core network lines with nominal track gauge of 1435 mm (Source EC TENtec Database)
km
128 Total main track-km TEN-core network lines permitting 110km/h line speed
Total main track-km TEN-core network lines permitting 110km/h line speed (Source EC TENtec Database)
km
129 Total main track-km TEN-core network lines permitting 740 m train length
Total main track-km TEN-core network lines permitting 740 m train length (Source EC TENtec Database)
km
130 Total main track-km fully electrified TEN-core network lines
Total main track-km fully electrified TEN-core network lines (Source EC TENtec Database)
km
131 Number of multimodal freight terminals - National
Number of multimodal freight terminals - National (Source: European Commission, RMMS)
number
143 Total main line-km - National Total main line-km - National (Source: European Commission, Statistical Pocket book)
km
144 Main line km (lines in commercial use)
Main line km (maintained network lines in commercial use)
N/A
145 - High Speed High Speed main line km km 146 - Conventional (principle line) Conventional main line km, principle line km 147 - Conventional (other line) Conventional main line km, other line (any line which
does not have a timetabled passenger or freight carrying service, e.g. temporary opened line for museum trains)
km
148 Main track-km (lines in commercial use)
Main track-km (maintained network lines in commercial use)
N/A
149 - Conventional (principle line) Conventional main track-km, principle line km 150 - Conventional (other line) Conventional main track-km, other line (any line which
does not have a timetabled passenger or freight carrying service, e.g. temporary opened line for museum trains)
km
151 - Conventional (side track) Conventional main track-km, side track km 153 Main lines in TEN-T core
network - National Percentage of main lines being part of TEN-T core
network - National (%) (Source: European Commission, TENtec)
%
154 TEN corridors - National TEN corridors km - National (Source: European Commission, TENtec)
km
155 Main track electrified Percentage of main track-km which is electrified (%) % 156 Bridges Main track-km on bridges (>=2m) km 157 Number of bridges Number of bridges (>=2m) in main track number 158 Tunnels Main track-km in tunnels km 159 Switches Switch quantities N/A 160 - Main track Switch quantity, main track number
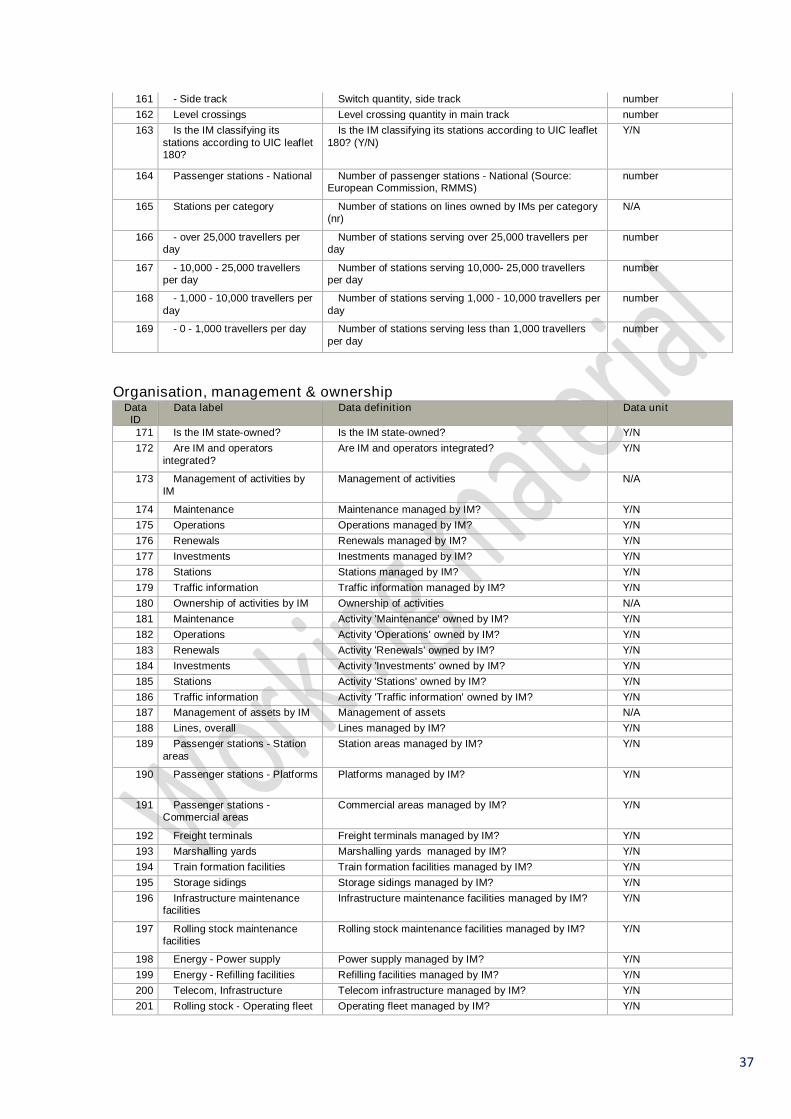
37
161 - Side track Switch quantity, side track number 162 Level crossings Level crossing quantity in main track number 163 Is the IM classifying its
stations according to UIC leaflet 180?
Is the IM classifying its stations according to UIC leaflet 180? (Y/N)
Y/N
164 Passenger stations - National Number of passenger stations - National (Source: European Commission, RMMS)
number
165 Stations per category Number of stations on lines owned by IMs per category (nr)
N/A
166 - over 25,000 travellers per day
Number of stations serving over 25,000 travellers per day
number
167 - 10,000 - 25,000 travellers per day
Number of stations serving 10,000- 25,000 travellers per day
number
168 - 1,000 - 10,000 travellers per day
Number of stations serving 1,000 - 10,000 travellers per day
number
169 - 0 - 1,000 travellers per day Number of stations serving less than 1,000 travellers per day
number
Organisation, management & ownership Data
ID Data label Data definition Data unit
171 Is the IM state-owned? Is the IM state-owned? Y/N 172 Are IM and operators
integrated? Are IM and operators integrated? Y/N
173 Management of activities by IM
Management of activities N/A
174 Maintenance Maintenance managed by IM? Y/N 175 Operations Operations managed by IM? Y/N 176 Renewals Renewals managed by IM? Y/N 177 Investments Inestments managed by IM? Y/N 178 Stations Stations managed by IM? Y/N 179 Traffic information Traffic information managed by IM? Y/N 180 Ownership of activities by IM Ownership of activities N/A 181 Maintenance Activity 'Maintenance' owned by IM? Y/N 182 Operations Activity 'Operations' owned by IM? Y/N 183 Renewals Activity 'Renewals' owned by IM? Y/N 184 Investments Activity 'Investments' owned by IM? Y/N 185 Stations Activity 'Stations' owned by IM? Y/N 186 Traffic information Activity 'Traffic information' owned by IM? Y/N 187 Management of assets by IM Management of assets N/A 188 Lines, overall Lines managed by IM? Y/N 189 Passenger stations - Station
areas Station areas managed by IM? Y/N
190 Passenger stations - Platforms Platforms managed by IM? Y/N
191 Passenger stations - Commercial areas
Commercial areas managed by IM? Y/N
192 Freight terminals Freight terminals managed by IM? Y/N 193 Marshalling yards Marshalling yards managed by IM? Y/N 194 Train formation facilities Train formation facilities managed by IM? Y/N 195 Storage sidings Storage sidings managed by IM? Y/N 196 Infrastructure maintenance
facilities Infrastructure maintenance facilities managed by IM? Y/N
197 Rolling stock maintenance facilities
Rolling stock maintenance facilities managed by IM? Y/N
198 Energy - Power supply Power supply managed by IM? Y/N 199 Energy - Refilling facilities Refilling facilities managed by IM? Y/N 200 Telecom, Infrastructure Telecom infrastructure managed by IM? Y/N 201 Rolling stock - Operating fleet Operating fleet managed by IM? Y/N

38
202 Rolling stock - Maintenance fleet
Rolling stock maintenance fleet managed by IM? Y/N
203 Ownership of assets by IM Ownership of assets N/A 204 Lines, overall Lines owned by IM? Y/N 205 Passenger stations - Station
areas Station areas owned by IM? Y/N
206 Passenger stations - Platforms Platforms owned by IM? Y/N
207 Passenger stations - Commercial areas
Commercial areas owned by IM? Y/N
208 Freight terminals Freight terminals owned by IM? Y/N 209 Marshalling yards Marshalling yards owned by IM? Y/N 210 Train formation facilities Train formation facilities owned by IM? Y/N 211 Storage sidings Storage sidings owned by IM? Y/N 212 Infrastructure maintenance
facilities Infrastructure maintenance facilities owned by IM? Y/N
213 Rolling stock maintenance facilities
Rolling stock maintenance facilities owned by IM? Y/N
214 Energy - Power supply Power supply owned by IM? Y/N 215 Energy - Refilling facilities Refilling facilities owned by IM? Y/N 216 Telecom, Infrastructure Telecom infrastructure owned by IM? Y/N 217 Rolling stock - Operating fleet Operating fleet owned by IM? Y/N 218 Rolling stock - Maintenance
fleet Rolling stock maintenance fleet owned by IM? Y/N
Human resources Data
ID Data label Data definition Data unit
219 Number of FTE employees working within IMs company
Total number of FTE employees working within IMs Company, excluding subcontractors (quantity)
number
220 Age average of IM's employees
Age average of IM's employees years
221 Age distribution of IM's employees
What is the age distribution of IM's employees? N/A
222 - < 30 years Percentage of IM's employees < 30 years of age % 223 - 30 - 50 years Percentage of IM's employees 30 - 50 years of age % 224 - > 50 years Percentage of IM's employees > 50 years of age % 225 Male employees among IM's
workforce Percentage of male employees among IM's workforce %
Railway market The KPIs for customer satisfaction show which IMs are carrying out any surveys or other quality analysis of the service provided, both related to end user customers and/or Railway Undertakings (RUs). The purpose of the matrix in the background information is to give an overview of the contents of the measurements included in the analysis for each IM. The idea is to first present the degree of satisfaction from surveys from both RUs and end user customers for total satisfaction segmented between freight and passenger transport. The next step will be to present time series data for satisfaction surveys.
Data ID
Data label Data definition Data unit
226 Market/Modal shares - National
Market/Modal shares - National N/A
227 - Freight - Railway Freight modal share - Railway (%) (Source: European Commission, Statistical Pocket book)
%
228 - Freight - Inland waterways Freight modal share - Inland waterways (%) (Source: European Commission, Statistical Pocket book)
%
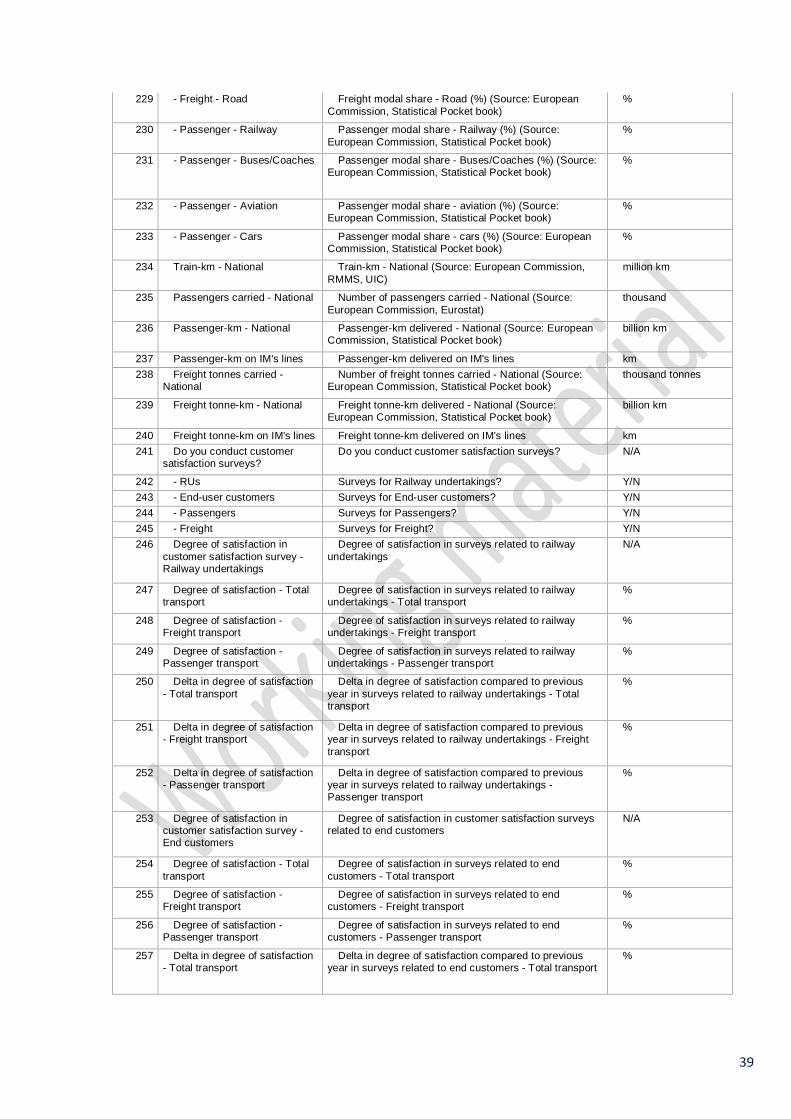
39
229 - Freight - Road Freight modal share - Road (%) (Source: European Commission, Statistical Pocket book)
%
230 - Passenger - Railway Passenger modal share - Railway (%) (Source: European Commission, Statistical Pocket book)
%
231 - Passenger - Buses/Coaches Passenger modal share - Buses/Coaches (%) (Source: European Commission, Statistical Pocket book)
%
232 - Passenger - Aviation Passenger modal share - aviation (%) (Source: European Commission, Statistical Pocket book)
%
233 - Passenger - Cars Passenger modal share - cars (%) (Source: European Commission, Statistical Pocket book)
%
234 Train-km - National Train-km - National (Source: European Commission, RMMS, UIC)
million km
235 Passengers carried - National Number of passengers carried - National (Source: European Commission, Eurostat)
thousand
236 Passenger-km - National Passenger-km delivered - National (Source: European Commission, Statistical Pocket book)
billion km
237 Passenger-km on IM's lines Passenger-km delivered on IM's lines km 238 Freight tonnes carried -
National Number of freight tonnes carried - National (Source:
European Commission, Statistical Pocket book) thousand tonnes
239 Freight tonne-km - National Freight tonne-km delivered - National (Source: European Commission, Statistical Pocket book)
billion km
240 Freight tonne-km on IM's lines Freight tonne-km delivered on IM's lines km 241 Do you conduct customer
satisfaction surveys? Do you conduct customer satisfaction surveys? N/A
242 - RUs Surveys for Railway undertakings? Y/N 243 - End-user customers Surveys for End-user customers? Y/N 244 - Passengers Surveys for Passengers? Y/N 245 - Freight Surveys for Freight? Y/N 246 Degree of satisfaction in
customer satisfaction survey - Railway undertakings
Degree of satisfaction in surveys related to railway undertakings
N/A
247 Degree of satisfaction - Total transport
Degree of satisfaction in surveys related to railway undertakings - Total transport
%
248 Degree of satisfaction - Freight transport
Degree of satisfaction in surveys related to railway undertakings - Freight transport
%
249 Degree of satisfaction - Passenger transport
Degree of satisfaction in surveys related to railway undertakings - Passenger transport
%
250 Delta in degree of satisfaction - Total transport
Delta in degree of satisfaction compared to previous year in surveys related to railway undertakings - Total transport
%
251 Delta in degree of satisfaction - Freight transport
Delta in degree of satisfaction compared to previous year in surveys related to railway undertakings - Freight transport
%
252 Delta in degree of satisfaction - Passenger transport
Delta in degree of satisfaction compared to previous year in surveys related to railway undertakings - Passenger transport
%
253 Degree of satisfaction in customer satisfaction survey - End customers
Degree of satisfaction in customer satisfaction surveys related to end customers
N/A
254 Degree of satisfaction - Total transport
Degree of satisfaction in surveys related to end customers - Total transport
%
255 Degree of satisfaction - Freight transport
Degree of satisfaction in surveys related to end customers - Freight transport
%
256 Degree of satisfaction - Passenger transport
Degree of satisfaction in surveys related to end customers - Passenger transport
%
257 Delta in degree of satisfaction - Total transport
Delta in degree of satisfaction compared to previous year in surveys related to end customers - Total transport
%

40
258 Delta in degree of satisfaction - Freight transport
Delta in degree of satisfaction compared to previous year in surveys related to end customers - Freight transport
%
259 Delta in degree of satisfaction - Passenger transport
Delta in degree of satisfaction compared to previous year in surveys related to end customers - Passenger transport
%
260 Main areas covered by the customer satisfaction survey - Railway undertakings
Overview of quality measurements included in survey related to railway undertakings
N/A
261 Punctuality - Freight Punctuality (freight) included in survey? Y/N 262 Capacity - Freight Capacity (freight) included in survey? Y/N 263 Traffic management - Freight Traffic management (freight) included in survey? Y/N 264 Traffic information - Freight Traffic information (freight) included in survey? Y/N 265 Modal integration - Freight Modal integration (freight) included in survey? Y/N 266 Business relations - Freight Business relations (freight) included in survey? Y/N 267 Quality management - Freight Quality management (freight) included in survey? Y/N 268 Punctuality - Passenger Punctuality (passengers) included in survey? Y/N 269 Capacity - Passenger Capacity (passengers) included in survey? Y/N 270 Traffic management -
Passenger Traffic management (passengers) included in survey? Y/N
271 Traffic information - Passenger
Traffic information (passengers) included in survey? Y/N
272 Modal integration - Passenger Modal integration (passengers) included in survey? Y/N 273 Station areas - Passenger Station areas (passengers) included in survey? Y/N 274 Business relations -
Passenger Business relations (passengers) included in survey? Y/N
275 Quality management - Passenger
Quality management (passengers) included in survey? Y/N
276 Main areas covered by the customer satisfaction survey - End customer
Overview of quality measurements included in survey related to end customers
N/A
277 Punctuality - Freight Punctuality (freight) included in survey? Y/N 278 Capacity - Freight Capacity (freight) included in survey? Y/N 279 Traffic management - Freight Traffic management (freight) included in survey? Y/N 280 Traffic information - Freight Traffic information (freight) included in survey? Y/N 281 Modal integration - Freight Modal integration (freight) included in survey? Y/N 282 Quality management - Freight Quality management (freight) included in survey? Y/N 283 Punctuality - Passenger Punctuality (passengers) included in survey? Y/N 284 Capacity - Passenger Capacity (passengers) included in survey? Y/N 285 Traffic management -
Passenger Traffic management (passengers) included in survey? Y/N
286 Traffic information - Passenger
Traffic information (passengers) included in survey? Y/N
287 Modal integration - Passenger Modal integration (passengers) included in survey? Y/N 288 Station areas - Passenger Station areas (passengers) included in survey? Y/N 289 Quality management -
Passenger Quality management (passengers) included in survey? Y/N
Country characteristics Data
ID Data label Data definition Data unit
290 Country area Country area (Source: European Commission, Eurostat) thousand km2
291 Population Number of persons living in the country area (Source: European Commission, Eurostat)
million persons
292 Nominal GDP GDP (nominal) (Source: European Commission, Eurostat)
billion Euro
293 GDP per capita GDP per capita (Source: European Commission, Eurostat)
Index, EU-28=100

41
294 Number of border countries Number of border countries (Source: European Commission, Static)
number
295 Currency Currency (Source: European Commission, European Central Bank)
text
296 Average annual exchange rate Average annual exchange rate (Source: European Commission, European Central Bank)
Local currency unit/Euro
297 Purchasing power parity Purchasing power parity (Price level indices and real expenditures for ESA 2010 aggregates) (Source: European Commission, Eurostat PPP)
Index, EU-28=1
372 Population density Population density (Source: European Commission, Eurostat)
Persons per km2
Policies and plans
Data ID
Data label Data definition Data unit
298 Does IM have an asset management system based on ISO55000 or PAS55?
Does the IM organisation have an Asset Management System based on the requirements within ISO55000 or the PAS55 guidelines? (Y/N)
Y/N
299 Does IM apply a structured self-assessment matrix?
Does the IM apply a structured self-assessment matrix to identify main short-comings in the Asset Management Capability? (Y/N)
Y/N
300 Or is the asset management capability assessed externally?
Or is the Asset Management Capability assessed by an external authority? (Y/N), (if yes assessment every xxx year.)
Y/N
301 If yes, how long are asset management capability assessesment intervals?
If the Asset Management Capability is assed by an external authority, how long are the assessment intervals in years?
years
302 Does IM have a plan for deployment of ERTMs accepted by the government?
The IM has a plan for deployment of ERTMs accepted by the government. (Y/N)
Y/N
303 Is IM responsible for drafting action plan regarding noise?
Are you as an IM responsible for drafting action plan regarding noise? (Y/N)
Y/N
304 Does IM produce saturation or congestion maps?
Do you produce saturation or congestion maps on the national level? (Y/N)
Y/N
305 Were noise maps compiled? Were noise maps compiled along the railway network? (Y/N)
Y/N
306 Does IM conduct acoustic grinding?
Do you conduct acoustic grinding on the railway network? (Y/N)
Y/N
307 Does IM have programs to support quieter trains?
Do you have programs to support quieter trains (retrofitting freight trains)? (Y/N)
Y/N
308 Does IM subsidize noise proof windows?
Do you subsidize noise proof windows? (Y/N) Y/N
309 Strategy infrastructure plans and contractual agreements
Strategy infrastructure plans and contractual agreements
N/A
310 - Date of adoption/signature - Date of adoption/signature date 311 - Duration - Duration years
Charging
Data ID
Data label Data definition Data unit
312 Minimum access package charges
Minimum access package charges used by IM N/A
313 Do you apply the direct cost principle in your charging system?
Do you apply the direct cost principle in your charging system? (Article 31(3))
Y/N
314 Direct cost principle - Tariff structure varies with activity?
Does the tariff structure vary with the activity? (Article 31(3))
Y/N
315 Direct cost principle - Tariff structure varies with something else?
Does the tariff structure vary with something else? (Article 31(3))
Y/N
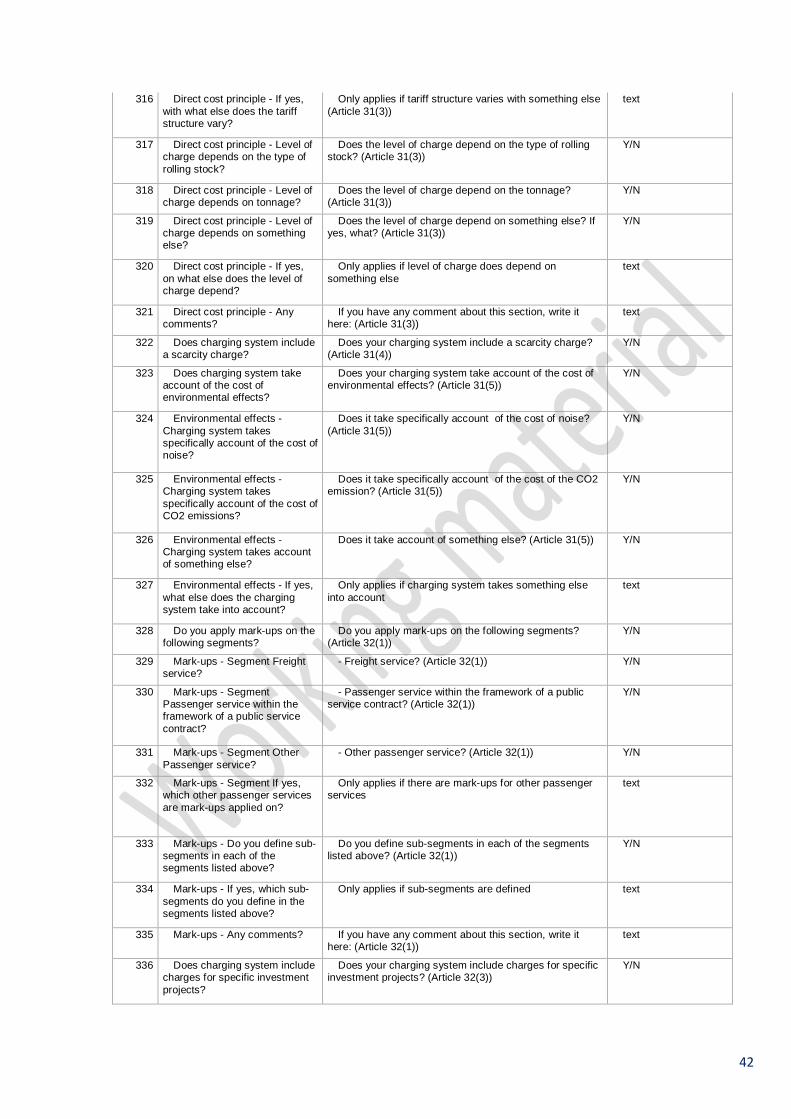
42
316 Direct cost principle - If yes, with what else does the tariff structure vary?
Only applies if tariff structure varies with something else (Article 31(3))
text
317 Direct cost principle - Level of charge depends on the type of rolling stock?
Does the level of charge depend on the type of rolling stock? (Article 31(3))
Y/N
318 Direct cost principle - Level of charge depends on tonnage?
Does the level of charge depend on the tonnage? (Article 31(3))
Y/N
319 Direct cost principle - Level of charge depends on something else?
Does the level of charge depend on something else? If yes, what? (Article 31(3))
Y/N
320 Direct cost principle - If yes, on what else does the level of charge depend?
Only applies if level of charge does depend on something else
text
321 Direct cost principle - Any comments?
If you have any comment about this section, write it here: (Article 31(3))
text
322 Does charging system include a scarcity charge?
Does your charging system include a scarcity charge? (Article 31(4))
Y/N
323 Does charging system take account of the cost of environmental effects?
Does your charging system take account of the cost of environmental effects? (Article 31(5))
Y/N
324 Environmental effects - Charging system takes specifically account of the cost of noise?
Does it take specifically account of the cost of noise? (Article 31(5))
Y/N
325 Environmental effects - Charging system takes specifically account of the cost of CO2 emissions?
Does it take specifically account of the cost of the CO2 emission? (Article 31(5))
Y/N
326 Environmental effects - Charging system takes account of something else?
Does it take account of something else? (Article 31(5)) Y/N
327 Environmental effects - If yes, what else does the charging system take into account?
Only applies if charging system takes something else into account
text
328 Do you apply mark-ups on the following segments?
Do you apply mark-ups on the following segments? (Article 32(1))
Y/N
329 Mark-ups - Segment Freight service?
- Freight service? (Article 32(1)) Y/N
330 Mark-ups - Segment Passenger service within the framework of a public service contract?
- Passenger service within the framework of a public service contract? (Article 32(1))
Y/N
331 Mark-ups - Segment Other Passenger service?
- Other passenger service? (Article 32(1)) Y/N
332 Mark-ups - Segment If yes, which other passenger services are mark-ups applied on?
Only applies if there are mark-ups for other passenger services
text
333 Mark-ups - Do you define sub-segments in each of the segments listed above?
Do you define sub-segments in each of the segments listed above? (Article 32(1))
Y/N
334 Mark-ups - If yes, which sub-segments do you define in the segments listed above?
Only applies if sub-segments are defined text
335 Mark-ups - Any comments? If you have any comment about this section, write it here: (Article 32(1))
text
336 Does charging system include charges for specific investment projects?
Does your charging system include charges for specific investment projects? (Article 32(3))
Y/N

43
337 Does charging system include a possession charge?
Does your charging system include a possession charge? (Article 31(9))
Y/N
338 Incentive regimes Incentive regimes used by IM N/A 339 Are time-limited discounts
commonly applied? Is it common for you to apply time-limited discounts to
encourage the development of new rail services, or discounts encouraging the use of considerably underutilised lines? (Article 33)
Y/N
340 Have you implemented a performance scheme?
Have you implemented a performance scheme? (Article 35)
Y/N
341 Do you have a distinction in charges for ETCS trains?
Do you have a distinction in your charges for the trains equiped with ETCS? (Article 32.4)
Y/N
342 Does charging system include a reservation charge for unused capacity?
Does your charging system include a reservation charge for capacity that is allocated but not used? (Article 36)
Y/N
Revenues & Funding
Data ID
Data label Data definition Data unit
343 Grants Grants N/A 344 Grants, Total Total Grants Local currency unit 345 Grants, P&L Total Grants, of which P&L Local currency unit 346 Grants, CAPEX Total Grants, of which CAPEX Local currency unit 347 Grants - Operation and
maintenance, P&L Total Operation and maintenance, of which P&L Local currency unit
348 Grants - Renewals and Enhancements, CAPEX
Total Renewals and Enhancements, of which CAPEX Local currency unit
349 Grants - Others, Total Total Others Local currency unit 350 Grants - Others, P&L Total Others, of which P&L Local currency unit 351 Grants - Others, CAPEX Total Others, of which CAPEX Local currency unit 352 Charges Charges N/A 353 Charges, P&L Total Charges, of which P&L Local currency unit 354 Charges - Minimum access
package charges, P&L Total Minimum access package charges, of which P&L Local currency unit
355 Charges - Incentive regimes, P&L
Total Incentive regimes, of which P&L Local currency unit
356 Charges - Charges for service facilities, P&L
Total Charges for service facilities, of which P&L Local currency unit
357 Property rental income, P&L Total property rental income, of which P&L Local currency unit 358 Electricity supply, P&L Electricity supply, of which P&L Local currency unit 359 Borrowing, CAPEX Borrowing, of which CAPEX Local currency unit 360 Other fundings, P&L Other fundings, of which P&L Local currency unit 361 Total IM's revenues and
funding Total IM's revenues and funding N/A
362 Total IM's revenues and funding, Total
Total IM's revenues and funding Local currency unit
363 Total IM's revenues and funding, P&L
Total IM's revenues and funding, of which P&L Local currency unit
364 Total IM's revenues and funding, CAPEX
Total IM's revenues and funding, of which CAPEX Local currency unit
365 Revenues and funding - Costs&Investment
Revenues and funding - Costs&Investment N/A
366 Revenues and funding - Costs&Investment, Total
Revenues and funding - Costs&Investment Local currency unit
367 Revenues and funding - Costs&Investment, P&L
Revenues and funding - Costs&Investment, of which P&L
Local currency unit
368 Revenues and funding - Costs&Investment, CAPEX
Revenues and funding - Costs&Investment, of which CAPEX
Local currency unit
369 Depreciation, P&L Depreciation, of which P&L Local currency unit 370 P&L Net result P&L Net result Local currency unit

44

45
Appendix 3: Causes for delays and cancelled services Source: UIC CODE, 450 – 2, OR, 5th edition, June 2009 Causes within coloured boxes are considered as IM responsibilities. Traffic Management Asset Processes Weather Other IMs
Infrastructure Manager Railway undertakings
Operational/
planning
management
Infrastructure
installations
Civil
Engineering
causes
Causes of
other IMs
Commercial
causes
Rolling stock Causes of
other RUs
External
causes
Secondary
causes
-0 1- 2- 3- 5- 6- 7- 8- 9-
-1 Time table compilation
Signalling installations
Planned construction works
Delay caused by next IM
Exceeding the stop time
Roster planning re -rostering
Delay caused by next RU
Strike Dangerous incidents, accidents and hazards
-2 Formation of train by infrastructure manager
Signalling installations at level crossings
Irregularities in execution of construction work
Delay caused by previous IM
Request of the RU
Formation of train by Railway Undertaking
Delay caused by previous RU
Administrative formalities
Track occupation caused by the lateness of the same train
-3 Mistakes in operational procedures
Tele-communication installations
Speed restriction due to defective track
Loading operations
Problems affecting coaches (passenger transport)
Outside influence
Track occupation caused by the lateness of another train
-4 Wrong application of Level rules
Power supply equipment
Loading irregularities
Problems affecting wagons (freight transport)
Effects of weather and natural causes
Turn round
-5 Track Commercial
preparation of train
Problems affecting power cars, locomotives and rail cars
Delay caused by external reasons of the next net word
Connection
.-6 Structures Further
investigation needed
-7
-8 Staff Staff Staff Staff
-9 Other causes Other causes Other causes Other causes Other reasons Other causes
Version 2.0 – 20th September 2017 46
Appendix 4: Charges for using the infrastructure and related services The Directive 2012/34/EU “Establishing a single European railway area”, known also as SERA-Directive or Recast, defines next to other items the charging principles. The Directive is based on Directives published before (91/440/EEC, 95/18/EC, 2001/14/EC). The general charging principles have not been changed, but were defined more strictly from Directive to Directive. The track access charges (TAC) “shall be set at the cost that is directly incurred as a result of operating the train service.” This verbal description led to numerous different levels of TACs throughout Europe over the years, but it is doubtlessly meant to charge for the marginal cost. Summing it up, authorized charges according to Directive 2012/34/EU consists of nine main cost components, depending on the package or service that is charged:
1. Direct Cost Charging 2. Charging Full Cost + Reasonable Profit 3. Possession Charges 4. Mark Ups 5. Charges For Specific Investment Projects 6. ETCS Charge Differentiation 7. Discounts 8. Performance Related Charges 9. Reservation Charge
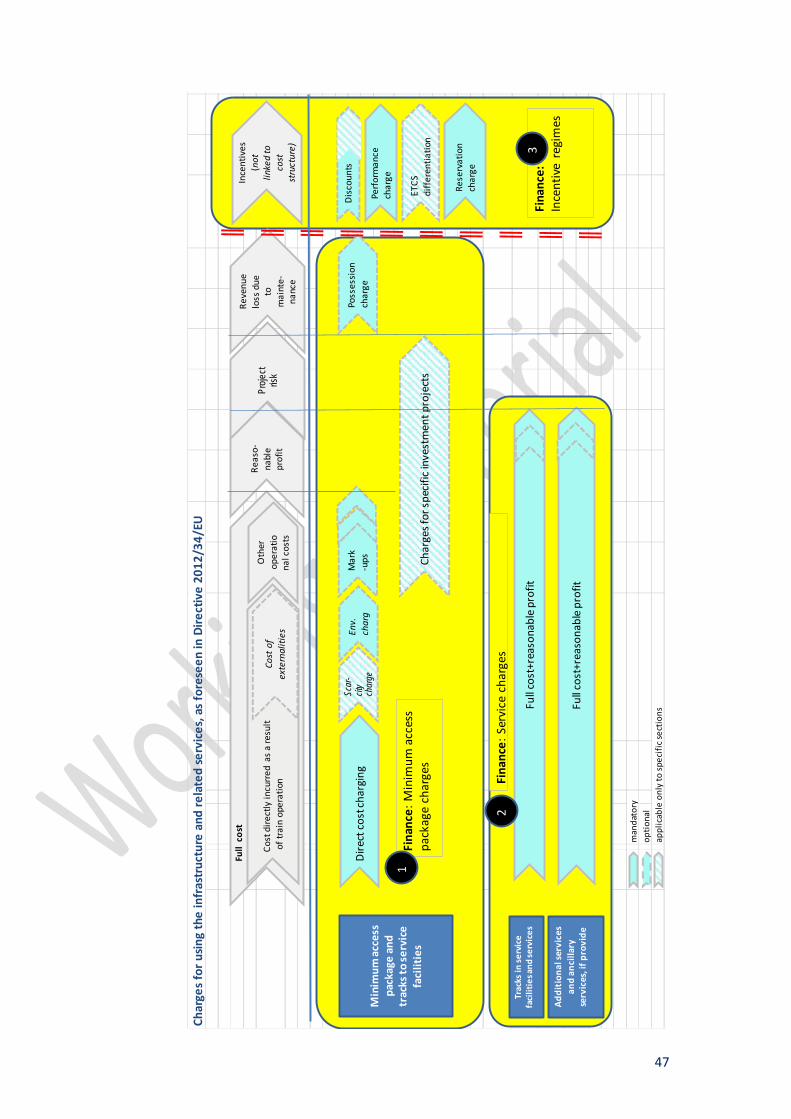
47
Char
ges f
or u
sing
the
infr
astr
uctu
re a
nd re
late
d se
rvic
es, a
s for
esee
n in
Dire
ctiv
e 20
12/3
4/EU
man
dato
ryop
tiona
lap
plic
able
onl
y to
spec
ific s
ectio
ns
Full
cos
t
Cost
dire
ctly
incu
rred
as
a re
sult
oftra
in o
pera
tion
Oth
er
oper
atio
nalc
osts
Reas
o-na
ble
prof
it
Proje
ct ris
kCo
st o
f ex
tern
aliti
es
Reve
nue
loss
due
to
m
aint
e-na
nce
Dire
ctco
st ch
argi
ng
Full c
ost+
reas
onab
le p
rofit
Full
cost
+rea
sona
ble
prof
it
Scar
-cit
y ch
arge
Env.
ch
arg
Mar
k-u
psM
inim
um a
cces
s pa
ckag
e an
d tr
acks
to se
rvic
e fa
cilit
ies
Trac
ksin
serv
ice
faci
litie
s and
serv
ices
Addi
tion
al se
rvic
es
and
anci
llary
se
rvic
es, i
f pro
vide
Poss
essi
on
char
ge
Ince
ntiv
es(n
ot
linke
d to
co
st
stru
ctur
e)
Dis
coun
ts
Perf
orm
ance
ch
arge
ETCS
di
ffer
entia
tion
Rese
rvat
ion
char
ge
Char
ges f
or sp
ecifi
c in
vest
men
t pro
ject
s
Fina
nce:
Ince
ntiv
e re
gim
es
Fina
nce:
Min
imum
acc
ess
pack
age
char
ges
Fina
nce:
Ser
vice
cha
rges
1
2
3

PRIME - Key Performance indicators for performance benchmarking – Version 2.0 – 20th September 2017
Appendix 5: Glossary of terms The glossary defines the terms used in this catalogue. Figures 5 and 6 illustrate the definitional structure for sub-categories of track-km and line-km. Figure 7 illustrates delay curves to estimate the total number of delays for different delay thresholds. Figure 8 illustrates the methodology how to calculated the time loss due to speed restrictions. This is followed by the definitions for all other relevant terms.
The Glossary is a live, work in progress document maintained by the sub group and was last updated 20/09/2017 and will be updated in the next version of the Catalogue.
Figure 5: Track-km – Definitional structure
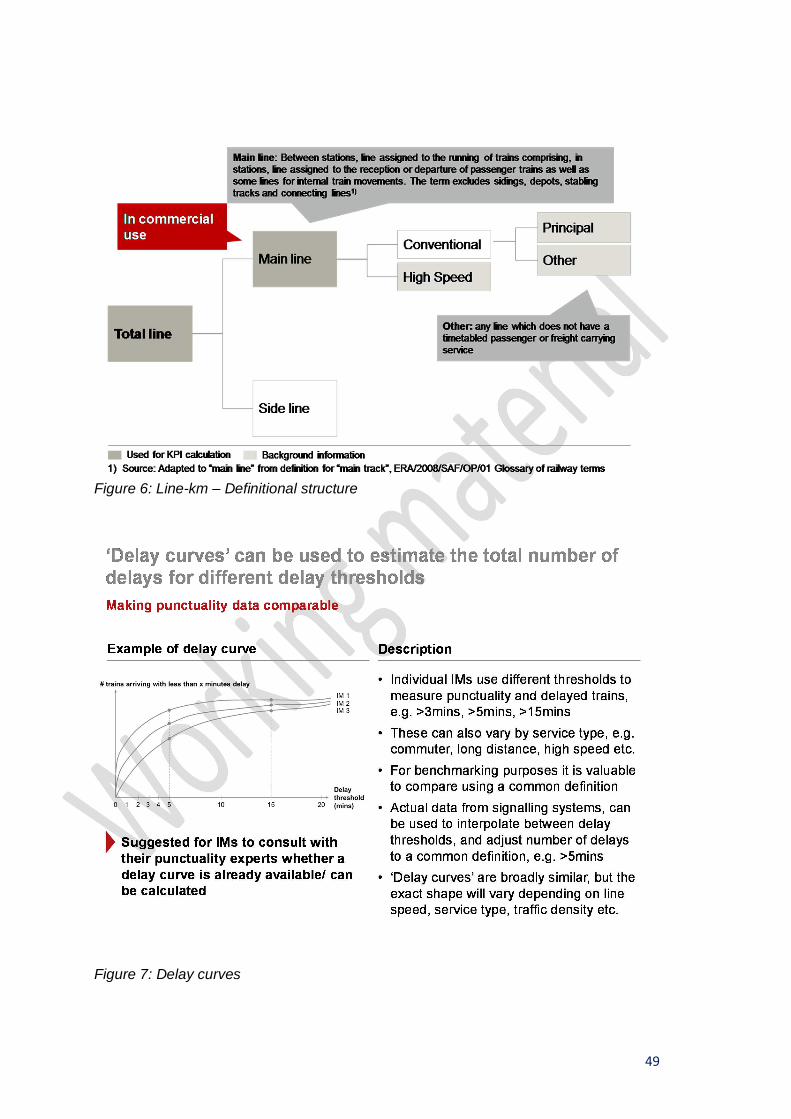
49
Figure 6: Line-km – Definitional structure
Figure 7: Delay curves
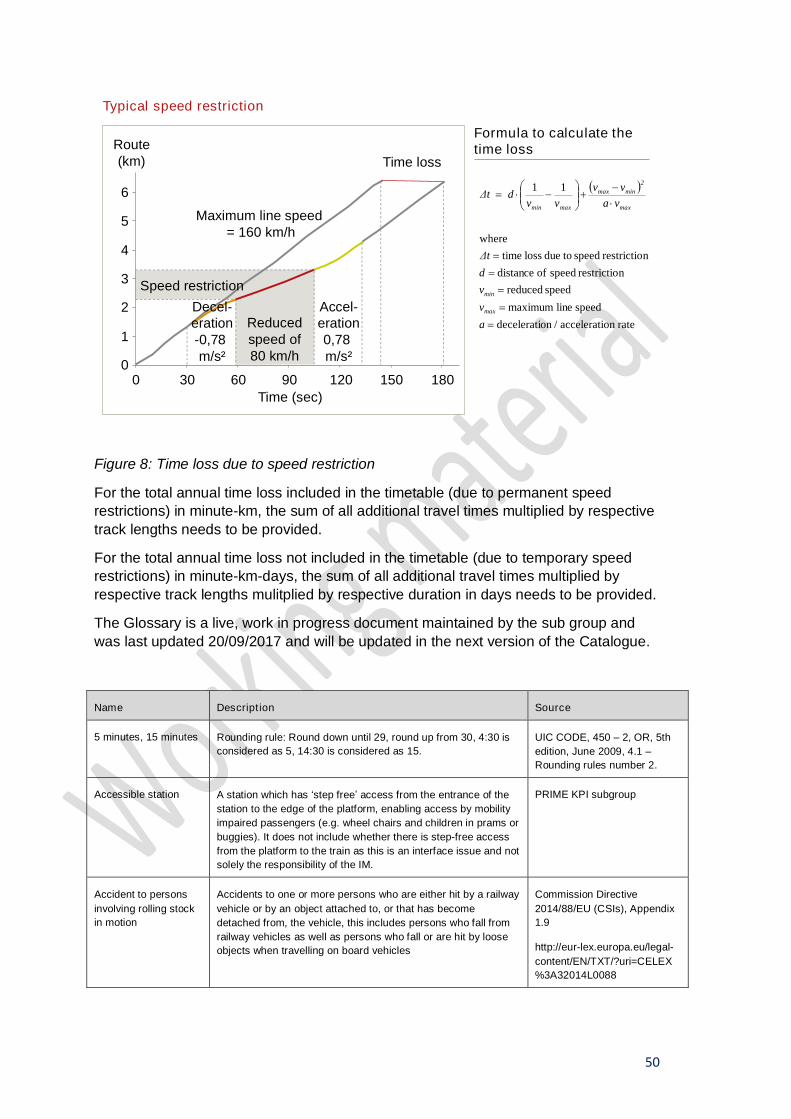
50
Figure 8: Time loss due to speed restriction
For the total annual time loss included in the timetable (due to permanent speed restrictions) in minute-km, the sum of all additional travel times multiplied by respective track lengths needs to be provided.
For the total annual time loss not included in the timetable (due to temporary speed restrictions) in minute-km-days, the sum of all additional travel times multiplied by respective track lengths mulitplied by respective duration in days needs to be provided.
The Glossary is a live, work in progress document maintained by the sub group and was last updated 20/09/2017 and will be updated in the next version of the Catalogue.
Name Description Source
5 minutes, 15 minutes Rounding rule: Round down until 29, round up from 30, 4:30 is considered as 5, 14:30 is considered as 15.
UIC CODE, 450 – 2, OR, 5th edition, June 2009, 4.1 – Rounding rules number 2.
Accessible station A station which has ‘step free’ access from the entrance of the station to the edge of the platform, enabling access by mobility impaired passengers (e.g. wheel chairs and children in prams or buggies). It does not include whether there is step-free access from the platform to the train as this is an interface issue and not solely the responsibility of the IM.
PRIME KPI subgroup
Accident to persons involving rolling stock in motion
Accidents to one or more persons who are either hit by a railway vehicle or by an object attached to, or that has become detached from, the vehicle, this includes persons who fall from railway vehicles as well as persons who fall or are hit by loose objects when travelling on board vehicles
Commission Directive 2014/88/EU (CSIs), Appendix 1.9
http://eur-lex.europa.eu/legal-content/EN/TXT/?uri=CELEX%3A32014L0088
0
1
2
3
4
5
6
Route(km) Time loss
Typical speed restriction
( )
rateon acceleration / deceleratispeed line maximum
speed reducednrestrictio speed of distance
nrestrictio speed todue loss timewhere
11
==
===
×-
+÷÷ø
öççè
æ-×=
avvdΔt
vavv
vv dΔt
max
min
max
2minmax
maxmin
Formula to calculate the time loss
Maximum line speed = 160 km/h
Decel-eration-0,78 m/s²
Reduced speed of80 km/h
Accel-eration0,78 m/s²
Speed restriction
0 30 60 90 120 150 180Time (sec)
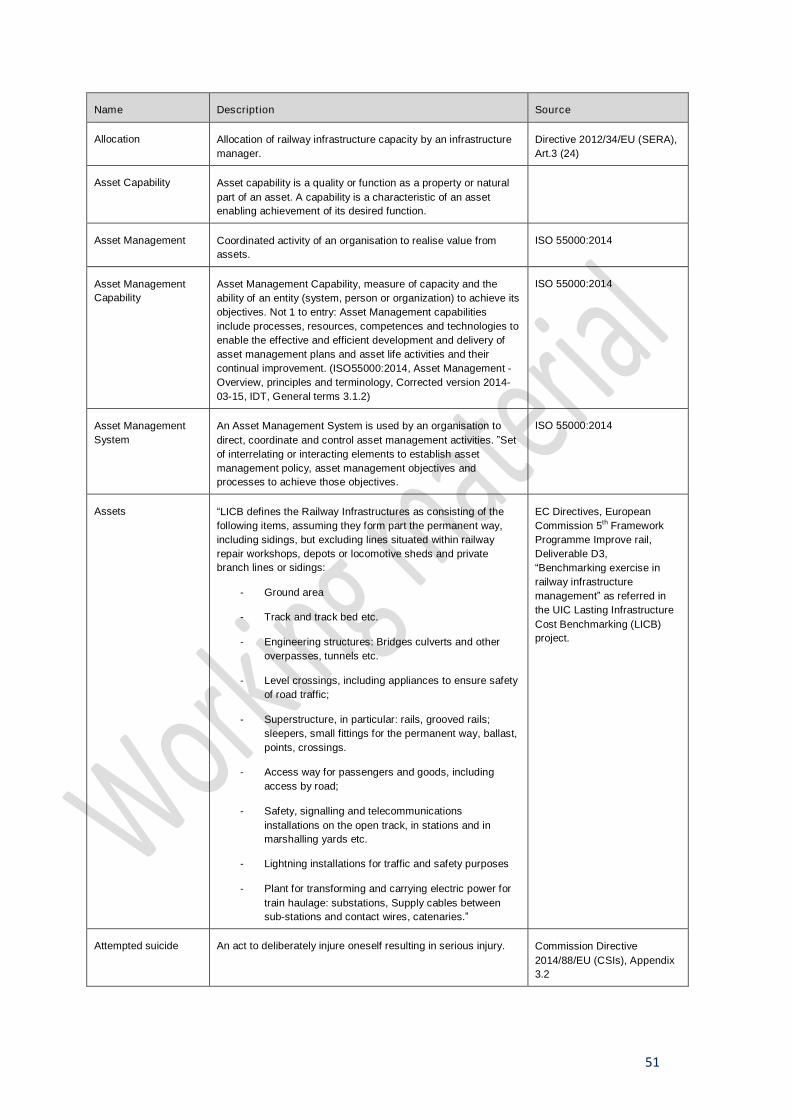
51
Name Description Source
Allocation Allocation of railway infrastructure capacity by an infrastructure manager.
Directive 2012/34/EU (SERA), Art.3 (24)
Asset Capability Asset capability is a quality or function as a property or natural part of an asset. A capability is a characteristic of an asset enabling achievement of its desired function.
Asset Management Coordinated activity of an organisation to realise value from assets.
ISO 55000:2014
Asset Management Capability
Asset Management Capability, measure of capacity and the ability of an entity (system, person or organization) to achieve its objectives. Not 1 to entry: Asset Management capabilities include processes, resources, competences and technologies to enable the effective and efficient development and delivery of asset management plans and asset life activities and their continual improvement. (ISO55000:2014, Asset Management - Overview, principles and terminology, Corrected version 2014-03-15, IDT, General terms 3.1.2)
ISO 55000:2014
Asset Management System
An Asset Management System is used by an organisation to direct, coordinate and control asset management activities. ”Set of interrelating or interacting elements to establish asset management policy, asset management objectives and processes to achieve those objectives.
ISO 55000:2014
Assets “LICB defines the Railway Infrastructures as consisting of the following items, assuming they form part the permanent way, including sidings, but excluding lines situated within railway repair workshops, depots or locomotive sheds and private branch lines or sidings:
- Ground area
- Track and track bed etc.
- Engineering structures: Bridges culverts and other overpasses, tunnels etc.
- Level crossings, including appliances to ensure safety of road traffic;
- Superstructure, in particular: rails, grooved rails; sleepers, small fittings for the permanent way, ballast, points, crossings.
- Access way for passengers and goods, including access by road;
- Safety, signalling and telecommunications installations on the open track, in stations and in marshalling yards etc.
- Lightning installations for traffic and safety purposes
- Plant for transforming and carrying electric power for train haulage: substations, Supply cables between sub-stations and contact wires, catenaries.”
EC Directives, European Commission 5th Framework Programme Improve rail, Deliverable D3, “Benchmarking exercise in railway infrastructure management” as referred in the UIC Lasting Infrastructure Cost Benchmarking (LICB) project.
Attempted suicide An act to deliberately injure oneself resulting in serious injury. Commission Directive 2014/88/EU (CSIs), Appendix 3.2
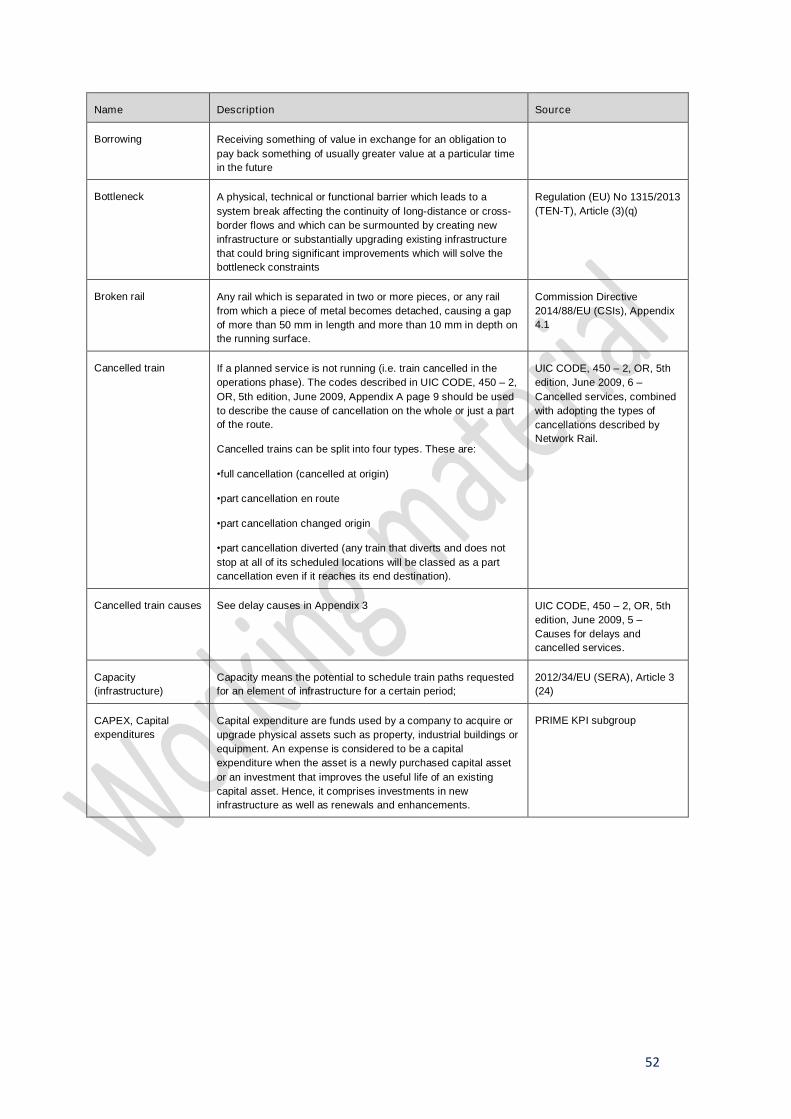
52
Name Description Source
Borrowing Receiving something of value in exchange for an obligation to pay back something of usually greater value at a particular time in the future
Bottleneck A physical, technical or functional barrier which leads to a system break affecting the continuity of long-distance or cross-border flows and which can be surmounted by creating new infrastructure or substantially upgrading existing infrastructure that could bring significant improvements which will solve the bottleneck constraints
Regulation (EU) No 1315/2013 (TEN-T), Article (3)(q)
Broken rail Any rail which is separated in two or more pieces, or any rail from which a piece of metal becomes detached, causing a gap of more than 50 mm in length and more than 10 mm in depth on the running surface.
Commission Directive 2014/88/EU (CSIs), Appendix 4.1
Cancelled train If a planned service is not running (i.e. train cancelled in the operations phase). The codes described in UIC CODE, 450 – 2, OR, 5th edition, June 2009, Appendix A page 9 should be used to describe the cause of cancellation on the whole or just a part of the route.
Cancelled trains can be split into four types. These are:
•full cancellation (cancelled at origin)
•part cancellation en route
•part cancellation changed origin
•part cancellation diverted (any train that diverts and does not stop at all of its scheduled locations will be classed as a part cancellation even if it reaches its end destination).
UIC CODE, 450 – 2, OR, 5th edition, June 2009, 6 – Cancelled services, combined with adopting the types of cancellations described by Network Rail.
Cancelled train causes See delay causes in Appendix 3 UIC CODE, 450 – 2, OR, 5th edition, June 2009, 5 – Causes for delays and cancelled services.
Capacity (infrastructure)
Capacity means the potential to schedule train paths requested for an element of infrastructure for a certain period;
2012/34/EU (SERA), Article 3 (24)
CAPEX, Capital expenditures
Capital expenditure are funds used by a company to acquire or upgrade physical assets such as property, industrial buildings or equipment. An expense is considered to be a capital expenditure when the asset is a newly purchased capital asset or an investment that improves the useful life of an existing capital asset. Hence, it comprises investments in new infrastructure as well as renewals and enhancements.
PRIME KPI subgroup
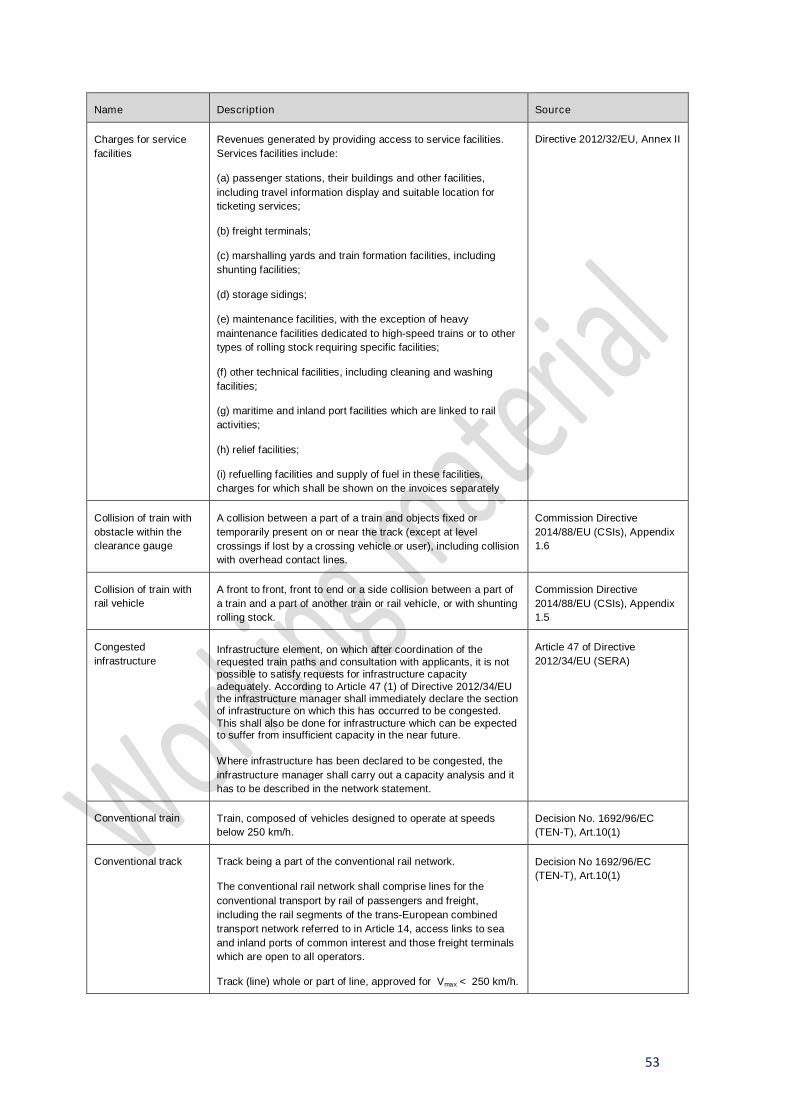
53
Name Description Source
Charges for service facilities
Revenues generated by providing access to service facilities. Services facilities include:
(a) passenger stations, their buildings and other facilities, including travel information display and suitable location for ticketing services;
(b) freight terminals;
(c) marshalling yards and train formation facilities, including shunting facilities;
(d) storage sidings;
(e) maintenance facilities, with the exception of heavy maintenance facilities dedicated to high-speed trains or to other types of rolling stock requiring specific facilities;
(f) other technical facilities, including cleaning and washing facilities;
(g) maritime and inland port facilities which are linked to rail activities;
(h) relief facilities;
(i) refuelling facilities and supply of fuel in these facilities, charges for which shall be shown on the invoices separately
Directive 2012/32/EU, Annex II
Collision of train with obstacle within the clearance gauge
A collision between a part of a train and objects fixed or temporarily present on or near the track (except at level crossings if lost by a crossing vehicle or user), including collision with overhead contact lines.
Commission Directive 2014/88/EU (CSIs), Appendix 1.6
Collision of train with rail vehicle
A front to front, front to end or a side collision between a part of a train and a part of another train or rail vehicle, or with shunting rolling stock.
Commission Directive 2014/88/EU (CSIs), Appendix 1.5
Congested infrastructure
Infrastructure element, on which after coordination of the requested train paths and consultation with applicants, it is not possible to satisfy requests for infrastructure capacity adequately. According to Article 47 (1) of Directive 2012/34/EU the infrastructure manager shall immediately declare the section of infrastructure on which this has occurred to be congested. This shall also be done for infrastructure which can be expected to suffer from insufficient capacity in the near future.
Where infrastructure has been declared to be congested, the infrastructure manager shall carry out a capacity analysis and it has to be described in the network statement.
Article 47 of Directive 2012/34/EU (SERA)
Conventional train Train, composed of vehicles designed to operate at speeds below 250 km/h.
Decision No. 1692/96/EC (TEN-T), Art.10(1)
Conventional track Track being a part of the conventional rail network.
The conventional rail network shall comprise lines for the conventional transport by rail of passengers and freight, including the rail segments of the trans-European combined transport network referred to in Article 14, access links to sea and inland ports of common interest and those freight terminals which are open to all operators.
Track (line) whole or part of line, approved for Vmax < 250 km/h.
Decision No 1692/96/EC (TEN-T), Art.10(1)

54
Name Description Source
Cumulative delay Delays according to the timetable at the first measurement point, or an additional delay between two sequential measurement points in the IM system for deviations.
To cause deviation means that a train is delayed with 5 minutes or more compared to finally timetable at the first measurement point.
Cyber-attacks Malicious acts targeting computer information systems, IT infrastructures, computer networks, and/or personal computer devices of railway infrastructure managers, railway undertaking or other railway companies with the intention to steal, alter, or destroy a specified target in the susceptible system.
Delay causes Delay causes should include both primarily causes and secondarily causes, Primarily and secondarily causes are described in the referred source part Appendix A.
Causes for cancelled trains are the same as for delays.
UIC CODE, 450 – 2, OR, 5th edition, June 2009, 5 – Causes for delays and cancelled services.
Deployment The deployment of a mechanical device, electrical system, computer program, etc., is its assembly or transformation from a packaged form to an operational working state. Deployment implies moving a product from a temporary or development state to a permanent or desired state.
Depreciation Depreciation is an accounting method of allocating the cost of a tangible or intangible asset over its useful life. It allows a company to write-off the value of an asset over time, but it is considered a non-cash transaction.
Derailment of train Any case in which at least one wheel of a train leaves the rails. Commission Directive 2014/88/EU (CSIs), Appendix 1.7
Direct Cost in the meaning of Regulation (EU)2015/909
Direct cost in this context means “the cost that is directly incurred as a result of operating the train service” and which is used for setting charges for the minimum access package and for access to infrastructure connecting service facilities. The modalities for the calculation of the cost that is directly incurred as a result of operating the train are set out in Commission Implementing Regulation (EU) 2015/909 and can in principle be established on the basis of:
(a) a network-wide approach as the difference between, on the one hand, the costs for providing the services of the minimum access package and for the access to the infrastructure connecting service facilities and, on the other hand, the non-eligible costs referred to in Article 4 of this regulation, or
(b) econometric or engineering cost modelling.
PRIME KPI subgroup on the basis of Implementing Regulation (EU) 2015/909
Electricity supply income
Revenue generated by charging railway undertakings for the use of electricity for traction.
PRIME KPI subgroup on the basis of the Commission Regulation (EU) No 1301/2014 (TSI Energy), Annex 2.1.1
Employee or contractor
Any person whose employment is in connection with a railway and is at work at the time of the accident, including the staff of contractors, self-employed contractors, the crew of the train and persons handling rolling stock and infrastructure installations.
Commission Directive 2014/88/EU (CSIs), ANNEX I 1.13
55
Name Description Source
Expenditure on enhancements of existing infrastructure
Enhancements (or 'upgrades’) means capital expenditure on a major modification work of the existing infrastructure which improves its overall performance. Enhancements can be triggered by changed functional requirements (and not triggered by lifetime) or "forced" investments when acting on regulations.
The purpose of enhancements is to change the functional requirements such as electrification of a non-electrified line, building a second track parallel to a single tracked line, increase of line speed or capacity. Enhancements include planning (incl. portfolio prioritization, i.e. which enhancements projects are realized when and where), tendering dismantling (disposal of old equipment), construction, testing and commissioning (when track is opened to full-speed operation). Enhancements are generally looked on at the level of annual spending from a cash-flow perspective, i.e. no depreciation or other imputed costs are taken into account. It includes its proportion of overhead (such as financials, controlling, IT, human resources, purchasing, legal and planning), labour (operative, personnel), material, (used/consumed goods), internal services (machinery, tools, equipment including transport and logistics) and contractors (entrepreneurial production) as well as investment subsidies.
PRIME KPI subgroup on the basis of Regulation (EU) 2015/1100 (RMMS), Article 2
Environmental incidents with major and significant impact or effect to land, water, air and nature conservation
Impacts to land and/or water, example: a) Hydrocarbon spillages (including petrol, hydraulic oils and cutting oils) b) Spillages of hazardous materials c) Spillages of low-hazard products with polluting potential (detergents, disinfectants, foodstuffs, fertilizers, paints and dyes, other organic liquids) d) Loss of cable or transformer oil e) Fly tipping.
Impacts to air, example: a) Noise and vibration b) Dust c) Odor d) Other airborne particulates
Impacts to nature conservation sites and species, example: a) Causing harm or disturbance to European, National or Biodiversity Action Plan (BAP) protected species b) Damage or disturbance to both statutorily or non-statutorily protected sites.
ERA European Union Agency for Railways Regulation (EU) 2016/796 (ERA)
ERTMS 'European Rail Traffic Management System' (ERTMS) means the system defined in Commission Decision 2006/679/EC and Commission Decision 2006/860/EC
European Rail Traffic Management System (ERTMS) is the European signalling system consisting the European Train Control System (ETCS), a standard for in-cab train control, and GSM-R, the GSM mobile communications standard for railway operations.
ERTMS in operations refers to main tracks equipped with both - ETCS (European train control system; any baseline or level) and GSM-R (Global System for Mobile Communications); and where ETCS and GSM-R are used in service
Commission Decision 2006/679/EC
Commission Decision 2006/860/EC

56
Name Description Source
Espionage Acts of obtaining information from railway infrastructure managers, railway undertakings or other railway companies defined as secret or confidential without the permission of the information’s owner.
Extensive disruptions to traffic
Train services on a main railway line are suspended for six hours or more.
Commission Directive 2014/88/EU (CSIs), Appendix 1.3
Failure (under development)
“Termination of an item to perform a given service.” And in this case the failure also affects the train services.
All infrastructure failures where a delay to an individual train caused by incident should be considered (including cancelled trains). Failures will be counted only once at the first measuring point. A threshold of < 4:59 minutes will be used to count incidents affecting individual passenger and freight trains (including cancelled trains).
All assets defined are to be considered.
SIS-EN 13306:2010
Lasting Infrastructure Cost Benchmarking, version 2.0
Financial expenditures Financial expenditures are the ones accounted for in the annual profit and loss statement. It includes interests and similar charges which correspond to the remuneration of certain financial assets (deposits, bills, bonds and credits).
PRIME KPI subgroup on the basis of Eurostat concepts and definitions on financial surplus
Fire in rolling stock A fire or explosion that occurs in a railway vehicle (including its load) when it is running between the departure station and the destination, including when stopped at the departure station, the destination or intermediate stops, as well as during re-marshalling operations.
Commission Directive 2014/88/EU (CSIs), Appendix 1.10
Freight train Freight (good) train: train for the carriage of goods composed of one or more wagons and, possibly, vans moving either empty or under load,
Glossary for Transport Statistics, A.IV-06
Freight train-km (m train-km)
Unit of measure representing the movement of all freight trains taking into account their journey length. From an IM’s point of view it is important to include all freight train movements as they all influence the deterioration of the rail infrastructure assets. Empty freight train movements are therefore included in the number of freight train movements.
LICB Web Glossary, p.19
Funding’s An amount of money used for a specific purpose, in our case to finance the IM expenditures.
Longman, Dictionary of contemporary English
Grants A grant is a direct financial contribution given by the federal, state or local government or provided from EU funds to an eligible grantee. Grants are not expected to be repaid and do not include financial assistance, such as a loan or loan guarantee, an interest rate subsidy, direct appropriation, or revenue sharing.
PRIME KPI subgroup
Gross tonnage Gross tonnage is the weight of the train, including the load, the locomotive and the tare weight of the wagons, in commercial traffic. The weight of service trains, shunting movements, passenger and baggage weight are not included.
Glossary for Transport Statistics, A.IV-13
Gross tonne km Unit of measure representing the movement over a distance of one kilometre of one tonne of rail vehicle including the weight of tractive vehicle.
Glossary for Transport Statistics, A.IV-13
57
Name Description Source
High speed train Train, composed of vehicles designed to operate:
- either at speeds of at least 250 km/h on lines specially built for high speeds, while enabling operation at speeds exceeding 300 km/h in appropriate circumstances,
- or at speeds of the order of 200 km/h on the lines of section 2.1, where compatible with the performance levels of these lines.
Directive 2008/57/EC (Interoperability), Art.2.2
High speed track Track (line) whole or part of line, approved for Vmax ≥ 250 km/h
— specially built high-speed lines equipped for speeds generally equal to or greater than 250 km/h,
— specially upgraded high-speed lines equipped for speeds of the order of 200 km/h,
— specially upgraded high-speed lines which have special features as a result of topographical, relief or town-planning constraints, on which the speed must be adapted to each case
The last category also includes interconnecting lines between the high-speed and conventional networks, lines through stations, accesses to terminals, depots, etc. travelled at conventional speed by ‘high-speed’ rolling stock.
Directive 2008/57/EC (Interoperability), Art.2.1
Incentive regime Incentive regime revenue (bonus payments) deriving from performance regime schemes related to Minimum Access Package
PRIME KPI subgroup
Industry costs Industry costs are fees, charges that are that are to be paid to the regulator and other authorities within the industry.
Synonyms for industry are line of business, branch.
Example from Network Rail: Chapter 6 of ORR’s Final Determination of Network Rail’s outputs and funding for 2014-19 provides a definition of Industry Costs as comprising:
- British Transport Police costs (what we pay for BTP’s services)
- Rail Safety and Standards Board (RSSB) levy - ORR licence fee and railway safety levy - Other (e.g. CIRAS and reporters’ costs – see Notes
below)
Notes: CIRAS is a Confidential Incident Reporting and Analysis System. It is adopted throughout the rail industry. The service takes reports about safety from rail staff and forwards them to rail companies, requesting that they address the issues raised. CIRAS is a confidential process; there is therefore no risk of reprisal from management or work colleagues. Reporters (often referred to as independent reporters) are firms that provide independent expert advice and are used by ORR to review some aspects of Network Rail’s performance, plans and activities. They owe a duty of care to both ORR and Network Rail but Network Rail pays for their costs.
PRIME KPI subgroup
58
Name Description Source
Infrastructure Manager (IM)
Any enterprise or transport operator responsible in particular for establishing of maintaining railway infrastructure, as well as for operating the control and safety system.
An infrastructure manager can delegate to another enterprise the following tasks: maintaining railway infrastructure and operating the control and safety system.
'infrastructure manager' means any body or firm responsible in particular for establishing, managing and maintaining railway infrastructure, including traffic management and control-command and signalling; the functions of the infrastructure manager on a network or part of a network may be allocated to different bodies or firms;
Glossary for Transport Statistics. A.III-03 UIC
Directive 2012/34/EU (SERA), Article 3(2)
Infrastructure Managers responsibility for delay minutes
Table, column 1-, 2-, 3- (Operational and planning management, Infrastructure installations, Civil Engineering causes). Plus: Delay minutes caused by weather incidents that have affected the railway infrastructure.
The relevant causes are described in Appendix 2.
UIC CODE, 450 – 2, OR, 5th edition, June 2009, Appendix A
Intermodality Intermodality is a characteristic of a transport system that allows at least two different modes to be used in an integrated manner in a door-to door transport chain. Ability of cargo and passengers to move between different modes of transport. One of the key areas is the desire to be able to move easily between national rail, underground, bus and other transport modes.
Council Directive 92/106/EEC Combined transport
Interoperability The ability, including all the regulatory, technical and operational conditions, of the infrastructure in a transport mode to allow safe and uninterrupted traffic flows which achieve the required levels of performance for that infrastructure or mode.
Regulation (EU) No 1315/2013 (TEN-T), Article 3(o)
Investments in new infrastructure
Investment in new infrastructure means capital expenditure on the projects for construction of new infrastructure installations for new lines.
It includes planning (incl. portfolio prioritization, i.e. which investment projects are realized when and where), tendering dismantling (disposal of old equipment), construction, testing and commissioning (when track is opened to full-speed operation). Investments are generally looked on at the level of annual spending from a cash-flow perspective, i.e. no depreciation or other imputed costs are taken into account. It also includes its proportion of overhead (such as financials, controlling, IT, human resources, purchasing, legal and planning), labour (operative, personnel), material, (used/consumed goods), internal services (machinery, tools, equipment including transport and logistics) and contractors (entrepreneurial production) as well as investment subsidies.
PRIME KPI subgroup on the basis fo Regulation (EU) 2015/1100 (RMMS), Article 2
Killed (Death (killed person))
Any person killed immediately or dying within 30 days as a result of an accident, excluding any suicide.
Glossary for Transport Statistics, A.VII-09
Commission Directive 2014/88/EU (CSIs), Appendix 1.18
59
Name Description Source
Level crossing Any level intersection between a road or passage and a railway, as recognised by the infrastructure manager and open to public or private users. Passages between platforms within stations are excluded, as well as passages over tracks for the sole use of employees.
Glossary for Transport Statistics, A.VII-13
Commission Directive 2014/88/EU (CSIs), Appendix 6.3
Level crossing accident
Any accident at level crossings involving at least one railway vehicle and one or more crossing vehicles, other crossing users such as pedestrians or other objects temporarily present on or near the track if lost by a crossing vehicle or user.
Glossary for Transport Statistics, A.VII-13
Commission Directive 2014/88/EU (CSIs), Appendix 1.8
Level crossing user Any person using a level crossing to cross the railway line by any means of transport or by foot;
Commission Directive 2014/88/EU (CSIs), Appendix 1.14
Main Lines Lines used for running trains in service.
ERA/2008/SAF/OP/01 Glossary of railway terms
EU institutions IATE database (information at: http://late.europa.eu/iatediff/about_IATE.html).
Maintenance cost Costs of function: Maintenance means non-capital expenditure that the infrastructure manager carries out in order to maintain the condition and capability of the existing infrastructure or to optimise asset lifetimes. Preventive maintenance activities cover inspections, measuring or failure prevention. Corrective maintenance activities are repairs (but not replacement), routine over-hauls or small-scale replacement work excluded from the definitions of renewals. It forms part of annual operating costs. Maintenance expenditure relates to activities that counter the wear, degradation or ageing of the existing infrastructure so that the required standard of performance is achieved.
Types of costs: Maintenance cost include planning, its proportion of overhead (such as financials, controlling, IT, human resources, purchasing, legal and planning), labour (operative, personnel), material, (used/consumed goods), internal services (machinery, tools, equipment including transport and logistics) and contractors (entrepreneurial production).
PRIME KPI subgroup on the basis of LICB and Regulation (EU) 2015/1100 (RMMS), Article 2
Main tracks Tracks used for running trains in service. Excludes sidings, deports, stabling tracks and connecting lines.
ERA/2008/SAF/OP/01 Glossary of railway terms
EU institutions IATE database (information at: http://late.europa.eu/iatediff/about_IATE.html).
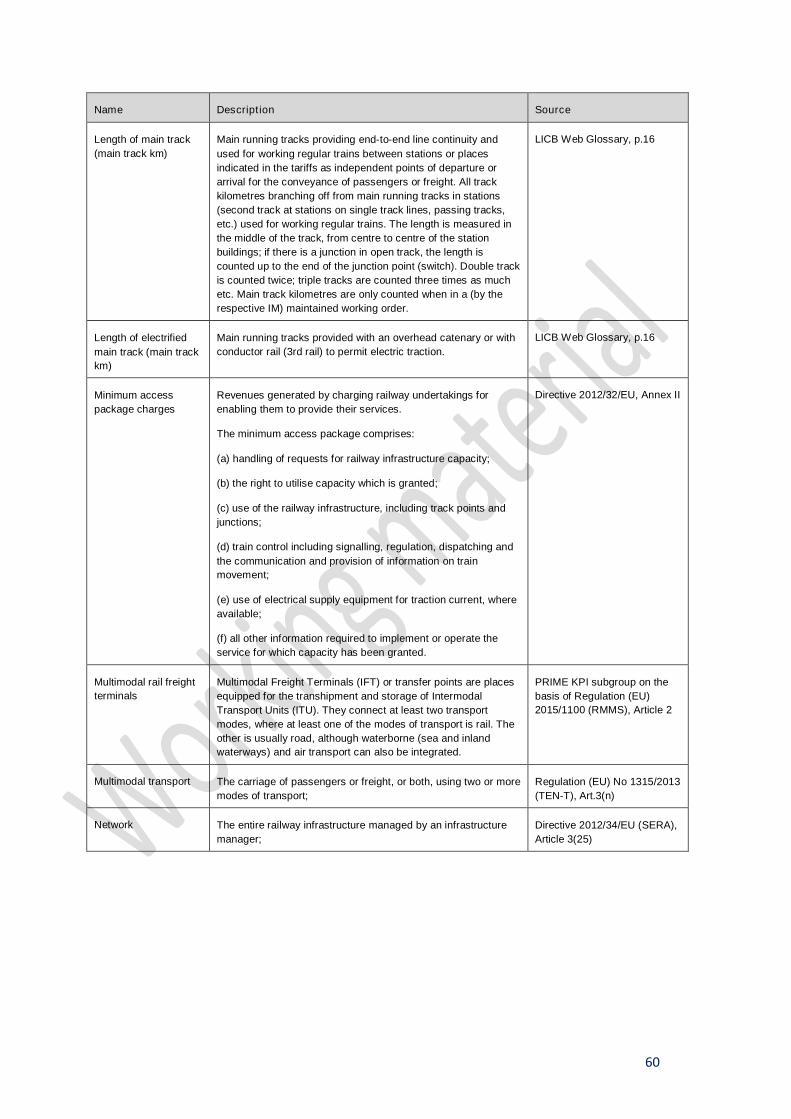
60
Name Description Source
Length of main track (main track km)
Main running tracks providing end-to-end line continuity and used for working regular trains between stations or places indicated in the tariffs as independent points of departure or arrival for the conveyance of passengers or freight. All track kilometres branching off from main running tracks in stations (second track at stations on single track lines, passing tracks, etc.) used for working regular trains. The length is measured in the middle of the track, from centre to centre of the station buildings; if there is a junction in open track, the length is counted up to the end of the junction point (switch). Double track is counted twice; triple tracks are counted three times as much etc. Main track kilometres are only counted when in a (by the respective IM) maintained working order.
LICB Web Glossary, p.16
Length of electrified main track (main track km)
Main running tracks provided with an overhead catenary or with conductor rail (3rd rail) to permit electric traction.
LICB Web Glossary, p.16
Minimum access package charges
Revenues generated by charging railway undertakings for enabling them to provide their services.
The minimum access package comprises:
(a) handling of requests for railway infrastructure capacity;
(b) the right to utilise capacity which is granted;
(c) use of the railway infrastructure, including track points and junctions;
(d) train control including signalling, regulation, dispatching and the communication and provision of information on train movement;
(e) use of electrical supply equipment for traction current, where available;
(f) all other information required to implement or operate the service for which capacity has been granted.
Directive 2012/32/EU, Annex II
Multimodal rail freight terminals
Multimodal Freight Terminals (IFT) or transfer points are places equipped for the transhipment and storage of Intermodal Transport Units (ITU). They connect at least two transport modes, where at least one of the modes of transport is rail. The other is usually road, although waterborne (sea and inland waterways) and air transport can also be integrated.
PRIME KPI subgroup on the basis of Regulation (EU) 2015/1100 (RMMS), Article 2
Multimodal transport The carriage of passengers or freight, or both, using two or more modes of transport;
Regulation (EU) No 1315/2013 (TEN-T), Art.3(n)
Network The entire railway infrastructure managed by an infrastructure manager;
Directive 2012/34/EU (SERA), Article 3(25)
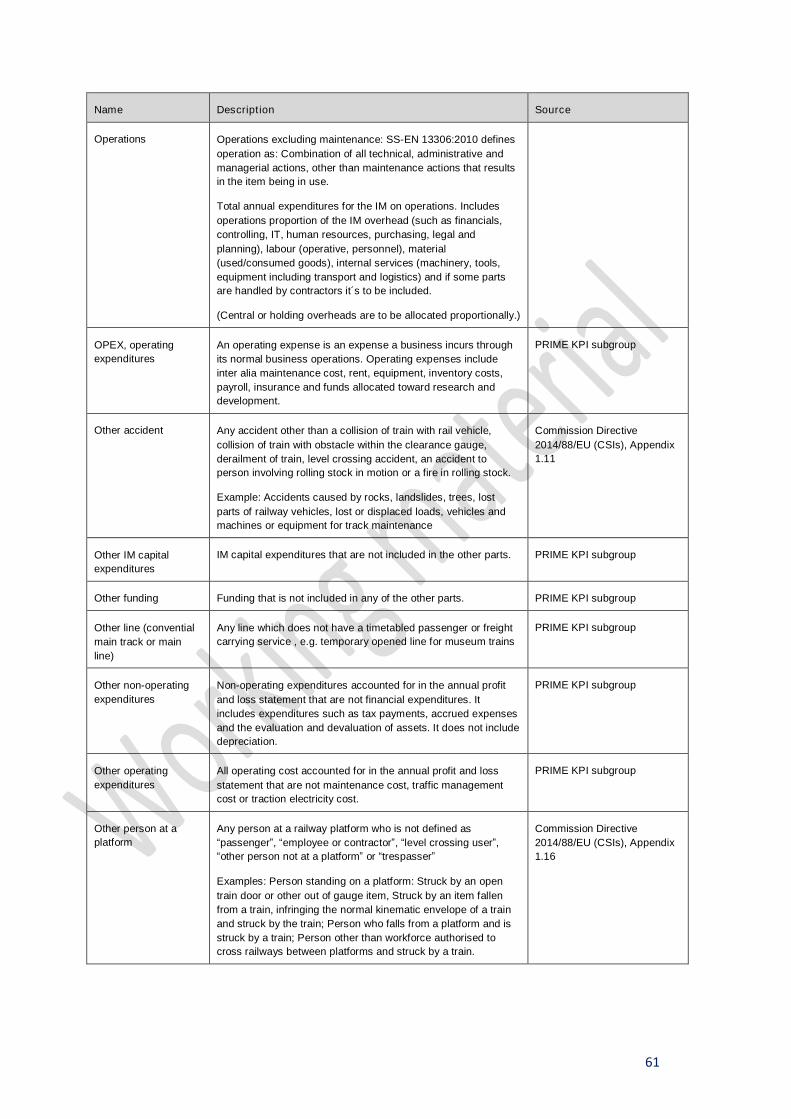
61
Name Description Source
Operations Operations excluding maintenance: SS-EN 13306:2010 defines operation as: Combination of all technical, administrative and managerial actions, other than maintenance actions that results in the item being in use.
Total annual expenditures for the IM on operations. Includes operations proportion of the IM overhead (such as financials, controlling, IT, human resources, purchasing, legal and planning), labour (operative, personnel), material (used/consumed goods), internal services (machinery, tools, equipment including transport and logistics) and if some parts are handled by contractors it´s to be included.
(Central or holding overheads are to be allocated proportionally.)
OPEX, operating expenditures
An operating expense is an expense a business incurs through its normal business operations. Operating expenses include inter alia maintenance cost, rent, equipment, inventory costs, payroll, insurance and funds allocated toward research and development.
PRIME KPI subgroup
Other accident Any accident other than a collision of train with rail vehicle, collision of train with obstacle within the clearance gauge, derailment of train, level crossing accident, an accident to person involving rolling stock in motion or a fire in rolling stock.
Example: Accidents caused by rocks, landslides, trees, lost parts of railway vehicles, lost or displaced loads, vehicles and machines or equipment for track maintenance
Commission Directive 2014/88/EU (CSIs), Appendix 1.11
Other IM capital expenditures
IM capital expenditures that are not included in the other parts. PRIME KPI subgroup
Other funding Funding that is not included in any of the other parts. PRIME KPI subgroup
Other line (convential main track or main line)
Any line which does not have a timetabled passenger or freight carrying service , e.g. temporary opened line for museum trains
PRIME KPI subgroup
Other non-operating expenditures
Non-operating expenditures accounted for in the annual profit and loss statement that are not financial expenditures. It includes expenditures such as tax payments, accrued expenses and the evaluation and devaluation of assets. It does not include depreciation.
PRIME KPI subgroup
Other operating expenditures
All operating cost accounted for in the annual profit and loss statement that are not maintenance cost, traffic management cost or traction electricity cost.
PRIME KPI subgroup
Other person at a platform
Any person at a railway platform who is not defined as “passenger”, “employee or contractor”, “level crossing user”, “other person not at a platform” or “trespasser”
Examples: Person standing on a platform: Struck by an open train door or other out of gauge item, Struck by an item fallen from a train, infringing the normal kinematic envelope of a train and struck by the train; Person who falls from a platform and is struck by a train; Person other than workforce authorised to cross railways between platforms and struck by a train.
Commission Directive 2014/88/EU (CSIs), Appendix 1.16
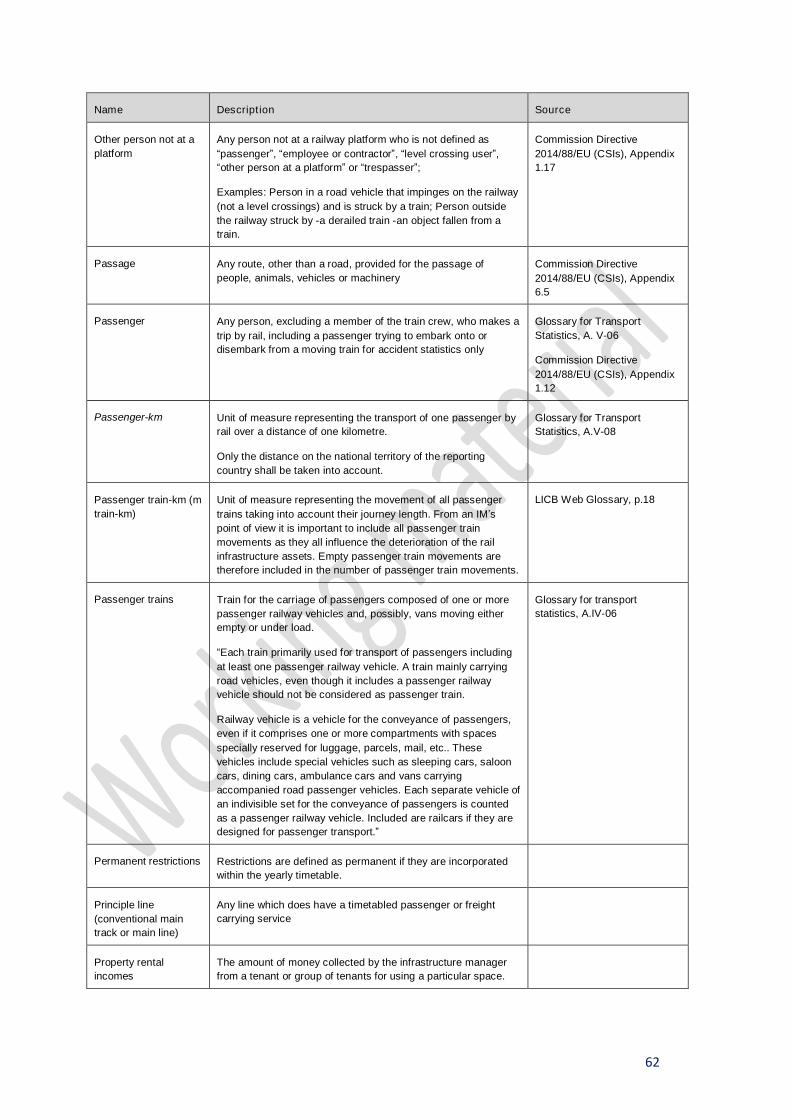
62
Name Description Source
Other person not at a platform
Any person not at a railway platform who is not defined as “passenger”, “employee or contractor”, “level crossing user”, “other person at a platform” or “trespasser”;
Examples: Person in a road vehicle that impinges on the railway (not a level crossings) and is struck by a train; Person outside the railway struck by -a derailed train -an object fallen from a train.
Commission Directive 2014/88/EU (CSIs), Appendix 1.17
Passage Any route, other than a road, provided for the passage of people, animals, vehicles or machinery
Commission Directive 2014/88/EU (CSIs), Appendix 6.5
Passenger Any person, excluding a member of the train crew, who makes a trip by rail, including a passenger trying to embark onto or disembark from a moving train for accident statistics only
Glossary for Transport Statistics, A. V-06
Commission Directive 2014/88/EU (CSIs), Appendix 1.12
Passenger-km Unit of measure representing the transport of one passenger by rail over a distance of one kilometre.
Only the distance on the national territory of the reporting country shall be taken into account.
Glossary for Transport Statistics, A.V-08
Passenger train-km (m train-km)
Unit of measure representing the movement of all passenger trains taking into account their journey length. From an IM’s point of view it is important to include all passenger train movements as they all influence the deterioration of the rail infrastructure assets. Empty passenger train movements are therefore included in the number of passenger train movements.
LICB Web Glossary, p.18
Passenger trains Train for the carriage of passengers composed of one or more passenger railway vehicles and, possibly, vans moving either empty or under load.
“Each train primarily used for transport of passengers including at least one passenger railway vehicle. A train mainly carrying road vehicles, even though it includes a passenger railway vehicle should not be considered as passenger train.
Railway vehicle is a vehicle for the conveyance of passengers, even if it comprises one or more compartments with spaces specially reserved for luggage, parcels, mail, etc.. These vehicles include special vehicles such as sleeping cars, saloon cars, dining cars, ambulance cars and vans carrying accompanied road passenger vehicles. Each separate vehicle of an indivisible set for the conveyance of passengers is counted as a passenger railway vehicle. Included are railcars if they are designed for passenger transport.”
Glossary for transport statistics, A.IV-06
Permanent restrictions Restrictions are defined as permanent if they are incorporated within the yearly timetable.
Principle line (conventional main track or main line)
Any line which does have a timetabled passenger or freight carrying service
Property rental incomes
The amount of money collected by the infrastructure manager from a tenant or group of tenants for using a particular space.

63
Name Description Source
Punctuality “Punctuality of a train is measured on the base of comparisons between the time planned in the timetable of a train identified by its train number and the actual running time at certain measuring point. A measuring point is a specific location on route where the trains running data are captured. One can choose to measure the departure, arrival or run through time”.
“Punctuality are measured by setting up a threshold up to which trains are considered as punctual and building a percentage.”
When measuring punctuality following are to be included all in service trains, i.e. Freight and passenger but excluding Empty Coaching Stock movements and engineering trains.
UIC CODE, 450 – 2, OR, 5th edition, June 2009, 4 Measurement of punctuality
Recovery Recovery of waste is separated into the recovery of materials and the recovery of energy. The recovery of materials includes activities such as recycling and composting. These activities generally require a collection system and a method of material processing and conversion into a new product. The conversion of non-recyclable waste materials into usable heat, electricity, or fuel is done through a variety of processes including anaerobic digestion, gasification, and pyrolysis.
Recycling Reprocessing by means of a manufacturing process, of a used product material into a product, a component incorporated into a product, or a secondary (recycled) raw material; excluding, energy recovery and the use of the product as a fuel.
Recycling of waste is any activity that includes the collection and processing of used or unused items that would otherwise be considered waste. Recycling involves sorting and processing the recyclable products into raw material and then using the recycled raw materials to make new products.
ISO 18604:2013, 3.3
Rejected path allocation
Rejected path allocation means a request for a path that is rejected by the infrastructure manager following the coordination process laid down in Article 46(1) of Directive 2012/34/EU (SERA); each cancellation of train service operating as part of a scheduled regular service counts as a rejected path allocation
PRIME KPI subgroup on the basis of Regulation (EU) 2015/1100 (RMMS), Article 2
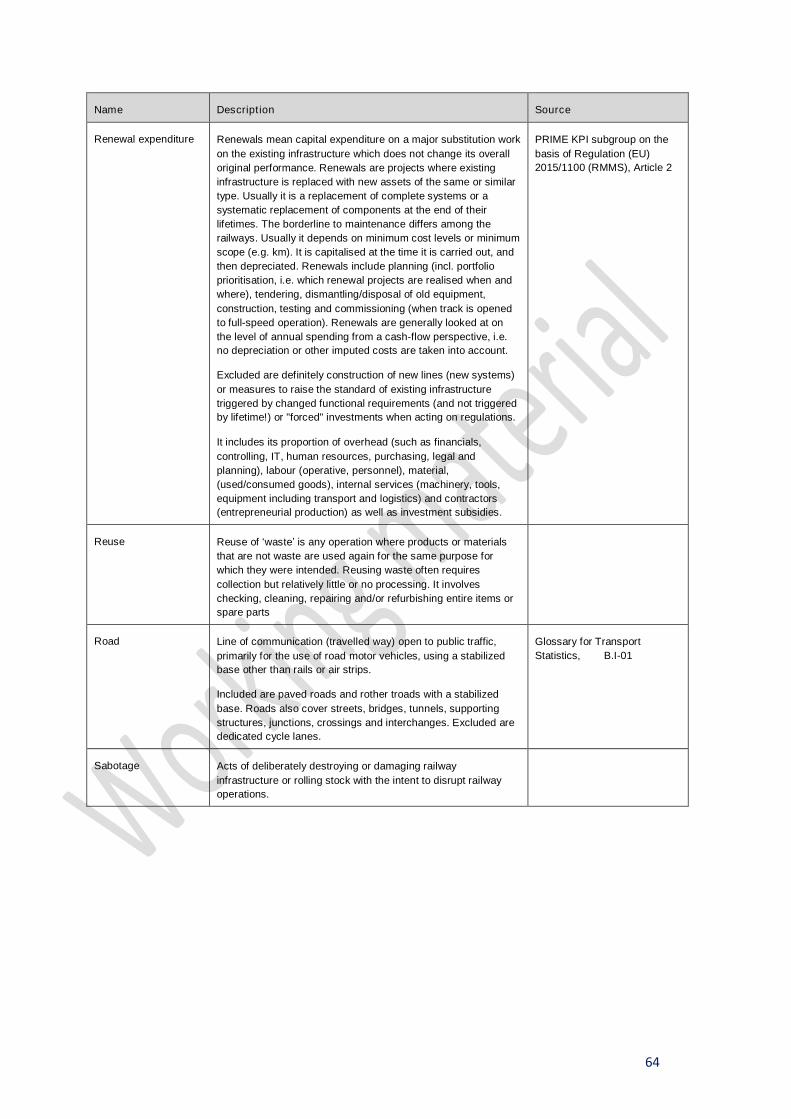
64
Name Description Source
Renewal expenditure Renewals mean capital expenditure on a major substitution work on the existing infrastructure which does not change its overall original performance. Renewals are projects where existing infrastructure is replaced with new assets of the same or similar type. Usually it is a replacement of complete systems or a systematic replacement of components at the end of their lifetimes. The borderline to maintenance differs among the railways. Usually it depends on minimum cost levels or minimum scope (e.g. km). It is capitalised at the time it is carried out, and then depreciated. Renewals include planning (incl. portfolio prioritisation, i.e. which renewal projects are realised when and where), tendering, dismantling/disposal of old equipment, construction, testing and commissioning (when track is opened to full-speed operation). Renewals are generally looked at on the level of annual spending from a cash-flow perspective, i.e. no depreciation or other imputed costs are taken into account.
Excluded are definitely construction of new lines (new systems) or measures to raise the standard of existing infrastructure triggered by changed functional requirements (and not triggered by lifetime!) or "forced" investments when acting on regulations.
It includes its proportion of overhead (such as financials, controlling, IT, human resources, purchasing, legal and planning), labour (operative, personnel), material, (used/consumed goods), internal services (machinery, tools, equipment including transport and logistics) and contractors (entrepreneurial production) as well as investment subsidies.
PRIME KPI subgroup on the basis of Regulation (EU) 2015/1100 (RMMS), Article 2
Reuse Reuse of ‘waste’ is any operation where products or materials that are not waste are used again for the same purpose for which they were intended. Reusing waste often requires collection but relatively little or no processing. It involves checking, cleaning, repairing and/or refurbishing entire items or spare parts
Road Line of communication (travelled way) open to public traffic, primarily for the use of road motor vehicles, using a stabilized base other than rails or air strips.
Included are paved roads and rother troads with a stabilized base. Roads also cover streets, bridges, tunnels, supporting structures, junctions, crossings and interchanges. Excluded are dedicated cycle lanes.
Glossary for Transport Statistics, B.I-01
Sabotage Acts of deliberately destroying or damaging railway infrastructure or rolling stock with the intent to disrupt railway operations.

65
Name Description Source
Security incidents Intentional acts as terrorism, sabotage, cyber-attacks, vandalism, thefts, espionage, unauthorized persons and other acts of aggression or hooliganism.
System and personal events occurring on transport property to individuals or/and affecting a railway system:
System security events include arson, burglary, vandalism, intrusion/trespass on network, sabotage, hijacking, suspicious packages and objects, cyber security events, bomb threats, bombings, and chemical, biological and nuclear / radiological releases.
Personal security events include assault, robbery, rape, attempted suicide, suicide, theft, motor vehicle theft, larceny, and homicide.
Serious injury (seriously injured person)
Any person injured who was hospitalised for more than 24 hours as a result of an accident, excluding any attempted suicide.
Glossary for transport statistics, A. VII-10
Commission Directive 2014/88/EU (CSIs), Appendix 1.19
Significant accident
Any accident involving at least one rail vehicle in motion, resulting in at least one killed or seriously injured person, or in significant damage to stock, track, other installations or environment, or extensive disruptions to traffic, excluding accidents in workshops, warehouses and depots.
Glossary for transport statistics, A.VII-04
Commission Directive 2014/88/EU (CSIs), Appendix 1.1
Significant damage Damage that is equivalent to EUR 150 000 or more. Commission Directive 2014/88/EU (CSIs), Appendix 1.2
Stations and station areas
Railway station: A railway establishment which is either open or not to the public, generally staffed and which is designed for one or more of the following operations:
-formation, dispatch , reception and temporary stabling of trains
- stabling and marshalling of rolling stock
- boarding and alighting of passengers
- generally, where open to public, providing facilities for the purchase of tickets
- loading and unloading of goods
Glossary for transport statistics, A.I-21
Strategic points The strategic points are agreed with the government and railway undertakings each year. The strategic points reflect the following criteria:
1. End stations
2. Main interchange stations
3. Stations according to the railway undertakings wishes
4. National coverage
5. Historical determined
Example from ProRail
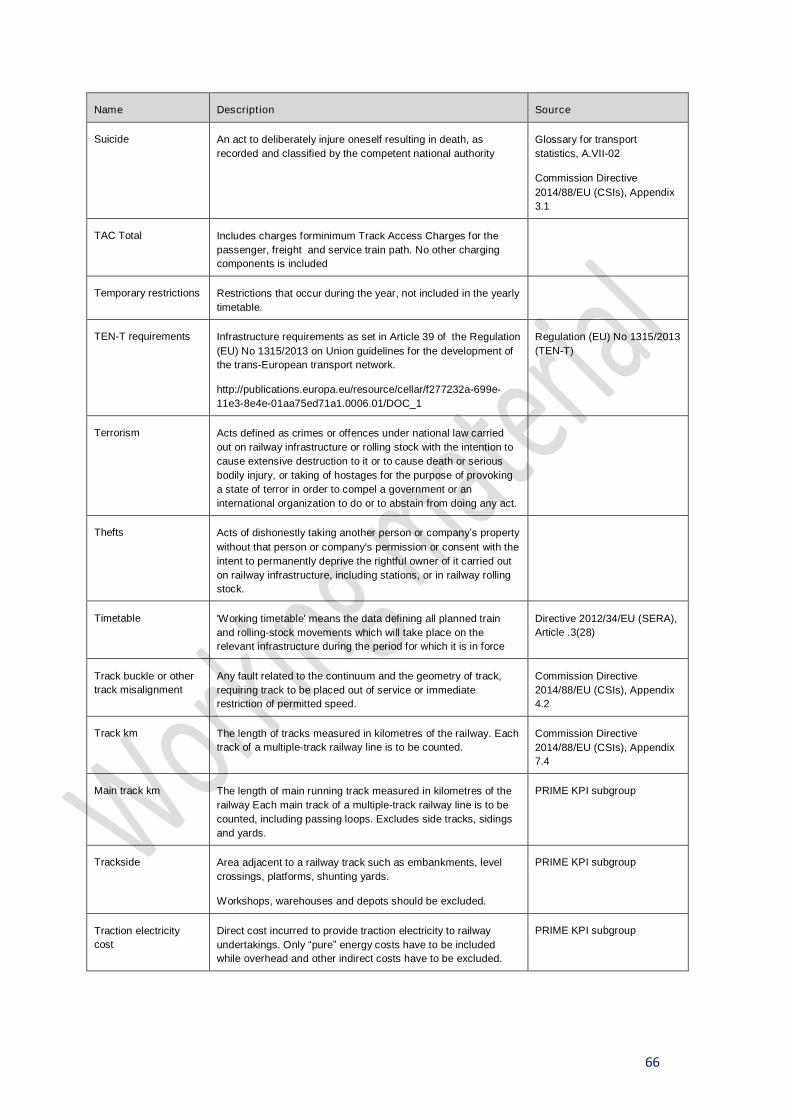
66
Name Description Source
Suicide An act to deliberately injure oneself resulting in death, as recorded and classified by the competent national authority
Glossary for transport statistics, A.VII-02
Commission Directive 2014/88/EU (CSIs), Appendix 3.1
TAC Total Includes charges forminimum Track Access Charges for the passenger, freight and service train path. No other charging components is included
Temporary restrictions Restrictions that occur during the year, not included in the yearly timetable.
TEN-T requirements Infrastructure requirements as set in Article 39 of the Regulation (EU) No 1315/2013 on Union guidelines for the development of the trans-European transport network.
http://publications.europa.eu/resource/cellar/f277232a-699e-11e3-8e4e-01aa75ed71a1.0006.01/DOC_1
Regulation (EU) No 1315/2013 (TEN-T)
Terrorism Acts defined as crimes or offences under national law carried out on railway infrastructure or rolling stock with the intention to cause extensive destruction to it or to cause death or serious bodily injury, or taking of hostages for the purpose of provoking a state of terror in order to compel a government or an international organization to do or to abstain from doing any act.
Thefts Acts of dishonestly taking another person or company’s property without that person or company's permission or consent with the intent to permanently deprive the rightful owner of it carried out on railway infrastructure, including stations, or in railway rolling stock.
Timetable 'Working timetable' means the data defining all planned train and rolling-stock movements which will take place on the relevant infrastructure during the period for which it is in force
Directive 2012/34/EU (SERA), Article .3(28)
Track buckle or other track misalignment
Any fault related to the continuum and the geometry of track, requiring track to be placed out of service or immediate restriction of permitted speed.
Commission Directive 2014/88/EU (CSIs), Appendix 4.2
Track km The length of tracks measured in kilometres of the railway. Each track of a multiple-track railway line is to be counted.
Commission Directive 2014/88/EU (CSIs), Appendix 7.4
Main track km The length of main running track measured in kilometres of the railway Each main track of a multiple-track railway line is to be counted, including passing loops. Excludes side tracks, sidings and yards.
PRIME KPI subgroup
Trackside Area adjacent to a railway track such as embankments, level crossings, platforms, shunting yards.
Workshops, warehouses and depots should be excluded.
PRIME KPI subgroup
Traction electricity cost
Direct cost incurred to provide traction electricity to railway undertakings. Only “pure” energy costs have to be included while overhead and other indirect costs have to be excluded.
PRIME KPI subgroup

67
Name Description Source
Trains In this document we define trains as the sum of passenger’s trains and freight trains.
Glossary for transport statistics, A.IV-05
Glossary for transport statistics, A.IV-06
Train (definition used within the Safety KPIs)
One or more railway vehicles hauled by one or more locomotives or railcars, or one railcar travelling alone, running under a given number or specific designation from an initial fixed point to a terminal fixed point.
A light engine, i.e. a locomotive travelling on its own is not considered to be a train.
Glossary for Transport Statistics, A.IV-05
Commission Directive 2014/88/EU (CSIs), Appendix 1.4
Train-km Means the unit of measure representing the movement of a train over one kilometre.
The distance used is the distance actually run, if available, otherwise the standard network distance between the origin and destination shall be used. Only the distance on the national territory of the reporting country shall be taken into account.
Glossary for Transport Statistics, A.IV-05
Commission Directive 2014/88/EU (CSIs), Appendix 7.1
Traffic Management Cost
Costs of functions: Traffic management comprises the control of signal installations and traffic, planning as well as path allocation.
Types of costs: Traffic management includes planning, its proportion of overhead (such as financials, controlling, IT, human resources, purchasing, legal and plan-ning), labour (operative, personnel), material, (used/consumed goods), internal services (machinery, tools, equipment including transport and logistics) and contrac-tors (entrepreneurial production).
PRIME KPI subgroup on the basis of UIC studies (CENOS and OMC)
Trespasser Any person present on railway premises where such presence is forbidden, with the exception of a level crossing user
Commission Directive 2014/88/EU (CSIs), Appendix 1.15
Vandalism Acts of deliberate destruction of, or damage to railway infrastructure or rolling stock including defacement by graffiti, without the intention of disrupting railway operations or causing bodily harm.
Working capital Current assets minus current liabilities.
2. Accounting: Net liquid assets computed by deducting current liabilities from current assets. The amount of available working capital is a measure of a firm's ability to meet its short-term obligations. Sources of working capital are (1) net income, (2) long-term loans, (3) sale of capital assets, and (4) injection of funds by stockholders.
Is the amount of current assets minus the amount of current liabilities as of specific date. These amounts are obtained from your company's balance sheet. For example, if your company's balance sheet reports current assets of $450,000 and current liabilities of $320,000 then your company's working capital is $130,000.
Wrong side signalling failure
Any technical failure of a signalling system (either to infrastructure or to rolling stock), resulting in signalling information less restrictive than that demanded
Commission Directive 2014/88/EU (CSIs), Appendix 4.3