Embed Size (px)
Citation preview
materials
Article
Primary Stability Optimization by Using Fixtureswith Different Thread Depth According To BoneDensity: A Clinical Prospective Study on EarlyLoaded Implants
Christian Makary 1,*, Abdallah Menhall 1, Carole Zammarie 2, Teresa Lombardi 3,Seung Yeup Lee 4, Claudio Stacchi 5 and Kwang Bum Park 6
1 Department of Oral Surgery, St Joseph University, Beirut 17-5208, Lebanon2 Private practice, Beirut 17-5208, Lebanon3 Private Practice, 87011 Cassano allo Ionio, Italy4 GyeongSan Mir Dental Hospital, Gyeongsan 41934, Korea5 Department of Medical, Surgical and Health Sciences, University of Trieste, 34127 Trieste, Italy6 Daegu Mir Dental Hospital, Jung-Gu, Daegu 41934, Korea* Correspondence: [email protected]; Tel.: +961-(1)-421280; Fax: +961-(1)-421024
Received: 18 June 2019; Accepted: 23 July 2019; Published: 27 July 2019�����������������
Abstract: Background: Macro- and micro-geometry are among the factors influencing implantstability and potentially determining loading protocol. The purpose of this study was to test aprotocol for early loading by controlling implant stability with the selection of fixtures with differentthread depth according to the bone density of the implant site. Materials and Methods: Patientsneeding implant therapy for fixed prosthetic rehabilitation were treated by inserting fixtures withfour different thread diameters, selected based on clinical assessment of bone quality at placement(D1, D2, D3, and D4, according to Misch classification). Final insertion torque (IT) and implantstability quotient (ISQ) were recorded at baseline and ISQ measurements repeated after one, two,three, and four weeks. At the three-week measurement (four weeks after implant replacement),implants with ISQ > 70 Ncm were functionally loaded with provisional restorations. Marginal bonelevel was radiographically measured 12 months after implant insertion. Results: Fourteen patientswere treated with the insertion of forty implants: Among them, 39 implants showing ISQ > 70 after3 weeks of healing were loaded with provisional restoration. Mean IT value was 82.3 ± 33.2 Ncm andvaried between the four different types of bone (107.2 ± 35.6 Ncm, 74.7 ± 14.0 Ncm, 76.5 ± 31.1 Ncm,and 55.2 ± 22.6 Ncm in D1, D2, D3, and D4 bone, respectively). Results showed significant differencesexcept between D2 and D3 bone types. Mean ISQ at baseline was 79.3 ± 4.3 and values in D1, D2,D3, and D4 bone were 81.9 ± 2.0, 81.1 ± 1.0, 78.3 ± 3.7, and 73.2 ± 4.9, respectively. Results showedsignificant differences except between D1 and D2 bone types. IT and ISQ showed a significantpositive correlation when analyzing the entire sample (p = 0.0002) and D4 bone type (p = 0.0008).The correlation between IT and ISQ was not significant when considering D1, D2, and D3 types(p = 0.28; p = 0.31; p = 0.16, respectively). ISQ values showed a slight drop at three weeks for D1, D2,and D3 bone while remaining almost unchanged in D4 bone. At 12-month follow-up, all implants(39 early loading, 1 conventional loading) had satisfactory function, showing an average marginalbone loss of 0.12 ± 0.12 mm, when compared to baseline levels. Conclusion: Matching implantmacro-geometry to bone density can lead to adequate implant stability both in hard and soft bone.High primary stability and limited implant stability loss during the first month of healing could allowthe application of early loading protocols with predictable clinical outcomes.
Materials 2019, 12, 2398; doi:10.3390/ma12152398 www.mdpi.com/journal/materials

Materials 2019, 12, 2398 2 of 15
Keywords: dental implants; osseointegration; bone density; torque; early loading; implantmacrodesign
1. Introduction
Oral implantology is a reliable and predictable technique for edentulous space rehabilitation [1].Reaching this goal depends on the ability of dental implants to achieve osseointegration [2], and anadequate implant stability is a fundamental prerequisite to avoid detrimental micromovements whichcould lead to a fibrous encapsulation of the fixture during the healing period, resulting in implantfailure [3,4]. This process starts with an initial stage of primary mechanical stabilization followed byan ensuing biological phase that provides secondary implant stability [5].
Secondary stability is a dynamic physiologic healing process mainly affected by implant surfacemicrotopography [6], while implant primary mechanical stability is a surgical outcome influencedby various factors, including bone density, implant macro- and micro-geometry, and implant bedpreparation technique [7].
Primary stability can be determined upon implant placement by measuring insertion torque (IT)values or by means of resonance frequency analysis measurement (Implant Stability Quotient-ISQ) [8].IT and ISQ can be influenced by many clinical and implant-related parameters. Bone density wasshown to proportionally affect both IT and ISQ values: The denser the bone, the higher both valueswere [9,10]. Nevertheless, it is always difficult to attain optimal implant stability in all bone types. HighIT and ISQ values are easily achieved in hard bone, while low values are often observed in soft boneconditions [11]. Both of these occurrences may negatively impact on the healing outcomes, since veryhigh IT values may excessively compress the cortical bone, leading to early marginal bone loss [12,13],whereas low IT values could impede early healing and bone-to-implant interface quality [10]. Thus, itis always important to control implant primary stability upon placement in order to predictably achieveosseointegration [14]. Although bone quality is a factor that cannot be controlled, many authors havefocused on different means to control implant primary stability. Implant site preparation techniqueand choice of implant body geometry are usually helpful to control final implant seating outcome [7].Undersized implant site preparation technique was shown to ensure higher IT values in soft bonewithout altering bone healing around dental implants [15,16]. Nevertheless, histological studiesshowed that implant placed in excessively undersized osteotomies in hard bone induced microcracksin the cortical layer, leading to necrosis and remodeling that may compromise implant stability at earlyhealing stages [17]. Moreover, the use of cylindrical implants in hard bone and tapered implants in softbone are recognized techniques that help to control final IT values. In a cadaver study, a comparisonbetween different implant designs concluded that cylindrical implants achieved good stability inhard and intermediate bone, but failed to achieve good stability in soft bone while tapered implantsappeared to reach higher primary stability, even in low bone quality [18]. Thread macro-geometry alsoplays an important role in achieving proper primary stability [19]: Implants with deeper threads, smallpitch, and reduced helix angle were shown to enhance primary stability by achieving higher bone toimplant contact while reducing osseo-compression [19,20].
In contrast with primary mechanical stability, implant secondary stability is a dynamic biologicalphase characterized by bone apposition on implant surface [21].
This process is mainly determined by implant surface microtopography [6]. Implants withmachined surfaces were first introduced, showing very good long-term results [22]. Nevertheless,implants presenting micro-rough surfaces presented increased survival rates when compared to turnedsurfaces and appeared to promote faster and greater bone apposition around the fixture [23,24]. Lately,nanostructured surfaces were introduced in the attempt to further improve implant to bone interplayon a cellular level by creating bioactive surfaces capable of interacting with binding proteins and

Materials 2019, 12, 2398 3 of 15
osteoblasts [25]. Such surfaces showed a better bone-to-implant contact when compared to micro-roughsurfaces [26].
Bone apposition on implant surface determines implant secondary stability and can be followedup by measuring ISQ values [10]. The classical scheme of implant stability is characterized by an initialloss of mechanical stability three to four weeks post-operatively, followed by a subsequent increasedue to bone biological response [5]. Implant stability measurements can predict loading protocols [27].ISQ at baseline can therefore guide immediate loading [28] and ISQ variations over the first six weeksof healing can be predictive for early loading [29].
Conventional loading protocols were classically performed after a two-month healing period,while early and immediate loading protocols were widely investigated in the last decade [30]. Theseaccelerated protocols mainly relied on implants reaching high primary stability through improvementsin macro-geometry along with accelerated bone apposition and maintained secondary stability by themeans of surface micro-topography modifications [31]. Implant macro- and micro-geometry are thusimportant factors that may allow to control primary and secondary stability and guide implant futureloading protocols [30].
The purpose of this clinical study is to evaluate implant stability during the first month of healingusing a fixture presenting four different thread geometries that can be adapted to bone characteristics.
2. Materials and Methods
All patients needing implant therapy for fixed prosthetic rehabilitation were eligible for enteringthis study, provided that they fulfilled the following inclusion criteria:
i) Height of the residual bone crest in the programmed implant site ≥9 mm and thickness ≥7 mm;ii) Healed bone crest (almost three months elapsed after extraction or tooth loss);iii) Patient age > 18 years;iv) Patients able to examine and understand the study protocol.
The following exclusion criteria were adopted:
i) Myocardial infarction within the past six months;ii) Poorly controlled diabetes (HBA1c > 7.5%);iii) Coagulation disorders;iv) Radiotherapy to the head/neck district within the past two years;v) Present or past treatment with intravenous bisphosphonates;vi) Immunocompromised patients;vii) Psychological or psychiatric problems;viii) Alcohol or drug abuse;ix) Poor oral hygiene and motivation (full mouth plaque score > 30% and/or full mouth bleeding
score > 20%);x) Uncontrolled periodontal disease.
All procedures were performed in accordance with the recommendations of the Declaration ofHelsinki for investigations with human subjects, as revised in Fortaleza (2013). All patients werethoroughly informed about the procedures and signed an informed consent form. The study wasapproved by the Ethics Committee at the Saint Joseph University of Beirut, Lebanon (#CE346).
Preoperative evaluation included clinical examination of the edentulous ridges and naturaldentition, as well as a cone beam computed tomography (CBCT) of the relevant sector. Patientsunderwent a prosthodontic evaluation for treatment planning and all surgeries were performed by thesame experienced surgeon (C.M.) at the Oral Surgery Department, Faculty of Dental Medicine, SaintJoseph University (Beirut, Lebanon) between June 2016 and April 2017.

Materials 2019, 12, 2398 4 of 15
2.1. Surgical Procedure
Patients were asked to rinse with chlorhexidine digluconate solution (0.2%) for 1 min approximately10 min before surgery. Under local anesthesia, a crestal incision and full-thickness flap elevation wereperformed. Implant site preparation was initiated following a standard drilling protocol for placementof 3.3 mm core diameter implants regardless of thread diameter (AnyRidge, MegaGen, Gyeongbuk,South Korea). The surgeon clinically assessed bone density based on tactile evaluation according toMisch classification [32] as follows:
D1: Almost all dense cortical bone similar to oak- or maple-like in hardness;D2: Homogenous, dense bone similar to white pine in hardness;D3: Thin porous cortical and fine trabecular bone similar to balsa wood in hardness;D4: Little or no cortical bone, with fine trabecular bone similar to Styrofoam in hardness.
Depending on clinical bone type assessment, the surgeon chose between 4 mm, 4.5 mm, 5 mm,or 5.5 mm diameter implants. Ten-millimeter length implants were preferentially used, and 8.5 mmlength was selected when the clinical situation did not allow it. Implants were inserted using anelectronic torque wrench (DTA, Studio AIP, Italy) until the final seating of implant collar at bone leveland the final IT value was noted (Figure 1). An aluminum transducer (Smartpeg Type 27, Osstell,Göteborg, Sweden) was then screwed into the implant and torqued to 15 Ncm using an electronictorqueing device (Meg-Torq, MegaGen, Gyeongbuk, South Korea). A blinded operator recordedin duplicate ISQ values from mesio-distal, disto-mesial, bucco-lingual and linguo-buccal directions.Instrument calibration was verified before and after each patient visit using an implant fixed in anepoxy resin block. Smartpeg was then unscrewed and a transmucosal healing abutment was connectedto the implant, and soft tissues were approximated and sutured around it for a nonsubmerged healingprotocol. Periapical radiographs were then performed following paralleling long cone technique.
Materials 2019, 12, x FOR PEER REVIEW 4 of 15
protocol for placement of 3.3 mm core diameter implants regardless of thread diameter (AnyRidge, MegaGen, Gyeongbuk, South Korea). The surgeon clinically assessed bone density based on tactile evaluation according to Misch classification [32] as follows:
D1: Almost all dense cortical bone similar to oak- or maple-like in hardness; D2: Homogenous, dense bone similar to white pine in hardness; D3: Thin porous cortical and fine trabecular bone similar to balsa wood in hardness; D4: Little or no cortical bone, with fine trabecular bone similar to Styrofoam in hardness.
Depending on clinical bone type assessment, the surgeon chose between 4 mm, 4.5 mm, 5 mm, or 5.5 mm diameter implants. Ten-millimeter length implants were preferentially used, and 8.5 mm length was selected when the clinical situation did not allow it. Implants were inserted using an electronic torque wrench (DTA, Studio AIP, Italy) until the final seating of implant collar at bone level and the final IT value was noted (Figure 1). An aluminum transducer (Smartpeg Type 27, Osstell, Göteborg, Sweden) was then screwed into the implant and torqued to 15 Ncm using an electronic torqueing device (Meg-Torq, MegaGen, Gyeongbuk, South Korea). A blinded operator recorded in duplicate ISQ values from mesio-distal, disto-mesial, bucco-lingual and linguo-buccal directions. Instrument calibration was verified before and after each patient visit using an implant fixed in an epoxy resin block. Smartpeg was then unscrewed and a transmucosal healing abutment was connected to the implant, and soft tissues were approximated and sutured around it for a nonsubmerged healing protocol. Periapical radiographs were then performed following paralleling long cone technique.
Figure 1. Following final 3.3 mm bone preparation, a 4.5 mm implant was inserted using an electronic torque wrench and final insertion torque was recorded.
Patients were prescribed analgesics and antibiotic coverage (amoxicillin 2 g/daily or in case of allergy clindamycin 600 mg/daily) for 7 days, as well as oral rinses of 0.12% chlorhexidine gluconate for 15 days following implant placement.
Patients were recalled at one, two, three, and four weeks and follow-up RFA measurement were performed for each implant using the same previously described protocol.
Impressions were taken at week three and functional provisional restorations were delivered at week four when ISQ values were > 70. Patients were then enrolled in a maintenance program and recalled every four months for periodontal and oral hygiene follow-up.
After one year of prosthetic loading, implants were clinically evaluated and an additional periapical x-ray using paralleling long cone technique was performed (Figure 2). Marginal bone level was determined from linear measurements made on DBSWIN software (Version 5.7.1, Dürr Dental, Bietigheim-Bissingen, Germany), by two examiners (blinded to implant stability values) on each periapical radiograph from the most mesial and distal points of the implant platform to the first corresponding point of bone/implant contact, as previously described [33]. The 1:1 magnification of the x-rays was validated by measuring the known implant length and width.
Figure 1. Following final 3.3 mm bone preparation, a 4.5 mm implant was inserted using an electronictorque wrench and final insertion torque was recorded.
Patients were prescribed analgesics and antibiotic coverage (amoxicillin 2 g/daily or in case ofallergy clindamycin 600 mg/daily) for 7 days, as well as oral rinses of 0.12% chlorhexidine gluconatefor 15 days following implant placement.
Patients were recalled at one, two, three, and four weeks and follow-up RFA measurement wereperformed for each implant using the same previously described protocol.
Impressions were taken at week three and functional provisional restorations were delivered atweek four when ISQ values were > 70. Patients were then enrolled in a maintenance program andrecalled every four months for periodontal and oral hygiene follow-up.
After one year of prosthetic loading, implants were clinically evaluated and an additionalperiapical x-ray using paralleling long cone technique was performed (Figure 2). Marginal bonelevel was determined from linear measurements made on DBSWIN software (Version 5.7.1, DürrDental, Bietigheim-Bissingen, Germany), by two examiners (blinded to implant stability values) on

Materials 2019, 12, 2398 5 of 15
each periapical radiograph from the most mesial and distal points of the implant platform to the firstcorresponding point of bone/implant contact, as previously described [33]. The 1:1 magnification ofthe x-rays was validated by measuring the known implant length and width.Materials 2019, 12, x FOR PEER REVIEW 5 of 15
Figure 2. One year post-loading periapical radiographs showing implants placed in different bone density with variable thread depth (a—4 mm, b—4.5 and 5 mm, c—5.5 mm). Implants inserted in hard bone presented minimal thread depth (a) to avoid excessive bone compression, while implants with deep threads were used in soft bone (c) in order to attain higher primary stability.
2.2. Predictor and Outcome Variables
This clinical prospective study tested the null hypothesis of no significant differences in IT and ISQ values between different bone types, against the alternative hypothesis of a difference. The primary predictor variable was bone density, assessed intraoperatively by the surgeon in four groups (D1, D2, D3, and D4).
Primary outcome:
• Implant stability (IT and ISQ) measured at implant insertion and during the first four weeks of healing.
Secondary outcomes:
• Marginal bone loss measured 12 months after implant insertion; • Implant failure: Implant mobility (tested by tightening abutment screws at 35 Ncm at prosthesis
delivery) or implant removal suggested by progressive marginal bone loss; • Any complication or adverse event.
2.3. Statistical Analysis
Statistical analysis was performed using Statistical Package Software for Social Sciences (SPSS for Windows, version 22.0, Chicago, IL, USA). The significance level was set at 0.05.
Implant stability was described at each time interval with a single ISQ value (mean of eight measurements). Kolmogorov-Smirnov test was used to assess the normality of the continuous variables. Nonparametric tests were executed for variables not normally distributed. Kruskal-Wallis test and Friedman test for repeated measures were used to compare the continuous variables within and among the different groups of the present study. The strength of the association between IT and ISQ was assessed by Spearman Rho correlation coefficient: This evaluation was performed both for the entire sample and for each experimental group.
3. Results
From a total of 21 patients evaluated for entering this study, 14 consecutive patients (6 male, 8 female, mean age 52.3 ± 13.7) fulfilled all inclusion criteria and were enrolled and treated with the insertion of 40 implants (21 implants in maxilla and 19 in mandible; 33 implants with 10 mm length and 7 implants with 8.5 mm length). No dropouts occurred during the entire follow-up period of the study. Thirteen implants were inserted in D1 bone type, ten implants in D2, and D3 bone types, and seven implants in D4 bone type.
Figure 2. One year post-loading periapical radiographs showing implants placed in different bonedensity with variable thread depth (a—4 mm, b—4.5 and 5 mm, c—5.5 mm). Implants inserted in hardbone presented minimal thread depth (a) to avoid excessive bone compression, while implants withdeep threads were used in soft bone (c) in order to attain higher primary stability.
2.2. Predictor and Outcome Variables
This clinical prospective study tested the null hypothesis of no significant differences in IT and ISQvalues between different bone types, against the alternative hypothesis of a difference. The primarypredictor variable was bone density, assessed intraoperatively by the surgeon in four groups (D1, D2,D3, and D4).
Primary outcome:
• Implant stability (IT and ISQ) measured at implant insertion and during the first four weeksof healing.
Secondary outcomes:
• Marginal bone loss measured 12 months after implant insertion;• Implant failure: Implant mobility (tested by tightening abutment screws at 35 Ncm at prosthesis
delivery) or implant removal suggested by progressive marginal bone loss;• Any complication or adverse event.
2.3. Statistical Analysis
Statistical analysis was performed using Statistical Package Software for Social Sciences (SPSS forWindows, version 22.0, Chicago, IL, USA). The significance level was set at 0.05.
Implant stability was described at each time interval with a single ISQ value (mean of eightmeasurements). Kolmogorov-Smirnov test was used to assess the normality of the continuous variables.Nonparametric tests were executed for variables not normally distributed. Kruskal-Wallis test andFriedman test for repeated measures were used to compare the continuous variables within and amongthe different groups of the present study. The strength of the association between IT and ISQ wasassessed by Spearman Rho correlation coefficient: This evaluation was performed both for the entiresample and for each experimental group.
3. Results
From a total of 21 patients evaluated for entering this study, 14 consecutive patients (6 male,8 female, mean age 52.3 ± 13.7) fulfilled all inclusion criteria and were enrolled and treated with the

Materials 2019, 12, 2398 6 of 15
insertion of 40 implants (21 implants in maxilla and 19 in mandible; 33 implants with 10 mm lengthand 7 implants with 8.5 mm length). No dropouts occurred during the entire follow-up period of thestudy. Thirteen implants were inserted in D1 bone type, ten implants in D2, and D3 bone types, andseven implants in D4 bone type.
Overall mean IT value at baseline was of 82.3 ± 33.2 Ncm. Mean IT value at baseline variedbetween the four different types of bone and was 107.2 ± 35.6 Ncm, 74.7 ± 14.0 Ncm, 76.5 ± 31.1 Ncmand 55.2 ± 22.6 Ncm in D1, D2, D3, and D4 bone, respectively ( Figures 3 and 4).
Materials 2019, 12, x FOR PEER REVIEW 6 of 15
Overall mean IT value at baseline was of 82.3 ± 33.2 Ncm. Mean IT value at baseline varied between the four different types of bone and was 107.2 ± 35.6 Ncm, 74.7 ± 14.0 Ncm, 76.5 ± 31.1 Ncm and 55.2 ± 22.6 Ncm in D1, D2, D3, and D4 bone, respectively ( Figure 3; Figure 4).
Figure 3. Scattered insertion torque (IT) values showed a concentration of the majority of measurements within an optimal IT value (red line), regardless of bone density. Although some higher values were recorded in hard bone, all IT values were above 40 Ncm threshold and were considered within a “comfort zone” for early or immediate loading.
Figure 4. Mean IT values in different bone types. There was a significant difference between IT values in D1 and D2 bone and between D3 and D4 bone. No significant difference was noted between IT values in D2 and D3 bone.
IT values significantly changed with bone type (p = 0.003). IT was significantly lower in D4 bone, intermediate in D2 and D3 bone (but with no significant difference between the two groups; p = 0.449), and significantly higher in D1 bone.
Figure 3. Scattered insertion torque (IT) values showed a concentration of the majority of measurementswithin an optimal IT value (red line), regardless of bone density. Although some higher values wererecorded in hard bone, all IT values were above 40 Ncm threshold and were considered within a“comfort zone” for early or immediate loading.
Materials 2019, 12, x FOR PEER REVIEW 6 of 15
Overall mean IT value at baseline was of 82.3 ± 33.2 Ncm. Mean IT value at baseline varied between the four different types of bone and was 107.2 ± 35.6 Ncm, 74.7 ± 14.0 Ncm, 76.5 ± 31.1 Ncm and 55.2 ± 22.6 Ncm in D1, D2, D3, and D4 bone, respectively ( Figure 3; Figure 4).
Figure 3. Scattered insertion torque (IT) values showed a concentration of the majority of measurements within an optimal IT value (red line), regardless of bone density. Although some higher values were recorded in hard bone, all IT values were above 40 Ncm threshold and were considered within a “comfort zone” for early or immediate loading.
Figure 4. Mean IT values in different bone types. There was a significant difference between IT values in D1 and D2 bone and between D3 and D4 bone. No significant difference was noted between IT values in D2 and D3 bone.
IT values significantly changed with bone type (p = 0.003). IT was significantly lower in D4 bone, intermediate in D2 and D3 bone (but with no significant difference between the two groups; p = 0.449), and significantly higher in D1 bone.
Figure 4. Mean IT values in different bone types. There was a significant difference between IT valuesin D1 and D2 bone and between D3 and D4 bone. No significant difference was noted between ITvalues in D2 and D3 bone.

Materials 2019, 12, 2398 7 of 15
IT values significantly changed with bone type (p = 0.003). IT was significantly lower in D4 bone,intermediate in D2 and D3 bone (but with no significant difference between the two groups; p = 0.449),and significantly higher in D1 bone.
No significant correlation was found between IT and implant length (r = −0.013; p = 0.937; N = 40).Overall mean ISQ at baseline was 79.3 ± 4.3 and respective mean values in D1, D2, D3, and D4
bone qualities were 81.9 ± 2.0, 81.1 ± 1.0, 78.3 ± 3.7, and 73.2 ± 4.9. There was a significant differencein ISQ between the four different bone types at all time points (p < 0.001) (Figure 5). Regardless ofmeasurement timing, ISQ was significantly higher in D1 and D2 bone, intermediate in D3, and lowerin D4 (Table 1).
Table 1. Mean IT and implant stability quotient (ISQ) in different bone types. Both IT and ISQ valuesresulted significantly different between groups with different bone density at each time point.
Measurement Bone Type Mean Value Standard Deviation N p-value
IT
All 82.3 33.2 40
0.0031 107.2 35.6 132 74.7 14.0 103 76.5 31.1 104 55.2 22.6 7
ISQ T0
All 79.3 4.3 40
<0.0011 81.9 2.0 132 81.1 1.0 103 78.3 3.7 104 73.2 4.9 7
ISQ T1
All 79.5 4.4 40
<0.0011 82.2 2.0 132 81.3 1.4 103 78.6 3.6 104 73.4 5.6 7
ISQ T2
All 79.3 4.6 40
<0.0011 82.3 1.9 132 81.2 1.3 103 77.6 3.4 104 72.9 5.6 7
ISQ T3
All 78.3 3.8 40
<0.0011 81.0 1.3 132 79.9 1.1 103 77.2 2.4 104 72.6 4.8 7
ISQ T4
All 78.1 3.5 40
<0.0011 80.7 1.4 132 79.3 1.2 103 76.6 1.5 104 74.0 5.3 7

Materials 2019, 12, 2398 8 of 15Materials 2019, 12, x FOR PEER REVIEW 8 of 15
Figure 5. Distribution of mean ISQ at various time-points according to bone type.
ISQ significantly changed with time when considering the entire sample (p = 0.00001). This pattern was also observed in D1 (p = 0.004), D2 (p = 0.002), and D3 (p = 0.01) groups, while ISQ variations over time in D4 bone results were not significant (p = 0.07) (Figure 6). According to Spearman Rho correlation coefficient, IT and ISQ values appear moderately associated when we consider the whole sample (r = 0.55, p = 0.0002). When we split the results into four groups according to bone density, we found nonsignificant weak direct associations between IT and ISQ in D2 (r = 0.35, p = 0.31) and D3 (r = 0.47, p = 0.16). In D1 quality, we found a nonsignificant weak inverse correlation between IT and ISQ (r = -0.32, p = 0.28). In D4 bone quality only, IT and ISQ showed a strong direct correlation (r = 0.95, p = 0.0008). In other words, in this bone quality only, an increasing IT corresponded to an increasing ISQ value. Complete results are presented in Table 2.
Figure 6. Mean ISQ values in different bone density over time. A minimal drop in ISQ values occurred at three weeks in D1, D2, and D3 classes, while no significant differences were recorded over time in D4 group (p = 0.07). Thirty-nine out of forty implants presented an ISQ above 70 and were considered within a “comfort zone” for early or immediate loading.
Figure 5. Distribution of mean ISQ at various time-points according to bone type.
ISQ significantly changed with time when considering the entire sample (p = 0.00001). This patternwas also observed in D1 (p = 0.004), D2 (p = 0.002), and D3 (p = 0.01) groups, while ISQ variationsover time in D4 bone results were not significant (p = 0.07) (Figure 6). According to Spearman Rhocorrelation coefficient, IT and ISQ values appear moderately associated when we consider the wholesample (r = 0.55, p = 0.0002). When we split the results into four groups according to bone density,we found nonsignificant weak direct associations between IT and ISQ in D2 (r = 0.35, p = 0.31) andD3 (r = 0.47, p = 0.16). In D1 quality, we found a nonsignificant weak inverse correlation between ITand ISQ (r = -0.32, p = 0.28). In D4 bone quality only, IT and ISQ showed a strong direct correlation(r = 0.95, p = 0.0008). In other words, in this bone quality only, an increasing IT corresponded to anincreasing ISQ value. Complete results are presented in Table 2.
Materials 2019, 12, x FOR PEER REVIEW 8 of 15
Figure 5. Distribution of mean ISQ at various time-points according to bone type.
ISQ significantly changed with time when considering the entire sample (p = 0.00001). This pattern was also observed in D1 (p = 0.004), D2 (p = 0.002), and D3 (p = 0.01) groups, while ISQ variations over time in D4 bone results were not significant (p = 0.07) (Figure 6). According to Spearman Rho correlation coefficient, IT and ISQ values appear moderately associated when we consider the whole sample (r = 0.55, p = 0.0002). When we split the results into four groups according to bone density, we found nonsignificant weak direct associations between IT and ISQ in D2 (r = 0.35, p = 0.31) and D3 (r = 0.47, p = 0.16). In D1 quality, we found a nonsignificant weak inverse correlation between IT and ISQ (r = -0.32, p = 0.28). In D4 bone quality only, IT and ISQ showed a strong direct correlation (r = 0.95, p = 0.0008). In other words, in this bone quality only, an increasing IT corresponded to an increasing ISQ value. Complete results are presented in Table 2.
Figure 6. Mean ISQ values in different bone density over time. A minimal drop in ISQ values occurred at three weeks in D1, D2, and D3 classes, while no significant differences were recorded over time in D4 group (p = 0.07). Thirty-nine out of forty implants presented an ISQ above 70 and were considered within a “comfort zone” for early or immediate loading.
Figure 6. Mean ISQ values in different bone density over time. A minimal drop in ISQ values occurredat three weeks in D1, D2, and D3 classes, while no significant differences were recorded over time in D4group (p = 0.07). Thirty-nine out of forty implants presented an ISQ above 70 and were consideredwithin a “comfort zone” for early or immediate loading.
Materials 2019, 12, 2398 9 of 15
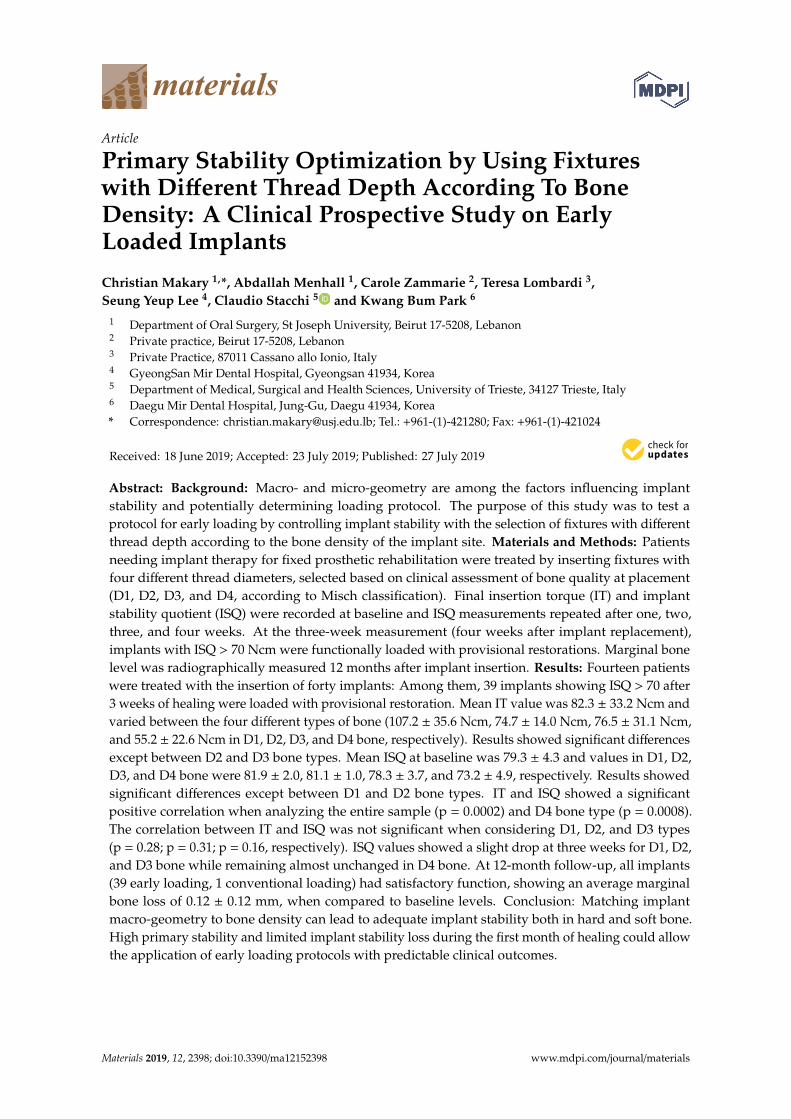
Table 2. Spearman Rho correlation coefficient between IT and ISQ according to the different groups.
Group Rho Coefficient Significance
D1 −0.32 0.28 NS
D2 0.35 0.31 NS
D3 0.47 0.16 NS
D4 0.95 0.0008 S
Overall 0.55 0.0002 S
Sample = 40 (overall); 13 (D1); 10 (D2); 10 (D3); 7 (D4). Overall refers to the whole sample. NS not statisticallysignificant correlation. S statistically significant correlation.
Four weeks after surgery, 39 out of 40 implants (97.5%) presented an ISQ value >70 and wereloaded following early loading protocol, with the remaining implant being loaded after additionalfour weeks of healing.
Twelve months after prosthetic loading, all 40 implants had satisfactory function without theoccurrence of any biological or mechanical complication. Average marginal bone loss around implantswas 0.12 ± 0.12 mm, compared to baseline level (0.11 ± 0.1 on the mesial aspect, 0.13 ± 0.12 on thedistal aspect). No significant correlations were demonstrated between marginal bone loss and thefollowing variables: IT value, implant diameter, and bone type.
4. Discussion
Achieving high primary stability upon implant placement is essential since it helps to reducemicromotions and favor strong bone-to-implant interface, both of which are crucial for properlydetermining loading protocols [3,34].
In the present work, implants with threads of different depth were used in order to assess variablemacro-geometry as a clinical way to control primary stability. These implants presented the same corediameter of 3.3 mm, but had four types of thread depth determining four different diameters of 4, 4.5,5, and 5.5 mm. Thus, following final implant site preparation with a 3.3 mm drill, mimicking implantcore diameter, and in order to avoid IT values that may impede osseointegration (very high in hardbone or very low in soft bone), it relied upon the clinician to select appropriate implant size from thefour available diameters. The main determinant in this choice were therefore based on surgeon’s tactilesense and clinical judgment during drilling. Even though this represents a subjective method in thefinal choice of implant size, the overall result seems clinically satisfactory with optimal implant stabilityvalues setting the path for an early loading protocol. Nevertheless, a wide variability in IT and ISQvalues was noted and it significantly correlated with bone density. Hence, it is very important to setcomprehensive lower and upper thresholds for IT and ISQ values, in both high and soft bone densityconditions, in order to define a “comfort zone” where implant osseointegration and peri-implant bonehealing could be not compromised after loading.
In the present work, overall mean IT value was 82.3 Ncm, with a relatively high mean value of55.2 Ncm in soft D4 bone, when compared to others studies with ISQ values ranging between 22 Ncmand 40 Ncm when using implants with tapered geometry [9,11]. Low implant IT was reported tofavor micromotion [35], potentially jeopardizing implant osseointegration [36]. Subsequently, thechoice of implants with deeper and larger thread diameter in order to obtain higher implant stabilityin soft bone can be considered as an effective method to enhance osseointegration at shorter healingperiods, possibly affecting future loading protocols [37]. IT values above 30–35 Ncm were consideredby numerous authors as the minimum threshold for immediate loading of implants [38,39]. In aprevious study, it was stated that implants with IT values below 40 Ncm could not withstand a 30 Ncmabutment torqueing after six weeks of healing [10]. In the present work, no implant presented ITvalues below 40 Ncm, even in soft bone, hence remaining within the “comfort zone” mentioned earlierin that manuscript.

Materials 2019, 12, 2398 10 of 15
Although IT values in D2 and D3 bone were significantly higher than in D4 bone and significantlylower than in D1, the present study showed similar IT values with no significant differences whencomparing implants placed into D2 and D3 bone. Setting the difference between these two types of boneremains challenging, since it is quite difficult to accurately discern bone quality into D2 and D3 bonebased uniquely on tactile perception during drilling [40]. In a previous clinical study, histomorphometricanalysis of bone core biopsies retrieved during implant preparation sites could not set the differencebetween hand assessed D2 and D3 types of bone [9]. This difficulty in discerning between these twointermediate types of bone led to the proposal of a different bone classification dividing bone qualityinto Hard, Medium, and Soft bone instead of the usual four-class classification [41].
When looking into IT values in hard bone, the present results showed a mean value of 107.2 Ncm.Even though this value may be high when compared to commonly described IT values [42], it is lowerthan that described in some clinical studies using tapered implant geometry reporting values rangingfrom 120 Ncm up to 176 Ncm [9,11,43]. A recent meta-analysis concluded that high IT values do notseem to be a predictive factor for implant failure [44]. Nevertheless, in the present study, IT valuesreached in hard D1 quality bone could potentially introduce risks related to mechanical deformation ofimplant connection [45] and excessive cortical compression, potential cause of early marginal boneloss [13,46]. Marginal bone remodeling following excessive compressive forces generated by high IT oncortical bone around implant necks was described in both animal [12] and clinical studies [47]. On theother hand, other authors could not establish a relationship between high IT values and marginal boneloss around implants [43,48]. This controversy in the literature may be due, among numerous otherinfluencing factors, to the fact that some implant geometries may distribute compressive forces betterthan other designs, possibly preventing marginal bone loss. In the present work, high IT did not seemto affect peri-implant bone levels, since no significant marginal bone remodeling was observed aroundimplant necks at 12-month follow-up (mean marginal bone loss 0.12 mm). The entity of marginalbone loss is lower when compared to data commonly described in the literature, but is consistent withstudies using implants with stable internal connections of good quality [49,50]. It is equally importantto define an upper IT threshold for a “comfort zone” where implants can have enough primarystability to withstand early or immediate loading protocol, while avoiding detrimental peri-implantosseo-compression and mechanical issues. In the clinical reality, the use of a 3.8 mm drill before placinga 4.0 mm AnyRidge implant could be considered in the presence of hard D1 quality. This choice couldhelp to avoid extremely high IT with possible mechanical stress to implant components while, at thesame time, maintaining satisfactory implant stability. This approach is also supported by a previousstudy on the same implant, showing that IT > 50 Ncm subject the bone-implant system to unnecessarybiological and mechanical stress without additional benefits in terms of implant stability [51].
The mean ISQ value in the present work was 79.3, with a variability mainly depending, amongother factors, on IT and bone quality. When recorded in soft and hard bone, mean ISQ values showedsignificantly different results (73.2 and 81.9, respectively). The correlation between ISQ values andbone density was already reported in the literature with higher values in denser bone qualities [10,11].Nevertheless, the relationship between IT and ISQ was not linear: They correlated significantly only insoft bone (D4, p = 0.0008), while the strength of their association was not significant in the other groups(D1, p = 0.28; D2, p = 0.31; D3, p = 0.16). This outcome is in accordance with a recent meta-analysisstating that IT and ISQ are independent and incomparable methods for measuring implant stability [52].Furthermore, this result is consistent with the findings of a clinical study conducted with the sameimplant here tested, which demonstrated that IT and ISQ correlate significantly only when IT valuewas lower than 50 Ncm [51].
During the early periods of healing, a drop in ISQ values is generally described in literature at thethird week. This drop is due to the bone remodeling occurring around implants during early healingphases while transitioning from initial mechanical stability to secondary biological stability [5,53].In the present study, a slight stability drop (range: 0.9—1.2 ISQ units) was noted at the third weekof healing in D1, D2, and D3 bone types, while almost no drop was noted in D4 bone (0.5 ISQ units).
Materials 2019, 12, 2398 11 of 15
The slight stability drop in hard and medium quality bone may be interpreted as a greater peri-implantbone remodeling due to surgical trauma and cortical bone compression. Nevertheless, the valuesrecorded in the present study were lower than the ones usually described in literature [10]. In a recentcomparative study on two different implant thread designs, implants with knife edge threads, similarto those used in the present work, showed a negligible drop in ISQ values over time when comparedto implants with V-shape threads [54]. The authors justified this finding by the fact than knife edgethreads cut into the trabeculae of cancellous bone, while V-shaped threads compressed the peri-implantbone, leading to a greater remodeling process [54].
During the first weeks of healing, an interaction between implant surface and surroundingbone usually occurs leading to bone apposition over this surface. This phenomenon, defined assecondary stability, leads to an enhanced stability when ISQ values are measured [31]. Secondarystability is significantly influenced by implant micro-geometry and micro-rough surfaces and has beendemonstrated to promote faster and greater new bone apposition in comparison to turned surfaces [53].Implants used in the present study have a micro-rough surface characterized by the incorporationof calcium particles of nanometric scale. Nano surfaces showed an enhanced ability to bind proteinsand osteoblasts, thus accelerating bone apposition on the surface [25,55,56]. Implants presenting thesame surface characteristics as those used in the present work showed early bone apposition in clinicalstudies [57] and an enhanced bone-to-implant contact in animal histologic studies [26]. The minimaldrop in ISQ values in hard and medium quality bone, along with the virtual absence of ISQ decreasein implants inserted in soft bone, can therefore be attributed not only to implant geometry but alsoto the surface effect leading to early bone deposition. This is especially valid in soft bone, whereosteo-compression is minimal, and this biological effect can be fully expressed.
The minimal drop in ISQ values, observed in this study at three to four weeks, may allow theapplication of immediate/early loading protocols even in challenging situations, such as soft bonequality. Many authors tried to set an ISQ threshold with clinical significance when planning futureprosthetic loading, and values above 60–65 ISQ units were proposed for splinted immediately loadedimplants [28,34], while ISQ values above 70 were considered predictive for successful early loading ofpartial edentulous implant cases [31]. In the present study, at the four-week loading session, 97.5%of the implants had an ISQ value above the aforementioned 70 ISQ unit threshold, identifying theseimplants within the “comfort zone” for an early loading protocol.
These implants were loaded at 4 weeks and showed successful clinical outcomes at 12-monthpost-loading follow-up. They were placed in different bone qualities and in both mandibular andmaxillary locations, showing stable results over time, irrespective of bone quality. If early loading ofimplants placed in the posterior mandible was already validated through clinical studies [31], loadingof implants in the posterior maxilla did not reach a clinical consensus yet [30]. In the present study,both implant macro- and microgeometry were therefore crucial elements in achieving firm primaryand fast secondary stability, thus keeping the implants within the “comfort zone” for early loading atfour weeks after implant placement, with satisfactory short-term clinical outcomes.
One of the main limitations of this study is represented by the subjective method used to determinebone density, which guided the clinician to the implant choice. Objective and reliable methods toevaluate and identify bone density are needed, in order to minimize possible diagnostic errors. Anotherlimitation of this research was the small number of included subjects, together with the absence ofa sample size calculation. The present results could be used to determine adequate sample size forfuture studies.
Furthermore, the results of the present study should not be extrapolated to all implant systems:Other geometries and/or implant site preparation techniques may lead to different clinical outcomes,and further investigations using different macro-geometries should be performed. In the future,randomized controlled studies should be performed in order to confirm the outcomes of the presentclinical prospective study.
Materials 2019, 12, 2398 12 of 15
5. Conclusions
Bone type may affect implant primary stability by leading to higher IT values in hard bone andlower values in soft bone. Nevertheless, the present study showed that matching implant geometry tobone type may control IT values in the majority of cases leading to a “comfort zone” where optimalimplant primary stability may be obtained in all bone types. Implant macro- and micro-geometry playan important role in maintaining high ISQ values during the first weeks of loading, thus allowing forsuccessful early loading regardless of bone density. High IT values do not seem to affect marginal bonelevels when using this specific implant design.
Author Contributions: C.M.: Conception or design of the work, Data collection, Surgical procedures, Dataanalysis and interpretation, Drafting the article, Critical revision of the article, Final approval of the version to bepublished. A.M.: Conception or design of the work, Data collection, Data analysis and interpretation, Draftingthe article, Critical revision of the article, Final approval of the version to be published. C.Z.: Data collection,Data analysis and interpretation, Final approval of the version to be published. T.L.: Drafting the article, Criticalrevision of the article, Final approval of the version to be published. S.Y.L.: Conception or design of the work,Critical revision of the article, Final approval of the version to be published. C.S.: Data analysis and interpretation,Drafting the article, Critical revision of the article, Final approval of the version to be published. K.B.P.: Conceptionor design of the work, Critical revision of the article, Final approval of the version to be published.
Funding: This work was supported by MegaGen Implant Co., Kwang-Bum Park is Chief Executive Officer ofMegaGen Implant Co. This research was funded by MegaGen INTERNATIONAL Implant Co, Gyeongbuk,South Korea, grant number XFMD-125.
Acknowledgments: The authors wish to thank Nada Osta for the statistical analysis.
Conflicts of Interest: The authors declare no conflict of interest.
References
1. Misch, C.E.; Perel, M.L.; Wang, H.-L.; Sammartino, G.; Galindo-Moreno, P.; Trisi, P.; Steigmann, M.;Rebaudi, A.; Palti, A.; Pikos, M.A.; et al. Implant Success, Survival, and Failure: The International Congressof Oral Implantologists (ICOI) Pisa Consensus Conference. Implant. Dent. 2008, 17, 5–15. [CrossRef][PubMed]
2. Albrektsson, T.; Brånemark, P.-I.; Hansson, H.-A.; Lindström, J. Osseointegrated TitaniumImplants:Requirements for Ensuring a Long-Lasting, Direct Bone-to-Implant Anchorage in Man.Acta Orthop. Scand. 1981, 52, 155–170. [CrossRef] [PubMed]
3. Szmukler-Moncler, S.; Salama, H.; Reingewirtz, Y.; Dubruille, J.H.; Szmukler-Moncler, S. Timing of loadingand effect of micromotion on bone-dental implant interface: Review of experimental literature. J. Biomed.Mater. Res. 1998, 43, 192–203. [CrossRef]
4. Brunski, J.B. In vivo bone response to biomechanical loading at the bone/dental-implant interface.Adv. Dent. Res. 1999, 13, 99–119. [CrossRef] [PubMed]
5. Raghavendra, S.; Wood, M.C.; Taylor, T.D. Early Wound Healing Around Endosseous Implants: A Review ofthe Literature. Int. J. Oral Maxillofac. Implant. 2005, 20, 425–431.
6. Davies, J.E. Understanding peri-implant endosseous healing. J. Dent. Educ. 2003, 67, 932–949. [PubMed]7. Tabassum, A.; Meijer, G.J.; Wolke, J.G.C.; Jansen, J.A. Influence of surgical technique and surface roughness
on the primary stability of an implant in artificial bone with different cortical thickness: A laboratory study.Clin. Oral Implants Res. 2010, 21, 213–220. [CrossRef]
8. Atsumi, M.; Park, S.-H.; Wang, H.-L. Methods used to assess implant stability: Current status. Int. J. OralMaxillofac. Implants 2007, 22, 743–754.
9. Makary, C.; Rebaudi, A.; Mokbel, N.; Naaman, N. Peak insertion torque correlated to histologically andclinically evaluated bone density. Implant Dent. 2011, 20, 182–191. [CrossRef]
10. Makary, C.; Rebaudi, A.; Sammartino, G.; Naaman, N. Implant primary stability determined by resonancefrequency analysis: Correlation with insertion torque, histologic bone volume, and torsional stability at6 weeks. Implant Dent. 2012, 21, 474–480. [CrossRef]
11. Makary, C.; Rebaudi, A.; Demircioglu, A.; Lahoud, P.; Naaman, N. Standard Drilling Versus UltrasonicImplant Site Preparation: A Clinical Study at 4 Weeks After Insertion of Conical Implants. Implant Dent.2017, 26, 547–552. [CrossRef] [PubMed]

Materials 2019, 12, 2398 13 of 15
12. Duyck, J.; Corpas, L.; Vermeiren, S.; Ogawa, T.; Quirynen, M.; Vandamme, K.; Jacobs, R.; Naert, I. Histological,histomorphometrical, and radiological evaluation of an experimental implant design with a high insertiontorque. Clin. Oral Implants Res. 2010, 21, 877–884. [CrossRef] [PubMed]
13. Marconcini, S.; Giammarinaro, E.; Toti, P.; Alfonsi, F.; Covani, U.; Barone, A. Longitudinal analysis on theeffect of insertion torque on delayed single implants: A 3-year randomized clinical study. Clin. Implant Dent.Relat. Res. 2018, 20, 322–332. [CrossRef] [PubMed]
14. Ottoni, J.M.P.; Oliveira, Z.F.L.; Mansini, R.; Cabral, A.M. Correlation between placement torque and survivalof single-tooth implants. Int. J. Oral Maxillofac. Implants 2005, 20, 769–776. [PubMed]
15. Stocchero, M.; Toia, M.; Cecchinato, D.; Becktor, J.P.; Coelho, P.G.; Jimbo, R. Biomechanical, Biologic, andClinical Outcomes of Undersized Implant Surgical Preparation: A Systematic Review. Int. J. Oral Maxillofac.Implants 2016, 31, 1247–1263. [CrossRef]
16. Degidi, M.; Daprile, G.; Piattelli, A. Influence of underpreparation on primary stability of implants inserted inpoor quality bone sites: An in vitro study. J. Oral Maxillofac. Surg. 2015, 73, 1084–1088. [CrossRef] [PubMed]
17. Jimbo, R.; Tovar, N.; Anchieta, R.B.; Machado, L.S.; Marin, C.; Teixeira, H.S.; Coelho, P.G. The combinedeffects of undersized drilling and implant macrogeometry on bone healing around dental implants: Anexperimental study. Int. J. Oral Maxillofac. Surg. 2014, 43, 1269–1275. [CrossRef]
18. O’Sullivan, D.; Sennerby, L.; Meredith, N. Measurements comparing the initial stability of five designs ofdental implants: A human cadaver study. Clin. Implant Dent. Relat. Res. 2000, 2, 85–92. [CrossRef]
19. Abuhussein, H.; Pagni, G.; Rebaudi, A.; Wang, H. The effect of thread pattern upon implant osseointegration.Clin. Oral Implants Res. 2010, 21, 129–136. [CrossRef]
20. Lee, S.-Y.; Kim, S.-J.; An, H.-W.; Kim, H.-S.; Ha, D.-G.; Ryo, K.-H.; Park, K.-B. The effect of the thread depthon the mechanical properties of the dental implant. J. Adv. Prosthodont. 2015, 7, 115–121. [CrossRef]
21. Berglundh, T.; Abrahamsson, I.; Lang, N.P.; Lindhe, J. De novo alveolar bone formation adjacent to endosseousimplants. Clin. Oral Implants Res. 2003, 14, 251–262. [CrossRef] [PubMed]
22. Adell, R.; Lekholm, U.; Rockler, B.; Brånemark, P.I. A 15-year study of osseointegrated implants in thetreatment of the edentulous jaw. Int. J. Oral Surg. 1981, 10, 387–416. [CrossRef]
23. Khang, W.; Feldman, S.; Hawley, C.E.; Gunsolley, J. A multi-center study comparing dual acid-etchedand machined-surfaced implants in various bone qualities. J. Periodontol. 2001, 72, 1384–1390. [CrossRef][PubMed]
24. Wennerberg, A.; Albrektsson, T. Effects of titanium surface topography on bone integration: A systematicreview. Clin. Oral Implants Res. 2009, 20, 172–184. [CrossRef] [PubMed]
25. Mendonça, G.; Mendonça, D.B.S.; Aragão, F.J.L.; Cooper, L.F. Advancing dental implant surfacetechnology—From micron-to nanotopography. Biomaterials 2008, 29, 3822–3835. [CrossRef] [PubMed]
26. Lee, S.-Y.; Yang, D.-J.; Yeo, S.; An, H.-W.; Ryoo, K.H.; Park, K.-B. The cytocompatibility and osseointegrationof the Ti implants with XPEED(R) surfaces. Clin. Oral Implants Res. 2012, 23, 1283–1289. [CrossRef] [PubMed]
27. Baltayan, S.; Pi-Anfruns, J.; Aghaloo, T.; Moy, P.K. The Predictive Value of Resonance Frequency AnalysisMeasurements in the Surgical Placement and Loading of Endosseous Implants. J. Oral Maxillofac. Surg. 2016,74, 1145–1152. [CrossRef] [PubMed]
28. Ostman, P.-O.; Hellman, M.; Sennerby, L. Direct implant loading in the edentulous maxilla using a bonedensity-adapted surgical protocol and primary implant stability criteria for inclusion. Clin. Implant Dent.Relat. Res. 2005, 7, S60–S69. [CrossRef] [PubMed]
29. Bornstein, M.M.; Hart, C.N.; Halbritter, S.A.; Morton, D.; Buser, D. Early loading of nonsubmerged titaniumimplants with a chemically modified sand-blasted and acid-etched surface: 6-month results of a prospectivecase series study in the posterior mandible focusing on peri-implant crestal bone changes and implantstability quotient (ISQ) values. Clin. Implant Dent. Relat. Res. 2009, 11, 338–347. [PubMed]
30. Gallucci, G.O.; Benic, G.I.; Eckert, S.E.; Papaspyridakos, P.; Schimmel, M.; Schrott, A.; Weber, H.P. Consensusstatements and clinical reco mmendations for implant loading protocols. Int. J. Oral Maxillofac. Implants2014, 29, 287–290. [CrossRef]
31. Hicklin, S.P.; Schneebeli, E.; Chappuis, V.; Janner, S.F.M.; Buser, D.; Brägger, U. Early loading of titaniumdental implants with an intra-operatively conditioned hydrophilic implant surface after 21 days of healing.Clin. Oral Implants Res. 2016, 27, 875–883. [CrossRef] [PubMed]
32. Misch, C.E. Bone classification, training keys to implant success. Dent. Today 1989, 8, 39. [PubMed]
Materials 2019, 12, 2398 14 of 15
33. Galindo-Moreno, P.; León-Cano, A.; Ortega-Oller, I.; Monje, A.; O’Valle, F.; Catena, A. Marginal bone loss assuccess criterion in implant dentistry: Beyond 2 mm. Clin. Oral Implants Res. 2015, 26, e28–e34. [CrossRef][PubMed]
34. Wentaschek, S.; Scheller, H.; Schmidtmann, I.; Hartmann, S.; Weyhrauch, M.; Weibrich, G.; Lehmann, K.M.Sensitivity and Specificity of Stability Criteria for I mmediately Loaded Splinted Maxillary Implants. Clin.Implant Dent. Relat. Res. 2015, 17, e542–e549. [CrossRef] [PubMed]
35. Trisi, P.; Perfetti, G.; Baldoni, E.; Berardi, D.; Colagiovanni, M.; Scogna, G. Implant micromotion is related topeak insertion torque and bone density. Clin. Oral Implants Res. 2009, 20, 467–471. [CrossRef] [PubMed]
36. Lioubavina-Hack, N.; Lang, N.P.; Karring, T. Significance of primary stability for osseointegration of dentalimplants. Clin. Oral Implants Res. 2006, 17, 244–250. [CrossRef] [PubMed]
37. Maiorana, C.; Farronato, D.; Pieroni, S.; Cicciu, M.; Andreoni, D.; Santoro, F. A Four-Year Survival RateMulticenter Prospective Clinical Study on 377 Implants: Correlations Between Implant Insertion Torque,Diameter, and Bone Quality. J. Oral Implantol. 2015, 41, e60–e65. [CrossRef]
38. Cannizzaro, G.; Leone, M.; Ferri, V.; Viola, P.; Gelpi, F.; Esposito, M. I mmediate loading of single implantsinserted flapless with medium or high insertion torque: A 6-month follow-up of a split-mouth randomisedcontrolled trial. Eur. J. Oral Implantol. 2012, 5, 333–342. [PubMed]
39. Greenstein, G.; Cavallaro, J. Implant Insertion Torque: Its Role in Achieving Primary Stability of RestorableDental Implants. Compend. Contin. Educ. Dent. 2017, 38, 88–95.
40. Trisi, P.; Rao, W. Bone classification: Clinical-histomorphometric comparison. Clin. Oral Implants Res. 1999,10, 1–7.
41. Rebaudi, A. The ray setting procedure: A new method for implant planning and i mmediate prosthesisdelivery. Int. J. Periodontics Restor. Dent. 2007, 27, 267–275.
42. Li, H.; Liang, Y.; Zheng, Q. Meta-Analysis of Correlations Between Marginal Bone Resorption and HighInsertion Torque of Dental Implants. Int. J. Oral Maxillofac. Implants 2015, 30, 767–772. [CrossRef] [PubMed]
43. Khayat, P.G.; Arnal, H.M.; Tourbah, B.I.; Sennerby, L. Clinical outcome of dental implants placed with highinsertion torques (up to 176 Ncm). Clin. Implant Dent. Relat. Res. 2013, 15, 227–233. [CrossRef] [PubMed]
44. Berardini, M.; Trisi, P.; Sinjari, B.; Rutjes, A.W.S.; Caputi, S. The Effects of High Insertion Torque VersusLow Insertion Torque on Marginal Bone Resorption and Implant Failure Rates: A Systematic Review withMeta-Analyses. Implant Dent. 2016, 25, 532. [CrossRef] [PubMed]
45. Teixeira, A.B.V.; Shimano, A.C.; Macedo, A.P.; Valente, M.L.C.; Reis, A.C.D. Influence of torsional strength ondifferent types of dental implant platforms. Implant Dent. 2015, 24, 281–286. [CrossRef] [PubMed]
46. Aldahlawi, S.; Demeter, A.; Irinakis, T. The effect of implant placement torque on crestal bone remodelingafter 1 year of loading. Clin. Cosmet. Investig. Dent. 2018, 10, 203–209. [CrossRef] [PubMed]
47. Barone, A.; Alfonsi, F.; Derchi, G.; Tonelli, P.; Toti, P.; Marchionni, S.; Covani, U. The effect of insertion torqueon the clinical outcome of single implants: A randomized clinical trial. Clin. Implant Dent. Relat. Res. 2016,18, 588–600. [CrossRef]
48. Grandi, T.; Guazzi, P.; Samarani, R.; Grandi, G. Clinical outcome and bone healing of implants placed withhigh insertion torque: 12-month results from a multicenter controlled cohort study. Int. J. Oral Maxillofac.Surg. 2013, 42, 516–520. [CrossRef]
49. Palacios-Garzón, N.; Mauri-Obradors, E.; Labrés, X.R.; Estrugo-Devesa, A.; Jané-Salas, E.; López-López, J.Comparison of Marginal Bone Loss Between Implants with Internal and External Connections: A SystematicReview. Int. J. Oral Maxillofac. Implants. 2018, 33, 580–589. [CrossRef]
50. Tallarico, M.; Fiorellini, J.; Nakajima, Y.; Omori, Y.; Takahisa, I.; Canullo, L. Mechanical Outcomes,Microleakage, and Marginal Accuracy at the Implant-Abutment Interface of Original versus NonoriginalImplant Abutments: A Systematic Review of In Vitro Studies. Biomed. Res. Int. 2018, 2018, 2958982.[CrossRef]
51. Baldi, D.; Lombardi, T.; Colombo, J.; Cervino, G.; Perinetti, G.; Di Lenarda, R.; Stacchi, C. Correlationbetween Insertion Torque and Implant Stability Quotient in Tapered Implants with Knife-Edge ThreadDesign. Biomed. Res. Int. 2018, 2018, 7201093. [CrossRef] [PubMed]
52. Lages, F.S.; Oliveira, D.W.D.; Costa, F.O. Relationship between implant stability measurements obtained byinsertion torque and resonance frequency analysis: A systematic review. Clin. Implant Dent. Relat. Res. 2018,20, 26–33. [CrossRef] [PubMed]

Materials 2019, 12, 2398 15 of 15
53. Oates, T.W.; Valderrama, P.; Bischof, M.; Nedir, R.; Jones, A.; Simpson, J.; Toutenburg, H.; Cochran, D.L.Enhanced implant stability with a chemically modified SLA surface: A randomized pilot study. Int. J. OralMaxillofac. Implant. 2007, 22, 755–760.
54. McCullough, J.J.; Klokkevold, P.R. The effect of implant macro-thread design on implant stability in the earlypost-operative period: A randomized, controlled pilot study. Clin. Oral Implant. Res. 2017, 28, 1218–1226.[CrossRef] [PubMed]
55. Cicciù, M.; Fiorillo, L.; Herford, A.S.; Crimi, S.; Bianchi, A.; D’Amico, C.; Laino, L.; Cervino, G. BioactiveTitanium Surfaces: Interactions of Eukaryotic and Prokaryotic Cells of Nano Devices Applied to DentalPractice. Biomedicines 2019, 7, 12. [CrossRef] [PubMed]
56. Cicciù, M. Nanobiomaterials in dentistry: What’s the consequent level. Eur. J. Dent. 2018, 12, 161–162.[CrossRef] [PubMed]
57. Mangano, C.; Shibli, J.A.; Pires, J.T.; Luongo, G.; Piattelli, A.; Iezzi, G. Early Bone Formation around Immediately Loaded Transitional Implants Inserted in the Human Posterior Maxilla: The Effects of FixtureDesign and Surface. Biomed. Res. Int. 2017, 2017, 4152506. [CrossRef] [PubMed]
© 2019 by the authors. Licensee MDPI, Basel, Switzerland. This article is an open accessarticle distributed under the terms and conditions of the Creative Commons Attribution(CC BY) license (http://creativecommons.org/licenses/by/4.0/).