Embed Size (px)
Citation preview


Contents 1. Summary ................................................................................................................................. 5 2. Introduction ............................................................................................................................. 6
2.1 Metals and minerals in the 21st Century .......................................................................... 6 2.2 The European Union Raw Materials Initiative - RMI ...................................................... 7
3. Mineral and mineral-based industries in Norway ................................................................. 11 3.1 Primary production of mineral resources ....................................................................... 11 3.2 Mineral-based industries and value chains ..................................................................... 16
4. Strategic metals/minerals ...................................................................................................... 19 4.1 Commodities defined as critical in the DG Enterprise analysis of 2013-14 .................. 19 4.2 The CRM analysis of 2016-17: methods and progress................................................... 32 4.3 Strategies: the EU Raw Materials Initiative ................................................................... 34
4.3.1 Strategies in the Nordic countries ........................................................................... 35 5. Regional perspectives ............................................................................................................ 39
5.1 The Barents Region, Svalbard and sea-bed resources .................................................... 39 5.2 Neighbouring regions of the Arctic ................................................................................ 42
6. Strategic challenges ............................................................................................................... 43 7. Conclusions ........................................................................................................................... 43 References ..................................................................................................................................... 44 Figures Figure 1 Production ( thousand m tonnes) of iron ore 1991-2014 (data from British Geological Survey, World Mineral Statistics, 2016) ......................................................................................... 7 Figure 2 Production (thousand m tonnes) of manganese ore 1991-2014 (data from British Geological Survey, World Mineral Statistics, 2016) ...................................................................... 7 Figure 3 Metal and industrial mineral deposits of national importance (blue – in production, red – deposits with documented importance) ...................................................................................... 11 Figure 4 Value chain for mineral-based industry in Norway (2014) (the format is based on a figure in the EU Raw Materials InitiativeAnnex1, all data are from Statistics Norway) ............. 16 Figure 5 Classification of commodities in relation to supply risk and economic importance (DG Enterprisse, 2014). ......................................................................................................................... 20 Figure 6 Development in production of rare earths 1976-2014 (t mineral concentrate)(data from British Geological Survey, World Mineral Statistics) .................................................................. 30 Figure 7 important ore deposits in Norden and NW Russia (Eilu, 2011) ..................................... 39 Figure 8 Norilsk Nickel plants on the Kola Peninsula .................................................................. 41

Tables Table 1 Use of selected metals in modern society .......................................................................... 6 Table 2 Leading producer countries for selected metallic ores in 2014 .......................................... 8 Table 3 Leading producers of selected industrial minerals in 2014 (BGS, 2016) ........................ 10 Table 4 Grades in the three Espedalen deposits based on a NI 43-101 compatible assessment by Reddick Consulting (2009). .......................................................................................................... 13 Table 5 Import of selected mineral/metallic resources to Norway (in tonnes). ............................ 17 Table 6 Metallic/mineral commodities chosen for assessment of criticality in 2014.. ................. 19 Table 7 Forecast market balance for critical raw materials to 2020 (Roskill Information Services, 2013 in DG Enterprise, 2014) ....................................................................................................... 21 Attachments Attachment 1 Norway - primary production, import and export (British Geological Survey, 2016) .............................................................................................................................................. 46 Attachment 2 Ferroalloys: World Production (United States Geological Survey Minerals Yearbook – 2013) .......................................................................................................................... 50
5
1. Summary The aim of this report is to give a brief summary of Norway’s mineral resource potential, of trends in the world markets for the relevant commodities and, on this basis, to point to development possibilities and to threats to supply chains which are important for Norwegian industry. The analysis in the Study on Critical Raw Materials at EU Level (RMI), completed in 2014, is taken as a starting point: this analysis was an updated revision of the 2010 analysis which formed part of the basis for the first, Norwegian-language version of this report, issued in 2011. A third such analysis, due to be completed in 2017, is in progress: The implications of similar analyses undertaken in the United States1 and Japan2 are also considered in relation to specific issues. Norway is an important supplier to European (and other) markets of the following resources in “raw” and processed forms:
• Primary production of metallic ores and metallic minerals: titanium minerals, iron ore. • Primary production of industrial minerals: marble, quartz, high-purity quartz, nepheline
syenite, olivine, flake graphite. Norway has, in addition, a potential for the following commodities which were assessed for criticality in the RMI: Metals: beryllium, copper, gold, magnesium, molybdenum, nickel, niobium, scandium, rare earth elements (REE) and zinc. Industrial minerals: feldspar, fluorspar, phosphate minerals and talc. Norway also has a significant potential for several other commodities which are in demand, e.g. lead, dolomite and hard-rock aggregate. Implicit in this potential are major opportunities for added value and additional employment in processing the resources, where appropriate, in Norway. Norway has, based on primary production and imported mineral resources, a very important role in supply of the following mineral-based products to European and other markets: aluminium, ferro-alloys (many types), carbonate slurry, cobalt metal, mineral-based fertilizer, manganese alloys, nickel metal and silicon metal. Potential threats to the industry are linked to trade restrictions and political instability in countries from which Norway imports unprocessed minerals. Norway has high-level expertise in metallurgy and in mineral processing. It is important that these skills are maintained and developed as elements in national economic development. Mineral deposits which are a critical base for parts of the industry, or for export, should be given the status of resources of national importance. Cooperation in the Nordic region being generated in NordMin3 and in other organisations can lead to many benefits in relation to basic scientific knowledge, good research-based solutions in all elements of the value-chains, logistical infrastructure and communication of the potential of the region to the rest of the world. 1 http://energy.gov/sites/prod/files/DOE_CMS2011_FINAL_Full.pdf 2 http://www.meti.go.jp/english/press/data/20090728_01.html 3 http://www.norden.org/en/nordic-council-of-ministers/council-of-ministers/nordic-council-of-ministers-for-business-energy-regional-policy-mr-ner/nordmin

6
2. Introduction
2.1 Metals and minerals in the 21st Century Mineral resources are vital components in our daily lives, to an extent of which few are aware. Construction materials for our houses and roads, iron for steel, ground marble or limestone in cement and paper, special metals in numerous electronic applications, to name a few. Each resident in Norway uses, on average 12 metric tonnes (t) of mineral raw materials annually, equivalent at this rate, to 1000 t during a lifetime. Our dependence on mineral resources includes an increasing number of commodities which are mined and processed in other parts of the world. Electronic equipment which most of us use every day includes numerous special metals (Table 1). Many of these metals cannot, with current technology, be substituted with other metals/materials without a significant loss of performance. This applies to components in cell phones and computers, in which over 60 different metals and minerals are employed. Special metals are important in many components in “green technology”, e.g. in wind mills and hybrid and electric vehicles, for which demand is expected to increase dramatically in the coming decades.
SECTOR SPECIAL METALS Electricity cables Cu, Be Wind mills 150-300 kg Nd/MW (+ Fe, B, Pr, Dy) Catalysis Ce, La, Nd Jet motors Co, Ru, Nb, Pr Circuit boards Cu, Sn, Au, Pt, Pd, Ga Batteries, normal Co, Ni, Mn Tesla battery Li, Si, Ni, Co, Al Prius battery Ni, Li, 10-15 kg La Prius motor 1 kg Nd ,Te, Dy LCD screens In, Y, Eu,Ga, Sn Hard drive Co, Ni, B, Nd Cell phone – circuitry Cu, Mg, Pb, Au, As, Be, Pt, Ag Cell phone – battery, condenser Co, Li, C, Hg, Cd, Nd, Nb, Ta
Table 1 Use of selected metals in modern society (rare earth elements in bold font). Main sources: DG Enterprise and Industry: Critical Raw Materials for the EU (2014): http://electrical-cars.net/toyota-2/toyota-prius-rare-earth-metals-electric-cars-and.html,
Global trends
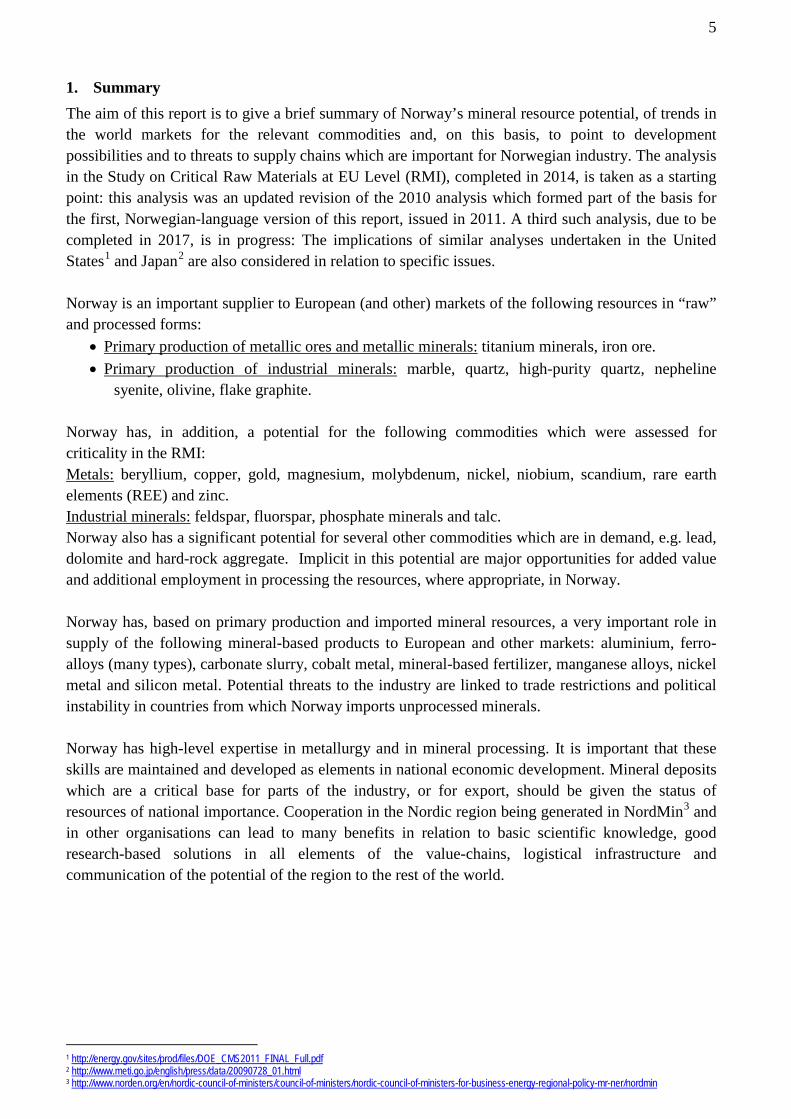
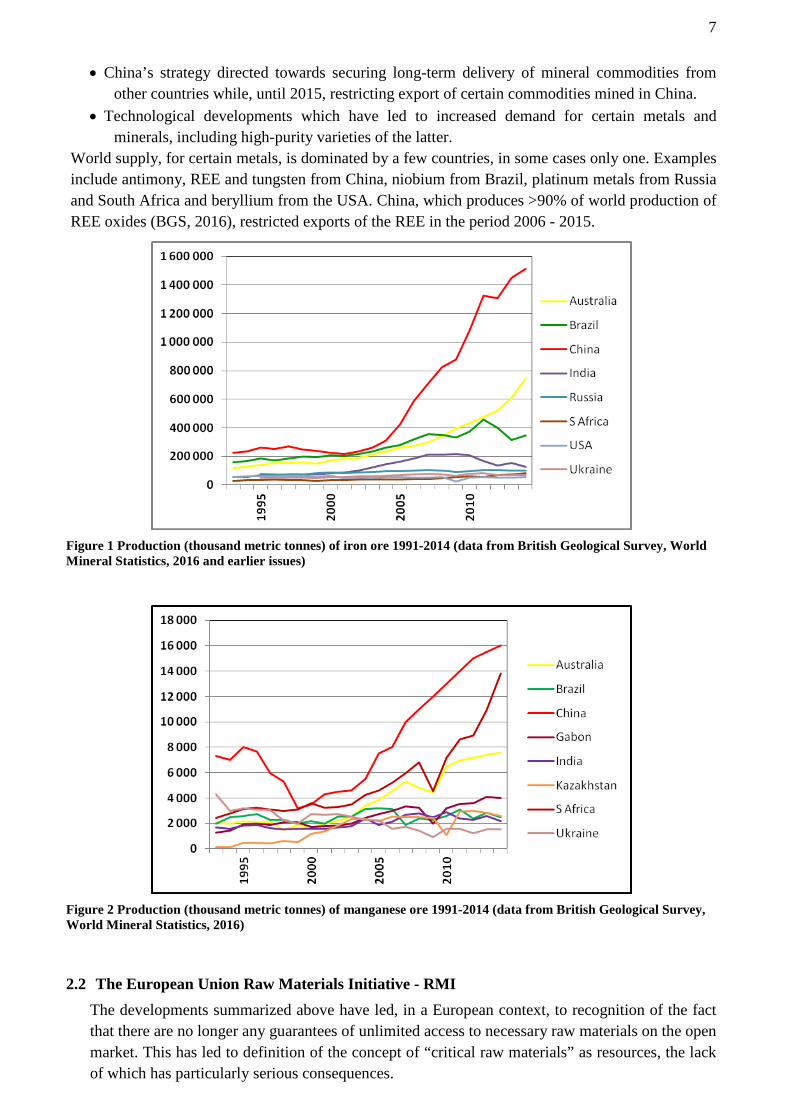
The last two decades have seen dramatic changes in global markets for mineral commodities. Demand, and for some commodities also prices, have grown dramatically in certain periods to be followed by falling prices in periods of lower growth in demand. A recent forecast4 projects continued growth in demand. Several processes have led to these developments: • Economic growth and urbanisation in China and several other countries. In the long term
achievement of the prognosis that the proportion of urban population in China will rise from just under 50% to 70% by 2030 will be decisive in the development of metal demand and prices. China’s production of pig iron was 56.7% of the world total in 2014 and its proportion of world steel production was 49.4% (British Geological Survey, 2015)5 (see Figure 1).
4 http://www.woodmacresearch.com/cgi-bin/wmprod/portal/corp/corpPressDetail.jsp?oid=11623152 5 https://www.bgs.ac.uk/mineralsuk/statistics/worldStatistics.html
7
• China’s strategy directed towards securing long-term delivery of mineral commodities from other countries while, until 2015, restricting export of certain commodities mined in China.
• Technological developments which have led to increased demand for certain metals and minerals, including high-purity varieties of the latter.
World supply, for certain metals, is dominated by a few countries, in some cases only one. Examples include antimony, REE and tungsten from China, niobium from Brazil, platinum metals from Russia and South Africa and beryllium from the USA. China, which produces >90% of world production of REE oxides (BGS, 2016), restricted exports of the REE in the period 2006 - 2015.
Figure 1 Production (thousand metric tonnes) of iron ore 1991-2014 (data from British Geological Survey, World Mineral Statistics, 2016 and earlier issues)
Figure 2 Production (thousand metric tonnes) of manganese ore 1991-2014 (data from British Geological Survey, World Mineral Statistics, 2016)
2.2 The European Union Raw Materials Initiative - RMI The developments summarized above have led, in a European context, to recognition of the fact that there are no longer any guarantees of unlimited access to necessary raw materials on the open market. This has led to definition of the concept of “critical raw materials” as resources, the lack of which has particularly serious consequences.
8
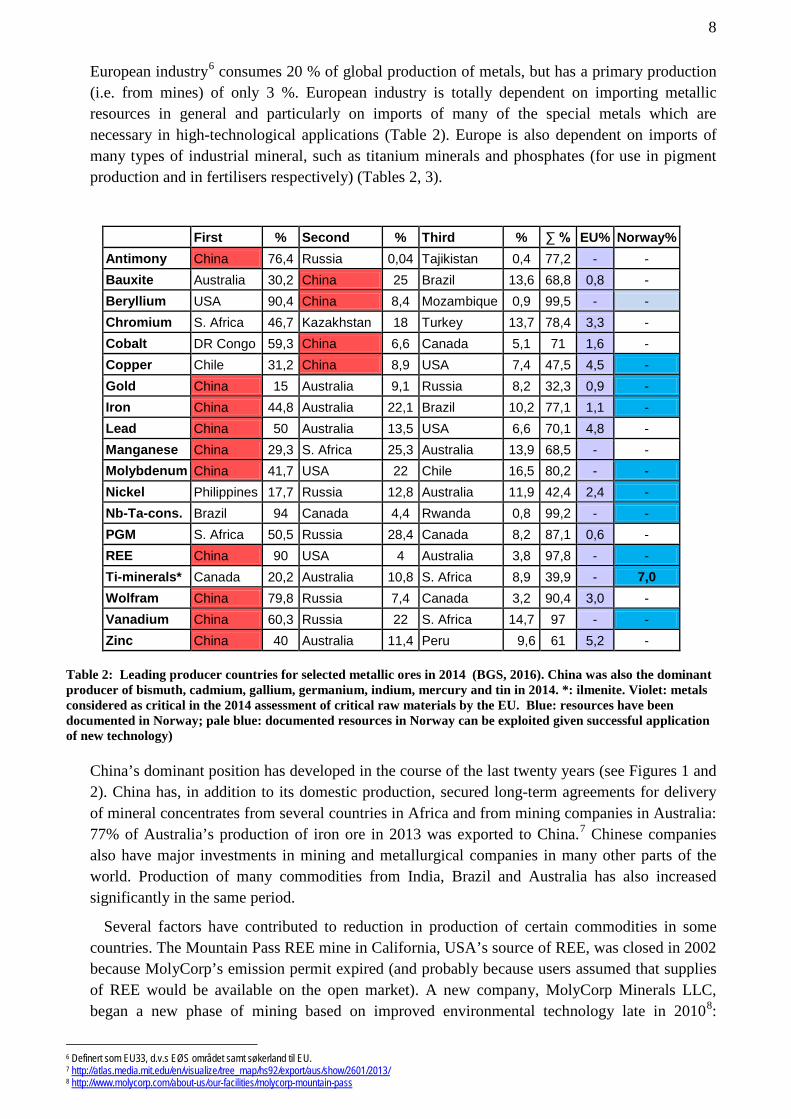
European industry6 consumes 20 % of global production of metals, but has a primary production (i.e. from mines) of only 3 %. European industry is totally dependent on importing metallic resources in general and particularly on imports of many of the special metals which are necessary in high-technological applications (Table 2). Europe is also dependent on imports of many types of industrial mineral, such as titanium minerals and phosphates (for use in pigment production and in fertilisers respectively) (Tables 2, 3).
First % Second % Third % ∑ % EU% Norway% Antimony China 76,4 Russia 0,04 Tajikistan 0,4 77,2 - - Bauxite Australia 30,2 China 25 Brazil 13,6 68,8 0,8 - Beryllium USA 90,4 China 8,4 Mozambique 0,9 99,5 - - Chromium S. Africa 46,7 Kazakhstan 18 Turkey 13,7 78,4 3,3 - Cobalt DR Congo 59,3 China 6,6 Canada 5,1 71 1,6 - Copper Chile 31,2 China 8,9 USA 7,4 47,5 4,5 - Gold China 15 Australia 9,1 Russia 8,2 32,3 0,9 - Iron China 44,8 Australia 22,1 Brazil 10,2 77,1 1,1 - Lead China 50 Australia 13,5 USA 6,6 70,1 4,8 - Manganese China 29,3 S. Africa 25,3 Australia 13,9 68,5 - - Molybdenum China 41,7 USA 22 Chile 16,5 80,2 - - Nickel Philippines 17,7 Russia 12,8 Australia 11,9 42,4 2,4 - Nb-Ta-cons. Brazil 94 Canada 4,4 Rwanda 0,8 99,2 - - PGM S. Africa 50,5 Russia 28,4 Canada 8,2 87,1 0,6 - REE China 90 USA 4 Australia 3,8 97,8 - - Ti-minerals* Canada 20,2 Australia 10,8 S. Africa 8,9 39,9 - 7,0 Wolfram China 79,8 Russia 7,4 Canada 3,2 90,4 3,0 - Vanadium China 60,3 Russia 22 S. Africa 14,7 97 - - Zinc China 40 Australia 11,4 Peru 9,6 61 5,2 -
Table 2: Leading producer countries for selected metallic ores in 2014 (BGS, 2016). China was also the dominant producer of bismuth, cadmium, gallium, germanium, indium, mercury and tin in 2014. *: ilmenite. Violet: metals considered as critical in the 2014 assessment of critical raw materials by the EU. Blue: resources have been documented in Norway; pale blue: documented resources in Norway can be exploited given successful application of new technology)
China’s dominant position has developed in the course of the last twenty years (see Figures 1 and 2). China has, in addition to its domestic production, secured long-term agreements for delivery of mineral concentrates from several countries in Africa and from mining companies in Australia: 77% of Australia’s production of iron ore in 2013 was exported to China.7 Chinese companies also have major investments in mining and metallurgical companies in many other parts of the world. Production of many commodities from India, Brazil and Australia has also increased significantly in the same period.
Several factors have contributed to reduction in production of certain commodities in some countries. The Mountain Pass REE mine in California, USA’s source of REE, was closed in 2002 because MolyCorp’s emission permit expired (and probably because users assumed that supplies of REE would be available on the open market). A new company, MolyCorp Minerals LLC, began a new phase of mining based on improved environmental technology late in 20108:
6 Definert som EU33, d.v.s EØS området samt søkerland til EU. 7 http://atlas.media.mit.edu/en/visualize/tree_map/hs92/export/aus/show/2601/2013/ 8 http://www.molycorp.com/about-us/our-facilities/molycorp-mountain-pass
9
production of REE began in 2011 and the USA was, in 2014, the world's second largest producer (Table 2). MolyCorp filed, however, for bankruptcy in late 2015 and the Mountain Pass mine was mothballed, pending financial restructuring of the company. As of 31st August 2016 Molycorp, having divested itself of the mine, became part of the Toronto listed company Neo Performance Materials. Funding was acquired for maintaining the mine in its mothballed status. South Africa was the world’s most important source of gold as recently as 2006, but was in 6th place in 2014 (BGS, 2016). The explanation is that the mines in the Witwatersrand operate at depths down to 3,900m below the surface9, in ores with lower grades than those which were accessible previously.
Several important industrial minerals occur in a range of qualities: lower-quality varieties are used in large tonnages for low-cost applications and higher-quality varieties of the same mineral are used in more limited quantities, at prices which may be orders of magnitude higher, for applications for which there are special requirements, e.g. within high-technology sectors. This applies to diamonds, graphite and quartz and, to a lesser degree, also to, e.g. kaolin and calcium carbonate. Production statistics which discriminate in relation to product prices are not easily accessible and are commonly, in the industrial minerals sector, considered to be commercially sensitive. Prices for industrial minerals are negotiated between the producer and the consumer on the basis of product quality, while for most metals the prices are those quoted on the London Metal Exchange: exceptions include iron ore, for which long-term publicly known prices are negotiated between individual companies or groups of companies and the consumer. The following factors are among the reasons for the focus on secrecy in relation to industrial minerals: • Patented process solutions based on in-house research. • Adaptation of the customer’s production routines and equipment in relation to the properties of
the industrial minerals delivered, i.e. long-term commitments from the customer to the supplier.
The European Union (EU)’s concerns in relation to long-term access to resources of these types have led to development of the EU Raw Materials initiative. This consists of three goals (shown with selected aims)10: • Fair and sustainable supply of raw materials from global markets
- Promote better political and economic cooperation and development which can contribute to securing access to raw materials
• Fostering sustainable supply within the EU - More efficient planning processes, including increased input from geological surveys to
ensure that important deposits remain (in a planning perspective) accessible for utilisation - Increased use of national geological surveys to improve the knowledge base - Increased research on exploration and extraction technology - Improved cooperation between universities, geological surveys and industry in order to
increase educational capacity and improve public awareness in relation to the mineral industry.
• Boosting recycling resource efficiency and promoting
9 http://www.mining-technology.com/projects/tautona_goldmine/ 10 https://setis.ec.europa.eu/system/files/EU-RawMaterialsInitiative.pdf
10
First % Second % Third % ∑ % EU% Norway%
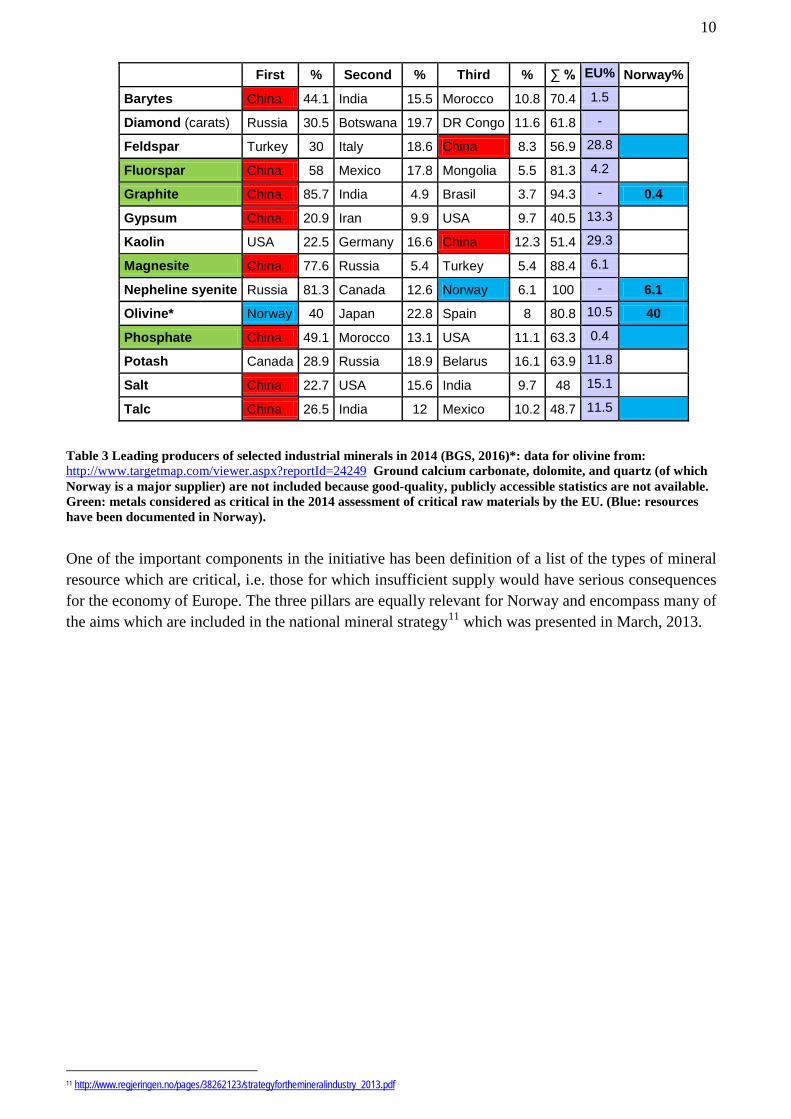
Barytes China 44.1 India 15.5 Morocco 10.8 70.4 1.5
Diamond (carats) Russia 30.5 Botswana 19.7 DR Congo 11.6 61.8 -
Feldspar Turkey 30 Italy 18.6 China 8.3 56.9 28.8
Fluorspar China 58 Mexico 17.8 Mongolia 5.5 81.3 4.2
Graphite China 85.7 India 4.9 Brasil 3.7 94.3 - 0.4
Gypsum China 20.9 Iran 9.9 USA 9.7 40.5 13.3
Kaolin USA 22.5 Germany 16.6 China 12.3 51.4 29.3
Magnesite China 77.6 Russia 5.4 Turkey 5.4 88.4 6.1
Nepheline syenite Russia 81.3 Canada 12.6 Norway 6.1 100 - 6.1
Olivine* Norway 40 Japan 22.8 Spain 8 80.8 10.5 40
Phosphate China 49.1 Morocco 13.1 USA 11.1 63.3 0.4
Potash Canada 28.9 Russia 18.9 Belarus 16.1 63.9 11.8
Salt China 22.7 USA 15.6 India 9.7 48 15.1
Talc China 26.5 India 12 Mexico 10.2 48.7 11.5
Table 3 Leading producers of selected industrial minerals in 2014 (BGS, 2016)*: data for olivine from: http://www.targetmap.com/viewer.aspx?reportId=24249 Ground calcium carbonate, dolomite, and quartz (of which Norway is a major supplier) are not included because good-quality, publicly accessible statistics are not available. Green: metals considered as critical in the 2014 assessment of critical raw materials by the EU. (Blue: resources have been documented in Norway).
One of the important components in the initiative has been definition of a list of the types of mineral resource which are critical, i.e. those for which insufficient supply would have serious consequences for the economy of Europe. The three pillars are equally relevant for Norway and encompass many of the aims which are included in the national mineral strategy11 which was presented in March, 2013.
11 http://www.regjeringen.no/pages/38262123/strategyforthemineralindustry_2013.pdf

11
3. Mineral and mineral-based industries in Norway
3.1 Primary production of mineral resources
Figure 3 Metal and industrial mineral deposits of national importance (blue – in production, red – deposits with documented importance) Metals: One iron mine is currently in production – Rana Gruber, just south of the Arctic Circle in Rana municipality. The Bjørnevatn mine in Sør-Varanger municipality, close to the border with Russia, is on care-and-maintenance following the declaration of bankruptcy of Sydvaranger Gruve AS in November, 2015. The fall in the price of iron ore fines from ca. USD 180/t in 2011 to just over USD 50/t in May, 201612 has had a dramatic impact on the viability of iron ore mines throughout the world. The Sydvaranger iron ore mine is now owned by the Tschudi Group (press release dated 7.04.16).
The Bjørnevatn deposits (iron) were discovered by the Geological Survey’s second geologist, Tellef Dahll, in 1865 and were mined from 1910 to 1997. Total production, from open pits and, later,
12 http://www.infomine.com/investment/metal-prices/iron-ore/

12
underground, was in excess of 200 Mt ore, grading ca. 30 % Fe. A new company, Sydvaranger Gruve AS reopened the mine in 2009. The rate of ore being milled in 2013 was 4.791 Mt/a13, which yielded 1.992 Mt magnetitt (Fe3O4) concentrate grading 68.15% Fe. Total reserves and resources within the concession area were defined (as of February 2014) as 466.9 Mt grading 30-31 % Fetot. The company has its own railway line from the mine to the deep-water port at Kirkenes. The mine is favourably located in relation to the North-East Passage: a shipload of concentrate for the Chinese market was transported through the North-East Passage in September 2010.
The iron ores in Dunderlandsdal in Rana municipality have been known for over 200 years, and have been exploited since 1902, sporadically up to 1937 and continually thereafter. Rana Gruber (owned by the family company, Leonhard Nilsen & Sønner) produces concentrate for production of iron and a range of special products, mainly magnetite for use in chemical applications, and other products, including pigment. Total production from 1902 is greater than 100 Mt, grading 33–37 % Fe. Production is currently ca. 3.5 Mt/a (http://hornonline.com/lns-group/ ). The current estimate of reserves and resources is about 500 Mt14. Mining activity in the municipality has been the catalyst for establishment of Mo Industripark, a technology park involving 108 companies and providing employment for 2340 persons (June, 2015)15.
Tellenes (ilmenite – FeTiO3): The Mineral Law defines minerals in relation to their density, not the application for which they are used. The ilmenite (FeTiO3) mine at Tellenes is defined as a metal mine, even though the entire production is now used to produce TiO2 pigment (”titanium white”). The mine is operated by Titania AS, part of the American company, Kronos Worldwide. This mine alone produced 6.96% of world production of titanium minerals (in terms of titanium mineral concentrate) in 2014 (see Table 2). The company has stated (2010) that the mine has proved reserves and possible resources totalling 575 Mt, making it the world’s largest known anorthosite-hosted vein-type titanium ore.
Knaben (molybdenum): Knaben Molybden has a permit allowing production of up to 50 000 t/a of ore, potentially containing 100 t molybdenite: production, since 2009, has been sporadic, never exceeding 5 t of concentrate in any given year. The area has not attracted exploration activity sufficient to document a potential for a larger-scale operation. Mining concessions have been awarded for the following deposits:
Nussir: The copper ore at Ulveryggen in Kvalsund municipality was discovered in 1900, and was mined by Folldal Verk in the periode 1972-79. Its original tonnage was calculated to be 10 Mt grading 0.72% Cu. Remaining reserves (JORC-compliant) are calculated to be 7.7 Mt grading 0.81%16. The Nussir deposit, 4 km north of Ulveryggen, was discovered in the late 1970s, and is now calculated to contain 66 Mt of JORC-compliant resources grading 1.16% Cu. 15 g/t Ag and payable contents of gold. The eastern part of the deposit is 3-5m thick and 8 km long: the current exploration programme has proved a major westwards extension, which has been proved to extend to a depth of at least 1079 m. These ore have genetic similarities to the "Kupferschiefer" ores, which are the basis for large-scale mining in Poland (Europe’s most important producer of copper).
Engebø (rutile – TiO2): The deposit is located in Naustdal municipality i Sogn-og-Fjordane county in SW Norway. The deposit contains 154 Mt grading 3.77% TiO2 which can be classified as indicated and inferred resources according to JORC standards17: further tonnages amount to ca. 75 Mt. These grades exceed those of existing heavy mineral sand producers of rutile by ca. 50%. Nordic Mining 13 http://irmau.irmau.com/publications/2013/NFE/index.html 14http://www.ranagruber.no/index.php?id=50 15 http://www.mip.no/mo-industripark 16 http://fem.lappi.fi/c/document_library/get_file?folderId=1405165&name=DLFE-20791.pdf
17http://www.nordicmining.com/getfile.php/Bilder/Operations/Engeb%C3%B8/Engeb%C3%B8%20Engelsk/Presentasjoner/Engeb%C3%B8%20project%20presentation.pdf

13
acquired, in 2015, the permits necessary for establishing a mine and for disposal of waste from production of rutile concentrate. The aim is to mine ca. 4 Mt/a, initially from an open pit (10-15 years) and thereafter underground (35-40 years). The main product, rutile, will be used for production of titanium metal and white pigment. Garnet (e.g. for use as an abrasive) will be an important biproduct: remaining waste rock has been approved by KliF for use as as surface ballast in construction projects.
Other deposits in which resources have been thoroughly documented include:
Nordli: The Nordli molybdenum deposit in Hurdal municipality is one of Europe’s largest known molybdenum deposits (there is currently no primary production of molybdenum within the EU). The deposit contains 210 Mt grading 0.09 % Mo18. Intex has an exploitation license for the deposit with 2019 as the deadline for documenting that the deposit can be economically viable.
Bidjovagge (gold-copper): The Bidjovagge deposit was mined as a copper ore in the period 1970-75 and as a gold-copper ore in the period 1985–91. Arctic Gold AB documented an indicated resource of 2.06 Mt grading 1.6 g/t gold and 1.15 % copper and an inferred resource of 0.24 Mt grading 2.6 g/t gold and 0.9 % copper19 but postponed their plans for mining after their failure to achieve the necessary agreements in negotiations held in 2012-13: an announcement from the company in 2014 suggested that they have the intention of attempting to renew negotiations20.
Bruvann (nickel-copper): The Bruvann deposit, located 40 km SW of Narvik, was mined in the period 1989 – 2002 by the company Nikkel & Olivin in which Outokumpu was involved in the later period of mining. Scandinavian Highlands held the rights to the deposit until 2013 and have also conducted further exploration along the northern margin of the host complex, the Råna layered intrusion. The remaining, documented tonnage in the Bruvann deposit (see Boyd et al., 2012) is 9.15 Mt grading 0.36% NiS, 0.09% CuS and 0.01% CoS. Espedalen (nickel-copper-cobalt): Espedalen has historic significance as a nickel ore because it was the first deposit in which the major nickel ore-mineral, pentlandite (Fe, Ni)9S8, was described (Scheerer, 1845). Blackstone Ventures held the rights to the Espedalen deposits until 2011 and reported the data shown in Table 4.
Deposit Mt Metal Content (%) Stormyra (inferred) 1,013 Ni 1,09 Cu 0,48 Co 0,04 Dalen (indicated) 4,625 Ni 0,29 Cu 0,12 Co 0,02 Dalen (inferred) 5,438 Ni 0,25 Cu 0,11 Co 0,02
Table 4 Grades in the three Espedalen deposits based on a NI 43-101 compatible assessment by Reddick Consulting (2009).
Drake Resources state that there are an additional ten deposits in the area21.
18 http://www.intexresources.com/assets/files/Reports/Arsrapport2012_Intex_Resources_ASA.pdf 19 http://feed.ne.cision.com/wpyfs/00/00/00/00/00/1E/57/72/wkr0010.pdf 20 http://www.arcticgold.se/Filer/dokument/prospekt/arcticgold_memorandum_140528.pdf 21 http://www.drakeresources.com.au/espedalenproject.html

14
Norway has a potential further deposits of the types mentioned above and for numerous types of metal in addition to those already mentioned (see Boyd et al., 2012). These include zinc, lead, beryllium, niobium, rare earths, vanadium and the “energy metals” uranium and thorium. Norwegian companies and institutions also have the technology necessary for extraction of aluminium and magnesium from “unconventional” sources, i.e. silicates.
Industrial minerals: Industrial minerals have applications based on the physical and chemical properties of the minerals in themselves or in physical combination or melts together with other minerals. A feature which is typical for many industrial minerals is that the individual minerals have a range of applications based on properties which vary with parameters such as chemical purity, crystal form and grain size. The customer’s production process will, in many applications (e.g. in paper production), be calibrated in relation to the properties of the industrial mineral being used (e. g. ground calcium carbonate or micronised kaolin or talc). Supply is therefor based on long-term contracts, and public access to knowledge of the properties of the minerals, processing technology and prices is much more limited than is the case for metals. Norway is an important supplier of industrial minerals to the European market, based on production from numerous deposits (Figure 3).
Norway produces 6-7 Mt/a of calcitic marble and limestone (calcium carbonate) and dolomite (calcium-magnesium carbonate). Norway is Europe’s most important producer of calcium carbonate for use in production of ground calcium carbonate (GCC) for use as filler in paper, most of the supply being from Brønnøy Kalk’s Akselberg deposit in Nordland County. Brønnøy Kalk is part of the Norwegian company Norsk Mineral AS: processing of the crushed marble to produce calcium carbonate slurry is carried out by Hustadmarmor, which is part of the international company Omya AG. Other important markets for calcium carbonate rocks in Norway include cement production, other types of filler (e.g. in paint and plastics), agriculture and environmental applications. Norway has very large resources of pure calcite marble in Nordland and Troms counties, in addition to those which are already in production. Dolomite is quarried at several locations in Nordland county: it is used in applications which overlap many of those described above for calcite, but not as filler in the paper industry (dolomite is harder than calcite). Dolomite has additional applications, such as manufacture of rock wool and production of fused magnesia. RHI NorMag at Herøya produced 80,000t magnesia annually (up to July, 2016) using dolomite and seawater as raw materials: production was reduced, with the closure, in August, 2016, of one of the two plants due to competition from Chinese producers. Production of quartzite and high-/ultra-pure quartz are very important in North Norway. Most of the quartzite is used in production of ferrosilicon. High-/ultra-pure quartz is based on sophisticated processing of naturally pure quartz to levels of purity which meet the requirements for a range of high-technology applications, including optical fibre22. Norsk Mineral produced high-purity quartz at its plant at Drag in Tysfjord municipality using quartz from a local deposit. The company formed a joint venture with the major French industrial mineral producer, Imerys, in 2011. Each partner owns 50% of the QuartzCorp, which, in addition to the deposit in Norway, mines quartz from deposits at Spruce Pine in North Carolina. Elkem produce quartzite for use in production of ferrosilicon alloy, at Tana in Finnmark and at Mårnes in Nordland. There is a very large deposit of a similar quality at
22 http://www.thequartzcorp.com/en/applications.html

15
Skallelv on the Varanger Peninsula in Finnmark. Elkem has assessed the large deposits of quartz at Nasafjell in Nordland in relation to requirements for special quartz glass qualities and was, in February 2016, granted permission to mine the deposits. The most important producer of flake graphite in Western Europe is Skaland Graphite (owned by Leonhard Nilsen & Sønner) who mine the Trælen deposit on the island of Senja in Troms county. Graphite has many applications in the foundry and steel industries and is used in batteries and fuel cells in electric and hybrid vehicles. Graphite has been included in the list of critical raw materials in the EU analyses from both 2010 and 2014. Graphite deposits in Vesterålen and in other parts of the country, previously investigated by the Geological Survey of Norway23, are being explored by commercial companies. Norway is also Western Europe’s sole producer of nepheline syenite, a rock which is used in the glass- and ceramics industries. Annual production from the Sibelco Nordic mine at Stjernøy in Finnmark is over 320,000t. Norway has been the world’s largest producer of olivine for many decades (generally ca. 40 % of world production): olivine is used in a range of refractory applications and as a flux in iron-ore pellets. Sibelco Nordic produced ca. 1.6 Mt/a in 2015 from its deposits at Åheim in Møre-og-Romsdal county. Production from Norway fell in the period 2006-2009 because the Swedish iron-ore company, LKAB, opened its own olivine mine at the Seqi depost on Greenland, to meet the company’s need for olivine for iron-ore pellets. However, LKAB closed the mine in 2010 and made a new agreement with Sibelco Nordic. Sibelco Nordic has recently developed a new application for olivine, as an absorbent for heavy metals and organic pollutants, and olivine is currently used to cover and secure contaminated sea beds in harbours, etc. Norway has a potential for several types of mineral in addition to the commodities in production mentioned above: Apatite: Apatite (calcium phosphate) is an important component in the manufacture of phosphate feriliser. There are important magmatic deposits in Rogaland, Vestfold, Nordland and Finnmark. Several of these deposits may become economically viable within a period of 10-20 years, especially if use of sedimentary phosphate is subject to changes in the market due to either political or environmental factors. Several of the world’s major deposits/regions of sedimentary phosphate are known to have elevated contents of cadmium24 and uranium25. A review of Norway's apatite potential is given by Ihlen et al. (2014). Fluorspar: The Lassedalen deposit in Kongsberg municipality was mined during WW II to obtain fluorspar for use in aluminium production. The deposit was investigated by Norsk Hydro in the 1970s: rights are currently held by Tertiary Minerals who state that the deposit has an inferred resource of 4 Mt containing 24.6% fluorspar. Talc: Norway has a long history of talc production and a much longer history, over 1,000 years, of use of soapstone in building and carving of household articles. Production of talc ceased in 2012. Linnajavri in Sørfold municipality in Nordland is among the largest talc deposits in Europe and several other deposits are known. 23 https://www.researchgate.net/publication/290964505_Graphite_deposits_in_Norway_a_review 24 http://meeting.helcom.fi/c/document_library/get_file?p_l_id=18975&folderId=2453916&name=DLFE-54741.pdf 25 http://pubs.acs.org/doi/pdf/10.1021/es4002357
16
Hard-rock aggregate, sand and gravel: Production of hard-rock aggregate increased by almost 100 % from 2002 to 2012, to almost 67 Mt, not least because of increased export to countries in NW Europe, which either lack resources of rock of this type, or which have long planning processes with a risk of a negative outcome. Sand and gravel are mainly used within the counties in which they are quarried.
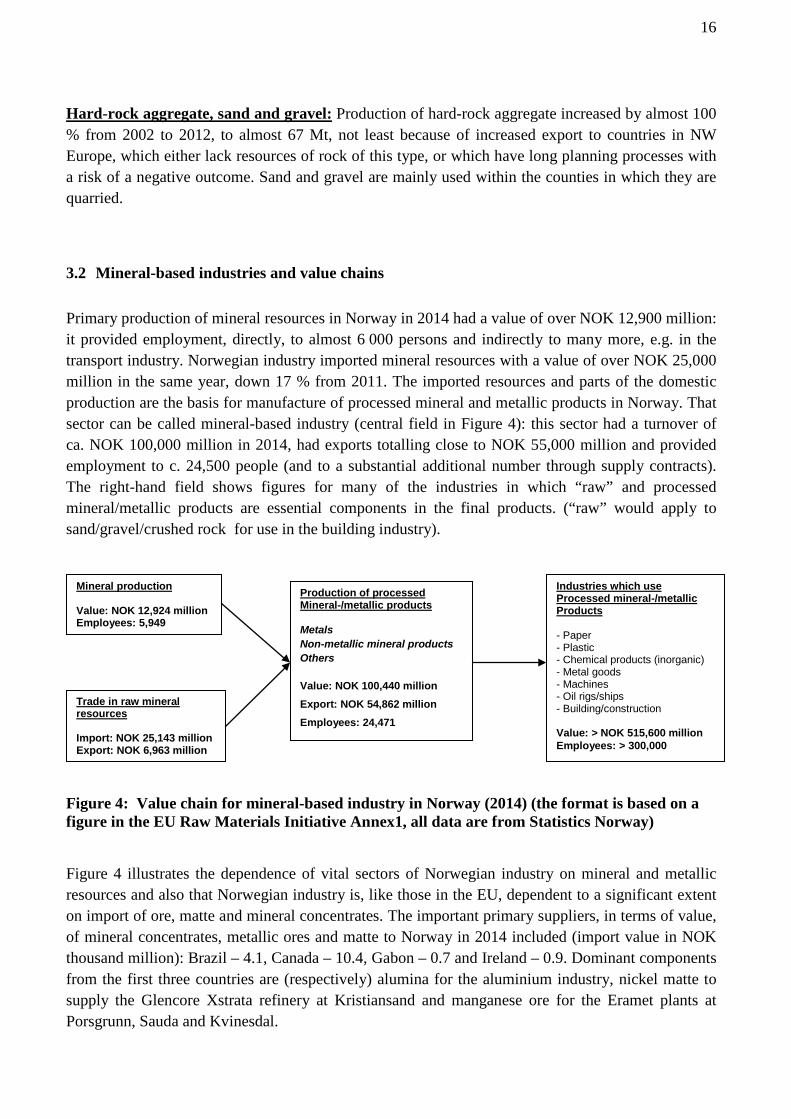
3.2 Mineral-based industries and value chains Primary production of mineral resources in Norway in 2014 had a value of over NOK 12,900 million: it provided employment, directly, to almost 6 000 persons and indirectly to many more, e.g. in the transport industry. Norwegian industry imported mineral resources with a value of over NOK 25,000 million in the same year, down 17 % from 2011. The imported resources and parts of the domestic production are the basis for manufacture of processed mineral and metallic products in Norway. That sector can be called mineral-based industry (central field in Figure 4): this sector had a turnover of ca. NOK 100,000 million in 2014, had exports totalling close to NOK 55,000 million and provided employment to c. 24,500 people (and to a substantial additional number through supply contracts). The right-hand field shows figures for many of the industries in which “raw” and processed mineral/metallic products are essential components in the final products. (“raw” would apply to sand/gravel/crushed rock for use in the building industry).
Figure 4: Value chain for mineral-based industry in Norway (2014) (the format is based on a figure in the EU Raw Materials Initiative Annex1, all data are from Statistics Norway) Figure 4 illustrates the dependence of vital sectors of Norwegian industry on mineral and metallic resources and also that Norwegian industry is, like those in the EU, dependent to a significant extent on import of ore, matte and mineral concentrates. The important primary suppliers, in terms of value, of mineral concentrates, metallic ores and matte to Norway in 2014 included (import value in NOK thousand million): Brazil – 4.1, Canada – 10.4, Gabon – 0.7 and Ireland – 0.9. Dominant components from the first three countries are (respectively) alumina for the aluminium industry, nickel matte to supply the Glencore Xstrata refinery at Kristiansand and manganese ore for the Eramet plants at Porsgrunn, Sauda and Kvinesdal.
Mineral production Value: NOK 12,924 million Employees: 5,949
Trade in raw mineral resources Import: NOK 25,143 million Export: NOK 6,963 million
Production of processed Mineral-/metallic products Metals Non-metallic mineral products Others Value: NOK 100,440 million Export: NOK 54,862 million Employees: 24,471
Industries which use Processed mineral-/metallic Products - Paper - Plastic - Chemical products (inorganic) - Metal goods - Machines - Oil rigs/ships - Building/construction Value: > NOK 515,600 million Employees: > 300,000
17
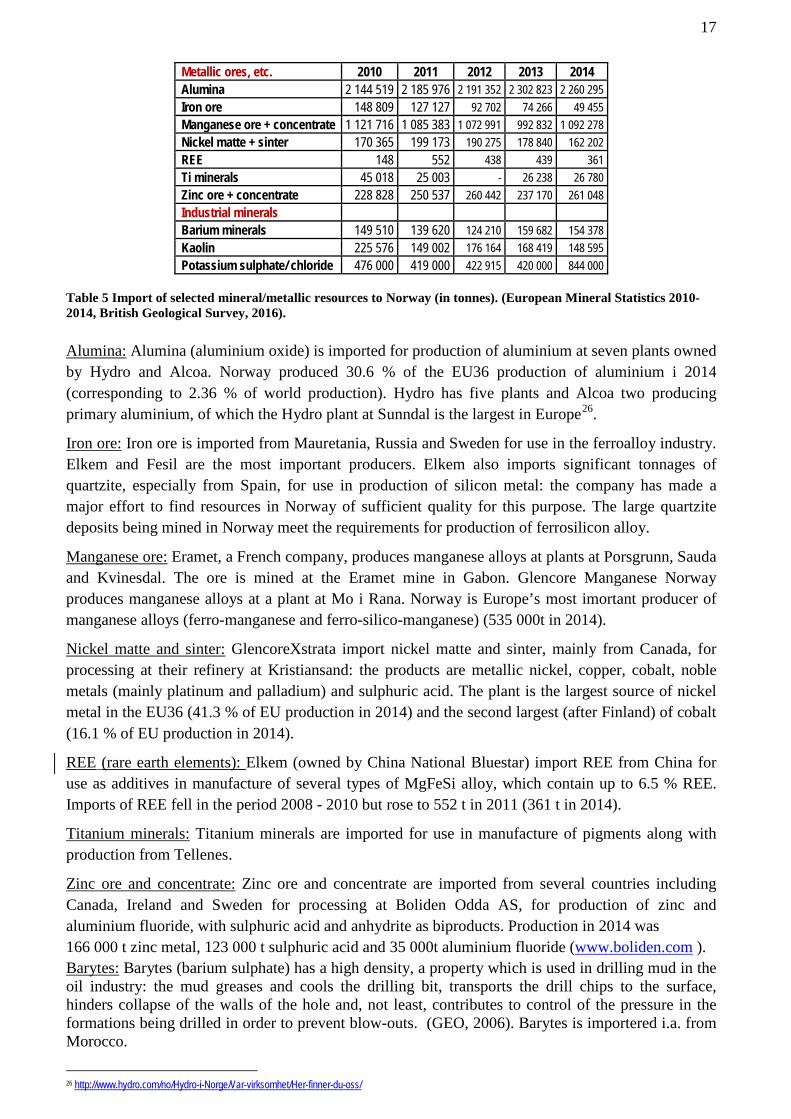
Metallic ores, etc. 2010 2011 2012 2013 2014 Alumina 2 144 519 2 185 976 2 191 352 2 302 823 2 260 295 Iron ore 148 809 127 127 92 702 74 266 49 455 Manganese ore + concentrate 1 121 716 1 085 383 1 072 991 992 832 1 092 278 Nickel matte + sinter 170 365 199 173 190 275 178 840 162 202 REE 148 552 438 439 361 Ti minerals 45 018 25 003 - 26 238 26 780 Zinc ore + concentrate 228 828 250 537 260 442 237 170 261 048 Industrial minerals Barium minerals 149 510 139 620 124 210 159 682 154 378 Kaolin 225 576 149 002 176 164 168 419 148 595 Potassium sulphate/ chloride 476 000 419 000 422 915 420 000 844 000
Table 5 Import of selected mineral/metallic resources to Norway (in tonnes). (European Mineral Statistics 2010-2014, British Geological Survey, 2016). Alumina: Alumina (aluminium oxide) is imported for production of aluminium at seven plants owned by Hydro and Alcoa. Norway produced 30.6 % of the EU36 production of aluminium i 2014 (corresponding to 2.36 % of world production). Hydro has five plants and Alcoa two producing primary aluminium, of which the Hydro plant at Sunndal is the largest in Europe26.
Iron ore: Iron ore is imported from Mauretania, Russia and Sweden for use in the ferroalloy industry. Elkem and Fesil are the most important producers. Elkem also imports significant tonnages of quartzite, especially from Spain, for use in production of silicon metal: the company has made a major effort to find resources in Norway of sufficient quality for this purpose. The large quartzite deposits being mined in Norway meet the requirements for production of ferrosilicon alloy.
Manganese ore: Eramet, a French company, produces manganese alloys at plants at Porsgrunn, Sauda and Kvinesdal. The ore is mined at the Eramet mine in Gabon. Glencore Manganese Norway produces manganese alloys at a plant at Mo i Rana. Norway is Europe’s most imortant producer of manganese alloys (ferro-manganese and ferro-silico-manganese) (535 000t in 2014).
Nickel matte and sinter: GlencoreXstrata import nickel matte and sinter, mainly from Canada, for processing at their refinery at Kristiansand: the products are metallic nickel, copper, cobalt, noble metals (mainly platinum and palladium) and sulphuric acid. The plant is the largest source of nickel metal in the EU36 (41.3 % of EU production in 2014) and the second largest (after Finland) of cobalt (16.1 % of EU production in 2014).
REE (rare earth elements): Elkem (owned by China National Bluestar) import REE from China for use as additives in manufacture of several types of MgFeSi alloy, which contain up to 6.5 % REE. Imports of REE fell in the period 2008 - 2010 but rose to 552 t in 2011 (361 t in 2014).
Titanium minerals: Titanium minerals are imported for use in manufacture of pigments along with production from Tellenes.
Zinc ore and concentrate: Zinc ore and concentrate are imported from several countries including Canada, Ireland and Sweden for processing at Boliden Odda AS, for production of zinc and aluminium fluoride, with sulphuric acid and anhydrite as biproducts. Production in 2014 was 166 000 t zinc metal, 123 000 t sulphuric acid and 35 000t aluminium fluoride (www.boliden.com ). Barytes: Barytes (barium sulphate) has a high density, a property which is used in drilling mud in the oil industry: the mud greases and cools the drilling bit, transports the drill chips to the surface, hinders collapse of the walls of the hole and, not least, contributes to control of the pressure in the formations being drilled in order to prevent blow-outs. (GEO, 2006). Barytes is importered i.a. from Morocco.
26 http://www.hydro.com/no/Hydro-i-Norge/Var-virksomhet/Her-finner-du-oss/
18
Kaolin: Kaolin is used in manufacture of paper, both as filler and coating: most of the supply comes from SW England.
Phosphate: Yara imports phosphate concentrates mainly from Morocco and Russia, for production of fertiliser.
Potassium sulphate and chloride: Yara imports potassium sulphate and chloride for production of fertiliser, i.a. from Canada.

19
4. Strategic metals/minerals
4.1 Commodities defined as critical in the DG Enterprise27 analysis of 2013-14 DG Enterprise, using a group of consultants (Fraunhofer ISI, Oakdene Hollins and Roskill) carried out, in 2013, their second analysis of the degree of criticality for European industry of a group of commodities: the footnotes28 29 show summary and complete versions of the report. The first analysis30 was completed in 2010). The commodities chosen for assessment in the second analysis were:
Aluminium Diatomite Kaolin/Clays Platinum metals31 Tantalum Antimony Feldspar Limestone Potash Tellurium Barytes Fluorspar Lithium Rare Earth Elements (heavy)32 Tin Bauxite Gallium Magnesite Rare Earth Elements (light) Titanium Bentonite Germanium Magnesium Rhenium Tungsten Beryllium Gold Manganese Scandium Vanadium Borates Graphite Molybdenum Selenium Zinc Chromium Gypsum Nickel Silica sand Cobalt Hafnium Niobium Silicon metal Copper Indium Perlite Silver Coking coal Iron Phosphate Talc
Table 6 Metallic/mineral commodities chosen for assessment of criticality in 2014. Commodities in bold font were assessed as critical and those underlined as being of high economic importance but not as critical, as of 2014 (DG Enterprise, 2014). The report (see Figure 5) focussed on: • Economic importance (EI) (see p. 21 in the report) • Supply risk (SR), including political factors relating to producing countries, the number of
producing countries, potential for substitution by other commodities and by recycling (see p. 21.
27 From 2015 DG GROW (http://ec.europa.eu/growth/index_en) is responsible for CRM analysis 28 http://ec.europa.eu/DocsRoom/documents/10010/attachments/1/translations 29 file:///C:/Users/Boyd_Ron/Downloads/Study%20on%20Critical%20Raw%20Materials%20at%20EU%20Level%20(1).pdf 30 http://ec.europa.eu/DocsRoom/documents/5662/attachments/1/translations 31 The platinum metals are: osmium, iridium, ruthenium, rhodium, platinum and palladium 32 The Rare Earth Elements (REE) are: yttrium, scandium and the lanthanides (lanthanum, cerium, praseodymium, neodymium, promethium, samarium, europium, gadolinium, terbium, dysprosium, holmium, erbium, thulium, ytterbium and lutetium)

20
Figure 5 Classification of commodities in relation to supply risk and economic importance (DG Enterprisse, 2014).
The 2013 assessment included certain additional mineral resources (relative to the first assessment), e.g. phosphate, coking coal and several biotic resources, e.g. natural rubber. It also, for one commodity, limestone, specified “high grade”, clearly implying that the assessment should not prioritize limestone for bulk applications, such as cement. The description, in this report, of the resources which were considered to be critical in the 2013 assessment (final report issued May 2014) is mainly based on the texts of the 2010 report, supplemented with new information from the 2013 report. Note that this report considers only mineral resources, excluding the biotic resources added to the EU evaluation in the 2013 assessment. A new revised report is expected in 2017. The following issues should be noted: • Reliable statistics are not readily available for several commodities, particularly industrial
minerals in general, and specifically, for industrial minerals of particular qualities.
• The classification headings used for industrial minerals in the United States Geological Survey (USGS) commodity pages encompass, in some cases, many different minerals with widely varying applications (e.g. Clays, including 15 specified types). In other cases terms which are geologically misleading and which cover a wide range of applications are used (e.g. the Mineral Yearbook for 2013 for Silica includes "industrial sand and gravel, quartz crystal, and tripoli and special silica").
• There are discrepancies for individual countries and resources between the statistics provided by the British Geological Survey, the United States Geological Survey and, as regards Norway, by Statistics Norway and the NGU/Directorate of Mining publication, Mineral Resources in 2014.
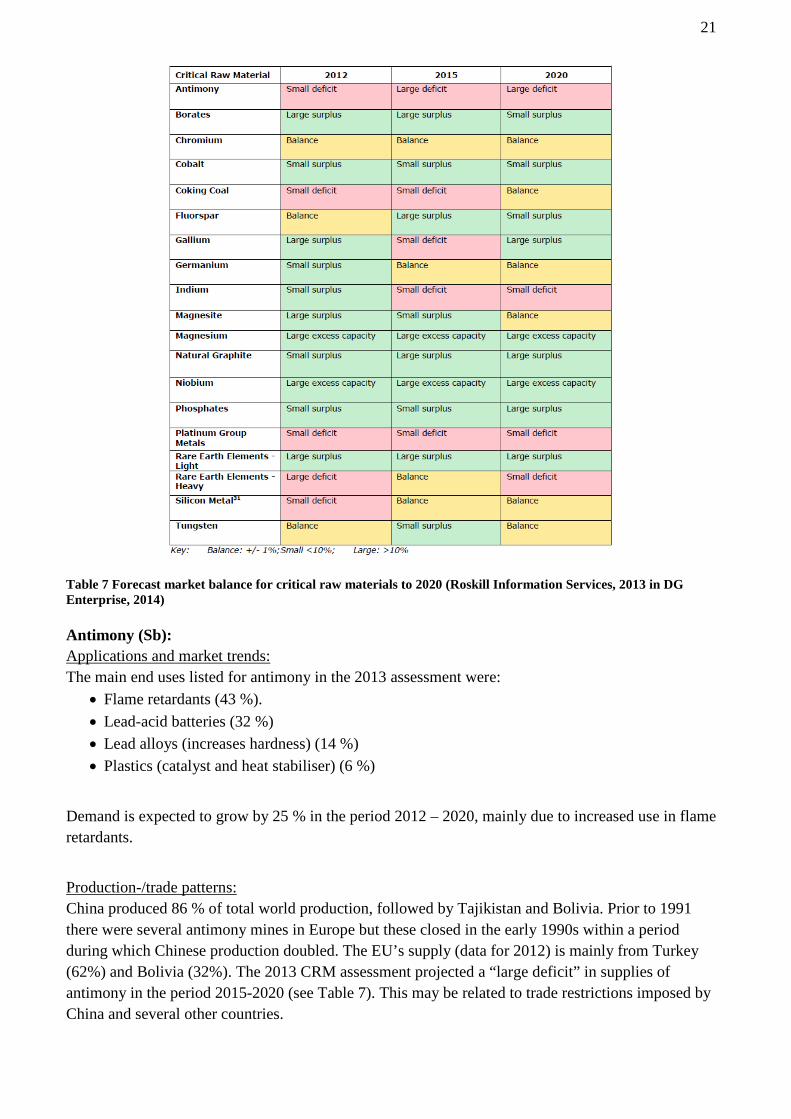
21
Table 7 Forecast market balance for critical raw materials to 2020 (Roskill Information Services, 2013 in DG Enterprise, 2014) Antimony (Sb): Applications and market trends: The main end uses listed for antimony in the 2013 assessment were:
• Flame retardants (43 %). • Lead-acid batteries (32 %) • Lead alloys (increases hardness) (14 %) • Plastics (catalyst and heat stabiliser) (6 %)
Demand is expected to grow by 25 % in the period 2012 – 2020, mainly due to increased use in flame retardants.
Production-/trade patterns: China produced 86 % of total world production, followed by Tajikistan and Bolivia. Prior to 1991 there were several antimony mines in Europe but these closed in the early 1990s within a period during which Chinese production doubled. The EU’s supply (data for 2012) is mainly from Turkey (62%) and Bolivia (32%). The 2013 CRM assessment projected a “large deficit” in supplies of antimony in the period 2015-2020 (see Table 7). This may be related to trade restrictions imposed by China and several other countries.

22
Production, potential and consumption in Norway: There is no production of antimony in Norway and no indications of economic potential for the metal. Norway’s import of antimony trioxide has fallen from 337 t in 2007 to 176 t in 2014. The imported material is thought to be used mainly as a flame retardant.
CRM assessment compared to the USA Critical Materials Strategy: Antimony is not among the metals which are considered as critical in the USA’s assessment33.
Beryllium (Be): Applications and market trends: Beryllium is very poisonous, but has mechanical and thermal properties, relative to its low density, which are superior to those of all other metals. World production in 2014 was 270 t34. Beryllum has a wide range of applications in the defence, aerospace, transport and electronics industries35. Production-/trade patterns: The USA is the world’s dominant producer, based on production from the Materion Brush mine at Spor Mountain in Utah. There is no primary production in Europe (though there are major deposits in the Ukraine). There is reason to believe that safe processing of beryllium ores requires exceedingly sophisticated technology.
Production, potential and consumption in Norway: No information has been found to indicate that beryllium metal, as such, is imported to Norway. A beryllium deposit, which may be one of the largest in W Europe, has been discovered in Norway, the Høgtuva deposit in Rana municipality. The deposit, which is also enriched in niobium, zirconium and REE, was discovered by NGU geologists in the 1980s, and was mapped and assessed as a beryllium deposit.
CRM assessment compared to the USA Critical Materials Strategy: Given that the USA is the world’s dominant producer, beryllium is not given major attention in the USA’s strategy.
Borates (B): Applications and market trends: Over 60 % of world production of boron compounds is used in various types of glass and ceramics. Boron is essential for plant growth and 11 % of production is used as an additive in fertilizers. Demand related to borosilicate glass and agriculture is projected to increase at annual rates of 11 % and 7 % respectively. Table 7 shows a projected decline in the supply/demand ratio for borates in the period to 2020.
Production-/trade patterns: Turkey is the world’s most important producer with 33.9 % of world production, followed by the USA with 25 %36. European demand is almost exclusively met by Turkey.
33 http://www.energy.gov/news/documents/criticalmaterialsstrategy.pdf 34 http://minerals.usgs.gov/minerals/pubs/commodity/beryllium/mcs-2016-beryl.pdf 35 http://beryllium.eu/about-beryllium-and-beryllium-alloys/uses-and-applications-of-beryllium/ 36 https://www.bgs.ac.uk/mineralsuk/statistics/worldStatistics.html

23
Production, potential and consumption in Norway: There is no production and no known potential for boron salts in Norway. Its use in Norway is probably mainly related to fertilizer, wood preservatives and as a flame retardant in fibre glass. CRM assessment compared to the USA Critical Materials Strategy: Neither boron nor borates were considered for assessment in the USA’s Critical Materials Strategy, neither on the 2010 nor the 2011 editions. Chromium (Cr): Applications and market trends: Chromium is a very hard metal which is used in stainless steel and in ferro-chrome alloy. Chromite (FeCr2O4) is used in refractory applications. Usage as a pigment (“chrome yellow”) is declining because of environmental concerns. World demand is forecast to increase by 4-5 % annually up to 2020 but there is no perceived threat of an imbalance between supply and demand (See Table 7). Production-/trade patterns: S. Africa and Kazakhstan are the most important producers with 47 % and 18 % respectively of world production in 2014 (BGS, 2016): both countries have very large reserves. Finland produced ca. 3.4 % of world production in 2014 from the Kemi mine. Production, potential and consumption in Norway: Chromite was produced in the 19th C from several small mines at Feragen, near Røros, for use in pigments. There are no indications that Norway has a potential for economically significant deposits of chromite. Norway imported 200 t of chromite ore and 92 t of chromium metal in 2014 (BGS, 2016). CRM assessment compared to the USA Critical Materials Strategy: Chromium was not considered for assessment in the USA’s Critical Materials Strategy, neither on the 2010 nor the 2011 editions. Japan has established a strategic stockpile for chromium and six other metals (nickel, cobalt, manganese, molybdenum, vanadium and wolfram). Cobalt (Co): Applications and market trends: Cobalt is a very hard metal with properties which give tolerance of high temperatures. Many of its industrial applications involve alloys of cobalt with other metals, but it is also used in lithium-cobalt oxide batteries, as oxide or cobalt salts in pigments and in production of catalysts used in the petrochemical and plastics industries. Production-/trade patterns: Cobalt is, with the exception of one mine in Morocco, mined as a bi-/co-product of copper from sediment-hosted copper deposits and of nickel from magmatic nickel-copper-cobalt deposits. DR Congo supplied ca. 59% of world mine production in 2014, but estimates of production from DR Congo vary and it is possible that parts of the production are exported without being registered in public statistics. Other important producers include China, Zambia, Australia and Canada. Europe’s primary (mined) production of cobalt is insignificant. The Glecore refinery in Kristiansand produced 3.9 % of world production of cobalt metal in 2014 and Finland 13.7 % (BGS, 2014a), in both cases

24
based mainly on refining of imported nickel concentrate. China’s share of world production of cobalt metal rose from 31.8 % in 2008 to 43 % in 2014 (BGS, 2014a, 2016).
Production, potential and consumption in Norway: Norway was the world’s most important producer of cobalt from 1778 to 1898, but the only primary production after closure of the mines at Modum has been as a minor biproduct from mining of nickel-copper deposits. The Modum area is considered to have a potential for cobalt but this has yet to be adequately documented. Norway is registered as having imported highly variable tonnages of cobalt (from 4t to 5090t) in the period 2010 - 2014 (BGS, 2016).
CRM assessment compared to the USA Critical Materials Strategy: Cobalt has been prioritised for assessment in the strategies of both the USA and Japan. Cobalt has a value of 2 on a scale of 1 to 4 (highest) for both supply risk and importance for clean energy in the USA’s assesssment. The measures taken by the USA include support for production of the prioritised metals (the USA has no mining of cobalt-bearing ore, nor production of cobalt metal). Japan has established a strategic stockpile for cobalt.
Coking coal: Applications and market trends: Coking coal is coal of a quality suitable for use in reduction of iron oxide in blast furnaces: it must contain low amounts of impurities, and have physical properties which facilitate “caking” by which, when heated, it becomes plastic, fusing together before resolidifying into coke particles.37 Demand is expected to increase at an annual rate of ca 6 %38.
Production-/trade patterns: European production is ca. 4 % of the world total while consumption is ca. 12 %, mainly imported from the USA and Australia. Production, potential and consumption in Norway: Store Norske Spitsbergen Kulkompani produced 1 677 000t of coal in 2014 from the Svea Nord mine on Svalbard. The new mine at Lunckefjell is on care-and maintenance because of the drop in price for coking coal. Norway imported ca. 550 000 t of coal in 2014 (excluding coal imported from Svalbard) (BGS, 2016).
Fluorpar (CaF2): Applications and market trends: World production was 6.2 Mt in 2014, of which ca. 58 % from China (BGS, 2016). 52 % of the production in 2010 was used to manufacture hydrofluoric acid, 18 % for production of aluminium fluoride used as a ”flux” in the aluminium industry and 25 % for similar use in the steel industry. Demand is anticipated to increase by 2.3 %/a up to 2020. Production-/trade patterns: World production rose from 7.2 Mt in 2010 to over 9 Mt in 2011 and 2012 before falling by over 1/3 in the following two years. EU production was 5.4 % of the world total in 2014 and net import to the EU was > 700 000t. There has apparently been no production of fluorspar in Canada in recent years
37 http://www.aspiremininglimited.com/?page=40 38 http://ec.europa.eu/DocsRoom/documents/5605/attachments/1/translations

25
but a major deposit in Newfoundland is being developed for re-opening39. It is scheduled to come into production at the end of 2017. There is no production in the USA. Production, potential and consumption in Norway: Fluorspar was mined on a small scale from the Lassedalen deposit during WW II. The deposit was assessed by Norsk Hydro in the 1970s and is currently held by Tertiary Minerals who state that it contains a JORC-standard inferred resource of 4 Mt40. Norway imports ca. 50 000t/a of fluorspar. Boliden produced 35 000 t of aluminium fluoride at the Odda Zinc smelter in 201441. Gallium (Ga): Applications and market trends:
Gallium is mainly used in the form of gallium arsenide, GaAs. In 2010 41 % of gallium was used in integrated circuits with special requirements (defence, high-performance computers and telecommunications). Other applications are in optoelectronics, especially in diodes (25 %), and in solar cells (17 %). Demand is expected to increase from ca. 350t in 2012 to > 700t by 2020, due to the expected increase demand related to light-emitting diodes and photovoltaic cells for use in generation of solar power
Production-/trade patterns: Gallium occurs as a minor constituent in ores of other metals, especially in bauxite and in zinc ores, and also in certain types of coal. Bauxite contains 30 - 80 g/t Ga and cannot thus be exploited for its gallium content alone. China, Germany, Kazakhstan and Ukraine are the main producers, with lesser amounts from S Korea, Japan and Russia, but reliable production figures are not available for all these countries. Certain types of coal are enriched in gallium (and germanium): research on extraction of gallium from fly ash produced by combustion of these coals has been conducted in several countries. Production, potential and consumption in Norway: There is no production of gallium in Norway and no data indicating imports. It is probable that one or more of the base-metal mineralizations in Norway is enriched in gallium but there is, as yet, no systematic data on this topic. An analysis of concentrate from the Nussir copper mineralization shows 22.8 g/t Ga42. CRM assessment compared to the USA Critical Materials Strategy:
Gallium is considered as critical in the strategies of both the USA and Japan. Gallium is assigned a value of 1 on a scale from 1 to 4 for supply risk and a value of 3 on a scale from 1 to 4 for importance for clean energy in the USA’s assessment. The steps suggested include various forms of public support for establishment and security of production of metals which would otherwise have to be imported from one of a small number of potential suppliers.
39 http://www.canadafluorspar.com/ 40 http://www.tertiaryminerals.com/lassedalen-fluorspar-project.html 41 http://ir.boliden.com/afw/files/press/boliden/Boliden_ar14_2015-03-10_ENG.pdf 42 http://www.nussir.no/investor3.pdf

26
Germanium (Ge): Applications and market trends: Germanium is used in fibre optics (30 %), infra-red optics (25 %), polymerising catalysts (25 %) and in electrical and solar cell applications. Demand is forecast to grow at 4.4 %/a. 30 % of Ge production comes from recycled new scrap. Production-/trade patterns: As for gallium, germanium is produced from ores which are being exploited for a major, base-metal product, in this case, zinc: germanium is extracted at the stage of refining of the zinc. 59 % of world production of germanium metal in 2011 was from China. Small amounts are produced in several European countries. Certain coals are known to be enriched in germanium and coal has been used as a source of germanium in Russia and China.
Production, potential and consumption in Norway:
There is no production of germanium in Norway and no data indicating imports. It is probable that one or more of the base-metal mineralizations in Norway is enriched in germanium but there is, as yet, no systematic data on this topic.
CRM assessment compared to the USA Critical Materials Strategy: Germanium is not considered as critical in the strategies of the USA or Japan Graphite: Applications and market trends: Graphite is pure carbon, forming aggregates of small grains, well-formed crystals and flakes. It has special properties – it is soft, has high electric and thermal conductivities and retains these properties at high temperatures. Over 40 % of current applications depend on the last property. There are numerous additional applications and a major increase in demand is projected, in relation to use of graphite in fuell cells and in batteries in hybrid and electric cars. Production-/trade patterns: Over 85 % of global production is from China. The EU countries consume ca. 13 % of world production (2012 data). 1.8 % of world production in 2014 was mined within the EU36 (mainly in Norway) (BGS, 2016). Production, potential and consumption in Norway: Production from Skaland Grafitt (Leonhard Nilsen og Sønner) on Senja in Troms county represented 89 % of production in the EU35 in 2014. Proved reserves in the Trælen deposit are 1.8 Mt. Recently reported geophysical data indicate further potential on Senja. In 2012 Norwegian Graphite acquired the mining rights to the area surrounding the old Jennestad graphite mine on Langøya in N Norway. Norwegian Graphite, following ground geophysics and drilling, were able to double the indicated resources of graphite in this area, to 3.66 Mt43.
CRM assessment compared to the USA Critical Materials Strategy: The USA’s strategy and Japan’s focus exclusively on metals. 43 Norwegian graphite liquidated in 2016.
27
Indium (In): Applications and market trends: Indium is a heavy metal which is ductile, malleable and softer than lead. Its most common occurrence is as a trace metal in sphalerite ((Zn,Fe)S) and it is mainly produced from zinc concentrates. Indium is also recovered from certain copper, tin and silver ores. Indium-tin oxide thin film is the only material that is both transparent and electrical conductive, 56 % of world production is used in flat screens, with a further 10 % in various optical applications. Electronic applications and alloys with other metals are also important applications. Consumption related to the flat-screen market is expected to inrease at 5.5 % /a up to 2020. Another application with increasing demand is use of copper-indium selenide in solar cells. Production-/trade patterns: China produced 57 % of world production in 2014. Belgium produced 4.1 % of world production and a further five EU countries approximately a further 4 %. Several countries, e.g. China, have restrictions on export of indium. World production was 733t in 2014 (BGS, 2016). EU countries import ca. 9 % of world production, mainly from China. Production, potential and consumption in Norway: The indium content of zinc ores varies from <1 g/t to >100 g/t. Several of the lead-zinc mineralizations in Norway contain sphalerite with indium concentrations in the range 50 – 130 ppm (Lockington et al., 2014). Boliden Odda processes zinc concentrate from Ireland and Sweden, but the Boliden web page gives no indication that indium is one of the products. Haakana et al. (2008), however, indicate that the process used at the Odda plant allows recovery of indium.
CRM assessment compared with the USA's Critical Materials Strategy: Indium is prioritised in both the American and Japanese assessments though with some uncertainty as to whether demand will reach levels which would be problematic. The solution, in that event, is said to be in development of the processes used in zinc smelters.
Magnesium (Mg): Applications and market trends:
Magnesium is a light metal which can be extracted from a number of minerals, several of which are readily accessible in large deposits in many countries: 40% of European consumption is in magnesium-aluminium alloys but it is also used in other, more complex alloys requiring high strength and light weight. Production-/trade patterns: China produced 86 % of world primary production of magnesium metal in 2014 (BGS, 2016) and there was no production within the EU36. Imports to Europe are mainly from China, which has, like Russia and S. Africa restrictions on export of magnesium.
Production, potential and consumption in Norway: Norway was one of the world's most important producers of magnesium metal from 1951 to 2001. Production was terminated in 2002 due to market developments, not least competition from China. The raw materials used were dolomite (calcium-magnesium carbonate) and seawater. A new company, RHI NorMag AS, established production of fused magnesia (MgO) at Herøya in 2014 but production was reduced in July, 2016 due to the availability of lower-cost raw materials from China.

28
CRM assessment compared with the USA's Critical Materials Strategy: Magnesium is not among the metals considered to be critical in the American and Japanese assessments.
Niobium (Nb): Applications and market trends: Niobium is used almost exclusively in high-strength alloys, especially ferroniobium, in applications in which the strength of the alloy has to be maintained at high temperatures. A small proportion (ca. 6 %) is used in other forms, in high-technology applications. Demand is expected to increase in several sectors with specific requirements, e.g. in drilling equipment and jet engines. Production-/trade patterns: Niobium (called columbium prior to 1949) occurs almost exclusively in minerals which also contain tantalum (coltan is a mixture of the minerals columbite and tantalite). Brazil supplied 94 % of world production in 2014 (BGS, 2016) with Canada, Rwanda and DR Congo supplying most of the remaining 6 %. Production, potential and consumption in Norway: Niobium ore was mined at Søve in the Fen carbonatite in Nome municipality in Telemark county in the period 1953-63 and 350-400t (15-20 % of world production) was produced annually by Norsk Hydro at Herøya. It is very probable that there are still significant resources of niobium (and other special metals) in the Fen area, but documentation of the tonnage, grades and mineralogy at depth is not available. The other special metals include rare earths, uranium and, not least, thorium. The Sæteråsen deposit in Larvik municipality44 is better documented: "A rough estimate of the possible ore reserves at Sæteråsen based on analysis of four diamond drillholes yields a total tonnage of ca. 8 Mt containing 0.245% Nb, 0.18% Ce, 0.11% La, 0,075% Y, 0,069% Nd og 0,049% Th. The possibilities for finding similar deposits in the Vestfold Lava Plateau are good.” No information is available on current consumption of niobium, as such, in Norway though it is inevitable that Norway is an indirect consumer of niobium, in the form of components in, e.g. electronic equipment, cellphones and jet engines.
CRM assessment compared to the USA Critical Materials Strategy: Niobium has not been prioritised in the American assessment. The market is being monitored as part of the Japanese strategy but niobium is not one of the metals for which Japan has planned to build a strategic stockpile.
Phosphate: Applications and market trends: Phosphate rock/minerals were not considered for criticality analysis in the 2010 CRM, despite being the most important raw material for mineral-based fertilisers. Production-/trade patterns: World production of phosphate rock rose from 133 Mt in 2000 to 245 Mt in 2014 (BGS, 2005, 2016), of which, in 2014, 49 % was from China. 77 % of the world's documented reserves of sedimentary phosphate rock are in Morocco and West Sahara, 5.7 % are in China and 3.4 % in Algeria (USGS, 2011). The calcium phosphate mineral, apatite, which occurs in igneous rocks, is an alternative
44 Ihlen P. M., 1983: Geologiske og petrokjemiske resultater fra diamantboring på Sæteråsen niob-forekomst. NGU-rapport; No.1800/76B; 39 sider

29
source. Finland is the only EU36 country in which there is production of apatite (close to 1 Mt in 2014 from the Yara Suomi plant at Siilinjärvi). Europe, not including Norway, imported ca. 6.5 Mt of phosphate rock in 2011 (BGS, 2016). Statistics for import of phosphate to Norway in later years are not readily available.
Production and potential in Norway: Yara is the world's largest producer of mineral-based fertiliser, with 12,883 employees (end of 2015) and plant or offices in 60 countries. Yara has production plants at Porsgrunn and Glomfjord, one in Sweden and three in Finland. Yara produces a wide range of fertiliser types including phosphate-based fertiliser. Several of the apatite deposits in Norway may have economic potential in the future (Ihlen et al 2014): several of these are free of radionuclides and other heavy metals, and extraction will therefore not result in the contaminated and problematic waste generated by phosphate mining in North Africa. Platinum metals: Applications and market trends: The platinum metals are osmium (Os), iridium (Ir), ruthenium (Ru), rhodium (Rh), platinum (Pt) and palladium (Pd). Platinum, palladium and rhodium are used in catalysers in motor vehicles (53 % of the market for PGE). 20 % are used in jewellery and the remaining 27 % in numerous applications, including elektronics, catalysers in oil refineries, etc. It is anticipated that there will be a steady increase in demand (4-5%/a) for platinum, palladium and rhodium in connection with their use in motor vehicle catalytic converters and a major increase in demand for platinum for use in fuel cells. Detmand for for ruthenium is expected to increase due to its use in nickel super-alloys used in the turbine blades of jet engines.
Production-/trade patterns: South Africa has the world's largest resources of platinum metals and is also the largest producer of platinum (64 % of world production in 2014) and the second largest source of palladium (31.9 %) (BGS, 2016). The PGE resources in South Africa, in the Bushveld Complex, are approximately five times larger than those of the world's second largest source, the Noril'sk-Talnakh province in Siberia, which is the world's largest producer of palladium (44% of world production in 2014) (BGS, 2016). Platinum metal deposits are known in all the continents, including Europe and there are important deposits in Canada, Finland, the USA, Zimbabwe and China. The major deposits in South-Africa, the USA and Zimbabwe have PGE as the dominant metals in terms of value: the major deposits in Russia, Canada and China are nickel-copper ores which, in part, contain high grades of PGE, especially those in Siberia.
Production, potential and consumption in Norway: Norway exports 9-14t PGE annually (BGS, 2016), most probably produced as a biproduct of nickel refining at the Glencore plant in Kristiansand. There is a potential for nickel-copper-PGM mineralisation in parts of Finnmark. (Several deposits, of various types are known from the northern parts of Finland (Eloranta et al. , 2016).
CRM assessment compared with the USA's Critical Materials Strategy: PGE are not prioritised in the American strategy. The platinum market is monitored as a part of the Japanese strategy but platinum is not among the metals for which Japan has established a strategic stockpile. American production of PGE in 2015 was 3.7 t of platinum and 12.5 t of palladium from
30
the Stillwater mine in Montana (USGS, 2016). The USA has further potential for PGE in deposits in the Duluth Complex in Minnesota (Mudd, 2012).
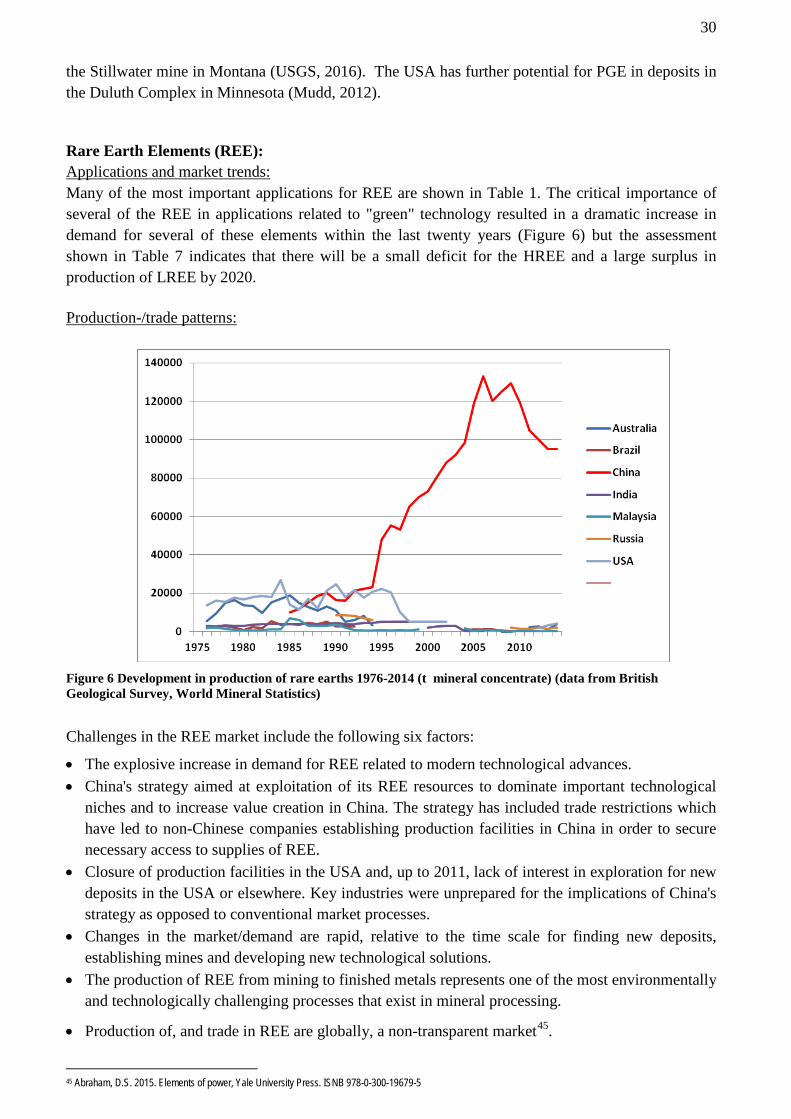
Rare Earth Elements (REE): Applications and market trends: Many of the most important applications for REE are shown in Table 1. The critical importance of several of the REE in applications related to "green" technology resulted in a dramatic increase in demand for several of these elements within the last twenty years (Figure 6) but the assessment shown in Table 7 indicates that there will be a small deficit for the HREE and a large surplus in production of LREE by 2020. Production-/trade patterns:
Figure 6 Development in production of rare earths 1976-2014 (t mineral concentrate) (data from British Geological Survey, World Mineral Statistics)
Challenges in the REE market include the following six factors:
• The explosive increase in demand for REE related to modern technological advances. • China's strategy aimed at exploitation of its REE resources to dominate important technological
niches and to increase value creation in China. The strategy has included trade restrictions which have led to non-Chinese companies establishing production facilities in China in order to secure necessary access to supplies of REE.
• Closure of production facilities in the USA and, up to 2011, lack of interest in exploration for new deposits in the USA or elsewhere. Key industries were unprepared for the implications of China's strategy as opposed to conventional market processes.
• Changes in the market/demand are rapid, relative to the time scale for finding new deposits, establishing mines and developing new technological solutions.
• The production of REE from mining to finished metals represents one of the most environmentally and technologically challenging processes that exist in mineral processing.
• Production of, and trade in REE are globally, a non-transparent market45.
45 Abraham, D.S. 2015. Elements of power, Yale University Press. ISNB 978-0-300-19679-5
31
Production, potential and consumption in Norway: Several Norwegian companies have expertise related to REE. Enrichment of parts of the Fen carbonatite in REE has been the starting point in some cases (see the text on niobium). A rough estimate of 200 Mt as the minimum tonnage of REE-rich, thorium-poor resources in the Fen carbonate has been given by Dahlgren (2015) making Fen one of the most important REE-resources in Europe. • Norsk Hydro carried out tests on extraction of REE from apatite concentrate at Glomfjord in the
mid-1990s, but terminated the tests due to negative consequences for the apatite concentrate, which was the main product. Yara Suomi has held the mining rights to the major Sokli apatite deposit in N. Finland, parts of which are enriched in niobium and REE, but Yara Suomi suspended this project in 2015.
• The Norwegian company, Elkem, imported up to ca. 0.65 % of world production of REE (= max. ca. 700t) for a period of several years up to 2007: the REE were used as an additive in certain alloys. Elkem is now part of the China Bluestar National. The company may still have a similar consumption of REE, but distributed on several countries. Norway's import of REE in 2014 was 361 t (BGS, 2016).
• REEtec a company within the Scatec concern, has developed a new and eco-friendly separation technology46 and is, according to their web site, currently producing and selling REE in the form of nitrates and oxides.
Norway may, dependent on choice of technology, have future needs for REE much greater than those of Elkem. Neodymium is a key constituent in the supermagnets used in modern wind-power generation. The most effective magnets (which are also used in Prius motors) consist of an alloy of iron, boron and neodymium, normally containing ca. 29 % neodymium. The wind turbines require ca. 200 kg Nd/MW (https://en.wikipedia.org/wiki/Neodymium_magnet ). The materials needed in winpower technology are described by Elshkaki and Graedel (2014)47.
The Fen and Sæteråsen deposits have already been mentioned (in relation to niobium) as potential sources for REE. Norway has a potential for further deposits but none that are known to have an economic potential.
CRM assessment compared with the USA's Critical Materials Strategy: Eight of the raw materials subject to detailed analysis in the USA's strategy are REE. • Lanthanum, cerium, praseodymium and neodymium due to their use in batteries for electric
vehicles. • Neodymium, praseodymium and dysprosium due to their use in supermagnets in electric vehicles
and wind turbines (and samarium in other types of supermagnet). • Lanthanum, cerium, europium, terbium and yttrium which are used in phosphors in energy-
effective lighting.
The REE market is monitored as part of Japan's CRM strategy.
46 http://reetec.no 47 http://dx.doi.org/10.1016/j.apenergy.2014.09.064
32
Tungsten (W):
Applications and market trends: Tungsten has special properties, i.a. a very high melting point and a density 71 % greater than that of lead. 60 % of the production is used as wolfram carbide and 23 % in special alloys. The remaining 17 % is used in metallic form in electronic applications and in chemical compounds in catalysis, pigments and high-temperature lubricants. 35-40 % of the demand is met by recirculation. Tungsten can be replaced by other metals in various applications but some of the possible replacements are associated with problems (e.g. depleted uranium). Molybdenum can replace tungsten steel in several applications. Production-/trade patterns: China produced ca. 78 % of world production in 2014 (BGS, 2016), with Russia (9.5%) and Canada (3.5%) as the second and third largest producer. China has export restrictions for wolfram and also a two-level price mechanism which acts as an incentive for investment in China (as for REE). China also has restrictions on export of wolfram scrap. Production, potential and consumption in Norway: Wolfram mineralisations are known in Norway but none of these have been shown to have concentrations which are close to being of economic interest. Available statistics do not show any significant import of tungsten metal to Norway.
CRM assessment compared with the USA's Critical Materials Strategy: Wolfram is not prioritised in the USA's strategy, but Japan has a strategic stockpile of wolfram.
4.2 The CRM analysis of 2016-17: methods and progress DG Grow and the EU commission (EC) have decided that a CRM analysis should be conducted at intervals of two-three years (including a year for preparation). Work with the third CRM study began in January 2016. Deloitte Sustainability, with the British Geological Survey (BGS), Bureau de Recherches Géologiques et Minières (BRGM) and the Netherlands Organisation for Applied Scientific Research (TNO) are the partners chosen to compile the next CRM analysis which should be completed in the first quarter of 2017. The first and second criticality assessments, completed in 2010 and 2014 respectively, used the same methodology, which was developed by the European Commission in cooperation with the Ad Hoc Working Group on Criticality (AHWG) (sub-group of experts to the Raw Materials Supply Group (RMSG)48, including the same indicators. Updated data were used and a wider range of materials was assessed in the second criticality study. The criticality assessments under the current study are based on a revised criticality assessment methodology developed by the Joint Research Centre, in cooperation with the European Commission and the AHWG. A larger number of materials are being assessed (approximately nine additional materials relative to those covered in the 2014 study). The most important differences in the 2017 study compared to the two previous studies are:
• The criticality of the REE is to be assessed individually and not grouped into LREE and HREE 48 H. Gautneb is Norway's representative of AWHG and RSMG

33
• The new materials to be assessed include: bismuth, helium, sulphur, natural cork, sapele wood and natural teak wood.
There are also major changes in the methodology used. As in the previous CRM studies, two main parameters - Economic Importance (EI) and Supply Risk (SR) are used to determine the criticality of the material. However in the 2017 criticality methodology, substitution is incorporated as a factor in both the supply risk and economic importance indicators, whereas in the previous assessments, substitution was only addressed within the analysis of the supply risk. Substitution is considered to alter the potential consequences of a supply shortage for the European economy and is therefore integrated into the economic importance dimension. In the 2017 assessment a somewhat different approach for calculating economical importance is used. The revised criticality methodology also recommends a more detailed and precise allocation of raw material uses to their corresponding NACE49 sectors (using both a 4 digit level (ideally) but accepting a 2 digit level when appropriate). It is expected that the new CRM analysis will change and reduce the number of critical materials (compared to the 2014 study) when calculating new values for EI and SR, and changing the thresholds for criticality, which were 5 for EI and 1 for SR in the 2014 study (see Fig. 5). At the time of writing this report the main outline and first results of the new CRM assessment have been presented to the AHWG. The results will be confidential until the final report is completed and approved. 4.3 Resources which are not considered to be critical under current market conditions but
which are important for Norwegian industry Norway has resources of interest in several of the other metals/minerals which have been considered in the CRM analysis (see Figure 5). These are:
Iron (Fe): See the descriptions relating to the deposits at Bjørnevatn and in Rana in sub-chapter 3.1. There is a potential for additional deposits in the southern part of Troms county. Sweden produced 62.9 % of the iron ore mined in the EU36 in 2014 and Norway 18.5 % (BGS, 2016). Production in the EU36 was, however, only 1,7% of world production. Norway is Europe's (EU36) most important producer of ferro-alloys (ferro-manganese/silico-manganese/silicon) (727 000t in 2014), 65 % more than the second largest producer (Finland) (ferro-chrome). Russia and Ukraine have a much larger production than Norway.
Copper (Cu/Cu-Au): See the descriptions in sub-chapter 3.1. Norway has, in addition to Nussir and Bidjovagge, a potential for additional Cu-bearing resources in several deposits which have been mined in the past. Prospecting companies have shown an interest in several of these deposits, especially with a view to use of modern exploration methods to search for deeper-seated ores. Several of these deposits also have a potential for zinc.
Molybdenum (Mo): See the texts relating to the Nordli and Knaben deposits in sub-chapter 3.1.
Nickel (Ni): Reserves and resources have been documented in several deposits in Norway. The Bruvann deposit in Ballangen municipality 40 km SW of Narvik, was mined for nickel and copper from 1989 to 2002 when it was closed because of a fall in metal prices. Remaining, documented mineralisation has been calculated to be 9.15 Mt with 0.36 % Ni (cut-off – 0.30 % Ni) or 5.5 Mt with 0.39 % Ni (cut-off- 0.35 % Ni). Other deposits, in Finnmark and Oppland, may, with additional drilling and favourable metal price levels, prove to be of economic interest in the future. 49 NACE = Nomenclature of Economic Activities – a European code for classification of these
34
Zinc (Zn): There are metallogenic provinces in both the Mofjell area in the SE part of Rana municipality and in Hattfjelldal which contain several zinc-lead-copper mineralisations with variable contents of silver and gold. In both areas there are abandoned mines in which remaining ore has grades which could be attractive, depending on prices levels.
Titanium minerals (Ti): See the texts relating to the Tellenes mine and the Engebø project in sub-chapter 3.1. Both deposits are world class (Tellenes produced 7.4% of world ilmenite production in 2014). An additional deposit, Bjerkreim-Sokndal, in Rogaland county contains three zones with 12-15 % ilmenite, 7-10 % vanadiferous magnetite and 8-10 % apatite. These horizons have a tonnage of 282 Mt down to a depth of -100 m. The combination of these minerals is, at least in theory, attractive. Norway is the sole producer of titanium minerals in the EU36: Ukraine is the only other producer in Europe.
Feldspar (and nepheline): See the text relating to nepheline production on Stjernøy in sub-chapter 3.1. Norway is one of only three countries in the world in which nepheline is produced (the others are Russia and Canada). Feldspar of certain types has similar applications. Norway had production of feldspar 76 tons of feldspar in 2015.
Limestone/calcite marble (”limestone” i Figure 5): Norway is thought to be the world's (and certainly Europe's) most important producer of calcium carbonate slurry for use in the paper industry (minerals constitute ca. 30 % of normal paper). See the text relating to Brønnøy Kalk in sub-chapter 3.1. Norway supplied 41.4 % of Europe's imports of grund calcium carbonate in 201150. There is a serious weakness in statistics for production and trade in limestone/ground marble (and for other industrial minerals) in that the data do not distinguish between different qualities (e.g. between quite impure limestone/marble which can be used in cement production and ground pure calcium carbonate marble which can be used as ”coating” in production of high quality paper.
Silica (quartz): See the text relating to production of quartz in sub-chapter 3.1. Weaknesses in available statistics are even more serious for quartz than for limestone/marble, because pure and ultra-pure quartz is used in numerous high-technology applications. Certin of these have requirements for 99.99 % purity and specific requirements as to maximum contents of trace metals <1 ppm.
Talc: Talc has probably been included in the CRM assessments because China is the world's largest producer (27.5 % in 2014) and because 42 % of the EU's import of talc was, in 2010, from China (though Finland, France, Italy and Austria are major producers, with a combined production greatly exceeding EU demand): these figures could well be explained by the need to match the quality of the mineral product to the requirements of specific applications. Production of talc in Norway fell dramatically in the period 2008 to 2012 and stopped in 2013. Numerous talc deposits are known, the largest of which, Linnajavri, is mentioned in sub-chapter 3.1.
4.3 Strategies: the EU Raw Materials Initiative The EU Commission launched, in February 2011, a new edition of its strategy for ”non-energy” raw materials, including minerals and metals51. The strategy was based on a model which was proposed first in 2008, but which was now revised to encompass three focus areas: • Open trade in mineral-/metallic resources including access to resources in ”third” countries. The
goal of this measure is China's development of national-level agreements, with budgets of up to
50 file:///C:/Users/Boyd_Ron/Downloads/Study%20on%20Critical%20Raw%20Materials%20at%20EU%20Level%20(1).pdf
51 http://ec.europa.eu/growth/tools-databases/newsroom/cf/itemdetail.cfm?item_type=251&lang=en&item_id=4874

35
several billion euros, with several African countries – with repayment in the form of mineral resources. The measure includes negotiations within both the WTO and the OECD and the development of aid projects focussing on development of the management infrastructure for resources in partner countries in Africa.
• Increased access to resources in Europe. • Increased re-use and re-cycling. The strategy includes, i.a., focus on research and stimulation of industry involvement. Several of the components were to be merged in an EIP (”European Innovation Partnership”). These included:
- Innovation throughout the mineral value chain - Substitution for critical raw materials - Better knowledge of the mineral potential within Europe - Better management systems throughout the mineral value chain, including recirculation. - International cooperation within research, trade. Environmental aspects and development
projects. - It was specified that exploitation of resources could be permitted in or close to Natura 2000
areas. It is generally acknowledged that the Nordic countries have a great potential for further development, even though they are already important suppliers of mineral resources. This has been confirmed by the recent opening of new mines in Finland and Sweden.
4.3.1 Strategies in the Nordic countries Finland: Finland's mineral strategy52 was published in October 2010 (the web page gives editions in both Swedish and English). Finland has, for many years, given a high priority to the mining industry. The basis for development of new mines which are now in production lay in many years of intensive work by the Geological Survey of Finland (GTK) and the state-owned company Outokumpu. (Outokumpu withdrew from almost all mining activities in 2002-2003, a period in which all metal prices were at a very low level). The Finnish Mineral Strategy defined 15 challenges and 12 measures to be taken. The challenges were: • Greater volatility in the demand for mineral resources. • Deposits are of lower grade, or are located at greater depth. • Decline in availability of aggregates in proximity to locations of greatest use. • Extractive operations are limited by competing forms of land use and access. • Permitting procedures become more complex, and processes become longer. • Increasingly difficult to recruit expert consultants and skilled labour. • New exploration and beneficiation technologies must be developed. • Water and energy consumption must be decreased. • Emissions and waste need to be minimised. • Utilisation of by-products and replacement materials must be enhanced. • Automation in the mining industry must be encouraged. • Health and safety issues and workplace atmosphere must be improved. • Use of rehabilitated sites after mine closure needs to be promoted. • The general acceptability and perception of the industry must be improved. • Finnish ownership must be increased.
52 http://www.mineraalistrategia.fi/
36
The measures to be taken were divided into four areas (selected text shown below): • Strengthening minerals policy:
- The significance, growth potential and risks pertaining to the minerals sector should be recognized by the Finnish government and actively included within government policy programmes and parliamentary policy agenda. Minerals policy objectives are to be clearly defined and a stable, competitive operating environment is to be secured for the sector. The Ministry of Employment and the Economy strengthens its role as a key facilitator for the minerals sector. An expert working group is appointed to develop policy alternatives and to monitor implementation of the objectives. (TEM)
- Finland assumes a visible role in implementing the objectives of the EU’s Raw Material Initiative and in establishing a minerals policy in cooperation with Sweden and other mining countries in the EU area.
- Improve the minerals sector’s financing opportunities and increase Finnish ownership. - Investigate the potential of using tax incentives to promote exploration for natural resources and for
efficient use of resources. Establish whether state ownership is appropriate and beneficial with respect to sustainable and efficient utilisation of mineral resources.
• Securing the supply of raw materials - Compilation, interpretation and distribution of diverse geoscientific and environmental data are further
enhanced, in order to promote sustainable utilisation of mineral resources and maintain their supply security.
- Permit processing times are significantly reduced and permitting procedures are refined. - The supply and sustainable utilisation of mineral resources are regarded as integral to land use
planning. • Reducing the environment impact of the minerals sector and increasing its productivity
- The material and energy efficiency of machinery, equipment and processing technologies within the minerals sector are further improved. Incentives are created for the recycling and re-use of stockpiled waste materials, tailings, mineral products and earth materials associated with construction industries.
- Green economy business is promoted through cooperation between the SME sector and research institutes
- Establish mechanisms that promote cooperation between local residents, companies and the regulatory authorities to ensure sustainable well-being of individuals and communities throughout the entire life-cycle of mining activity.
• Strengthening R&D operations and expertise - Establish a research programme under the Finnish Funding Agency for Technology and Innovation
(Tekes), aimed at developing innovative solutions, products and services in all areas of the mineral utilisation chain.
- Account for the minerals sector in the education administration’s long-term planning, and the significance of metals, minerals and rock materials in everyday life is emphasised as part of environmental education at different educational levels.
Sweden: Sweden's Minerals Strategy53 was published in 2013. It defines strategic objectives under several headings, each including defined goals and measures aimed at achieving these: • A mining and minerals industry in harmony with the environment, cultural values and other
business activities. 1. Greater resource efficiency
Measures: 1. Survey and analysis of the extraction and recycling potential of Swedish metal and mineral assets
(SGU, EPA). 2. System for reporting shot rock production data (SGU, EPA, Transport Agency, Boverket).
53 http://www.government.se/reports/2013/06/swedens-minerals-strategy-for-sustainable-use-of-swedens-mineral-resources-that-creates-growth-throughout-the-country/

37
2. Better dialogue and synergy with other industries Measures:
3. Manual for consultation between the reindeer and mining industries during permitting processes (Norrbotten CAB).
3. Mining communities with attractive natural and cultural environments Measures:
4. Develop, compile and disseminate examples of how the cultural environment in Bergslagen can be utilised by the mining and tourist industries (Heritage Board)
• Dialogue and cooperation to promote innovation and growth.
4. Promotion of societal development and regional growth Measures:
5. Programme for exchange of knowledge and experience and coordination when new large-scale mines are being established (TVV).
6. Manual for municipalities where mines are to be established (TVV, EPA). 7. Review of obstacles preventing an increase in housing production to meet the expansion of the
mining industry (Boverket). 8. Methodology for regional material supply planning (SGU).
5. Clearer distribution of responsibility and better flow of information among actors in the industry Measures:
9. National minerals forum to promote dialogue, knowledge exchange and coordination. • Framework conditions and infrastructure for competitiveness and growth.
6. A clearer and more effective regulatory framework Measures:
10. Follow-up and evaluation of performed initiatives to shorten environmental permitting lead-times (TA).
11. Pilot for comprehensive plan to support municipalities in their detailed planning work (Norrbotten CAB).
7. Infrastructure investments for growth in the mining industry Measures:
12. Use experience from FFI to develop electric propulsion systems for trucks on the road (Transport Agency).
• An innovative mining and minerals industry with an excellent knowledge base.
8. Research and innovation that create growth and competitiveness Measures:
13. Biometric subject review of the mining and minerals research area. Propose improved forms of cooperation between business sector and academia (Vinnova, VR).
9. Skills supply that meets the needs of the industry and the regions Measures:
14. Increase knowledge about the role of geology in society and highlight the industry as a workplace (SGU, business sector).
15. Regional skills platforms are to draw up plans for how to meet the long-term skills supply needs.
• An internationally renowned, active and attractive mining and minerals industry. 10. A good supply of capital and promotion of investment
Measures: 16. Analysis of Sweden’s attractiveness as a mining country, from an international perspective (TA).

38
11. Greater participation in the international arena Measures:
17. Investigate the conditions for establishing a communication and marketing platform to present activities for greater internationalisation (Business Sweden).
18. Propose how Sweden and Swedish enterprises can contribute to a sustainable mining industry in developing countries (SGU).
19. Sound out countries for more in-depth contacts at government level.
Norway: A mineral strategy for Norway was published by the Ministry of Trade and Industry in March, 201354. Its general goals include the following: • The Government wants Norway to be an attractive country for mining activities. This is the
background for presenting a strategy for the mineral industry. • The Government’s objective is a profitable mineral industry with strong value-creation and good
growth. • The Norwegian mineral industry shall be among the world’s most environmentally friendly and
must actively seek long-term, future-oriented solutions. • Norway has substantial mineral resources. These must be well-managed in order to secure growth
and the creation of profitable companies and employment in the mineral industry. • Predictable and efficient procedures shall be the rule for the handling of all regulations at
national, regional and municipal levels in relation to the industry. The new government elected in Autumn, 2013, had the following comments on the mineral industry in their initial, general policy statement (Sundvolden Declaration) (https://www.regjeringen.no/no/dokumenter/politisk-plattform/id743014/) "In many parts of Norway, the mineral industry may give rise to increased activity and employment. There is major wealth to be harvested from our mountains. The mineral industry will therefore be an important area of investment. The Government will: • Ensure good framework conditions for energy-intensive Norwegian manufacturing industry. • Establish a framework for growth in the mineral industry, by among other things ensuring
reliable, knowledge-based planning processes. • Open the door to allowing the mineral industry to use submarine tailings disposal sites, but
impose stringent requirements and ensure environmental monitoring."
54 http://www.norskbergindustri.no/var/ezdemo_site/storage/original/application/cd2c873462a2c0df5a05a75eb351ca2b.pdf

39
5. Regional perspectives
5.1 The Barents Region, Svalbard and sea-bed resources The Barents Region
Figure 8: Important ore deposits in Norden and NW Russia (Eilu, 2011) Figure 8 is based on the Fennoscandian Ore Deposit Database55, a cooperative project between the geological surveys in Norway, Sweden and Finland and several institutions in NW Russia. The database contains data on over 1000 deposits in Norden and NW Russia, mainly deposits for which the tonnages and grades are well documented. The major provices/deposits in the Barents Region part of our neighbouring countries are:
Sweden: • The Skellefte province – Boliden has (2014) three underground mines (Renstrøm; Kristineberg
and Kankberg) and two open pits (Maurliden and Maurliden Ø) in the Skellefte province just E of the Golf of Bothnia. Kankberg is a Au-Te ore: the others are polymetallic Zn-Cu-Pb-Au-Ag ores. The total tonnage milled in 2014 was 1.9 Mt.
55 http://en.gtk.fi/ExplorationFinland/fodd/fodd_deposit_map_20090417_50dpi.pdf.

40
• Aitik: Boliden's largest mine is a very large, low grade copper ore: reported reserves are 1.126 Mt containing 0.22 % Cu and 0.14 g/t Au (Boliden, 2015). Resources are reported to be 1643 Mt grading 0.16 % Cu and 0.1 g/t Au (Boliden,2014). Ore production in 2014 was 39 Mt.
• Kiruna: LKAB produced 44.7 Mt of iron ore from the Kiruna and Malmberget mines in 2015 (LKAB, 2016). Resources in the three main deposits are >1 800 Mt grading ca. 60 % Fe
Finland:
• Kemi, W. Europe's largest chromite deposit had a production of just over 1 Mt of chromite ore concentrate in 2014 (BGS, 2016). Turkey had a production several times larger. Kemi Mine is still part of Outokumpu: it has reserves of ca. 50 Mt grading ca. 26 % Cr2O3 and resources of c. 98 Mt grading 29.4 % Cr2O3 (Törmänen and Karinen, 2016).
• Kittilä (= Suurikisikko), N of Rovaniemi, was opened in 2008 and is one of the largest gold mines in Europe. Reserves are 31.6 Mt grading 4,23 g/t Au (there are also 18.5Mt of resources). Kittilä mine is part of the Canadian company, Agnico-Eagle.
• Keivitsä, SE of Suurikusikko: First Quantum (also Canadian) opened mining of this Ni-Cu-Co-PGE deposit in 2012. Documented mineral resources in 2012 (Törmänen and Karinen, 2016) were 240 Mt grading 0.3% Ni, 0.41% Cu, 0,21 ppm Pt, 0.15 ppm Pd and 0.11 ppm Au. The giant Sakatti deposit (Anglo-American) is located ca. 20 km. SSW of the Keivitsä mine.
• Sokli: Sokli is an apatite-rich carbonatite complex close to the border with Russia NE of Rovaniemi. Yara Suomi holds the mining rights. The complex has in excess of 12,000 Mt of reserves containing iron, niobium, tantalum and REE in addition to apatite (calcium phosphate).
Russia:
• Olenogorsk: The Olenogorsk area is of the same type as that at Bjørnevatn. The reserves are 384 Mt (2013) containing 30.6 % Fe
• Khibiny: There are seven apatite mines in the Khibiny mountains in the central part of the Kola Peninsual. Approximately 1,200 Mt has been mined in the course of sixty years of operation and remaining reserves would suffice for at least a further sixty years at the same rate of production. Several of the deposits are enriched in special metals such as niobium and REE.
• Kovdor: Kovdor is an iron-apatite.zirconium ore body with remaining reserves of 680 Mt (FODD, 2013) grading 27.5 % Fe, 6.78 % P2O5 and 0.16 % Zr. The deposit has been in production since 1961 and at least 600 Mt had been mined in the period 1961- 2013.
• Pechenga: Norilsk Nickel has three mines in Pechenga near the border with Norway, a smelter in Nikel, a roasting plant at Zapolyarny and a refinery for production of nickel and copper at Monchegorsk. Total ore production in 2015 was 8 Mt and metal production was 125 000 t nickel and 63 000 t copper (Norilsk Nickel, 2016). Proved and probable reserves, in the mined deposits and an additional four deposits in the area, are stated to be 140 Mt grading 0.82 % Ni and 0.51 % Cu (Norilsk Nickel, 2016).
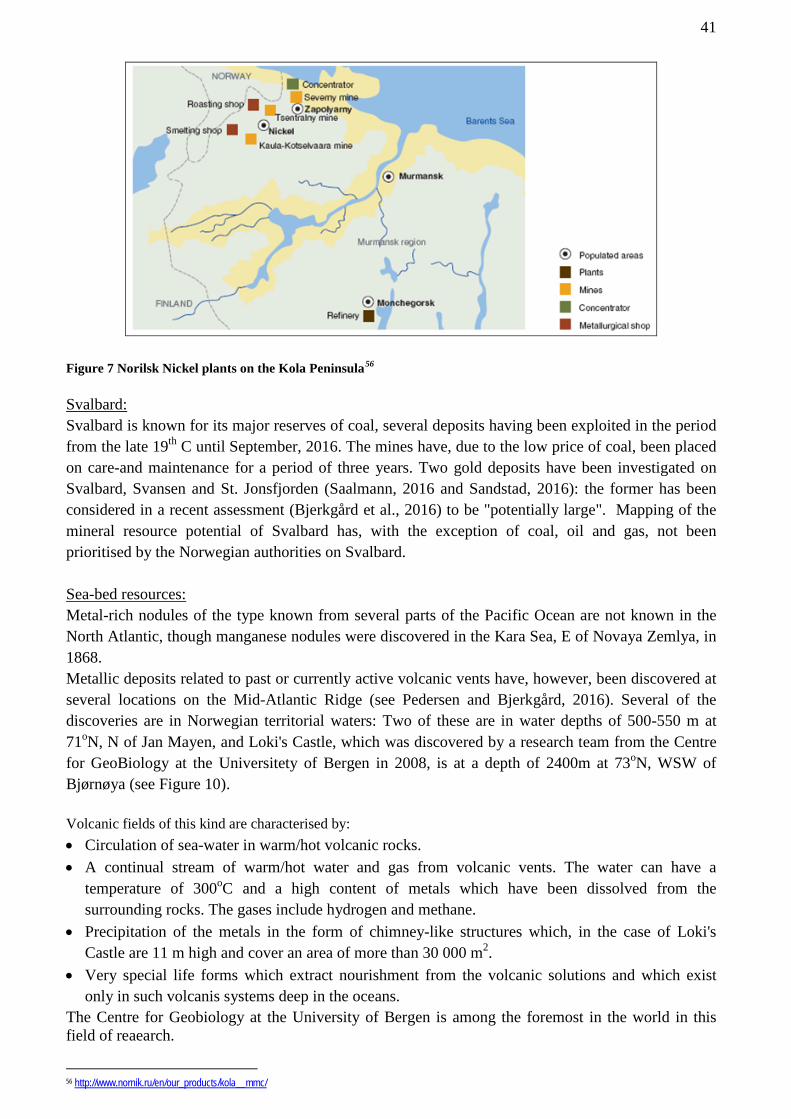
41
Figure 7 Norilsk Nickel plants on the Kola Peninsula56 Svalbard: Svalbard is known for its major reserves of coal, several deposits having been exploited in the period from the late 19th C until September, 2016. The mines have, due to the low price of coal, been placed on care-and maintenance for a period of three years. Two gold deposits have been investigated on Svalbard, Svansen and St. Jonsfjorden (Saalmann, 2016 and Sandstad, 2016): the former has been considered in a recent assessment (Bjerkgård et al., 2016) to be "potentially large". Mapping of the mineral resource potential of Svalbard has, with the exception of coal, oil and gas, not been prioritised by the Norwegian authorities on Svalbard. Sea-bed resources: Metal-rich nodules of the type known from several parts of the Pacific Ocean are not known in the North Atlantic, though manganese nodules were discovered in the Kara Sea, E of Novaya Zemlya, in 1868. Metallic deposits related to past or currently active volcanic vents have, however, been discovered at several locations on the Mid-Atlantic Ridge (see Pedersen and Bjerkgård, 2016). Several of the discoveries are in Norwegian territorial waters: Two of these are in water depths of 500-550 m at 71oN, N of Jan Mayen, and Loki's Castle, which was discovered by a research team from the Centre for GeoBiology at the Universitety of Bergen in 2008, is at a depth of 2400m at 73oN, WSW of Bjørnøya (see Figure 10). Volcanic fields of this kind are characterised by: • Circulation of sea-water in warm/hot volcanic rocks. • A continual stream of warm/hot water and gas from volcanic vents. The water can have a
temperature of 300oC and a high content of metals which have been dissolved from the surrounding rocks. The gases include hydrogen and methane.
• Precipitation of the metals in the form of chimney-like structures which, in the case of Loki's Castle are 11 m high and cover an area of more than 30 000 m2.
• Very special life forms which extract nourishment from the volcanic solutions and which exist only in such volcanis systems deep in the oceans.
The Centre for Geobiology at the University of Bergen is among the foremost in the world in this field of reaearch.
56 http://www.nornik.ru/en/our_products/kola__mmc/

42
Figure 10: Map of the North Atlantic showing the location of Loki's Castle.
5.2 Neighbouring regions of the Arctic Novaya Zemlya: Two ore types are known from Novaya Zemlya, but comprehensive descriptions are not available for either in English:
• The Pavlovsk lead-zinc deposit is located in Devonian carbonates on the W coast of Yuzhny (South) Island, near the town of Belushya Guba. Its reserves (Molchanov et al., 2016) are 2.4 Mt and resources 12 Mt: lead contents vary from 1.0 to 2.9 % and zinc from 1.6 to 20.8%.
• A manganese ore, also in carbonates (in the same region as the Pavlovsk ore), thought to contain resources of several billion tonnes (Glasby & Voytekhovsky, 2009).
The islands may well contain other ore bodies, but parts of their area are "restricted" due to the after-effects of nuclear tests and much of the northern island are ice-covered.
Greenland: The Greenland government has a strong focus on documentation of the mineral resources on Greenland and on encouraging the development of the most promising deposits. The deposit which has been of interest for Norwegian industry and authorities is the Citronenfjord lead-zinc ore in northernmost Greenland. The deposit57 has documented and probable resources of 70.8 Mt containing 5.7 % Zn + Pb. The deposit is located on an area of the coast which is ice-free for only a few months each year. This has led to interest in freighting the ore to Svalbard for temporary storage.
57 http://ironbark.gl/projects/greenland/citronen/
43
6. Strategic challenges Several elements in Norway's Mineral Strategy represent long-term challenges. Norway has good opportunities for development of its mineral industry: success in developing the industry must build on society's acceptance of the importance minerals have in its development, whether they are produced within the country or imported from the other side of the world.
Improvement of basic information about the geology of Norway and its mineral deposits Much progress has been made in North Norway (the MINN program) though the level of geological knowledge is still not comparable to that in Finland and parts of N. Sweden. The level of geological knowledge in much of S. Norway is much less detailed.
Stimulate the mining industry to use venture capital in the search for new deposits Prospecting, whether for oil, gas or mineral deposits, involves risk, even where sound regional geological data is available. Targeted geological research is commonly a prerequisite in the early stages of an exploration programme. Mechanisms which offer direct or indirect public financial support are limited and land-based mineral exploration activities do not benefit from the type of tax incentives available for the offshore oil industry.
Secure future resources through better management of deposits of national importance Ready access to mineral deposits is a prerequisite for a sustainable mining industry. This necessitates legal and management systems and planning processes which recognize the value of, and give appropriate attention to mineral deposits, especially those of national importance.
This is not the case at present. An environmental protection order with a relatively low priority can, in theory and in fact, stop development of a mineral deposit with a high priority and a value of tens of billion NOK.
Strengthening of Education and Research The mining industry requires high-level skills. The current trend of declining focus on education and research related to understanding of regional geology and of mineral deposits should be reversed. Cooperation at Nordic and European levels offers new opportunities in this field.
7. Conclusions Norway is an important supplier of the following resources to the European market (and other markets), including resource-based products processed in Norway: Primary produced ores/metallic minerals: titanium minerals, iron ore. Primary produced industrial minerals: calcium carbonate, graphite, quartz, ultra-pure quartz, nepheline syenite, olivine.
Norway has, in addition, potential for development of production of the followwing resource types which are considered to be critical or have been assessed as potentally critical in the DG Enterprise (now DG Growth) assessments: Ores/metallic minerals: beryllium, magnesium, molybdenum, niobum, nickel, zinc (-lead) and rare earth elements (REE). Industrial minerals: apatite, talc. Norway also has a potential for several other types of resource which are sought after, e. g.: gold, copper, hard-rock aggregate, building stone. There are, implicit in this potential, many possibilities for added value through processing of the raw materials in Norway.
Norway has, based on domestically produced and imported mineral resources,a very important role in supply of the following mineral-based products to the European and other markets: aluminium,

44
ferroalloys (many types), calcium carbonate slurry, cobolt metal, mineral fertiliser, manganese alloys, nickel metal and silicon metal.
Norway has very strong expertise in metallurgy and in mineral processing. It is critically important that these skills are maintained and developed as part of the basis for national value creation. Mineral deposits which are critical as the basis for such development should be given a status as national resources.
References (in addition to footnotes) Boyd, R., Bjerkgård, T., Ihlen, P.M., Korneliussen, A., Sandstad, J.S. & Schiellerup, H., 2012:
Mineral- og metallressurser i Norge:”In situ” verdi av metallforekomster av nasjonal betydning. NGU rapport 2012.048, 42s.
British Geological Survey, 2016 (and earlier years): World Mineral Production.
http://www.bgs.ac.uk/mineralsuk/statistics/worldArchive.html British Geological Survey, 2016: European Mineral Statistics.
http://www.bgs.ac.uk/mineralsuk/statistics/europeanStatistics.html Dahlgren, S., 2015: REE and thorium potential of the Fen Carbonatite Complex. Mining Journal
special publication: Norway, 12-13. DG Enterprise and Industry, 2014: Report on Critical Raw Materials for the EU.
http://s1.q4cdn.com/411066846/files/Report-on-Critical-Raw-Materials-for-the-EU-2014.pdf and other reports accessible at: https://ec.europa.eu/growth/sectors/raw-materials/specific-interest/critical_en
Eilu, P., 2011: Metallic mineral resources of Fennoscandia. In: Geoscience for society: 125th
anniversary volume. Geological Survey of Finland. Special Paper 49. Espoo: Geological Survey of Finland, 13-21. http://arkisto.gtk.fi/sp/sp49/sp49_eilu.pdf
Elshkaki, A. & Graedel T.E., 2013: Dynamic analysis of the global metals flows and stocks in
electricity generation technologies, Journal of Cleaner Production 59, 260–273.
Glasby, G.P. & Voytekhovsky, Yu. L., 2009: Arctic Russia: Minerals and Mineral Resources, Geochemical News 140.
Haakana, T., Saxén, B., Lehtinen, L., Takala, H., Lahtinen, M., Svens, K., Ruonala, M. &
Gongming, X., 2008: Outotec direct leaching application in China: The Southern African Institute of Mining and Metallurgy: Lead and Zinc 2008, 69 – 83.
Ihlen, P. M., 1983: Geologiske og petrokjemiske resultater fra diamantboring på Sæteråsen niob-
forekomst. NGU-rapport 1800/76B, 39 s. Ihlen, P.M. Schiellerup, H., Gautneb;H. Skår ,Ø. 2014: characterization of apatite resources in
Norway and their REE potential. Ore Geology Reviews, 58, 126-147.
45
International Mining, 2006: MMC Norilsk Nickel, International Mining, July 2006, 8 -14. http://www.infomine.com/publications/docs/InternationalMining/IMJuly2006e.pdf
Lockington, J.A., Cook, N.J. & Ciobanu, C. L., 2014: Trace and minor elements in sphalerite from
metamorphosed sulphide deposits. Mineralogy and Petrology 108, 873-890. Molchanov, A. V., Terekhov, A.V., Artem'ev, D.S., Shatov, V.V. & Belova, V.N., 2016: Base metal
deposits and associated PGE ores. In: Boyd, R.,, Bjerkgård, T., Nordahl, B. & Schiellerup, H. (editors): Mineral Resources in the Arctic, Geological Survey of Norway Special Publication, 411 – 429.
Mudd, G.M., 2012: Key trends in the resource sustainability of platinum group elements, Ore
Geology Reviews 46, 106 – 117. Norilsk Nickel, Annual Report 2015, 2016: http://www.nornik.ru/en/investor-relations/annual-
reports/annual-reports Reddick Consulting Inc. 2009. Technical Report on Resource Estimates for the Ertelien, Stormyra
and Dalen Deposits, Southern Norway. Prepared for Blackstone Ventures Inc. NI 43-101 Report. 99 p.
Törmänen, T. & Karinen, T. a, 2016: Kemi Cr deposit. In: Boyd, R.,, Bjerkgård, T., Nordahl, B. &
Schiellerup, H. (editors): Mineral Resources in the Arctic, Geological Survey of Norway Special Publication, 336 – 337.
Törmänen, T. & Karinen, T. b, 2016: The Keivitsa and Sakatti Ni-Cu-PGE deposits. In: Boyd, R.,,
Bjerkgård, T., Nordahl, B. & Schiellerup, H. (editors): Mineral Resources in the Arctic, Geological Survey of Norway Special Publication, 351 – 353.
United States Geological Survey Minerals Information: http://minerals.usgs.gov/minerals/pubs/ (Årlige oversikter for råstoffer og for de enkelte land).
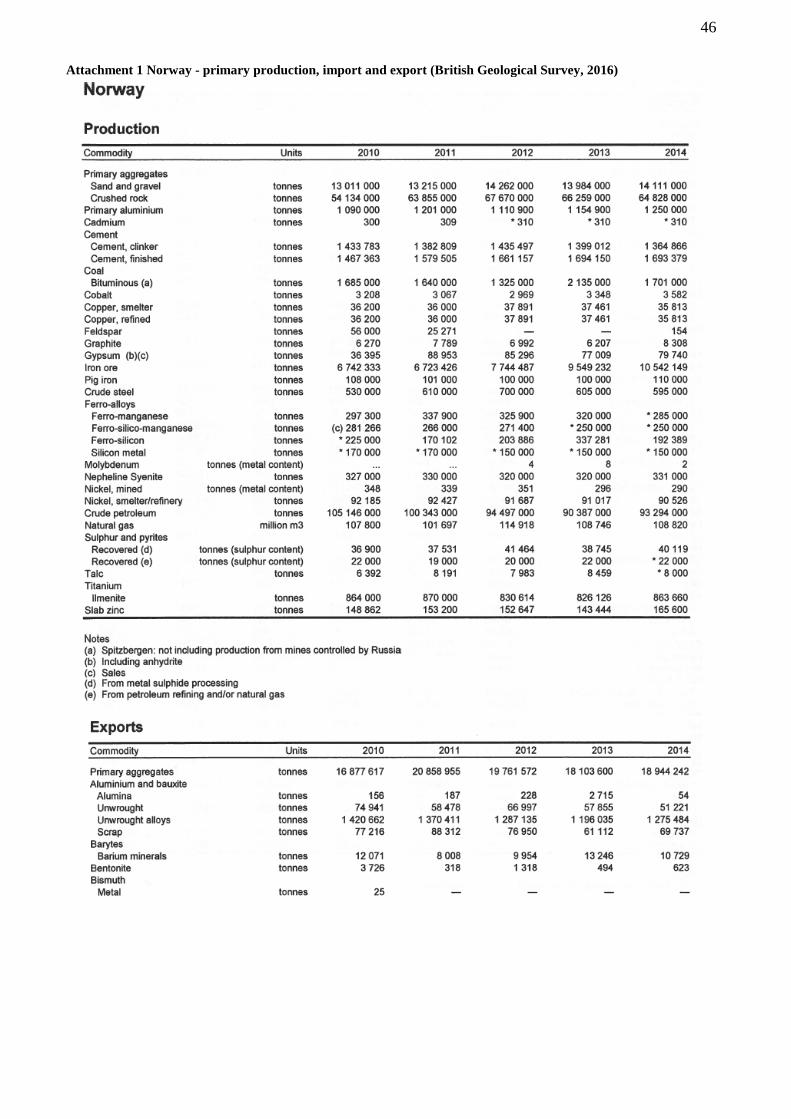
46
Attachment 1 Norway - primary production, import and export (British Geological Survey, 2016)

47

48

49

50
Attachment 2 Ferroalloys: World Production (United States Geological Survey Minerals Yearbook – 2013)

51

52
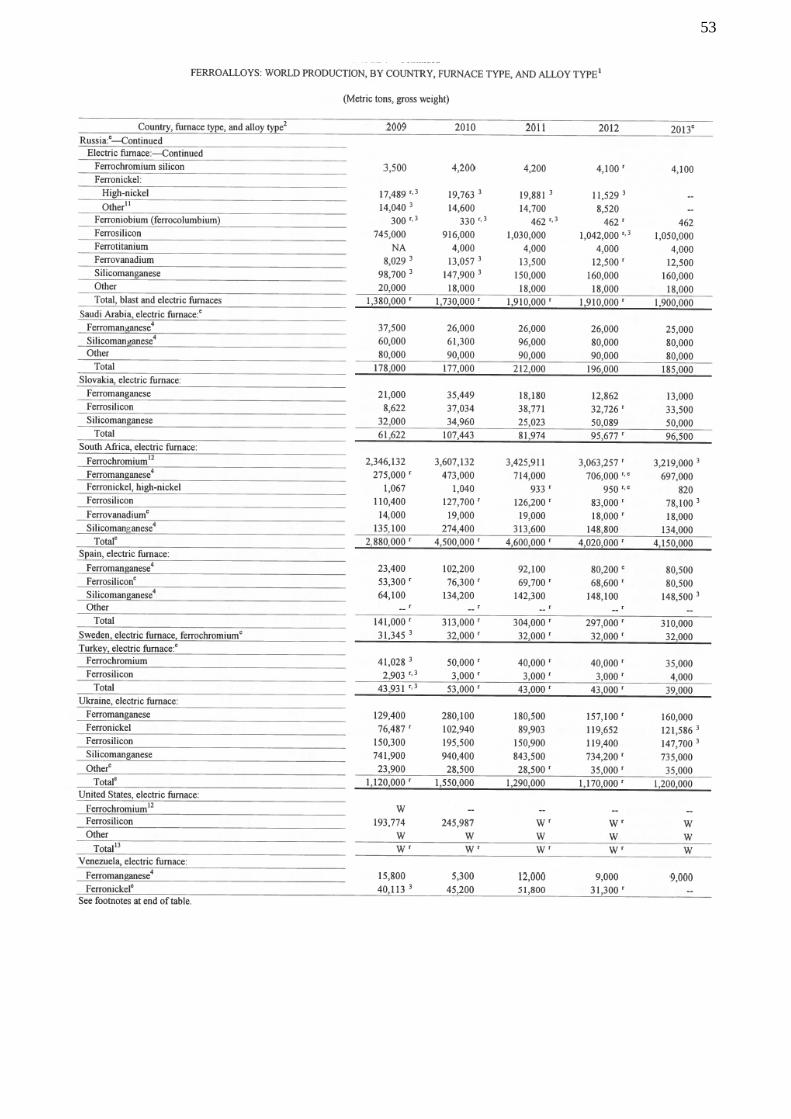
53

54