Embed Size (px)
Citation preview

A report from BDO to Southwark Clinical Commissioning Group
May 2013
ANALYSIS OF PRIMARY AND COMMUNITY CARE TO SUPPORT THE DEVELOPMENT OF THE PRIMARY AND COMMUNITY CARE STRATEGY

Page
Introduction 3
Methodology 4
Analysis Findings 9
Appendix 1 – Data Analysis 21
Appendix 1A – CCG Level Analysis 23
Appendix 1B – Locality Level Analysis 69
Appendix 1C – Strategy and Document Review 91
CONTENTS

INTRODUCTION Background to the Review
Background
Southwark CCG are developing a Primary and Community Care Strategy
for the period 2013/14 until 2017/18. This strategy will articulate the
strategic context for primary and community care, analyse the current
state of services and assess what primary and community care services
will need to look like in order to meet the objectives of Southwark’s
Strategic Plan and the TSA Community Based Care Strategy.
Drivers for the Primary and Community Care Strategy
•The CCG now has a statutory responsibility for primary care
improvement
•Southwark CCG’s Integrated Plan focuses on improving key patient
level outcomes: primary care is often a key provider in achieving these
improved outcomes
•Currently there is significant variation in the quality and outcomes
provided by Southwark practices
•The Trust Strategic Administrator (TSA) proposals for South East
London rely on CCGs delivering a Community Based Care strategy
including improving the quality and responsiveness of primary care
•Southwark’s QIPP plans assume an increasing level of shift of care
from acute services into community and primary care service. We will
need to ensure that there is sufficient quality, capacity and capability
to take on additional responsibilities
•The CCG needs to develop a strong working relationship with the NCB,
and a clear commissioning strategy for primary care improvement will
support this developing relationship.
Strategy Development
There are three steps to developing the strategy:
1. Undertake an analysis of current quality, variation, capacity
and capability and assess against desired levels
2. Generation of options to develop primary and community
care to meet strategic objectives
3. Develop strategy including implementation plan.
This Document
This document summarises and details the analysis phase of the
development of the strategy, and sets out the approach that has
been taken.
The following stage of this process, as described above, will be
for stakeholder engagement to continue, and to focus upon
options for the development of primary care based upon this
analysis.

METHODOLOGY
Data Sources
A comprehensive
range of data have
been analysed from a
variety of sources.
Analysis
The analysis is
categorised into that
which indicates
Capacity & Capability
and Quality &
Variability. It is
presented for the
whole of CCG and for
each locality in turn.
Priorities
Four priority areas
have been identified
from this analysis.
Options
A number of options
will be developed in
order to address
these priorities.
Tbc
Tbc
General Practice
Outcome Standards
Capacity &
Capability
Quality &
Variability Practice Trend Analysis
Southwark Primary
Care Dashboard
GP Patient Survey
Tbc
LES Data/QOF data
Engagement and
Locality Events
Demand & Capacity
Data
Data Sources Analysis Priorities Options
GP Practice Variation
Community Based
Services
Integration (Care
Coordination)
Access
Tbc
Approach

METHODOLOGY Data Sources
Data Sources Analysis
Practice Trend Analysis Indicators analysed – A&E Attendances, Outpatient New Referrals, A&E Band 5 (Minor)
Attendances and referral to Cardiology and Dermatology and the rates used are per 1000
patients to adjust for variations in list sizes. Where the information is available, Southwark
CCG has been externally benchmarked with London SHA and England averages for the same
indicators.
Internal Benchmarking
High volume specialties analysed – Gynaecology, Ophthalmology, Dermatology, Trauma &
Orthopaedics and Cardiology. The graphs show the referral rates (per 1000) by each practice
grouped into localities where the referral is made by a GP.
General Practice
Outcomes Standards
All indicators that are available have been analysed, graphs showing locality level scores
against the total for Southwark with London Averages highlighted.
Quality and Outcomes
Framework
All Clinical Indicators that are available have been analysed at practice level. Graphs showing
locality level scores against the total for Southwark with National Averages highlighted.
GP Demand and Capacity
Primary Research GP Demand and Capacity data was collected by practices completing the Royal College of
General Practitioners treating access toolkit. Data was collated to show demand and capacity
for same day and advance appointments across a named week. In addition practice staffing
levels were recorded. Graphs provide data from a week decided by the by the practice
between 25th February 2013 – 18th March 2013.
GP Patient Surveys We analysed the percentage of standardised answers to three questions in the survey: 1)
When did you want to see/speak to your GP? 2) How long till you actually saw/spoke to a
GP/Nurse? 3) What did you do if you couldn’t get an appointment?
We compared the data for Southwark CCG to the National Average and then compared the
survey results at practice level.

METHODOLOGY Data Sources
Data Sources Analysis
Community Data Combined Community Health Services Reports were reviewed as were CQIN reports where
they related to primary care and/or capacity. The main areas were around immunisation,
Falls, sickness and cancelled appointments.
Strategy & Document
Review
A review of the priorities set out in the CCG’s Integrated Plan was undertaken to ensure
consistency. QIPP plans were also reviewed as it was vital that when considering options,
those which support delivery of QIPP targets are prioritised.
The Dulwich Consultation was also reviewed to ensure that any recommendations made in
this review are consistent with this key, linked project.
The Community Based Care (TSA) Strategy was also constantly reviewed to ensure findings
and plans would support the wider aims of the SEL CBC Strategy.
LES Data A review of the LESs held by the CCGs practices was undertaken to understand the scope and
breadth and performance against targets. Comparisons against target; benchmarking between
practice and locality; and where applicable, against national levels of achievement were
undertaken.
GP Community Services The community services below were also reviewed, and the findings incorporated in this
report:
-Phlebotomy
-Adult audiology
-Dermatology
-Headache/Neurology
-ENT
-Ophthalmology
GP PMS Contract A review of the GP contract to understand the range and scope of services to be provided as
part of the PMS Contract

METHODOLOGY Data Sources
Data Sources Analysis
Southwark Dashboard The indicators analysed are:
Patients with hypertension, as a ratio of expected
Patients with CHD, as a ratio of expected
Patients with COPD, as a ratio of expected
Patients with diabetes as ratio of expected
Dementia prevalence as % of list size
A&E attendance Rate as % of list size
4 week smoking quit rate as % of setters
Diabetic patients with an HbA1c of 8% or less
LTC patients with smoking status recorded by GP
Flu immunisation (wider risk groups)
Patients screened for alcohol use as % of newly registered
Proportion of patients with recorded BMI (Adults)
Medicines management RAG progress on QPI
Patient satisfaction with quality of practice care
Patient satisfaction with access to GP
Benchmarking graphs
Each practice is colour coded by locality. Where the data was available, the England, London
and Southwark averages are displayed. These charts are presented for all of the indicators
above.
National quartile charts
Using the percentile information from the dashboard we grouped the Southwark practices
according to the national quartile they fall into. Related indicators are presented together for
comparison – for example ‘Patients with diabetes as ratio of expected’ and ‘Diabetic patients
with an HbA1c of 8% or less.’

ANALYSIS: FINDINGS

ANALYSIS
The findings from this project have been grouped into four priority areas. These priorities have been selected based upon
the findings from the analysis, and from discussion with the project steering group. The priority areas are as follows:
•GP Practice Variation
•Access
•Community Based Services
•Integration (Care Coordination)
It is recognised that there will be duplication between these priority areas, and that key themes will run through a number
of priorities. However, after discussion it has been agreed that these represent the clearest method for describing the
analytical findings, and can be linked both from existing CCG strategic documents and through to options to be set out in
the Primary and Community Care Strategy.
The following section of the report therefore sets out how the findings of the analysis support the selection of these
priorities for the Primary and Community Care Strategy.
Summary of Findings
ANALYSIS GP Practice Variation (1)
Domain Findings Data Sources
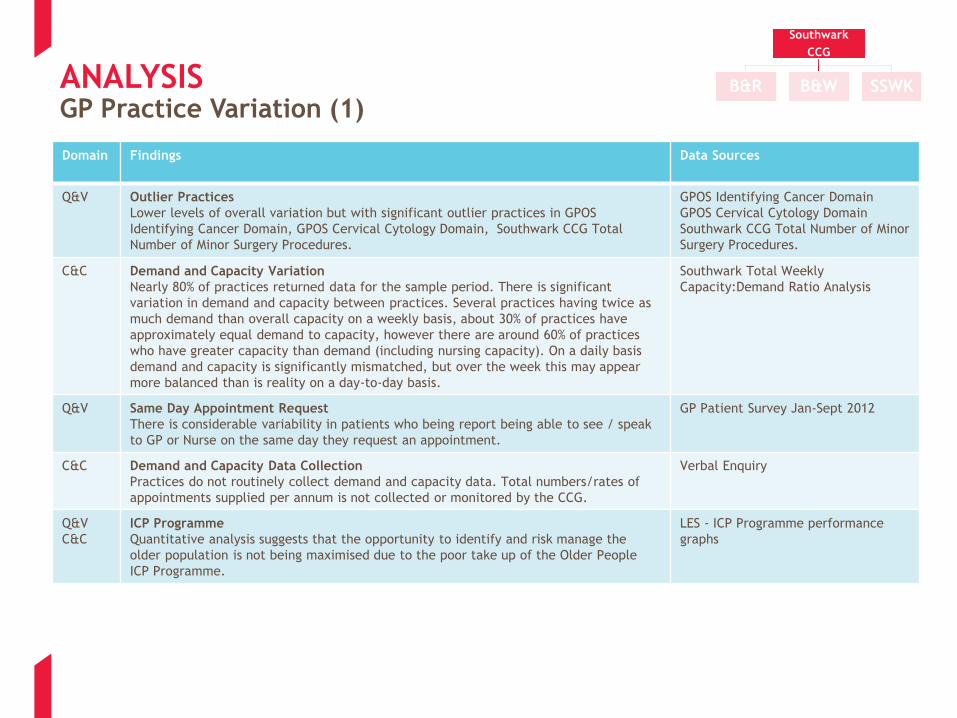
Q&V Outlier Practices
Lower levels of overall variation but with significant outlier practices in GPOS
Identifying Cancer Domain, GPOS Cervical Cytology Domain, Southwark CCG Total
Number of Minor Surgery Procedures.
GPOS Identifying Cancer Domain
GPOS Cervical Cytology Domain
Southwark CCG Total Number of Minor
Surgery Procedures.
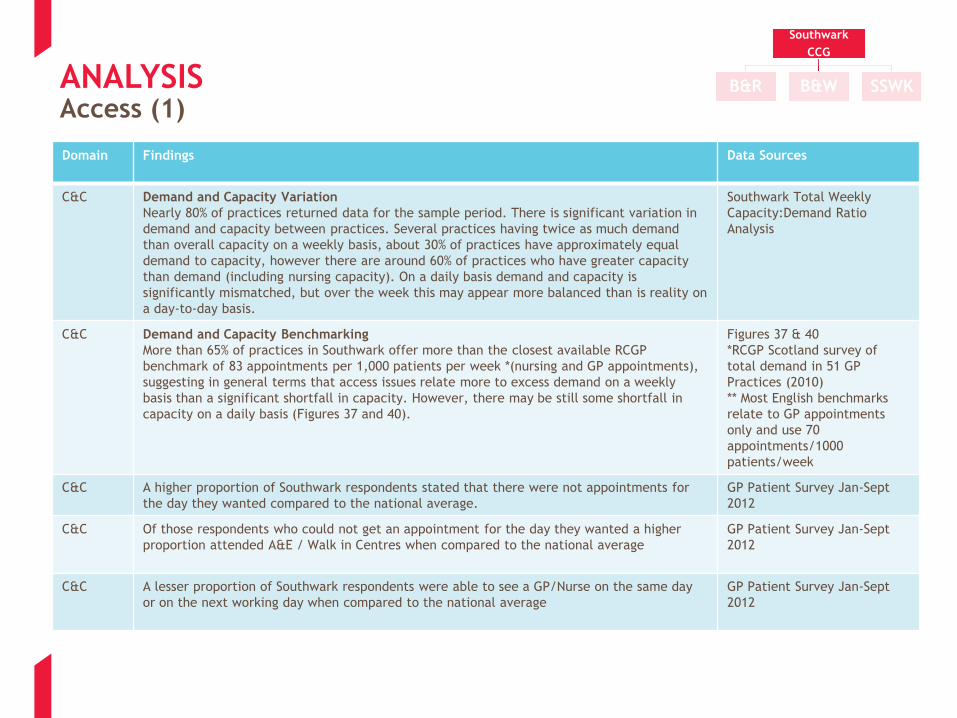
C&C Demand and Capacity Variation
Nearly 80% of practices returned data for the sample period. There is significant
variation in demand and capacity between practices. Several practices having twice as
much demand than overall capacity on a weekly basis, about 30% of practices have
approximately equal demand to capacity, however there are around 60% of practices
who have greater capacity than demand (including nursing capacity). On a daily basis
demand and capacity is significantly mismatched, but over the week this may appear
more balanced than is reality on a day-to-day basis.
Southwark Total Weekly
Capacity:Demand Ratio Analysis
Q&V Same Day Appointment Request
There is considerable variability in patients who being report being able to see / speak
to GP or Nurse on the same day they request an appointment.
GP Patient Survey Jan-Sept 2012
C&C Demand and Capacity Data Collection
Practices do not routinely collect demand and capacity data. Total numbers/rates of
appointments supplied per annum is not collected or monitored by the CCG.
Verbal Enquiry
Q&V
C&C
ICP Programme
Quantitative analysis suggests that the opportunity to identify and risk manage the
older population is not being maximised due to the poor take up of the Older People
ICP Programme.
LES - ICP Programme performance
graphs
Southwark
CCG
B&R B&W SSWK

ANALYSIS GP Practice Variation (2)
Domain Findings Data Sources
Q&V Feedback to Practices
Practices are not provided with regular comprehensive performance against peers;
•Some pieces of data are not being provided at practice level to practices
•Some data is provided but not in a timely/actionable way
•Some data is being provided and in timely way but is not benchmarked against peers
If relative performance information is not provided in a timely and actionable manner then
opportunity to take remedial action is limited.
GP Practice Dashboard
QOF Reports
Primary and Community Care
Review Analysis
Q&V
C&C
Enhanced Service Planning
There is considerable variation at practice level in how and which enhanced services are
provided (e.g. Phlebotomy). No evidence was found that these are arranged in a planned and
strategic manner and no evidence was found this reflects where need exists. There was strong
evidence patients find this confusing and inequitable.
Enhanced services graph
Feedback from Out of Hospital
Engagement event
(DN - Check patient survey and
strategy documents)
C&C Extended Hours
Specifically relating to Extended Hours we have found no evidence that provision is tested
against local requirements and there is variability in provision. In addition to this feedback
suggests patients are dissatisfied and confused with the current configuration of extended
hours.
LES Graphs
Feedback from Out of Hospital
Engagement event
Demand and Capacity Analysis
Q&V Healthcheck uptake
Qualitative evidence suggests there is a staggered roll out rates are low and highly variable
(primary prevention)
Southwark CCG - % of patients
with Healthcheck in 5 years
Q&V Cardiovascular Screening and Secondary Prevention
Qualitative evidence suggests QOF Ratio of expected to ratio is overrepresented in the lower
quartile (secondary prevention).
Qualitative analysis suggests Southwark are weak on secondary prevention and disease
management when compared to the national average.
QOF Long Term Conditions
Prevalence as Ratio of
Expected (practices by
quartile) Coronary Heart
Disease Total % Points QOF
Southwark
CCG
B&R B&W SSWK

ANALYSIS GP Practice Variation (3)
Domain Findings Data Sources
Q&V Broad Variation
Significant practice variation across Mental Health QOF Domain and Southwark Flu Vaccine
Uptake Over 65s (2012/13 YTD) areas in the Q&V analysis.
Mental Health QOF Domain
Southwark Flu Vaccine Uptake
Over 65s (2012/13 YTD)
C&C Clinician Capacity
Primary research and quantitative analysis suggests overall demand and capacity can be
managed more effectively on a day to day basis without necessarily increasing overall
capacity
Southwark Total Weekly
Capacity:Demand Ratio
Analysis
C&C Healthchecks Evidence Base
Qualitative information suggests GP are not convinced by evidence base for healthchecks
qualitative – locality meetings
Feedback from Locality
Meetings
C&C Clinician Capacity
Qualitative information suggests there are not enough staff with the right skills available to
undertake healthchecks within practices
Feedback from Locality
Meetings
C&C Clinician Capacity / Capability
Quantitative evidence suggests of the 25% sample who returned the demand and capacity
research under 1 WTE (within the sample of 25%) was identified as a clinician with special
interest within CVR (Hypertension)
GPSI Demand and Capacity
Analysis
Q&V Diabetes Screening
QOF Ratio of expected to ratio is significantly overrepresented in the lower quartile and not
represented in top quartile (secondary prevention)
QOF Long Term Conditions
Prevalence as Ratio of
Expected (practices by
quartile)
Q&V Diabetic Case Management
Performance on management of patients with Diabetes is below national average (both on
aggregate DM QOF score and key QOF indicators) but appears to be due to (x outlier practices)
rather than sub-optimal performance across Southwark.
QOF Long Term Conditions
Prevalence as Ratio of
Expected (practices by
quartile)
Southwark
CCG
B&R B&W SSWK

ANALYSIS GP Practice Variation (4)
Domain Findings Data Sources
Q&V Childhood Immunisation Completion
Southwark Childhood immunisation data 11/12 shows under 5 completion of all immunisations
is 83% and varies by locality from 79%-88%.
2011/12 Southwark
Immunisation Rates by Locality
Q&V Childhood Immunisation ‘Drop-off’
Southwark Childhood immunisation data 11/12 shows drop off from U2 to U5 of 7% across
Southwark and 13% in B&R.
2011/12 Southwark
Immunisation Rates by Locality
Q&V Performance Management System
Child - Complicated measurement of current year performance – HV CQUIN target relative to
previous GP CQUIN performance. Difficult to attribute performance to each party, and to
monitor overall trend
Childhood Immunisation Graph
11/12
Q&V Childhood Immunisation Performance Management
Child - For contribution by Health Visitors measured by individual immunisation the CQUIN
targets were not met in 11/12
Childhood Immunisation Graph
11/12
Q&V Flu Performance
Flu – Variable performance of achievement against the 65% LES target (for example some
practices are immunising only 50% of over 65’s). Although overall Southwark average is above
65%.
Flu Vaccine - Over 65s Flu
Vaccination Uptake by Locality
(2012/13)
Q&V Locality Flu Performance
Flu - Variability by locality can be seen as B&W are out performing the other localities quite
significantly
(page 36)
C&C IT Systems
Qualitative feedback - IT Systems do not offer easy transparency regarding immunisation
status to primary care
Locality Meeting Feedback
Southwark
CCG
B&R B&W SSWK
ANALYSIS GP Practice Variation (5)
Domain Findings Data Sources
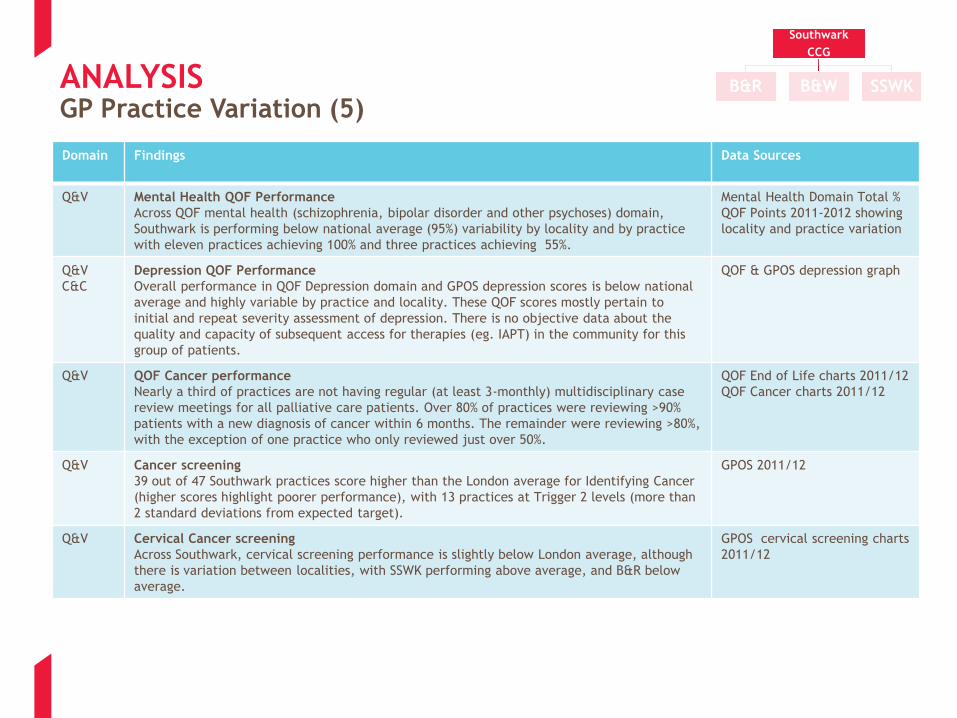
Q&V Mental Health QOF Performance
Across QOF mental health (schizophrenia, bipolar disorder and other psychoses) domain,
Southwark is performing below national average (95%) variability by locality and by practice
with eleven practices achieving 100% and three practices achieving 55%.
Mental Health Domain Total %
QOF Points 2011-2012 showing
locality and practice variation
Q&V
C&C
Depression QOF Performance
Overall performance in QOF Depression domain and GPOS depression scores is below national
average and highly variable by practice and locality. These QOF scores mostly pertain to
initial and repeat severity assessment of depression. There is no objective data about the
quality and capacity of subsequent access for therapies (eg. IAPT) in the community for this
group of patients.
QOF & GPOS depression graph
Q&V QOF Cancer performance
Nearly a third of practices are not having regular (at least 3-monthly) multidisciplinary case
review meetings for all palliative care patients. Over 80% of practices were reviewing >90%
patients with a new diagnosis of cancer within 6 months. The remainder were reviewing >80%,
with the exception of one practice who only reviewed just over 50%.
QOF End of Life charts 2011/12
QOF Cancer charts 2011/12
Q&V Cancer screening
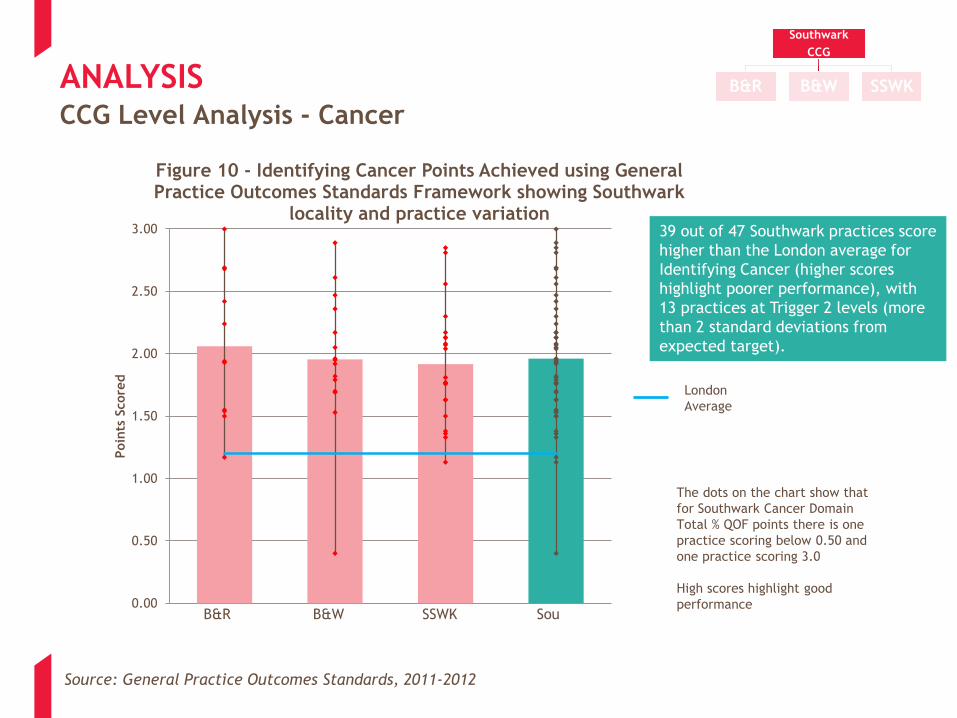
39 out of 47 Southwark practices score higher than the London average for Identifying Cancer
(higher scores highlight poorer performance), with 13 practices at Trigger 2 levels (more than
2 standard deviations from expected target).
GPOS 2011/12
Q&V Cervical Cancer screening
Across Southwark, cervical screening performance is slightly below London average, although
there is variation between localities, with SSWK performing above average, and B&R below
average.
GPOS cervical screening charts
2011/12
Southwark
CCG
B&R B&W SSWK
ANALYSIS Community Based Services
Domain Findings Data Sources
Q&V
C&C
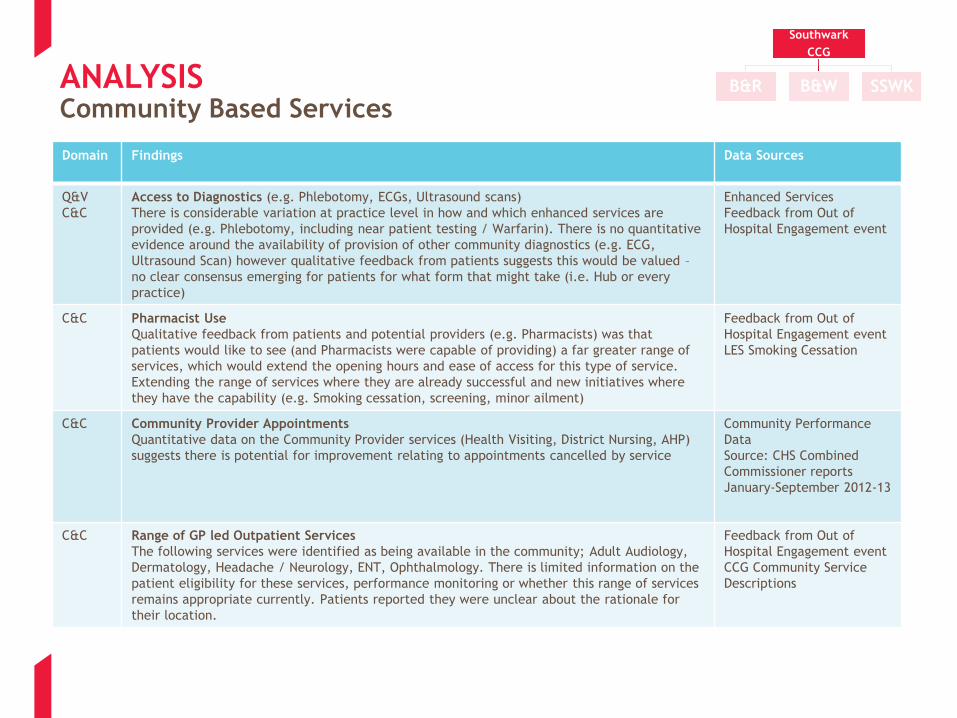
Access to Diagnostics (e.g. Phlebotomy, ECGs, Ultrasound scans)
There is considerable variation at practice level in how and which enhanced services are
provided (e.g. Phlebotomy, including near patient testing / Warfarin). There is no quantitative
evidence around the availability of provision of other community diagnostics (e.g. ECG,
Ultrasound Scan) however qualitative feedback from patients suggests this would be valued –
no clear consensus emerging for patients for what form that might take (i.e. Hub or every
practice)
Enhanced Services
Feedback from Out of
Hospital Engagement event
C&C Pharmacist Use
Qualitative feedback from patients and potential providers (e.g. Pharmacists) was that
patients would like to see (and Pharmacists were capable of providing) a far greater range of
services, which would extend the opening hours and ease of access for this type of service.
Extending the range of services where they are already successful and new initiatives where
they have the capability (e.g. Smoking cessation, screening, minor ailment)
Feedback from Out of
Hospital Engagement event
LES Smoking Cessation
C&C Community Provider Appointments
Quantitative data on the Community Provider services (Health Visiting, District Nursing, AHP)
suggests there is potential for improvement relating to appointments cancelled by service
Community Performance
Data
Source: CHS Combined
Commissioner reports
January-September 2012-13
C&C Range of GP led Outpatient Services
The following services were identified as being available in the community; Adult Audiology,
Dermatology, Headache / Neurology, ENT, Ophthalmology. There is limited information on the
patient eligibility for these services, performance monitoring or whether this range of services
remains appropriate currently. Patients reported they were unclear about the rationale for
their location.
Feedback from Out of
Hospital Engagement event
CCG Community Service
Descriptions
Southwark
CCG
B&R B&W SSWK
ANALYSIS Integration (Care Coordination/ ‘Patient Friendly’ Care)
Domain Findings Data Sources
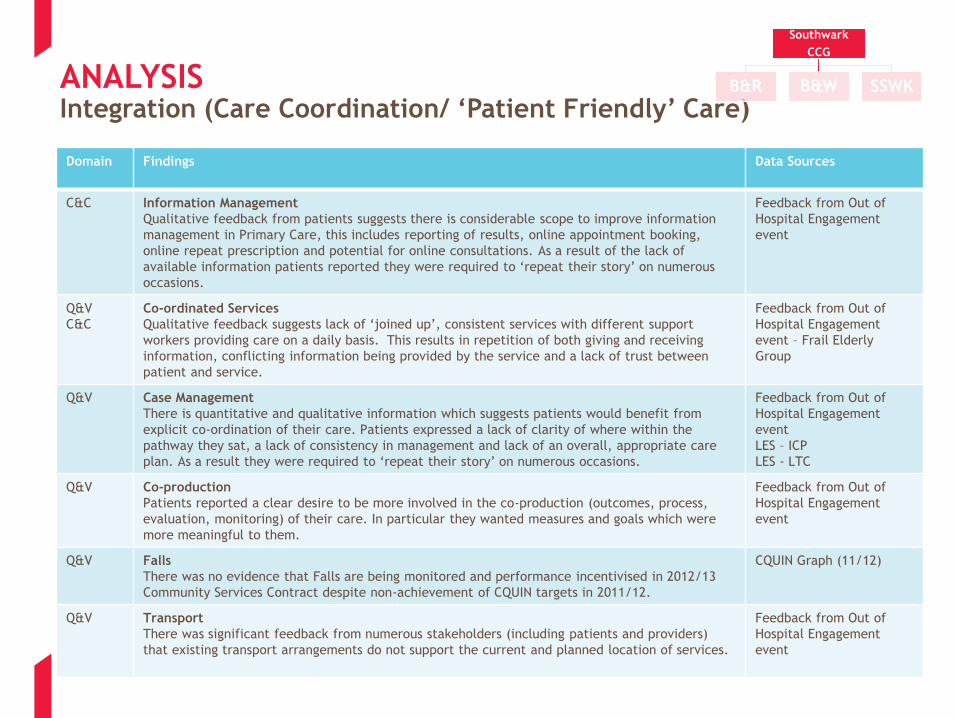
C&C Information Management
Qualitative feedback from patients suggests there is considerable scope to improve information
management in Primary Care, this includes reporting of results, online appointment booking,
online repeat prescription and potential for online consultations. As a result of the lack of
available information patients reported they were required to ‘repeat their story’ on numerous
occasions.
Feedback from Out of
Hospital Engagement
event
Q&V
C&C
Co-ordinated Services
Qualitative feedback suggests lack of ‘joined up’, consistent services with different support
workers providing care on a daily basis. This results in repetition of both giving and receiving
information, conflicting information being provided by the service and a lack of trust between
patient and service.
Feedback from Out of
Hospital Engagement
event – Frail Elderly
Group
Q&V Case Management
There is quantitative and qualitative information which suggests patients would benefit from
explicit co-ordination of their care. Patients expressed a lack of clarity of where within the
pathway they sat, a lack of consistency in management and lack of an overall, appropriate care
plan. As a result they were required to ‘repeat their story’ on numerous occasions.
Feedback from Out of
Hospital Engagement
event
LES – ICP
LES - LTC
Q&V Co-production
Patients reported a clear desire to be more involved in the co-production (outcomes, process,
evaluation, monitoring) of their care. In particular they wanted measures and goals which were
more meaningful to them.
Feedback from Out of
Hospital Engagement
event
Q&V Falls
There was no evidence that Falls are being monitored and performance incentivised in 2012/13
Community Services Contract despite non-achievement of CQUIN targets in 2011/12.
CQUIN Graph (11/12)
Q&V Transport
There was significant feedback from numerous stakeholders (including patients and providers)
that existing transport arrangements do not support the current and planned location of services.
Feedback from Out of
Hospital Engagement
event
Southwark
CCG
B&R B&W SSWK
ANALYSIS Access (1)
Domain Findings Data Sources
C&C Demand and Capacity Variation
Nearly 80% of practices returned data for the sample period. There is significant variation in
demand and capacity between practices. Several practices having twice as much demand
than overall capacity on a weekly basis, about 30% of practices have approximately equal
demand to capacity, however there are around 60% of practices who have greater capacity
than demand (including nursing capacity). On a daily basis demand and capacity is
significantly mismatched, but over the week this may appear more balanced than is reality on
a day-to-day basis.
Southwark Total Weekly
Capacity:Demand Ratio
Analysis
C&C Demand and Capacity Benchmarking
More than 65% of practices in Southwark offer more than the closest available RCGP
benchmark of 83 appointments per 1,000 patients per week *(nursing and GP appointments),
suggesting in general terms that access issues relate more to excess demand on a weekly
basis than a significant shortfall in capacity. However, there may be still some shortfall in
capacity on a daily basis (Figures 37 and 40).
Figures 37 & 40
*RCGP Scotland survey of
total demand in 51 GP
Practices (2010)
** Most English benchmarks
relate to GP appointments
only and use 70
appointments/1000
patients/week
C&C A higher proportion of Southwark respondents stated that there were not appointments for
the day they wanted compared to the national average.
GP Patient Survey Jan-Sept
2012
C&C Of those respondents who could not get an appointment for the day they wanted a higher
proportion attended A&E / Walk in Centres when compared to the national average
GP Patient Survey Jan-Sept
2012
C&C A lesser proportion of Southwark respondents were able to see a GP/Nurse on the same day
or on the next working day when compared to the national average
GP Patient Survey Jan-Sept
2012
Southwark
CCG
B&R B&W SSWK

ANALYSIS Access (2)
Domain Findings Data Sources
Q&V There is considerable variability in practices seeing / speaking to patients on the same day
they request an appointment.
GP Patient Survey Jan-Sept
2012
C&C Extended Hours
Specifically relating to Extended Hours we have found no evidence that provision is tested
against local requirements and there is variability in provision. In addition to this feedback
suggests patients are dissatisfied and confused with the current configuration of extended
hours.
LES Graphs
Feedback from Out of
Hospital Engagement event
Demand and Capacity Analysis
C&C Practice Access
There is evidence demand is not always matched to supply, particularly on a daily basis,
although some practices are achieving this. Southwark patients who cannot access a GP
service are more likely to choose and attend A&E as the alternative when compared to the
national average.
Currently A&E attendance data is not being reporting in a format which allows for
benchmarking against national average.
Demand & Capacity
A&E Activity Data
GP Patient Survey
A&E Attendance graph
Q&V Signposting
Feedback suggests that patients would benefit from better signposting of urgent care services
to ensure they access the right place at the right time. Feedback also suggests that
traditional signposting methods are not proving successful.
Feedback from Locality
Meetings
Feedback from Out of
Hospital Engagement event
Q&V
C&C
Pro-active Care for Long term Conditions
Data supported by qualitative feedback from patients suggests that some practices are not
embracing proactive care for patients with long-term conditions (take-up of healthchecks,
take up of ICP, screening and management of QOF for long-term conditions).
There is qualitative evidence that this group of patients access urgent hospital services as an
alternative to primary care. Feedback from practices suggests there is both a question
regarding the evidence base for Health Checks and their capacity to be able to deliver them.
Feedback from Out of
Hospital Engagement event
(LTC Group)
QOF Data
LES Data (Health Checks and
ICP)
Feedback from Locality
Meetings
Southwark
CCG
B&R B&W SSWK

ANALYSIS Access (3)
Domain Findings Data Sources
Q&V
C&C
Access to Diagnostics (e.g. Phlebotomy, ECGs, Ultrasound scans)
There is considerable variation at practice level in how and which enhanced services
are provided (e.g. Phlebotomy, including near patient testing / Warfarin). There is no
quantitative evidence around the availability of provision of other community
diagnostics (e.g. ECG, Ultrasound Scan) however qualitative feedback from patients
suggests this would be valued – no clear consensus emerging for patients for what
form that might take (i.e. Hub or every practice)
Enhanced Services
Feedback from Out of Hospital
Engagement event
C&C Pharmacist Use
Qualitative feedback from patients and potential providers (e.g. Pharmacists) was
that patients would like to see (and Pharmacists were capable of providing) a far
greater range of services, which would extend the opening hours and ease of access
for this type of service.
Extending the range of services where they are already successful and new initiatives
where they have the capability (e.g. Smoking cessation, screening, minor ailment)
Feedback from Out of Hospital
Engagement event
LES Smoking Cessation
C&C Range of GP led Outpatient Services
The following services were identified as being available in the community; Adult
Audiology, Dermatology, Headache / Neurology, ENT, Ophthalmology. There is limited
information on the patient eligibility for these services, performance monitoring or
whether this range of services remains appropriate currently. Patients reported they
were unclear about the rationale for their location.
Feedback from Out of Hospital
Engagement event
CCG Community Service
Descriptions
Q&V Transport
There was significant feedback from numerous stakeholders (including patients and
providers) that existing transport arrangements do not support the current and
planned location of services.
Feedback from Out of Hospital
Engagement event
Southwark
CCG
B&R B&W SSWK

ANALYSIS Access (4)
Domain Findings Data Sources
C&C Dementia Care QOF Performance
Whilst the quantitative analysis does not reveal a problem with dementia care in
identification or management within QOF requirements, qualitative feedback suggests
management of this condition in particular causes GP practices concern. There is no
objective data about the extent of comprehensive provision of care for this group.
Depression QOF & GPOS Domain
Total % QOF Points 2011-2012
showing locality and practice
variation
C&C Capacity and Capability
Qualitative feedback suggests;
•A need for mental health education and training for all healthcare professionals,
•A greater awareness of mental health issues
•Capacity in primary care to indentify and manage mental health issues in an integrated
manner with physical health.
Feedback from Out of Hospital
Engagement event
Q&V
C&C
A&E Activity
Qualitative feedback suggests that disproportionate numbers of A&E attendances are
generated by care home residents, with a peak of activity in the afternoon for this patient
group.
Stakeholder Interviews
C&C A&E Attendances
There is considerable variation (>100%) in A&E Minor attendance by practice, feedback from
locality meetings suggests this could be due specific practice demographics rather than
appointment availability. No evidence has been found that specific services or initiatives
are targeting these groups.
A&E Minors Graph
Feedback from Locality meetings
Southwark
CCG
B&R B&W SSWK

APPENDIX 1: DATA ANALYSIS

ANALYSIS
Category Description Appendix
CCG Level
Analysis
The CCG level analysis addresses the quality and variability, and capacity and capability across the
CCG across all metrics. This includes external benchmarking where possible and covers a range of
diverse measures
1A
Locality
Level
Analysis
The locality level analysis compares the three localities with each other and also with the internal or
external benchmarks where information is available. For some indicators, a comparison between the
various practices within each locality is also shown.
1B
Quality and
Variability
Quality is defined as the effectiveness and safety of care provided, together with patient perception
and feedback on the service. This also includes an assessment of the variability of this quality across
the CCG
Within
both 1A
and 1B
Capacity and
Capability
The capacity across primary and community care in Southwark, in terms of available and accessible
services and appointments, and the skills that exist across the CCG area in order to deliver both
existing and extended services
Document
and Strategy
Review
An overview of CCG strategies that impact on the Primary and Community Care Strategy. Note that
the SEL Community Based Care Strategy will be considered in more detail at the development of
options stage
1C
The following sections set out the detailed findings from the analysis. The Appendices are split into CCG level analysis (all
the analysis, focussing on the CCG as a whole) and Locality level analysis (comparison between locality). These appendices
include an assessment of both Quality and Variability, and Capacity and Capability.
Within each Appendix a series of tables highlight key findings from each chart, with the actual charts following the tables.
All findings are referenced to the relevant chart.
Structure and Presentation

APPENDIX 1A: CCG LEVEL ANALYSIS
Capacity & Capability
Key
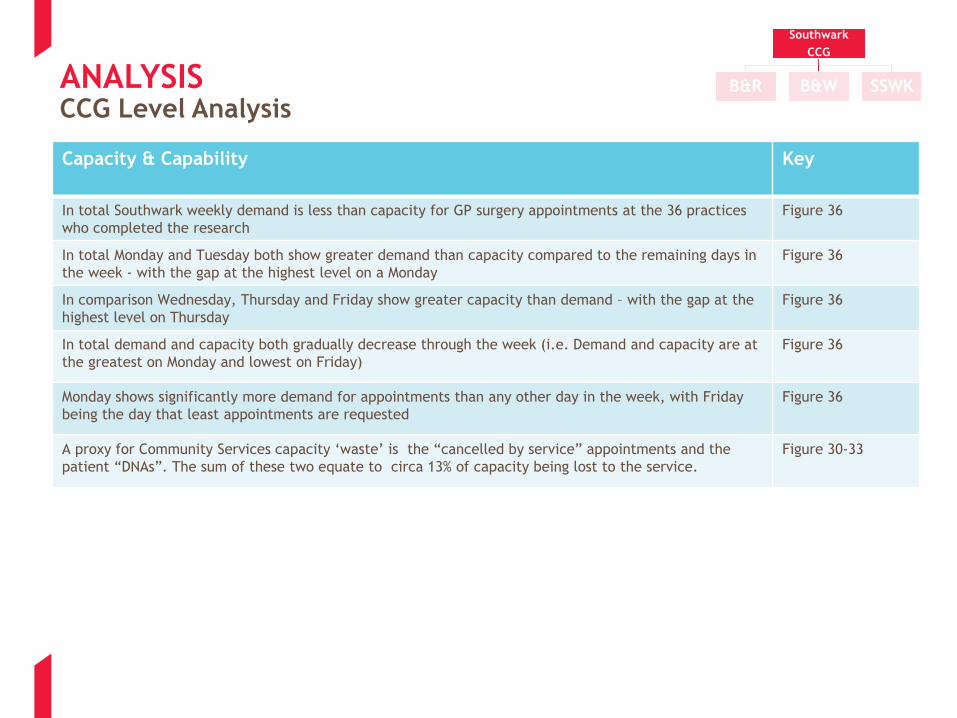
In total Southwark weekly demand is less than capacity for GP surgery appointments at the 36 practices
who completed the research
Figure 36
In total Monday and Tuesday both show greater demand than capacity compared to the remaining days in
the week - with the gap at the highest level on a Monday
Figure 36
In comparison Wednesday, Thursday and Friday show greater capacity than demand – with the gap at the
highest level on Thursday
Figure 36
In total demand and capacity both gradually decrease through the week (i.e. Demand and capacity are at
the greatest on Monday and lowest on Friday)
Figure 36
Monday shows significantly more demand for appointments than any other day in the week, with Friday
being the day that least appointments are requested
Figure 36
A proxy for Community Services capacity ‘waste’ is the “cancelled by service” appointments and the
patient “DNAs”. The sum of these two equate to circa 13% of capacity being lost to the service.
Figure 30-33
Southwark
CCG
B&R B&W SSWKANALYSIS CCG Level Analysis
ANALYSIS CCG Level Analysis
Quality and Variability
Key
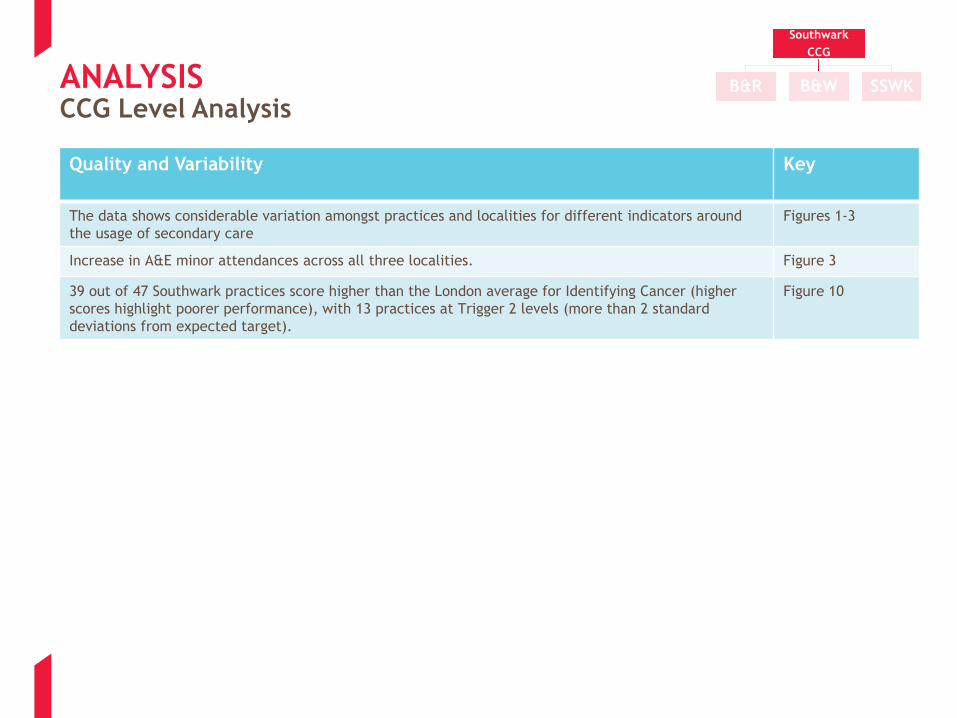
The data shows considerable variation amongst practices and localities for different indicators around
the usage of secondary care
Figures 1-3
Increase in A&E minor attendances across all three localities. Figure 3
39 out of 47 Southwark practices score higher than the London average for Identifying Cancer (higher
scores highlight poorer performance), with 13 practices at Trigger 2 levels (more than 2 standard
deviations from expected target).
Figure 10
Southwark
CCG
B&R B&W SSWK

ANALYSIS CCG Level Analysis
Quality and Variability
Key
A large proportion of practices in Southwark are in the bottom quartile nationally for screening indicators,
particularly for Diabetes
Figures 4-6
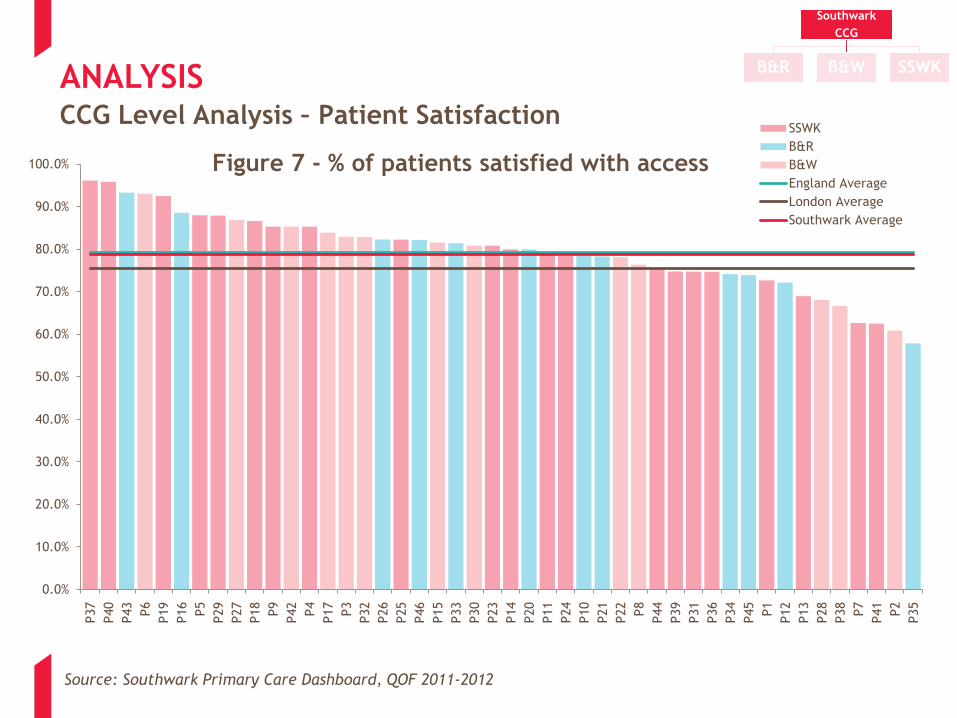
Over 40% of Southwark practices fall within the lower or 2nd quartile for patient satisfaction with access.
There is considerable variation amongst practices
Figure 7
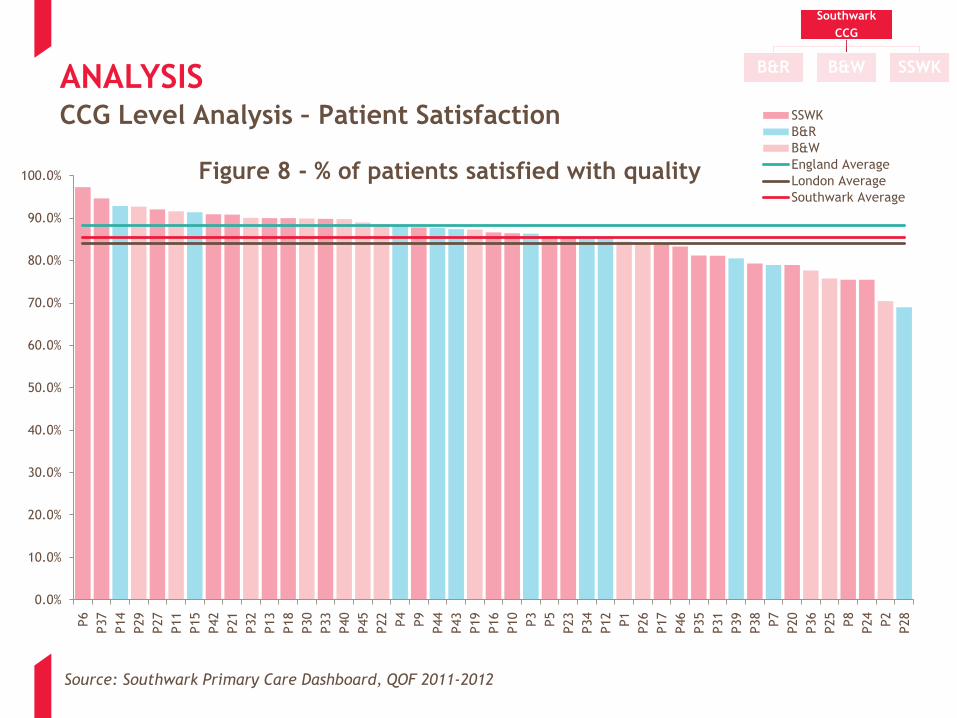
Around 2/3rd of Southwark practices fall within the lower or 2nd quartile for patient satisfaction with
quality. High levels of variation amongst practices
Figure 8
Southwark Mental health % QOF scores have huge variability within CCG. Southwark is also considerably
below the national average
Figure 9
Childhood Immunisation (Note: current year LES for immunisation has not been used as performance
figures are only available for Qtr 1 in 2012-13)
Despite the presence of a LES and a Community CQUIN for immunisation, Southwark does not achieve the
national average take up rate of 95% in 2011/12.
Figure 12
The is a marked fall off in rates in 2011/12 after the initial early years immunisations, so that children
appear not to be fully immunised before entering fulltime education.
Figure 12
There is a difference in 2011/12 between localities with South Southwark falling below the Southwark
average of 90%
Figure 12
The current year community CQUIN measurement is unclear in that the aim is to reduce the shortfall in
MMR, but it does not provide a clear indication of achievement. Potentially the targets are set too low at
50% and 40% reduced shortfall respectively for Under 5 and Under 2 years of age.
Figure 13-14
Its is of interest to note that the targets were not achieved at Q4 in the 2011 -12 Community CQUIN for
immunisation .
Figure 13-14
Southwark
CCG
B&R B&W SSWK

ANALYSIS CCG Level Analysis
Quality and Variability
Key
A large proportion of practices in Southwark are in the bottom quartile nationally for these indicators,
particularly for Diabetes
Figures 4-6
Minor Surgery (Note: this is 3 months data only)
Wide range of levels of activity undertaken, some practices undertaking much less per year which raises
clinical competency and thresholds for payment questions
Figure 16
Wide range of procedures undertaken, but majority are related to contraceptive care rather than typically
minor surgery?
Figure 17
A small number of practices typically under take the majority of the procedures, particularly relating to minor
surgery ( rather than contraception). Notably P5, P22 and P31 Excision and aspiration; and P35 cryotherapy.
Figures 18-20
Total amount of vasectomies undertaken across the CCGs is small with notable variation between localities
with SSW locality undertaking very few, even noting that this is just one quarter
Figure 21
There is some variation across the Practices for Flu Vaccine take up for the over 65s age group. With P8, P9,
P29 and P35 noticeably below the average
Figure 22
B&W locality are performing notably better than the two other localities for Flu Vaccine take up in the over 65s Figure 23
Very few Health Checks have been undertaken across the CCG by 31st December 2012. All but 5 Practices have
undertaken less than 10% of the Checks for eligible patients
Figure 24
Very few patients have been called for a Health Check demonstrating that the challenge is in the calling for
patients, rather than patients failing to respond
Figure 25
There is a direct correlation between those called for and those having had a Health Check completed for the
most successful Practice – e.g. P42 – it is suggestive that Health Checks are not carried out opportunistically
Figures 24-25
Southwark
CCG
B&R B&W SSWK

ANALYSIS CCG Level Analysis
Quality and Variability
Key
Limited outcome data is available on the Integrated Care Programme. Whilst almost half of GP practices have signed
up for the ICP LES, a very small number appear to have created the register to enable Patient to be called for the
Holistic Health -Assessment (HHA) and therefore only a small number (4%) of those eligible for an HHA have had one.
Figure 26
All patients following an HHA have some type of intervention with approximately 20% being given advise by the
assessor and 80% being referred on for further advise/intervention
Figure 26
Community services appeared to not achieve the falls CQUIN target in 2011-12. Although falls are presumably still
measured, there is no CQUIN for Falls in the current year.
Figure 29
The LES Contract for smoking states;
…For Practices that achieve a successful quit ratio of 35% or above that will be rated as green for Practices that
achieve a successful quit ratio between 28% and 34% will be rated as amber. For all practices that achieve less than
28% will be rated as red...
This does not affect payment but may be seen as an indicator for effectiveness with the CCG deciding whether to
take forward Practice LESs where the “Set to Quit” percentage is less than 30%
Figures
27-28
Southwark CCG set to quit rate is currently less than 30%, although it is recognised that the final quarter typically
has a good return. Even the 30% target is well short of London average Set to Quit rate of 46%.
Figures
27-28
It is interesting to note that although Community Pharmacy Set to Quit rate is only marginally higher than that of the
GPs, the verification by CO2 levels is significantly higher.
Figures
27-82
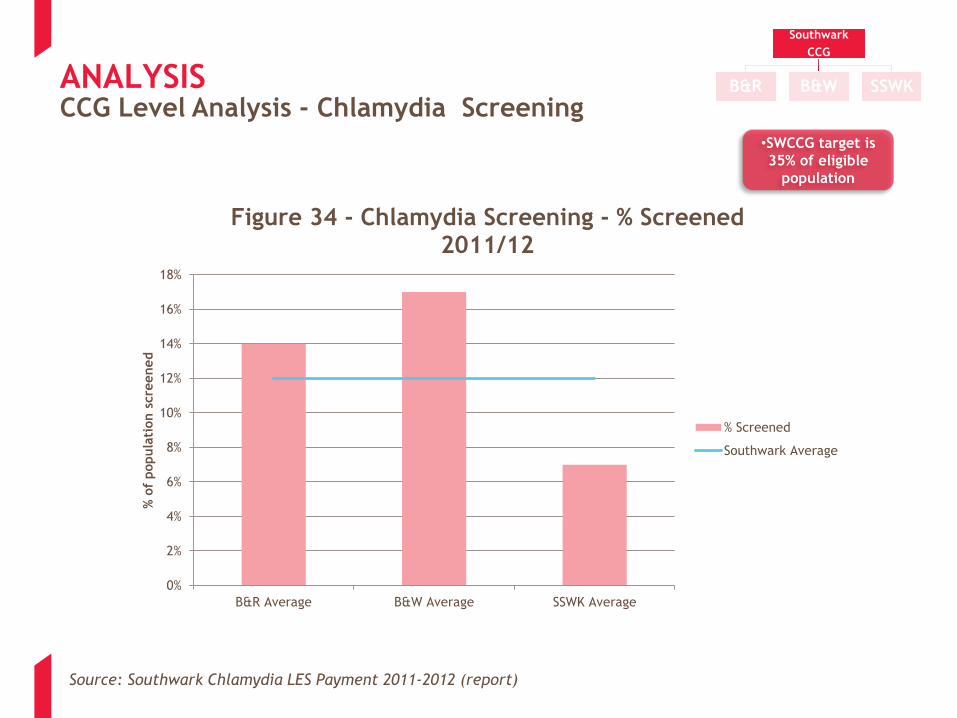
The CCG achievement of 12% Chlamydia screening of the target population for 2011-12 falls very short of the 35%
CCG target.
SSW Locality achieved just over 6% as the lowest performing Locality and B&W Locality the highest with 17%
Figure 34
Interesting to note is those Practices which appear to have a LES are not necessarily the highest performers – P1,
P5, P33, P35 are below the Southwark average for Chlamydia screening
Figure 35
Southwark
CCG
B&R B&W SSWK

ANALYSIS CCG Level Analysis – Outpatient Activity
Southwark
CCG
B&R B&W SSWK
Source: SCCG Practice Trend Analysis, 2012-2013
-
20.00
40.00
60.00
80.00
100.00
120.00
140.00
160.00
180.00
200.00
P1
P2
P3
P4
P5
P6
P7
P8
P9
P10
P11
P12
P13
P14
P15
P16
P17
P18
P19
P20
P21
P22
P23
P24
P25
P26
P27
P28
P29
P30
P31
P32
P33
P34
P35
P36
P37
P38
P39
P40
P41
P42
P43
P44
P45
P46
B&
R
B&
W
SSO
SO
U
Rate
per
1000
Figure 1 - Outpatient New
2012/13

ANALYSIS CCG Level Analysis – A&E Activity
Southwark
CCG
B&R B&W SSWK
Source: SCCG Practice Trend Analysis, 2012-2013
-
50.00
100.00
150.00
200.00
250.00
300.00
P1
P2
P3
P4
P5
P6
P7
P8
P9
P10
P11
P12
P13
P14
P15
P16
P17
P18
P19
P20
P21
P22
P23
P24
P25
P26
P27
P28
P29
P30
P31
P32
P33
P34
P35
P36
P37
P38
P39
P40
P41
P42
P43
P44
P45
P46
B&
R
B&
W
SSO
SO
U
Rate
per
1000
Figure 2 - A&E (Combined)
2012/13

ANALYSIS
Source: SCCG Practice Trend Analysis, 2012-2013
CCG Level Analysis – A&E Minors Activity
-
10.00
20.00
30.00
40.00
50.00
60.00
70.00
80.00
P1
P2
P3
P4
P5
P6
P7
P8
P9
P10
P11
P12
P13
P14
P15
P16
P17
P18
P19
P20
P21
P22
P23
P24
P25
P26
P27
P28
P29
P30
P31
P32
P33
P34
P35
P36
P37
P38
P39
P40
P41
P42
P43
P44
P45
P46
B&
R
B&
W
SSO
SO
U
A&
E M
inor
Acti
vit
y
per
1000 p
opula
tion
Figure 3 - A&E Band 5 (Minors) Activity 2012-2013
Southwark
CCG
B&R B&W SSWK

26
35
27
42
14
7
12
3
5
3 6
1 6
1 1
Hypertension CHD COPD Diabetes
Figure 4 - QOF Prevalence as Ratio of Expected (practices by quartile)
Lower quartile 2nd quartile 3rd quartile Upper quartile
This graph shows the number of
practices in Southwark falling into
each national quartile, for the
screening indicators when comparing
patients with clinical conditions as
ratio of expected
ANALYSIS CCG Level Analysis – Long Term Conditions
Source: Southwark Primary Care Dashboard, QOF 2011-2012
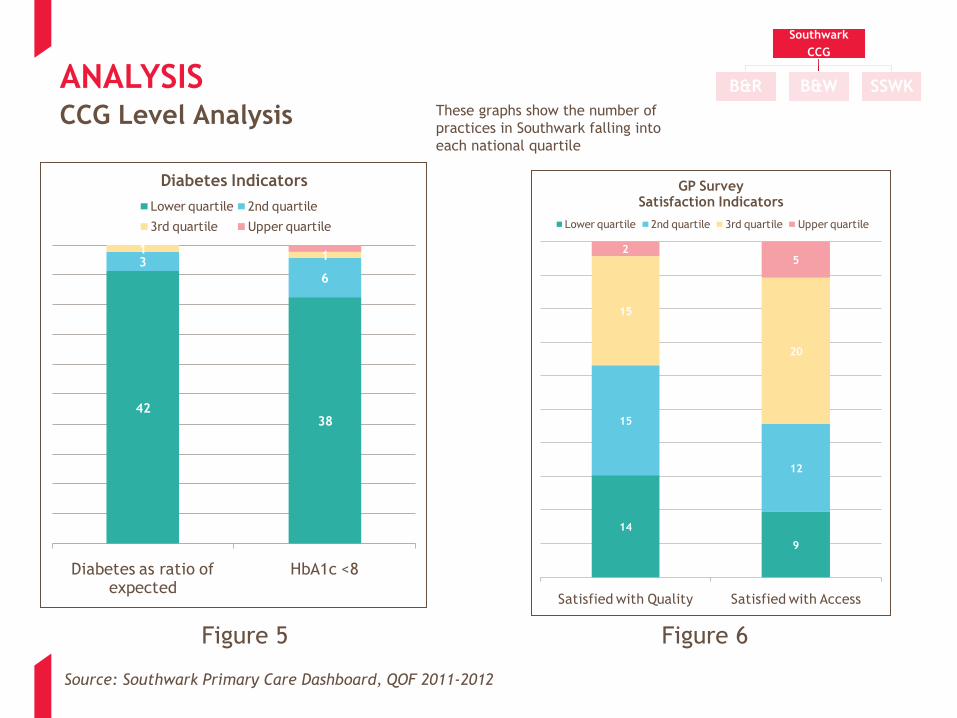
4238
3
6
11
Diabetes as ratio of expected
HbA1c <8
Diabetes Indicators
Lower quartile 2nd quartile
3rd quartile Upper quartile
14
9
15
12
15
20
25
Satisfied with Quality Satisfied with Access
GP Survey Satisfaction Indicators
Lower quartile 2nd quartile 3rd quartile Upper quartile
Figure 5 Figure 6
ANALYSIS CCG Level Analysis
Southwark
CCG
B&R B&W SSWK
Source: Southwark Primary Care Dashboard, QOF 2011-2012
These graphs show the number of
practices in Southwark falling into
each national quartile
0.0%
10.0%
20.0%
30.0%
40.0%
50.0%
60.0%
70.0%
80.0%
90.0%
100.0%
P37
P40
P43
P6
P19
P16
P5
P29
P27
P18
P9
P42
P4
P17
P3
P32
P26
P25
P46
P15
P33
P30
P23
P14
P20
P11
P24
P10
P21
P22
P8
P44
P39
P31
P36
P34
P45
P1
P12
P13
P28
P38
P7
P41
P2
P35
Figure 7 - % of patients satisfied with access
SSWK
B&R
B&W
England Average
London Average
Southwark Average
ANALYSIS CCG Level Analysis – Patient Satisfaction
Source: Southwark Primary Care Dashboard, QOF 2011-2012
Southwark
CCG
B&R B&W SSWK
0.0%
10.0%
20.0%
30.0%
40.0%
50.0%
60.0%
70.0%
80.0%
90.0%
100.0%
P6
P37
P14
P29
P27
P11
P15
P42
P21
P32
P13
P18
P30
P33
P40
P45
P22
P4
P9
P44
P43
P19
P16
P10
P3
P5
P23
P34
P12
P1
P26
P17
P46
P35
P31
P39
P38
P7
P20
P36
P25
P8
P24
P2
P28
Figure 8 - % of patients satisfied with quality
SSWK
B&R
B&W
England Average
London Average
Southwark Average
ANALYSIS CCG Level Analysis – Patient Satisfaction
Southwark
CCG
B&R B&W SSWK
Source: Southwark Primary Care Dashboard, QOF 2011-2012

ANALYSIS CCG Level Analysis – Mental Health
Source: Quality Outcomes Framework, 2011-2012
50.0%
55.0%
60.0%
65.0%
70.0%
75.0%
80.0%
85.0%
90.0%
95.0%
100.0%
% P
oin
ts S
core
d
Figure 9 - Mental Health Domain Total % QOF Points 2011-2012 showing locality and practice variation
B&R B&W
National
Average
SSWK Sou
Southwark
CCG
B&R B&W SSWK
For Southwark Mental Health
Domain Total % QOF points graph
below there are three practices
scoring below 55.5% and eleven
practices scoring 100%
ANALYSIS CCG Level Analysis - Cancer
Southwark
CCG
B&R B&W SSWK
Source: General Practice Outcomes Standards, 2011-2012
0.00
0.50
1.00
1.50
2.00
2.50
3.00
Poin
ts S
core
d
Figure 10 - Identifying Cancer Points Achieved using General Practice Outcomes Standards Framework showing Southwark
locality and practice variation
London
Average
SSWK Sou B&R B&W
The dots on the chart show that
for Southwark Cancer Domain
Total % QOF points there is one
practice scoring below 0.50 and
one practice scoring 3.0
High scores highlight good
performance
39 out of 47 Southwark practices score
higher than the London average for
Identifying Cancer (higher scores
highlight poorer performance), with
13 practices at Trigger 2 levels (more
than 2 standard deviations from
expected target).

ANALYSIS CCG Level Analysis - Screening
Southwark
CCG
B&R B&W SSWK
Source: General Practice Outcomes Standards, 2011-2012
30.00
40.00
50.00
60.00
70.00
80.00
90.00
% P
oin
ts
Figure 11 - Cervical Cytology Points Achieved using General Practice Outcomes Standards Framework showing Southwark
locality and practice variation
London
Average
SSWK Sou B&R B&W
The dots on the chart show that
for Southwark Mental Health
Domain Total % QOF points there is
one practice scoring below 40.0
and one practice scoring above
84.0
High scores highlight good
performance

ANALYSIS CCG Level Analysis – Childhood Immunisation Rates
Southwark
CCG
B&R B&W SSWK
0.0
10.0
20.0
30.0
40.0
50.0
60.0
70.0
80.0
90.0
100.0
B&R Average B&W Average SSWK Average Southwark Average
% o
f C
hildre
n I
mm
unis
ed
Figure 12 - 2011/12 Southwark Immunisation Rates by Locality
U2 Average
U5 Average
National Target*
Source: Southwark Childhood Immunisation data 2011/12 *Department of Health Strategic Document, 2011 http://www.londonhp.nhs.uk/wp-content/uploads/2011/03/Childhood-
Immunisation-Appendices.pdf

Source: Community CQUIN Report Qtr 3 2012-13 v5
CCG Level Analysis – Childhood Immunisation Rates
ANALYSIS
0
10
20
30
40
50
60
Q1 Q2 Q3 Q4
% a
chie
vem
ent
of
targ
et
Figure 13 - Reduced shortfall of MMR 2 immunisations through Health Visitor
Team involvement
Actual
Target
0
10
20
30
40
50
60
Q1 Q2 Q3 Q4
% a
chie
vem
nt
of
targ
et
Figure 14 - Reduced shortfall of preschool booster immunisations
through Health Visitor Team involvement
Actual
Target
Southwark
CCG
B&R B&W SSWK
CCG Level Analysis – Childhood Immunisation Rates
ANALYSIS
0%
5%
10%
15%
20%
25%
30%
35%
40%
45%
50%
1st DTaP/IPV/Hib PCV 1st MMR 2nd MMR Preschool Booster
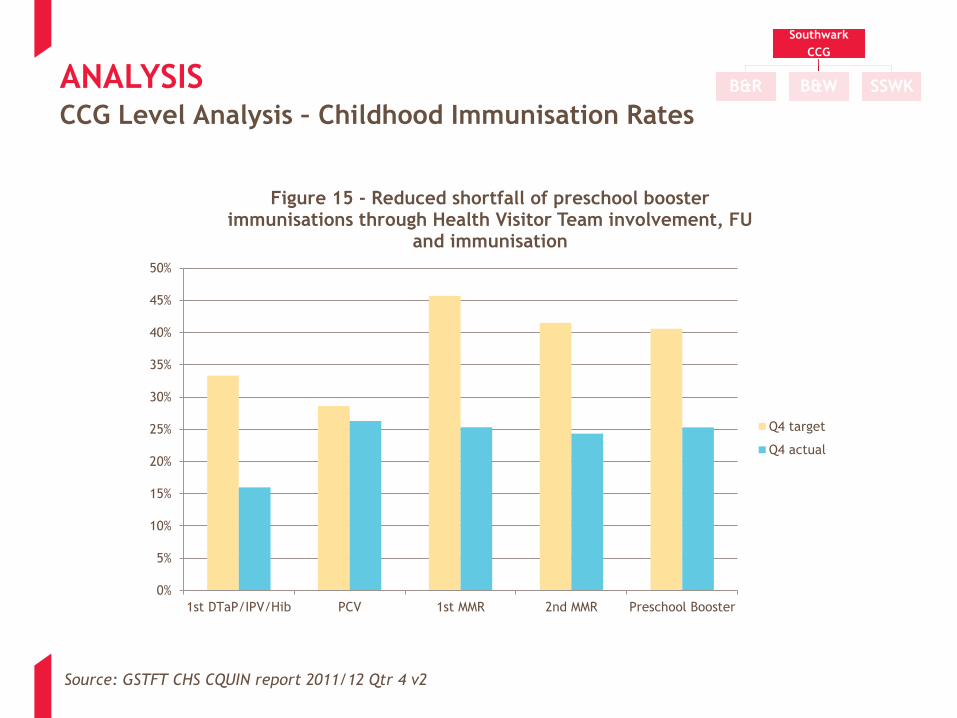
Figure 15 - Reduced shortfall of preschool booster immunisations through Health Visitor Team involvement, FU
and immunisation
Q4 target
Q4 actual
Source: GSTFT CHS CQUIN report 2011/12 Qtr 4 v2
Southwark
CCG
B&R B&W SSWK

Source Document: “QMS Stats on date 2012/12/31for Southwark PCT” Data for latest 3 months available ending 31 Dec 2012
CCG Level Analysis – Minor Surgery
ANALYSIS
0 50 100 150 200 250 300 350
Injection of sclerosing substance into haemorrhoid
Morning after IUDs fitted
IUDs replaced
Other minor surgery
IUDs removed
Check of Mirena coil
Bilateral vasectomy for contraception
Patients with IUS (Mirena) removed
Removal of Mirena coil
Cautery
Implant insertion - non-contraceptive
Patients with Dermal implant removed
Removal of subcutaneous contraceptive
Use of non-specific minor surgery codes
IUDs checked
Patients with IUD removed
Injection
Patients with IUS (Mirena) fitted
Patients with IUD fitted
Introduction of Mirena coil
Patients with Dermal implant fitted
Insertion of subcutaneous contraceptive
IUDs fitted
Cryotherapy
Excision
Aspiration
Injections of Goserelin / Leuprorelin Acetate
Number of Procedures in 3 months
Figure 16 - Minor Surgery - All Procedure Types (Southwark CCG)
Southwark
CCG
B&R B&W SSWK

Source Document: “QMS Stats on date 2012/12/31for Southwark PCT” Data for latest 3 months available ending 31 Dec 2012
CCG Level Analysis – Minor Surgery
ANALYSIS
0
50
100
150
200
250
300
350
400
P5
P35
P1
P11
P31
P21
P2
P30
P38
P22
P34
P10
P32
P45
P15
P20
P42
P46
P8
P28
P44
P47
P6
P29
P14
P37
P17
P33
P39
P18
P27
P26
P7
P19
P12
P36
P23
P13
P25
P16
P24
P40
P4
P41
P3
P9
Num
ber
of
Pro
cedure
s
Figure 17 - Total Number of Minor Surgery Procedures - Southwark CCG
Southwark
CCG
B&R B&W SSWK

Source Document: QMS Stats on date 20121231 for Southwark PCT. Data for latest 3 months available ending 31 Dec 2012
CCG Level Analysis – Minor Surgery
ANALYSIS
0
10
20
30
40
50
60
P35 P1 P38 P11 P5 P22
Num
ber
of
Pro
cedure
s in
3 m
onth
s
Figure 18 - Cryotherapy (Total procedures = 170)
0
5
10
15
20
25
30
35
P5 P31 P22 P45 P30 P33 P44
Num
ber
of
Pro
cedure
s in
3 m
onth
s
Figure 19 - Aspiration (Total procedures = 229)
0
10
20
30
40
50
60
70
P5 P31 P22 P34 P11 P1 P10
Num
ber
of
pro
cedure
s in
3 m
onth
s
Figure 20 - Excision (Total procedures = 207)
0
5
10
15
20
B&R B&W SSWK SouthwarkTotal
Num
ber
of
Pro
cedure
s in
3 m
onth
s
Figure 21 - Bilateral Vasectomy for Contraception (shown by Locality due to low volume) (Total
procedures = 17)
Southwark
CCG
B&R B&W SSWK

Source Document: Flu take up Current Year to Date: Flu payments (report) Sept-Jan 2013 as at 20130219
CCG Level Analysis – Flu Vaccine
ANALYSIS
0
10
20
30
40
50
60
70
80
90
P4 P19 P23 P30 P38 P41 P7 P14 P17 P22 P32 P43 P1 P3 P9 P12 P15 P25 P28 P34 P36 P40 P44
% o
f pati
ent
upta
ke
Figure 22 - Flu Vaccine Uptake Over 65s (2012/13 YTD)
% Uptake
Southwark Average
LES Target
Southwark
CCG
B&R B&W SSWK

CCG Level Analysis – Flu Vaccine
ANALYSIS
66
67
68
69
70
71
72
73
74
75
B&R Average B&W Average SSWK Average Southwark Average
% o
f pati
ent
upta
ke
Figure 23 - 2012/13 Over 65s Flu Vaccination Uptake by Locality
% Uptake
Source Document: Flu take up Current Year to Date: Flu payments (report) Sept-Jan 2013 as at 20130219
Southwark
CCG
B&R B&W SSWK

Source Document: “QMS Stats on date 2012/12/31 for Southwark PCT “ *Health checks started in January 2012
CCG Level Analysis – Health Checks
ANALYSIS
0%
5%
10%
15%
20%
25%
30%
35%
P41
P3
P9
P36
P39
P38
P29
P8
P30
P19
P4
P40
P16
P43
P28
P46
P13
P24
P12
P23
P45
P33
P18
P1
P44
P20
P25
P22
P7
P10
P15
P2
P35
P21
P26
P31
P27
P32
P11
P34
P5
P37
P6
P14
P17
P42
Figure 24 - Southwark CCG - % of patients with NHS Health Check in last 5 years* (eligible at time of check)
% o
f eligib
le P
ati
ents
wit
h H
ealt
h C
heck c
om
ple
ted
LES target % expected to
be invited in 12-13
LES target % expected to
be completed in 12-13
Southwark
CCG
B&R B&W SSWK

CCG Level Analysis – Health Checks
ANALYSIS
0%
10%
20%
30%
40%
50%
60%
70%
80%
90%
100%
P41
P3
P9
P42
P17
P14
P6
P37
P11
P32
P5
P34
P27
P21
P35
P7
P26
P31
P2
P15
P10
P22
P23
P25
P44
P1
P18
P20
P33
P45
P24
P46
P13
P43
P12
P28
P16
P40
P19
P4
P30
P8
P29
P38
P39
P36
Figure 25 - Southwark CCG - % of patients currently eligible for NHS Health Check, WITHOUT an invitation (or check) in last 5 years
% o
f eligib
le P
ati
ents
wit
h n
o H
ealt
h C
heck o
r invit
e
Source Document: “QMS Stats on date 2012/12/31 for Southwark PCT”
Southwark
CCG
B&R B&W SSWK

Source Document: “QMS Stats on date 2012/12/31 for Southwark PCT”
CCG Level Analysis – Integrated Care Programme
ANALYSIS
0%
10%
20%
30%
40%
50%
60%
70%
80%
90%
100%
Percentage of Practicessigned-up
Patients on ICP Register- Elderly at Risk
Patients on the ICPregister who are eligible
for a Holistic HealthAssessment
HHAs carried out yearto date
Of patients having hadan HHA % referred orsignposted to other
services
Of patients having hadan HHA % given healthpromotion and lifestyle
advice
% A
chie
vem
ent
Figure 26 – ICP Achievement Against Range of Requirements (2011-2012)
Southwark
CCG
B&R B&W SSWK

Source: Local Outcome Summary Report: GP YTD 220213 (Smoking) and Local Outcome Summary Report: CP YTD 220213 (Smoking)
ANALYSIS
•CCG target % Quitters at 4 wks (Set to Quit) = 30%
•London average % Quitters at 4 wks 2011-12 = 46%
CCG Level Analysis – Smoking Cessation
0%
10%
20%
30%
40%
50%
60%
70%
% quitters at 4weeks
% CO verified(of quitters)
% not quit % lost to followup
Figure 27 - Southwark CCG GP Totals: Quitters at 4 weeks
0%
10%
20%
30%
40%
50%
60%
70%
80%
90%
% quitters at4 weeks
% COverified (ofquitters)
% not quit % lost tofollow up
% notreported
Figure 28 - Community Pharmacy Totals: Quitters at 4 weeks
Southwark
CCG
B&R B&W SSWK

Source: GSTFT CHS CQUIN Report 2011-12 Qtr 4 V2; Actual number of falls for patients admitted to community services at GSTFT except Inpatients
ANALYSIS CCG Level Analysis - Community Services
0
5
10
15
20
25
30
35
40
Q1 Q2 Q3 Q4
Num
ber
of
Falls
Figure 29 - Number of falls 2011-12 outturn Lambeth and Southwark
Number of Falls
Target
Southwark
CCG
B&R B&W SSWK
Annual target only appears to have been
set; showing in Q4

ANALYSIS CCG Level Analysis – Community Services
0
500
1000
1500
2000
2500
3000
3500
4000
1 2 3 4 5 6 7 8 9
Num
ber
of
Appoin
tments
Month
Figure 30 - Number of Cancelled Appts in Community Services
0
2
4
6
8
10
12
1 2 3 4 5 6 7 8 9
Num
ber
of
Appoin
tments
Month
Figure 31 - Percentage of Cancelled Appts in Community Services
0
500
1000
1500
2000
2500
1 2 3 4 5 6 7 8 9
Num
ber
of
Appoin
tments
Month
Figure 32 - Number of DNAs to Community Services
0
1
2
3
4
5
6
1 2 3 4 5 6 7 8 9
Num
ber
of
Appoin
tments
Month
Figure 33 - Percentage of DNAs to Community Services
Source: CHS Combined Commissioner reports January-September 2012-13
Southwark
CCG
B&R B&W SSWK
ANALYSIS
Source: Southwark Chlamydia LES Payment 2011-2012 (report)
•SWCCG target is
35% of eligible
population
CCG Level Analysis - Chlamydia Screening
0%
2%
4%
6%
8%
10%
12%
14%
16%
18%
B&R Average B&W Average SSWK Average
% o
f popula
tion s
cre
ened
Figure 34 - Chlamydia Screening - % Screened 2011/12
% Screened
Southwark Average
Southwark
CCG
B&R B&W SSWK

ANALYSIS
Source: Southwark Chlamydia LES Payment 2011-2012 (report), sorted by LES holding Practices
•SWCCG target is
35% of eligible
population
CCG Level Analysis - Chlamydia Screening
0%
10%
20%
30%
40%
50%
60%
P1 P2 P5 P7 P11 P18 P21 P24 P30 P33 P35 P38 P43 P46
% o
f pati
ents
scre
ened
Figure 35 - Chlamydia Screening - % Screened Practices with LES
% Patients Screened
Southwark Average
Southwark
CCG
B&R B&W SSWK

ANALYSIS
The Demand and Capacity analysis represented the first of a several stage process, and as such is only a ‘snapshot’ of
the annual picture. The findings should be viewed simultaneously in order to provide a complete picture of the situation
for the period studied- no single graph can be interpreted in isolation. It is possible to infer the following conclusions:
a) Southwark weekly demand and capacity graph highlights that, broadly speaking patient demand is met by capacity
supplied during the week across the CCG- but see note (f) on capacity supplied (Figure 36).
b) When investigated further, total practice level demand:capacity suggests there is considerable variation between
practice demand and capacity, with many practices having more capacity than demand over the week. However
some of this may include excess nursing capacity (Figure 37).
c) In order to understand this variation on a daily basis, two practices which showed equal demand and capacity (i.e.
Offering equal appointments to patient demand) were chosen to be analysed from the perspective of daily variation.
This highlighted that one practice was consistently offering appointments equal to demand (or offering extra
appointments on a daily basis), whereas the other had significant fluctuations in daily appointments (on certain days
they were offering too many appointments for the demand but on others they were offering less than the total
demand (Figures 38-39)).
d) To provide benchmarking where available, RCGP research in England suggested practices routinely offering more
than 70 GP appointments per 1,000 patients per week were more often able to meet patient demand than those
offering fewer than 70. Those offering a supply of less than 70 GP appointments per 1,000 per week often
experienced difficulty with access.
e) In addition, the RCGP estimated that in the closest available benchmark for total capacity (GP and nursing) the
contact rate for Scottish practices was approximately 83 face to face contacts per 1,000 patients per week, (62 of
these being GP contacts) for an average standardised practice. It is likely that many practices would require more
than this in order to meet demand.
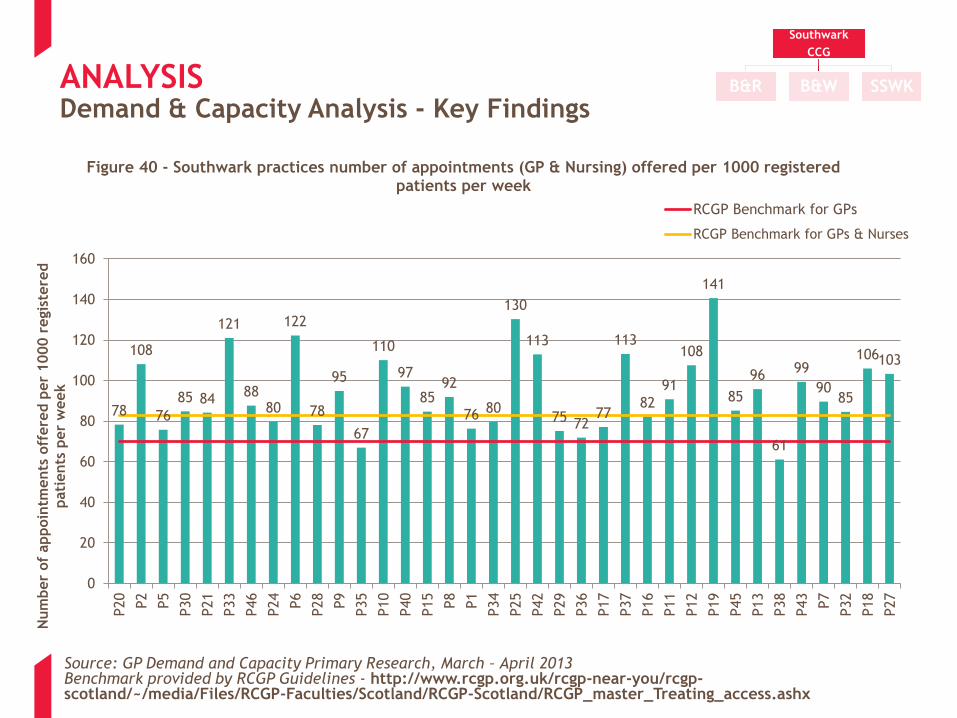
f) More than 95% of practices in Southwark offer more than 70 total appointments per 1,000 patients per week, and
65% offer more than 83 total appointments per week, suggesting in general terms across the CCG that access issues
largely relate to daily demand variation, and high levels of demand, rather than capacity supplied (Figures 37 and
40).
Demand & Capacity Analysis - Key Findings
Southwark
CCG
B&R B&W SSWK

Source: GP Demand and Capacity Primary Research, March – April 2013
0
5000
10000
15000
20000
25000
30000
Monday Tuesday Wednesday Thursday Friday Total
Weekly
Dem
and a
nd C
apacit
y
Figure 36 - Southwark Total Weekly Demand and Capacity
Capacity
Demand
Southwark
CCG
B&R B&W SSWKANALYSIS Demand & Capacity Analysis - Key Findings

Source: GP Demand and Capacity Primary Research, March – April 2013
Capacit
y >
Dem
and
Dem
and
>
Capacit
y
0.00
0.50
1.00
1.50
2.00
2.50
3.00
3.50
4.00
P20
P2
P5
P30
P21
P33
P46
P9
P35
P10
P40
P15
P8
P1
P34
P25
P42
P29
P36
P17
P37
P16
P11
P12
P19
P45
P13
P38
P43
P7
P32
P18
P27
Weekly
Rati
o o
f C
apacit
y:D
em
and
Figure 37 - Southwark Total Weekly Capacity:Demand Ratio
Southwark
CCG
B&R B&W SSWK
Outlier practices excluded
ANALYSIS Demand & Capacity Analysis - Key Findings

0.00
0.20
0.40
0.60
0.80
1.00
1.20
1.40
1.60
Rati
o o
f C
apacit
y:D
em
and
Figure 39 - Practice 9 Daily Capacity:Demand Ratio
0.00
0.20
0.40
0.60
0.80
1.00
1.20
1.40
1.60
Rati
o o
f C
apacit
y:D
em
and
Figure 38 - Practice 30 Daily Capacity:Demand Ratio
Source: GP Demand and Capacity Primary Research, March – April 2013
Southwark
CCG
B&R B&W SSWK
Illustration of practices with seemingly well matched demand and
capacity on a weekly basis – this can mask daily variation which is critical
to consider – see Figure 39
ANALYSIS Demand & Capacity Analysis - Key Findings
Source: GP Demand and Capacity Primary Research, March – April 2013 Benchmark provided by RCGP Guidelines - http://www.rcgp.org.uk/rcgp-near-you/rcgp-scotland/~/media/Files/RCGP-Faculties/Scotland/RCGP-Scotland/RCGP_master_Treating_access.ashx
Southwark
CCG
B&R B&W SSWKANALYSIS Demand & Capacity Analysis - Key Findings
78
108
76
85 84
121
88 80
122
78
95
67
110
97
85 92
76 80
130
113
75 72 77
113
82
91
108
141
85
96
61
99
90 85
106 103
0
20
40
60
80
100
120
140
160
P20
P2
P5
P30
P21
P33
P46
P24
P6
P28
P9
P35
P10
P40
P15
P8
P1
P34
P25
P42
P29
P36
P17
P37
P16
P11
P12
P19
P45
P13
P38
P43
P7
P32
P18
P27
Num
ber
of
appoin
tments
off
ere
d p
er
1000 r
egis
tere
d
pati
ents
per
week
Figure 40 - Southwark practices number of appointments (GP & Nursing) offered per 1000 registered patients per week
RCGP Benchmark for GPs
RCGP Benchmark for GPs & Nurses

ANALYSIS CCG Level Analysis - GP Patient Survey
Source: GP Patient Survey Results Jan – Sept 2012
Southwark
CCG
B&R B&W SSWK
38
28
3
12
2
11 7
39
25
4 9
3
13 10
Went to theappointment Iwas offered
Got anappointment
for a differentday
Had aconsultation
over the phone
Went to A&E/ awalk-in centre
Saw apharmacist
Decided tocontact my
surgery anothertime
Didnt see orspeak toanyone
Figure 42 - What did you do on that occasion?
Southwark
National Average
52
20 11
7
49
18 11 13
There weren'tappointments for the day I
wanted
There weren'tappointments for the time
I wanted
I couldnt see my preferredGP
I couldn't book ahead atmy GP surgery
Figure 41 - Reason for not being able to get an appointment/ appointment offered inconvenient
Southwark
National Average

ANALYSIS CCG Level Analysis - GP Patient Survey
Source: GP Patient Survey Results Jan – Sept 2012
Southwark
CCG
B&R B&W SSWK
0
5
10
15
20
25
30
35
40
On the same day On the next workingday
A few days later A week or morelater
Figure 43 - How long was it until you actually saw or spoke to a GP/Nurse
Southwark
National Average

ANALYSIS CCG Level Analysis - GP Patient Survey
Source: GP Patient Survey Results Jan – Sept 2012
Southwark
CCG
B&R B&W SSWK
0%
10%
20%
30%
40%
50%
60%
70%
P4 P19 P23 P30 P38 P41 P7 P14 P17 P22 P32 P44 P1 P3 P9 P12 P15 P25 P28 P34 P36 P40 P45
% o
f appoin
tments
on t
he s
am
e d
ay
Figure 44 - How long was it until you actually saw/spoke to a GP/Nurse? (% On the same day)
Southwark Average
ANALYSIS
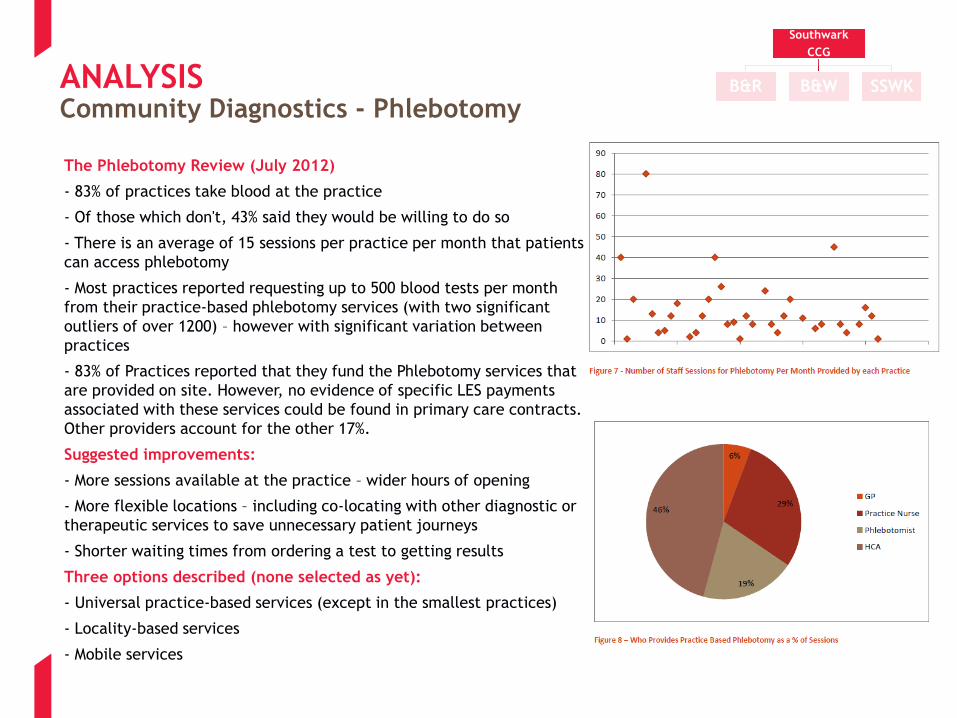
The Phlebotomy Review (July 2012)
- 83% of practices take blood at the practice
- Of those which don't, 43% said they would be willing to do so
- There is an average of 15 sessions per practice per month that patients
can access phlebotomy
- Most practices reported requesting up to 500 blood tests per month
from their practice-based phlebotomy services (with two significant
outliers of over 1200) – however with significant variation between
practices
- 83% of Practices reported that they fund the Phlebotomy services that
are provided on site. However, no evidence of specific LES payments
associated with these services could be found in primary care contracts.
Other providers account for the other 17%.
Suggested improvements:
- More sessions available at the practice – wider hours of opening
- More flexible locations – including co-locating with other diagnostic or
therapeutic services to save unnecessary patient journeys
- Shorter waiting times from ordering a test to getting results
Three options described (none selected as yet):
- Universal practice-based services (except in the smallest practices)
- Locality-based services
- Mobile services
Community Diagnostics - Phlebotomy
Southwark
CCG
B&R B&W SSWK
APPENDIX 1B: LOCALITY LEVEL ANALYSIS

ANALYSIS Locality Level Analysis – South Southwark (SSWK)
Quality and Variability
Key
Lowest scoring depression assessment scores compared to localities with one practice scoring significantly
below national average which is bringing the average for both locality and CCG down
Figure 50
Overall South Southwark Locality is performing below CCG average and below B&R and B&W for Under 2
childhood immunisation rates
Figure 46
Four practices are the main drivers of South Southwark Locality’s below average performance for
childhood immunisation in the under 2s and the under 5s
Practice P3, P29 , P34 and P36 are the main contributors to the low averages
Figure 46
There is variation in the amount of minor surgery undertaken across the South Southwark locality with
one practice (P35) undertaking the most and some undertaking very little
Figure 45
A number of practices in South Southwark are performing well for Flu Vaccines, notably P20, P25, P34,
P36, P37 and P44
Figure 47
A number of practice in South Southwark are not performing as well for Flu Vaccines, notably P9, P29,
P35 and P45
Figure 47
A small number of South Southwark Locality GP practices are achieving high rate of Quitters at 4 weeks: –
P35, P37 and P45
Figure 48
South Southwark Locality is performing below the Southwark CCG level of achievement for Chlamydia ,
particularly P1, P2, P15, P20, P36 and P40
Figure 49
Southwark
CCG
B&R B&W SSWK

ANALYSIS Locality Level Analysis: SSWK Minor Surgery
Figure 45
0
50
100
150
200
250
P3
5
P1
P2
P3
4
P1
0
P4
5
P1
5
P2
0
P4
2
P4
6
P2
8
P6
P2
9
P3
7
P2
6
P1
2
P3
6
P1
3
P2
5
P4
0
P3
P9
Total Number of Minor Surgery Procedures -SSWK Locality
QMS Stats on date 20121231 for Southwark PCT. Data for latest 3 months available ending 31 Dec 2012: sorted by Locality Practice
Southwark
CCG
B&R B&W SSWK

Locality Level Analysis: SSWK Childhood immunisation ANALYSIS
Southwark Childhood Immunisation data 2011/12 sorted by Locality Practice
Southwark
CCG
B&R B&W SSWK
0.0
10.0
20.0
30.0
40.0
50.0
60.0
70.0
80.0
90.0
100.0
P1 P2 P3 P6 P9 P10 P12 P13 P15 P20 P25 P26 P28 P29 P34 P35 P36 P37 P40 P42 P44 P45
%
Figure 46 - 2011/12 Childhood Immunisation Rates % - SSWK Locality
U2 Average
U5 Average
SOU U2
SOU U5

ANALYSIS Locality Level Analysis: SSWK Flu Vaccine
Flu take up Current Year to Date: Flu payments (report) Sept-Jan 2013 as at 20130219, sorted by Locality Practices
Southwark
CCG
B&R B&W SSWK
0.0
10.0
20.0
30.0
40.0
50.0
60.0
70.0
80.0
90.0
P1 P2 P3 P6 P9 P10 P12 P13 P15 P20 P25 P26 P28 P29 P34 P35 P36 P37 P40 P42 P44 P45
% U
pta
ke
Figure 47 - 2012/13 Over 65s Flu Vaccine Uptake for SSWK Locality
% Uptake
Southwark Average
Locality Average

ANALYSIS Locality Level Analysis: SSWK Smoking Cessation
Figure 48
0.00%
10.00%
20.00%
30.00%
40.00%
50.00%
60.00%
70.00%
80.00%
90.00%
P1 P2 P3 P6 P9 P10 P12 P13 P15 P20 P25 P26 P28 P29 P34 P35 P36 P37 P40 P42 P44 P45
2012/13 % Quitters at 4 Weeks - SSWK Locality
Locality Average
Southwark Average
Local Outcome Summary Report: GP YTD 220213 (Smoking)
Southwark
CCG
B&R B&W SSWK

ANALYSIS Locality Level Analysis: SSWK Chlamydia Screening
Figure 49
Southwark Chlamydia LES Payment 2011-2012 (report), sorted by Locality Practices
0%
5%
10%
15%
20%
25%
30%
P1 P2 P3 P6 P9 P10 P12 P13 P15 P20 P25 P26 P28 P29 P34 P35 P36 P37 P40 P42 P44 P45
2011/12 Chlamydia Screening - % ScreenedSSWK Locality
Southwark Average
Locality Average
SWCCG target is
35% of eligible
population
Southwark
CCG
B&R B&W SSWK

ANALYSIS
Southwark:
Max Score N = 13
Min Score N = 1
Source: Quality Outcomes Framework, 2011-2012
Locality Level Analysis: SSWK Depression
20.0%
30.0%
40.0%
50.0%
60.0%
70.0%
80.0%
90.0%
100.0%
Figure 50 - Depression Domain Total % QOF Points 2011-2012 showing locality and practice variation
National
Average
SSWK Sou B&R B&W
Southwark
CCG
B&R B&W SSWK

ANALYSIS Locality Level Analysis – Bermondsey & Rotherhithe (B&R)
Quality and Variability
Key
All practices within B&R scoring above national average for Anti Coag / Anti Platelet for AF from GPOS
data. Variability is also significantly less compared to other localities
Figure 56
B&R locality performs well against its fellow localities with immunisation rates for Under 2s, but with the
rates dropping away somewhat for the Under 5s
Figure 53
Majority of practices are achieving the Southwark average immunisations rates for Under 2s and Under 5s
P4 have a data collection issue as the average return is very low for U5s. P23 and P29 have the lowest
averages in the locality
Figure 53
Four practices in B& R locality – P21, P30, P31, and P38 - are undertaking the majority of minor surgery
activity; raising the question if are the remaining practices undertaking enough to be competent
Figure 51
P8, P31 and P41 are achieving below average take up rates for the Flu vaccine. P38 and P39 appear to be
performing ahead of the average
Figure 52
More of the Practices in B&R are closer to achieving the 30% target of Quitters at 4 weeks – notable
achievers are P23 and P30. P19 and P41 maybe missing data at this point
Figure 54
There is variation across the B&R Locality for Chlamydia screening with one Practice – P39 – being
responsible for the overall achievement of 14%. The majority of Practices have achieved less than 10%
Figure 55
Southwark
CCG
B&R B&W SSWK

ANALYSIS Locality Level Analysis: B&R Flu Vaccine
Flu take up Current Year to Date: Flu payments (report) Sept-Jan 2013 as at 20130219, sorted by Locality Practices
Southwark
CCG
B&R B&W SSWK
0.0
10.0
20.0
30.0
40.0
50.0
60.0
70.0
80.0
P4 P8 P19 P21 P23 P27 P30 P31 P38 P39 P41
% U
pta
ke
Figure 51 - 2012/13 Over 65s Flu Vaccine Uptake for B&R Locality
% Uptake
Southwark Average
Locality Average

ANALYSIS Locality Level Analysis: B&R Minor Surgery
Figure 52
0
20
40
60
80
100
120
P31 P21 P30 P38 P8 P39 P27 P19 P23 P4 P41
Total Number of Minor Surgery Procedures -B&R Locality
QMS Stats on date 20121231 for Southwark PCT. Data for latest 3 months available ending 31 Dec 2012: sorted by Locality Practice
Southwark
CCG
B&R B&W SSWK

ANALYSIS Locality Level Analysis: B&R Childhood Immunisation
Southwark Childhood Immunisation data 2011/12 sorted by Locality Practice
0.0
10.0
20.0
30.0
40.0
50.0
60.0
70.0
80.0
90.0
100.0
P4 P8 P19 P21 P23 P27 P30 P31 P38 P39 P41
%
Figure 53 - 2011/12 Childhood Immunisation Rates % - B&R Locality
U2 Average
U5 Average
SOU U2
SOU U5
Southwark
CCG
B&R B&W SSWK

ANALYSIS Locality Level Analysis: B&R Smoking Cessation
Figure 54
Local Outcome Summary Report: GP YTD 220213 (Smoking)
0.00%
10.00%
20.00%
30.00%
40.00%
50.00%
60.00%
P4 P8 P19 P21 P23 P27 P30 P31 P38 P39 P41
2012/13 % Quitters at 4 Weeks - B&R Locality
Locality Average
Southwark Average
Southwark
CCG
B&R B&W SSWK
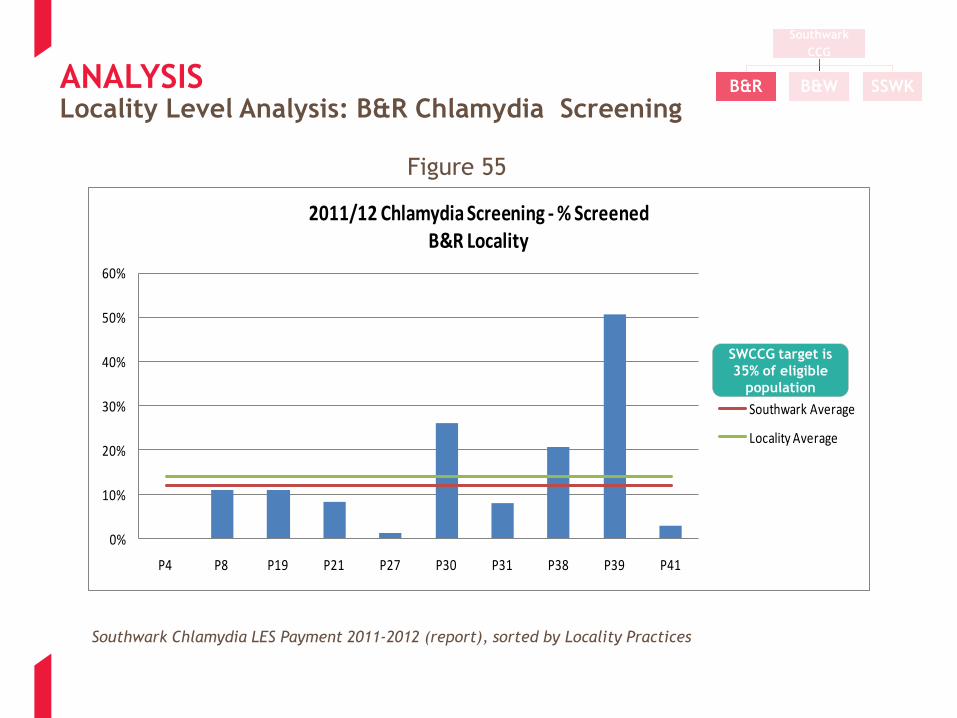
ANALYSIS Locality Level Analysis: B&R Chlamydia Screening
Figure 55
0%
10%
20%
30%
40%
50%
60%
P4 P8 P19 P21 P27 P30 P31 P38 P39 P41
2011/12 Chlamydia Screening - % ScreenedB&R Locality
Southwark Average
Locality Average
Southwark Chlamydia LES Payment 2011-2012 (report), sorted by Locality Practices
SWCCG target is
35% of eligible
population
Southwark
CCG
B&R B&W SSWK

ANALYSIS Locality Level Analysis: B&R Anti-Coag for AF
0.80
0.82
0.84
0.86
0.88
0.90
0.92
0.94
0.96
0.98
1.00
Figure 56 - Anti-Coag/ Anti Platelet for AF Total % Points 11-12
National
Average
Southwark:
Max Score N = 21
Min Score N = 2
Source: General Practice Outcomes Standards, 2011-2012
SSWK Sou B&R B&W
Southwark
CCG
B&R B&W SSWK

ANALYSIS Locality Level Analysis – Borough & Walworth (B&W)
Quality and Variability
Key
Highest Hypertension % QOF scoring locality with all practices scoring above the national average.
Moreover, little practice variability compared to two other localities
Figure 62
B&W locality appear to have the most consistent approach to achieving immunisation rates, with the
least drop off in rates between the Under 2s and the Under 5s
Figure 59
The locality appears to less variation in performance between practices with no practice dropping below
a rate of 75% and P14 only significantly below the averages
Figure 59
One practice in B&W Locality – P5- appears to be undertaking the majority of minor surgery, calling into
question the competency of the others with very low levels of activity
Figure 57
There is more consistency across B&W for Flu vaccine take up, with only I Practices – P17- failing to
achieve the Southwark CCG average take up rates; all the remaining Practices are above the Southwark
CCG average
Figure 58
There is variation across the B&W Locality for % quitters at 4wks from 80% by P5 to 18% by P11.
Counting and verification by CO2 would be of interest to understand this variation.
Figure 60
The majority of practices in B&W locality achieve the Southwark CCG average rate of Chlamydia
screening, but it should be noted that the Southwark CCG rate falls short of its target for the year of 35%.
P43 is the only Practice in B&W to over perform against this target.
Figure 61
Southwark
CCG
B&R B&W SSWK

ANALYSIS Locality Level Analysis: B&W Minor Surgery
Figure 57
QMS Stats on date 20121231 for Southwark PCT. Data for latest 3 months available ending 31 Dec 2012: sorted by Locality Practice
0
50
100
150
200
250
300
350
400
P5 P11 P22 P32 P44 P47 P14 P17 P33 P18 P7 P16 P24
Total Number of Minor Surgery Procedures -B&W Locality
Southwark
CCG
B&R B&W SSWK

ANALYSIS Locality Level Analysis: B&W Flu Vaccine
Flu take up Current Year to Date: Flu payments (report) Sept-Jan 2013 as at 20130219, sorted by Locality Practices
Southwark
CCG
B&R B&W SSWK
0.0
10.0
20.0
30.0
40.0
50.0
60.0
70.0
80.0
90.0
P5 P7 P11 P14 P16 P17 P18 P22 P24 P32 P33 P43 P46
% U
pta
ke
Figure 58 - 2012/13 Over 65s Flu Vaccine Uptake for B&W Locality
% Uptake
Southwark Average
Locality Average

ANALYSIS Locality Level Analysis: B&W Childhood Immunisation
Flu take up Current Year to Date: Flu payments (report) Sept-Jan 2013 as at 20130219, sorted by Locality Practices
Southwark
CCG
B&R B&W SSWK
0.0
10.0
20.0
30.0
40.0
50.0
60.0
70.0
80.0
90.0
100.0
P5 P7 P11 P14 P16 P17 P18 P22 P24 P32 P33 P43 P46
%
Figure 59 - 2011/12 Childhood Immunisation Rates % - B&W Locality
U2 Average
U5 Average
SOU U2
SOU U5

ANALYSIS Locality Level Analysis: B&W Smoking Cessation
Figure 60
Local Outcome Summary Report: GP YTD 220213 (Smoking)
0.00%
10.00%
20.00%
30.00%
40.00%
50.00%
60.00%
70.00%
80.00%
90.00%
P5 P7 P11 P14 P16 P17 P18 P22 P24 P32 P33 P43 P46
2012/13 % Quitters at 4 Weeks - B&W Locality
Locality Average
Southwark Average
Southwark
CCG
B&R B&W SSWK
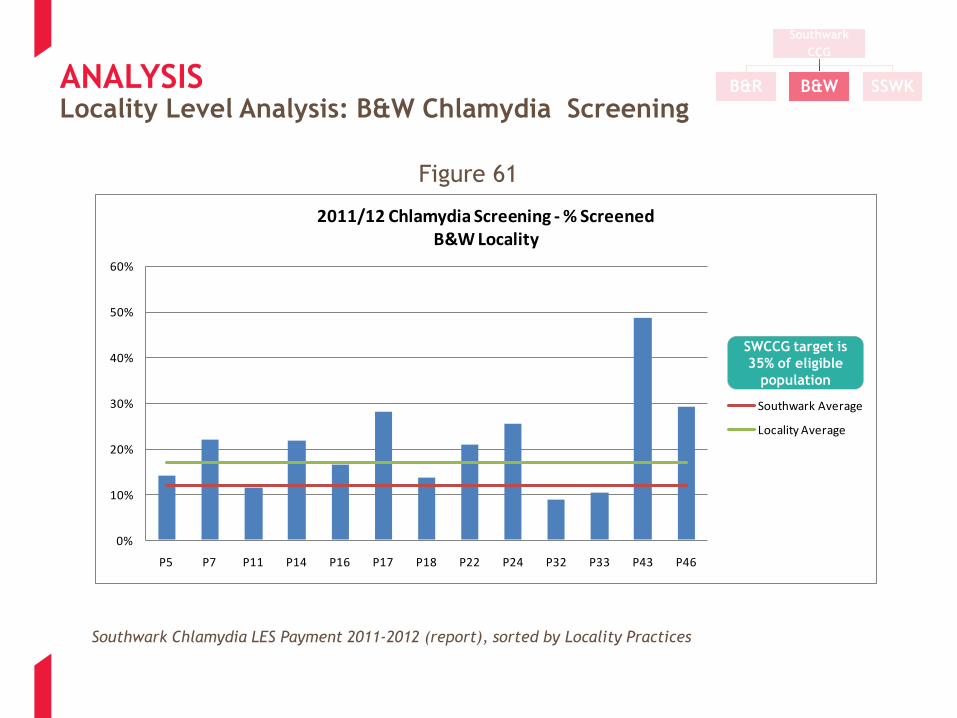
ANALYSIS Locality Level Analysis: B&W Chlamydia Screening
Figure 61
Southwark Chlamydia LES Payment 2011-2012 (report), sorted by Locality Practices
0%
10%
20%
30%
40%
50%
60%
P5 P7 P11 P14 P16 P17 P18 P22 P24 P32 P33 P43 P46
2011/12 Chlamydia Screening - % ScreenedB&W Locality
Southwark Average
Locality Average
SWCCG target is
35% of eligible
population
Southwark
CCG
B&R B&W SSWK

ANALYSIS
Source: Quality Outcomes Framework, 2011-2012
Southwark:
Max Score N = 26
Min Score N = 1
80.0%
82.0%
84.0%
86.0%
88.0%
90.0%
92.0%
94.0%
96.0%
98.0%
100.0%
Figure 62 - Hypertension Domain Total % QOF Points 2011-2012 showing locality and practice variation
National
Average
SSWK Sou B&R B&W
Southwark
CCG
B&R B&W SSWK
Locality Level Analysis

APPENDIX 1C: STRATEGY AND DOCUMENT REVIEW
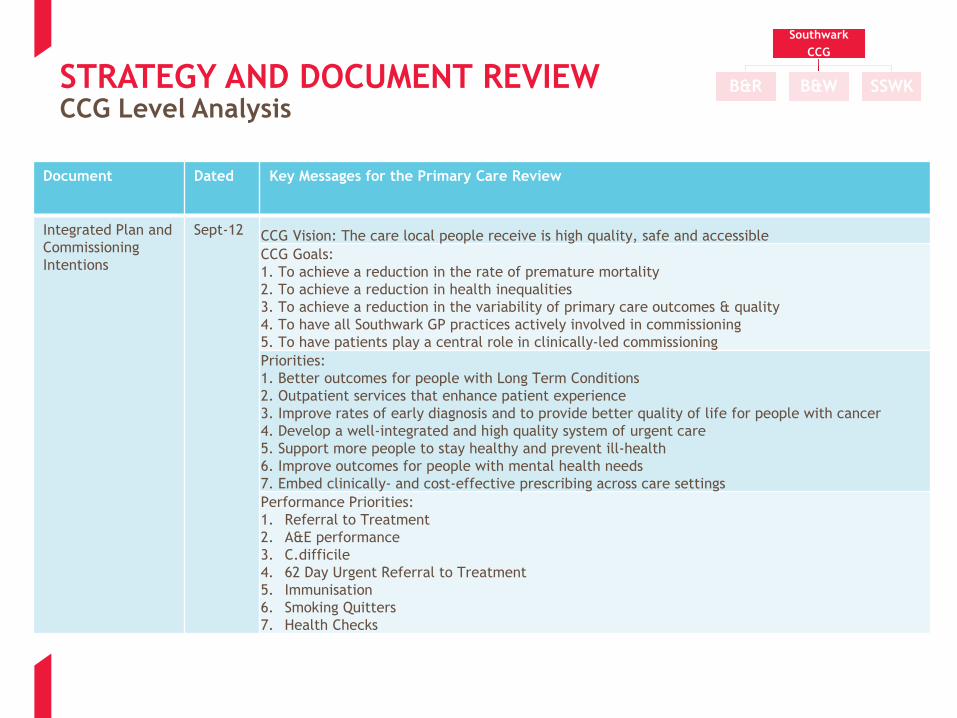
STRATEGY AND DOCUMENT REVIEW CCG Level Analysis
Document
Dated Key Messages for the Primary Care Review
Integrated Plan and
Commissioning
Intentions
Sept-12 CCG Vision: The care local people receive is high quality, safe and accessible
CCG Goals:
1. To achieve a reduction in the rate of premature mortality
2. To achieve a reduction in health inequalities
3. To achieve a reduction in the variability of primary care outcomes & quality
4. To have all Southwark GP practices actively involved in commissioning
5. To have patients play a central role in clinically‐led commissioning
Priorities:
1. Better outcomes for people with Long Term Conditions
2. Outpatient services that enhance patient experience
3. Improve rates of early diagnosis and to provide better quality of life for people with cancer
4. Develop a well‐integrated and high quality system of urgent care
5. Support more people to stay healthy and prevent ill‐health
6. Improve outcomes for people with mental health needs
7. Embed clinically‐ and cost‐effective prescribing across care settings
Performance Priorities:
1. Referral to Treatment
2. A&E performance
3. C.difficile
4. 62 Day Urgent Referral to Treatment
5. Immunisation
6. Smoking Quitters
7. Health Checks
Southwark
CCG
B&R B&W SSWK

STRATEGY AND DOCUMENT REVIEW CCG Level Analysis
Document
Dated Key Messages for the Primary Care Review
QIPP Sept-
12
Primary Care: Implementing Year of Care. Primary Care Education and Development Programme. McMillan
Programme for Primary Care. Extended Access Diagnostic Provision for Primary Care. Mental Health
Development Programme. Primary Care Prescribing Programme
Challenging: 11m required in 12/13, but strong track history (detail on worksheet)
Additional 6m required in 13/14 (6.7m identified) and further 5m in 14/15 (including delivery of 1% surplus
in each year)
Planned savings (risk adjusted) from primary care are - 2.6m in 12/13 with no further savings identified for
the future 2 years
Dulwich
Consultation
Not
Dated Health Centre will be built on site of Dulwich Community Hospital (currently 60% office space, 40% clinical).
It currently costs 2.3mpa. In future the health centre will be leased back to the CCG (most likely)
Option A: (three levels - GP, extended GP, Health Centre) More services at your local GP practice or one
nearby, and a health centre for a limited range of extra services. This approach to providing local health
services would mean that you would receive a range of non-hospital based health services from your GP
surgery or one nearby
Option B: (two levels - GP, Health Centre e.g. no minor surgery in practices) More services in a health
centre and core services from GP practices. This approach to providing local health services means that
your GP surgery will provide only core services. A local health centre will provide many other health
services, that you will not be able to get from your GP in future even if you can now
Southwark
CCG
B&R B&W SSWK

STRATEGY AND DOCUMENT REVIEW CCG Level Analysis
Document
Dated Key Messages for the Primary Care Review
Primary Care
Development
Programme
(which this
work
supports)
Not
dated
Aims are to:
- Support high quality care in primary care and community settings
- Improve the identification and management of a range of conditions
-Provide more care closer to the patient and by doing so decreasing reliance on acute hospital care.
The primary care development programme will operate using a variety of different training approaches
including:
– peer‐to‐peer and specialist‐led programmes; formal learning events; clinical protocols and practice‐based:
audits – to achieve targeted improvement in the following areas included in the Integrated Plan:
- Early identification and accurate diagnosis of long‐term and other priority high prevalence conditions
- Enhanced ability to manage long term conditions, to avoid hospital referral and support better patient
outcomes
- Medicines management knowledge in order to provide quality, cost‐effective prescribing and support
management of patients in primary care where part of an agreed pathway
- Good understanding of agreed local pathways and local service configuration to enable referrals to be made
to the right service for each patient’s needs, at the right time.
Practice staff training will focus on our strategic priority areas, which include long‐term conditions (diabetes,
respiratory and CVD) mental health (including dementia care) and planned care aimed at supporting a shift of
care setting in specialities like dermatology, gynaecology and ophthalmology.
The scope of the development programme does not include formal GP training, nor is it intended to replace
the CPPD programme. The programme is designed to be complementary to other training resources for
primary care staff and will operate in alignment with formal training programmes including those set by the
Local Education and Training Board (LETB) and the London Deanery
Southwark
CCG
B&R B&W SSWK