Embed Size (px)
Citation preview

Multi-modality aphasia therapy is as efficacious as constraint induced aphasia therapy
for chronic aphasia: A phase 1 study
Introduction
Constraint-induced aphasia therapy (CIAT; Pulvermüller et al., 2001) has been shown
to be efficacious in promoting positive changes in formal tests of language function
and client perceptions of everyday communication for many individuals with chronic
aphasia. Since the publication of the CIAT studies, questions have arisen concerning
the appropriateness of utilizing well-established multi-modality treatments in aphasia
rehabilitation (Rose, in press). Multi-modal treatments exploit the often-preserved
drawing, gesture, reading and writing abilities of individuals with aphasia, either as
compensation techniques when spoken communication fails to be restored, or as direct
cross-modal facilitation techniques to reestablish language and speech. Multi-
Modality Aphasia Treatment (M-MAT; Attard, Rose & Lanyon, 2013) is one such
treatment. What remains unclear is the relative efficacy of these two intensive but
fundamentally different treatment types (CIAT and M-MAT). Such information is
necessary to minimize unnecessary health care spending.
Aims and hypotheses
Primary Aim: To compare the efficacy of M-MAT to CIATplus for individuals with
chronic aphasia. Based on the small amount of available pilot data we hypothesized
that CIATplus and M-MAT would be equally efficacious in improving picture-naming
abilities and reducing aphasia severity immediately following treatment and at 1-
month follow-up. The secondary aim was to explore participant variables impacting
potential differential responsiveness to treatment. The latter aim was exploratory and
not hypothesis-driven.
Method
Participants
Eleven participants were recruited. Inclusion and exclusion criteria included: single
left hemisphere stroke at least 12 months prior to the study; aphasia without severe
apraxia of speech, motor speech disorder, or severe limb apraxia; no history of other
neurological disorder, uncorrected vision or hearing loss, or substance abuse; not
currently receiving speech-language pathology services; right handed pre-morbidly;
and English as first and primary language. Demographic details are provided in Table
1. Five females and six males participated, ranging from 17 to 88 months post onset.
There were four individuals with mild, six with moderate, and one with severe
aphasia.
Research design
We utilized 11 single-subject multiple-baseline designs with a cross over for
treatment order. Six participants (RW, SS, BH, LV, JP, PK) received M-MAT first
followed by CIATplus, while five participants (JB, ST, LM, AC, PD) received
CIATplus first. Intensity of treatment was constant across both treatments: 3.25 hours
per day/4 days per week/2 weeks + 45 minutes of refreshment breaks each day (32
hours contact for each treatment type; 64 hours total). One week separated the two
treatment phases. Assessments were carried out before treatment (pre-treatment
assessment—see results in Table 2), after the first 2-week treatment block (mid-
assessment), after the second two-week treatment block (post-assessment), and at one-

month and three-months after treatment completion (follow ups). Three separate
groups of participants undertook the study over a 6-month period (Group 1—5
participants, Group 2—3 participants, Group 3—3 participants). Group 1 broke into
two smaller groups (2 and 3 people) for at least 1 treatment hour per day.
Stimuli
Treatment stimuli were black and white line drawings of nouns and verbs from the
Object and Action Naming Battery (Druks & Masterson, 2000), the Snodgrass and
Vanderwart pictures (Snodgrass & Vanderwart, 1980), and the International Picture-
Naming Project (Szekely et al., 2004). Of these items, 80 (40 nouns and 40 verbs)
were trained in CIATplus and 80 (40 nouns and 40 verbs) in M-MAT, with 20 items
(10 nouns and 10 verbs) serving as untreated controls. Eight different categories of
nouns were utilized: four in CIATplus and four in M-MAT. One-, 2-, and 3-place
(argument) verbs were balanced across the two treatment phases.
Probing
Probing of the entire corpus took place at each phase: three probes at pre-treatment,
post CIATplus, and post M-MAT; and one probe at each of the one and three-month
follow ups. In addition, probing of the target stimuli (160 items) took place at the
beginning of every second treatment session (80 items were probed on each occasion,
so that the entire treated set (160 items) was probed twice across each treatment
phase).
Procedure
The procedures adopted for this trial replicated those of a recent pilot study (Attard,
Rose, & Lanyon, 2013). M-MAT is a manualized treatment protocol (Rose & Attard,
2011) with the primary treatment objective to facilitate spoken naming rather than
multi-modality communication. Thus, naming is practiced along with the addition of
gesture, drawing, reading, and written naming cues. CIATplus was carried out as
described by Meinzer and colleagues (2005) and focuses on naming without multi-
modal cues.
Data analysis
Standard case charts were developed for visual analysis of each participant’s probe
results across all phases of the study. Effect sizes were calculated on naming probe
scores using Busk and Serlin’s (1992) d and a classification of the magnitude of effect
size was made with Beeson and Robey’s (2006) suggestions of small (2.6), medium
(3.9), and large (5.8) effects for aphasia therapy.
Reliability and Treatment Fidelity
Inter- and intra-rater reliability was investigated on 20% of the video-recorded probe
data results. A speech-language pathologist not involved in providing the therapy
reviewed 10% of video-recordings/live sessions (viewed behind a one-way mirror)
that were randomly selected and indicated whether the treatment protocols were being
followed.
Results
Point-to-point inter- and intra-rater reliability results will be available in March 2013.
Treatment fidelity was reported to be 100% accurate. Figures 1-11 display the

individual probe results. Tables 2 and 3 show the results of standardized tests, and
effect sizes for probes across all phases of the study.
Primary outcome measure: Noun and Verb Probes
As expected with this heterogenous group of participants, variable effect sizes were
demonstrated across noun and verb probes. Of a total 44, 31 effect sizes reached
small (2), medium (9), or large (20) levels. Overall, higher effect sizes were found for
nouns and for items treated during the first treatment phase, irrespective of the
treatment type.
Secondary outcome measure: Western Aphasia Battery Aphasia Quotient
(WAB AQ)
All participants demonstrated improvement on the WAB AQ on at least one time
point. A recent Rasch analysis has suggested variable standard error of measurement
for WAB AQ according to aphasia severity ranging from <2 points (AQs 30-70) to >6
(AQ <20; AQ >90) (Hula et al., 2010). In this study, we chose a somewhat
conservative AQ change score of 3 points overall and/or a 1 point change on either the
fluency or information rating score (Spontaneous Speech section) to reflect treatment
responsiveness (see bold text Table 2). Using these criteria, all participants responded
to the treatments.
A comparison of WAB AQ immediately following M-MAT as compared to
immediately following CIATplus revealed four participants favored M-MAT (> 2
point WAB AQ difference between M-MAT and CIATplus) and five participants
favored CIATplus. Order effects are likely to have played a significant role: seven
participants achieved greater WAB AQ change scores following the first treatment
than following the second treatment phase (compared to mid-phase scores).
Discussion
This well-controlled, phase one study directly compared M-MAT and CIATplus, two
intensive but fundamentally different treatments with opposing rationales: constraint
versus multi-modal support. Results suggest they are equally efficacious, though order
effects may have masked clear differences. Discussion will center upon the participant
variables associated with the best response to treatment, the need for large-scale
randomized studies comparing these two treatments, and the likely mechanisms
underpinning multi-modal treatment response in chronic aphasia.
References
Attard, M., & Rose, M. (2013). The comparative effects of multi modality
aphasia therapy and constraint induced aphasia therapy-plus for severe chronic
Broca’s aphasia: An in-depth pilot study. Aphasiology, 27(1), 80-111.
Beeson, P. M., & Robey, R. R. (2006). Evaluating single-subject treatment
research: Lessons learned from the aphasia literature. Neuropsychology Review, 16(4),
161–169.
Busk, P., & Serlin, R. (1992). Meta-analysis for single case research. In T. R.
Kratochwill & J. R. Levin (Eds.), Single-case research design and analysis (pp. 197–
198). Hillsdale, NJ: Lawrence Erlbaum Associates Inc.
Druks, J., & Masterson, J. (2000). An object and action naming battery.
London: Psychology Press.
Hula, W., Donovan, N., Kendall, D., & Gonzales Rothi, L. (2010). Item
response theory analysis of the Western Aphasia Battery. Aphasiology, 24(11), 1326-
1341.
Kaplan, E., Goodglass, H., & Weintraub, S. (2000). Boston Naming Test.
Philadelphia: Lea and Febinger.
Kertesz, A., (2007). The Western Aphasia Battery-Revised. New York: Grune
& Stratton.
Lomas, J., Prickard, L., Bester, S., Elbard, H., Finlayson, A., & Zoghaib, C.
(1989). The Communicative Effectiveness Index: Development and psychometric
evaluation of a functional communication measure for adult aphasia. Journal of
Speech and Hearing Disorders, 54(1), 113-124.
Maher, L., Kendall, D., Swearengin, J., Rodriguez, A., Leon, S., Pingel, K. et
al. (2006). A pilot study of use-dependent learning in the context of Constraint
Induced Language Therapy. Journal of the International Neuropsychological Society,
12(6), 843-852.
Meinzer, M., Djundja, D., Barthel, G., Elbert, T., & Rockstroh, B. (2005).
Long-term stability of improved language functions in chronic aphasia after
constraint-induced aphasia therapy. Stroke, 36(7), 1462-1466.
Pulvermüller, F., & Berthier, M. (2008). Aphasia therapy on a neuroscience
basis. Aphasiology, 22(6), 563-599.
Pulvermüller, F., Neininger, B., Elbert, T., Mohr, B., Rockstroh, B., Koebbel,
P., & Taub, E. (2001). Constraint-induced therapy of chronic aphasia after stroke.
Stroke, 32(7), 1621-1626.
Rose, M. (in press). Releasing the constraints on aphasia therapy: The positive
impact of gesture and multi-modality treatments. American Journal of Speech
Language Pathology,
Rose, M., & Attard, M. (2011). Multi-modality aphasia therapy (M-MAT): A
procedural manual. (Honours thesis). La Trobe University: Melbourne.
Snodgrass, J. G., & Vanderwart, M. (1980). A standardized set of 260 pictures:
Norms for name agreement, image agreement, familiarity, and visual complexity.
Journal of Experimental Psychology: Human Learning and Memory, 6(2), 174–215.
Szekely, A., Jacobsen, T., D’Amico, S., Devescovi, A., Andonova, E., Herron,
D., & Bates, E. (2004). A new on-line resource for psycholinguistic studies. Journal of
Memory and Language, 51(2), 247–250.
van der Meulen, I., van de Sandt-Koenderman, W. M. E., Duivenvoorden, H.
J., & Ribbers, G. M. (2010). Measuring verbal and non-verbal communication in
aphasia: Reliability, validity, and sensitivity to change of the scenario test.
International Journal of Language and Communication Disorders, 45(4), 424–435.
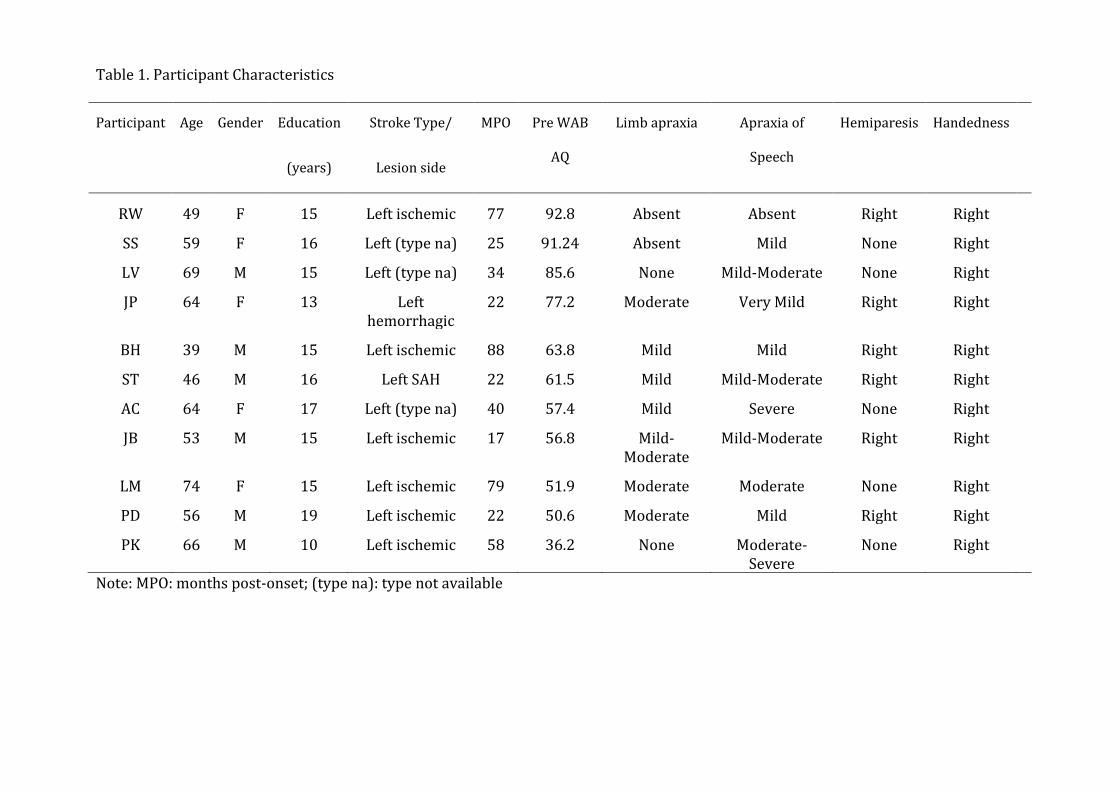
Table 1. Participant Characteristics
Participant Age Gender Education
(years)
Stroke Type/
Lesion side
MPO Pre WAB
AQ
Limb apraxia Apraxia of
Speech
Hemiparesis Handedness
RW 49 F 15 Left ischemic 77 92.8 Absent Absent Right Right
SS 59 F 16 Left (type na) 25 91.24 Absent Mild None Right
LV 69 M 15 Left (type na) 34 85.6 None Mild-Moderate None Right
JP 64 F 13 Left hemorrhagic
22 77.2 Moderate Very Mild Right Right
BH 39 M 15 Left ischemic 88 63.8 Mild Mild Right Right
ST 46 M 16 Left SAH 22 61.5 Mild Mild-Moderate Right Right
AC 64 F 17 Left (type na) 40 57.4 Mild Severe None Right
JB 53 M 15 Left ischemic 17 56.8 Mild-Moderate
Mild-Moderate Right Right
LM 74 F 15 Left ischemic 79 51.9 Moderate Moderate None Right
PD 56 M 19 Left ischemic 22 50.6 Moderate Mild Right Right
PK 66 M 10 Left ischemic 58 36.2 None Moderate-Severe
None Right
Note: MPO: months post-onset; (type na): type not available

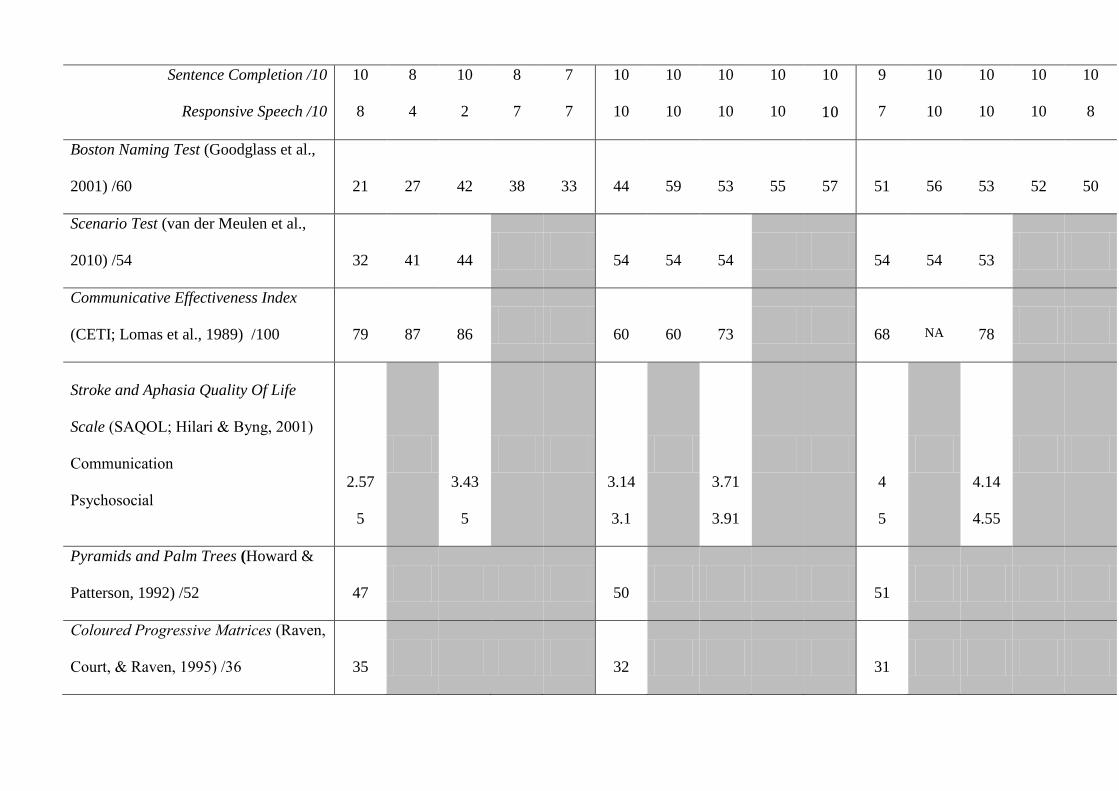
Table 2a. Results of baseline language and cognitive testing, and at immediate post each treatment, and 1 and 3 month follow up points (BH, RW, SS)
Assessment
BH RW SS
Pre
Tx
Post
M
Post
C+
1
Mo.
3
Mo.
Pre
Tx
Post
M
Post
C+
1
Mo.
3
Mo.
Pre
Tx
Post
M
Post
C+
1
Mo.
3
Mo.
Western Aphasia Battery—Revised
(Kertesz, 2007):
Aphasia Quotient
Spontaneous Speech:
Information Content /10
Fluency /10
Auditory Verbal Comprehension:
(Total score /10)
Repetition (Total score /10)
Naming and Word Finding:
(Total score /10)
Object Naming /60
Word Fluency /20
63.8
5
5
8.3
6.1
7.5
49
8
66.2
5
6
8.0
7.3
6.8
44
12
72.3
7
6
7.6
7.2
7.2
49
11
79.7
9
6
8.85
7.6
8.4
53
16
67.1
8
6
8.05
7.0
7.1
42
15
92.8
9
9
10
10
8.4
57
7
91.9
8
9
9.7
9.4
9.4
59
15
96.1
10
9
10
9.1
9.1
58
13
97.6
10
9
10
10
9.8
60
18
96.8
10
9
10
10
9.4
58
16
91.2
10
9
9.2
8.6
8.9
57
16
95.2
10
9
9.3
9.3
9.3
59
14
92.2
10
9
9.2
8.6
9.3
56
17
94.7
10
9
9.75
9.3
9.3
60
13
94.1
10
9
9.75
9.2
9.1
58
15
Sentence Completion /10
Responsive Speech /10
10
8
8
4
10
2
8
7
7
7
10
10
10
10
10
10
10
10
10
10
9
7
10
10
10
10
10
10
10
8
Boston Naming Test (Goodglass et al.,
2001) /60
21
27
42
38
33
44
59
53
55
57
51
56
53
52
50
Scenario Test (van der Meulen et al.,
2010) /54
32
41
44
54
54
54
54
54
53
Communicative Effectiveness Index
(CETI; Lomas et al., 1989) /100
79
87
86
60
60
73
68
NA
78
Stroke and Aphasia Quality Of Life
Scale (SAQOL; Hilari & Byng, 2001)
Communication
Psychosocial
2.57
5
3.43
5
3.14
3.1
3.71
3.91
4
5
4.14
4.55
Pyramids and Palm Trees (Howard &
Patterson, 1992) /52
47
50
51
Coloured Progressive Matrices (Raven,
Court, & Raven, 1995) /36
35
32
31
Note: Pre Tx = Pre treatment; Post M = Post-M-MAT; Post C+ = Post CIATplus; 1 Mo. = 1 month follow-up; 3 Mo. = 3 month follow-up. Bold figures: treatment responsiveness (see text)
Rey-Osterrieth Complex Figure Test (as
cited in Fastenau et al., 1999)
Copy/36
Recall /36
36
29.5
33
13
35
21

Table 2b. Results of language and cognitive testing at baseline, and at immediate post each treatment, and 1 and 3 month follow up points (LV, PK, JP)
Assessment
LV PK JP
Pre
Tx
Post
M
Post
C+
1
Mo.
3
Mo.
Pre
Tx
Post
M
Post
C+
1
Mo.
3
Mo.
Pre
Tx
Post
M
Post
C+
1
Mo.
3
Mo.
Western Aphasia Battery—Revised
(Kertesz, 2007): Aphasia Quotient
Spontaneous Speech
Information Content /10
Fluency /10
Auditory Verbal Comprehension
(Total /10)
Repetition (Total /10)
Naming and Word Finding
(Total /10)
Object Naming /60
Word Fluency /20
Sentence Completion /10
Responsive Speech /10
85.6
10
9
8.0
9.3
6.1
42
2
7
10
87.6
10
9
9.2
8.9
6.7
43
6
10
8
88.9
10
9
8.75
9.4
7.3
50
4
9
10
89.1
10
9
8.85
9.4
7.3
44
9
10
10
36.2
3
4
5.7
3.2
2.2
12
6
0
4
45.2
5
4
7.1
2.7
3.8
24
5
3
6
52.9
7
4
8.05
2.8
4.6
27
8
4
7
42.6
5
4
7.2
1.2
3.9
25
5
3
6
77.2
8
6
8.7
9.2
6.7
46
5
8
8
81.1
9
6
8.85
9.8
6.9
46
7
8
8
81.6
9
6
9
9.8
7
42
9
10
9
82.4
9
6
8.9
9.8
7.5
48
7
10
10
Boston Naming Test
(Goodglass et al., 2001) /60
28
40
39
44
3
5
9
11
18
30
32
30
Scenario Test

Note: Pre Tx = Pre treatment; Post M = Post-M-MAT; Post C+ = Post CIATplus; 1 Mo. = 1 month follow-up; 3 Mo. = 3 month follow-up
(van der Meulen et al., 2010) /54 54 54 51 38 38 38 48 45 48
Communicative Effectiveness Index
(CETI; Lomas et al., 1989) /100
93
98
99
na
32
31
28
31
29
41
43
na
Stroke and Aphasia Quality Of Life
Scale (SAQOL; Hilari & Byng, 2001)
Communication
Psychosocial
4.0
5.0
3.43
4.91
4.43
4.91
3.14
5.0
2.43
4.64
3.14
4.18
2.57
2.73
2.14
3.18
2.43
3.0
Pyramids and Palm Trees (Howard &
Patterson, 1992) /52
48
39
48
Coloured Progressive Matrices
(Raven, Court, & Raven, 1995)
Copy /36
Recall /36
33
18.5
25
7
24
11

Table 2c. Results of baseline language and cognitive testing, and at immediate post each treatment, and 1 and 3 month follow up points (JB, ST, LM)
Assessment
JB ST LM
Pre
Tx
Post
C+
Post
M
1
Mo.
3
Mo.
Pre
Tx
Post
C+
Post
M
1
Mo.
3
Mo.
Pre
Tx
Post
C+
Post
M
1
Mo.
3
Mo.
Western Aphasia Battery—Revised
(Kertesz, 2007):
Aphasia Quotient
Spontaneous Speech
Information Content /10
Fluency /10
Auditory Verbal Comprehension
(Total score /10)
Repetition (Total score /10)
Naming and Word Finding
(Total score /10)
Object Naming /60
Word Fluency /20
56.8
7
4
7.5
5.9
6.0
42
6
55
5
4
7.2
5.7
5.6
35
5
53.8
5
4
6.6
4.8
6.5
42
7
61.5
7
5
6.95
6.3
5.5
34
5
58.70
7
5
6.85
5.9
5.5
34
7
61.5
6
4
7.55
5.8
7.4
50
7
66
6
4
8.4
6.8
7.7
50
9
63.8
7
4
7.9
5.9
7.1
55
6
60
5
4
8.1
5.6
7.3
51
4
61.9
7
4
7.25
5.8
6.9
48
7
51.9
6
4
4.8
4.0
4
29
1
59.1
8
4
8.15
4.6
4.8
24
6
60.9
8
4
7.75
5.8
4.9
29
8
55.6
8
4
5.9
5.1
4.8
29
6
57.5
7
4
7.65
4.6
5.5
35
6

Sentence Completion /10
Responsive Speech /10
5
7
8
8
8
8
6
10
8
6
7
10
10
8
6
4
8
10
6
8
4
6
8
10
6
6
6
7
6
8
Boston Naming Test
(Goodglass et al., 2001) /60
7
9
15
11
14
27
40
31
32
38
9
14
7
10
12
Scenario Test (van der Meulen et al.,
2010) /54
40
38
38
42
44
43
33
40
44
Communicative Effectiveness Index
(CETI; Lomas et al., 1989) /100
42
41
39
29
NA
62
46
46
52
Stroke and Aphasia Quality Of Life
Scale (SAQOL; Hilari & Byng, 2001)
Communication
Psychosocial
3
4
3
4.36
2.71
4.18
2.14
3.18
3.14
4.45
2.86
3.8
Pyramids and Palm Trees (Howard &
Patterson, 1992) /52
43
35
46
Coloured Progressive Matrices
Copy /36
Recall /36
33
27.5
36
17
??
9.5
Note: Pre Tx = Pre treatment; Post M = Post-M-MAT; Post C+ = Post CIATplus; 1 Mo. = 1 month follow-up; 3 Mo. = 3 month follow-up.

Table 2d. Results of baseline language and cognitive testing, and at immediate post each treatment, and 1 and 3 month follow up points (AC, PD)
Assessment AC PD
Pre Tx Post C+ Post M 1 Mo. 1 3 Mo. Pre Tx Post C+ Post M 1 Mo. 3 Mo.
Western Aphasia Battery—Revised
(Kertesz, 2007):
Aphasia Quotient
Spontaneous Speech
Information Content /10
Fluency /10
Auditory Verbal Comprehension
(Total score /10)
Repetition (Total score /10)
Naming and Word Finding (Total /10)
Object Naming /60
Word Fluency /20
Sentence Completion /10
Responsive Speech /10
57.4
5
6
8.1
4.9
4.7
28
7
4
8
56.3
5
5
8.95
3.4
5.8
37
4
7
10
56.9
5
5
7.75
5.2
5.5
38
3
7
7
62.1
7
6
8.45
2.8
6.8
47
9
5
7
50.6
4
3
7.6
3.2
3.2
20
2
6
4
54.2
6
3
7.3
7.9
2.9
12
5
8
4
52.8
5
4
6.4
7.7
3.3
16
3
6
8
51.0
4
3
6.8
7.5
4.2
25
3
10
4
53.3
6
3
6.45
7.7
3.5
20
4
7
4

Boston Naming Test
(Goodglass et al., 2001) /60
10
9
13
18
2
4
0
1
0
Scenario Test
(van der Meulen et al., 2010) /54
46
47
46
30
29
31
Communicative Effectiveness Index
(CETI; Lomas et al., 1989) /100
54
60
60
31
44
64
Stroke and Aphasia Quality Of Life Scale
(SAQOL; Hilari & Byng, 2001)
Communication
Psychosocial
3.43
4.55
3.29
4.09
2.86
5
3.86
4.64
Pyramids and Palm Trees Test (3 Pictures)
(Howard & Patterson, 1992) /52
50
42
Note: Pre Tx = Pre treatment; Post M = Post-M-MAT; Post C+ = Post CIATplus; 1 Mo. = 1 month follow-up; 3 Mo. = 3 month follow-up; 1 AC was overseas during the 1-month follow-up assessment and so this is a missing data point
Coloured Progressive Matrices (Raven,
Court, & Raven, 1995)
Copy /36
Recall /36
36
24
36
25

Table 3: Effect sizes for each treatment phase and at 1-month follow up (M-MAT first treatment for first six participants; CIATPlus first treatment for second five participants) Pre Treatment to Post M-MAT Post M-MAT to Post CIATPlus Post CIATPlus to 1 month follow
up Nouns
verbs nouns verbs nouns verbs
BH 30.6 4.8 8.07 13.28 2.84 -4.04
RW 27.71 4.01 -0.87 0.29 0.44 0
SS 4.25 4.58 1.0 2.84 0 -1.0
LV 15.97 2.13 5.29 5.17 -2.39 -0.29
JP 28.87 6.35 1.88 9.60 1.06 -0.81
PK 14.33 8.37 27.13 12.67 -3.5 -1.62
Pre Treatment to Post CIATPlus Post CIATPlus to Post M-MAT Post M-MAT to 1 month follow up
nouns verbs nouns verbs nouns verbs
JB 10.97 1.44 0.35 0 -1.75 -1.15
ST 21.94 4.58 0.17 -0.96 -4.04 -2.89
PD 5.02 6.13 2.51 2.58 -2.31 -0.22
LM 5.44 22 7.22 5.67 1.0 -0.40
AC 1.88 20.21 3.68 11.84 4.04* -0.41*
Note: * 3 month as one-month not available due to participant extended travel; Bold font indicates effect size larger than comparison score in reverse treatment phase

Figure 1. Comparative Baseline, Treatment and Follow-up Probe Results for RW
0%
20%
40%
60%
80%
100%
Per
cent
Co
rrec
t
CIATplus
0%
20%
40%
60%
80%
100%
Per
cent
Co
rrec
t
M-MAT Baseline Treatment
0%
20%
40%
60%
80%
100%
Day
1
Day
2
Day
3
Day
14,
16
Day
20,
22
Day
27
Day
28
Day
31
Day
34,
36
Day
41,
43
Day
50
Day
51
Day
52
Day
80
Day
141
Per
cent
Corr
ect
Time Point
CIATplus
CIATplus Nouns /39
CIATplus Verbs /21
CIATplus Sentences /57 0%
20%
40%
60%
80%
100%
Day
1
Day
2
Day
3
Day
14,
16
Day
20,
22
Day
27
Day
28
Day
31
Day
34,
36
Day
41,
43
Day
50
Day
51
Day
52
Day
80
Day
141
Per
cent
Corr
ect
Time Point
CIATplus
CIATplus Nouns /39
CIATplus Verbs /21
CIATplus Sentences /57 Treatment

Figure 2. Comparative Baseline, Treatment and Follow-up Probe Results for SS
0%
20%
40%
60%
80%
100%
Per
cent
Co
rrec
t
M-MAT
0%
20%
40%
60%
80%
100%
Per
cent
Co
rrec
t
CIATplus
Baseline Treatment
0%
20%
40%
60%
80%
100%
Day
1
Day
2
Day
3
Day
14,
16
Day
20,
22
Day
27
Day
28
Day
31
Day
34,
36
Day
41,
43
Day
50
Day
51
Day
52
Day
80
Day
141
Per
cent
Corr
ect
Time Point
CIATplus
CIATplus Nouns /39
CIATplus Verbs /21
CIATplus Sentences /57 0%
20%
40%
60%
80%
100%
Day
1
Day
2
Day
3
Day
14,
16
Day
20,
22
Day
27
Day
28
Day
31
Day
34,
36
Day
41,
43
Day
50
Day
51
Day
52
Day
80
Day
141
Per
cent
Corr
ect
Time Point
CIATplus
CIATplus Nouns /39
CIATplus Verbs /21
CIATplus Sentences /57
Treatment

Figure 3. Comparative Baseline, Treatment and Follow-up Probe Results for LV
0%
20%
40%
60%
80%
100%
Per
cen
t C
orr
ect
Control
Total Nouns and
Verbs /20
0%
20%
40%
60%
80%
100%
Per
cent
Corr
ect
CIATplus
Nouns /40
Verbs /38
0%
20%
40%
60%
80%
100%
Per
cent
Corr
ect
M-MAT
Nouns /40
Verbs /42
Baseline Treatment
Treatment

Figure 4. Comparative Baseline, Treatment and Follow-up Probe Results for JP
0%
20%
40%
60%
80%
100%
Per
cent
Corr
ect
CIATplus
Nouns /40
Verbs /38
0%
20%
40%
60%
80%
100%P
erce
nt
Corr
ect
MMAT
Nouns /40
Verbs /42
0%
20%
40%
60%
80%
100%
Per
cent
Corr
ect
Control
Total Nouns and
Verbs /20
Treatment
Treatment Baseline

Figure 5. Comparative Baseline, Treatment and Follow-up Probe Results for BH
0%
20%
40%
60%
80%
100%
Per
cent
Corr
ect
CIATplus
0%
20%
40%
60%
80%
100%
Per
cent
Corr
ect
M-MAT
0%
20%
40%
60%
80%
100%
Day
1
Day
2
Day
3
Day
14,
16
Day
20,
22
Day
27
Day
28
Day
31
Day
34,
36
Day
41,
43
Day
50
Day
51
Day
52
Day
80
Day
141
Per
cent
Corr
ect
Time Point
CIATplus
CIATplus Nouns /39
CIATplus Verbs /21
CIATplus Sentences /57 0%
20%
40%
60%
80%
100%
Day
1
Day
2
Day
3
Day
14,
16
Day
20,
22
Day
27
Day
28
Day
31
Day
34,
36
Day
41,
43
Day
50
Day
51
Day
52
Day
80
Day
141
Per
cent
Corr
ect
Time Point
CIATplus
CIATplus Nouns /39
CIATplus Verbs /21
CIATplus Sentences /57 Treatment
Baseline Treatment

Figure 6. Comparative Baseline, Treatment and Follow-up Probe Results for AC
0%
20%
40%
60%
80%
100%P
erce
nt
Corr
ect
CIATplus
0%
20%
40%
60%
80%
100%
Per
cent
Corr
ect
Control
0%
20%
40%
60%
80%
100%
Per
cent
Corr
ect
M-MAT
Baseline Treatment
Treatment

Figure 7. Comparative Baseline, Treatment and Follow-up Probe Results for LM
0%
20%
40%
60%
80%
100%
Per
cent
Corr
ect
CIATplus
0%
20%
40%
60%
80%
100%
Per
cent
Corr
ect
M-MAT
0%
20%
40%
60%
80%
100%
Per
cent
Corr
ect
Control
Baseline Treatment
Treatment

Figure 8. Comparative Baseline, Treatment and Follow-up Probe Results for PD
0%
20%
40%
60%
80%
100%
Per
cent
Corr
ect
CIATplus
0%
20%
40%
60%
80%
100%
Per
cent
Corr
ect
M-MAT
0%
20%
40%
60%
80%
100%
Per
cent
Corr
ect
Control
Baseline Treatment
Treatment
0%
20%
40%
60%
80%
100%P
erce
nt
Corr
ect
CIATplus
0%
20%
40%
60%
80%
100%
Per
cent
Corr
ect
MMAT
0%
20%
40%
60%
80%
100%
Per
cent
Corr
ect
Control
Baseline Treatment
Treatment
Figure 9. Comparative Baseline, Treatment and Follow-up Probe Results for ST
0%
20%
40%
60%
80%
100%
Per
cent
Corr
ect
Control
0%
20%
40%
60%
80%
100%
Per
cent
Corr
ect
M-MAT
0%
20%
40%
60%
80%
100%
Per
cent
Corr
ect
CIATplus Baseline
Treatment
Treatment
0%
20%
40%
60%
80%
100%
Day
1
Day
7
Day
8
Day
16, 18
Day
21, 23
Day
28
Day
31
Day
32
Day
35, 37
Day
42, 44
Day
49
Day
52
Day
53
N/A
Day
144
Perc
ent
Corr
ect
Control

Figure 10. Comparative Baseline, Treatment and Follow-up Probe Results for JB
0%
20%
40%
60%
80%
100%
Per
cent
Corr
ect
CIATplus
0%
20%
40%
60%
80%
100%
Per
cent
Corr
ect
M-MAT
0%
20%
40%
60%
80%
100%
Per
ecem
t C
orr
ect
Control
Baseline Treatment
Treatment
0%
20%
40%
60%
80%
100%
Day
1
Day
7
Day
8
Day
16, 18
Day
21, 23
Day
28
Day
31
Day
32
Day
35, 37
Day
42, 44
Day
49
Day
52
Day
53
N/A
Day
144
Perc
ent
Corr
ect
Control
0%
20%
40%
60%
80%
100%
Day
1
Day
7
Day
8
Day
16, 18
Day
21, 23
Day
28
Day
31
Day
32
Day
35, 37
Day
42, 44
Day
49
Day
52
Day
53
N/A
Day
144
Perc
ent
Corr
ect
Control
0%
20%
40%
60%
80%
100%
Day
1
Day
7
Day
8
Day
16, 18
Day
21, 23
Day
28
Day
31
Day
32
Day
35, 37
Day
42, 44
Day
49
Day
52
Day
53
N/A
Day
144
Perc
ent
Corr
ect
Control

Figure 11. Comparative Baseline, Treatment and Follow-up Probe Results for PK
0%
20%
40%
60%
80%
100%
Per
cent
Corr
ect
Control
Total Nouns
and Verbs /20
0%
20%
40%
60%
80%
100%
Per
cent
Corr
ect
CIATplus
Nouns /40
Verbs /38
Treatment
0%
20%
40%
60%
80%
100%
Per
cent
Corr
ect
MMAT
Nouns /40
Verbs /42
Baseline Treatment