Embed Size (px)
Citation preview
Prifysgol
Aberystwyth University
Wales Farm Income Booklet
2012/13 Results
Institute of Biological, Environmental and Rural Sciences
Aberystwyth University
Gogerddan
Aberystwyth
Ceredigion SY23 3EE
Tel: 01970 622253
E-mail: [email protected]
http://www.aber.ac.uk/en/ibers/enterprise-kt/fbs/

1
Foreword
Aberystwyth University has been researching Welsh farm incomes since before the Second World War and 2011/12 was the 75
th Anniversary
of the Survey. The Survey, recognised as the most authoritative of the financial position and performance of farm incomes, provides policy-makers with information on the economic state of the industry and provides valuable comparative data for assessing individual farm performance. This booklet is based on the full Farm Business Survey (FBS) which collects information from over 550 randomly selected Welsh farms. The booklet is aimed at providing farmers with a user friendly benchmarking tool and incorporates the latest financial and physical information for the main farm types in Wales. The results shown are contrary to some aspects of FBS methodology and presentation of results, for example notional inputs such as rental value for owner occupied farms and unpaid labour have been taken out, whereas finance charges have been included, so that the figures represent actual costs incurred. This booklet only shows unpaid labour for reference purposes, and also only includes selected farm types. For undertaking detailed, comprehensive analysis and for year on year analysis on income trends please refer to the full results published as the annual report ‘Farm Business Survey in Wales: Statistical Results’ (available online). Aberystwyth University has been associated with land-based studies since 1878 and the FBS is its oldest research contract. It is therefore appropriate that I gratefully acknowledge the many farmers throughout Wales who have made detailed information available; the Welsh Government who finance the present Survey; Farming Connect for the sponsorship of this booklet and the past and present staff of the Survey.
Tony O’Regan Director of Farm Business Survey

2
Introduction
Farm profitability is central to any farm business, although farmers will have many other business and personal objectives. With the upcoming changes to the Single Payment Scheme all farmers should be aware of their production costs and how these compare with those of other producers. The variation in performance and return demonstrated in this booklet shows the scope for improvement and by comparing or ‘benchmarking’ farm performance, potential strengths and weaknesses within the farming operation can be identified. The results in this booklet are laid out as follows with data shown for the average and top third performers: 1. Whole Farm Data (Pages 5 – 16) A profit and loss account and summarised balance sheet for six different types of farm are presented, showing the average profit or loss for these farms and its equivalent per hectare. Also shown is the size and stocking of these farms and relevant key performance indicators. 2. Gross Margin Data (Pages 17 – 20) This booklet presents data for eight different farm enterprises. Gross margins compare income with the direct costs incurred for production. Care is needed when using gross margins since no account is taken of indirect production costs (overheads). 3. Production Costs Data (Pages 21 – 22) Production costs are presented for four farm outputs. These examine the total unit cost of production and, by allocating both direct and indirect costs (the latter being allocated on a livestock unit basis), the producer is better able to determine both the competitiveness and efficiency of the enterprise.

3
DEFINITION OF TERMS AND EXPLANATORY NOTES
Effective Hectares (Eff. Ha.)
Constitutes total farm area minus area occupied by roads, woodland, wasteland and buildings, and rough grazing expressed in terms of pasture equivalent.
Single Payment Scheme (SPS)
Replaced all production linked subsidies as part of the restructuring of the CAP.
Farm Types Hill Mainly in Severely Disadvantaged Area.
Upland Mainly in Disadvantaged Area.
Lowland Mainly outside Less Favoured Area.
Whole Farm Data Ranking of whole farm data
Top producers are ranked by profit after rent and finance per effective hectare.
Indirect subsidies Subsidies not subject to de-coupling e.g. Organic Scheme, Tir Gofal and Glastir.
Other crop costs Includes all arable and forage costs except for fertilisers and contracting, e.g. seeds, sprays, wrap, twine etc.
Allocatable contracting
Contracting allocated to enterprises e.g. combining, shearing and slurry spreading.
General farm costs
Includes electricity, telephone, licences, insurances, professional fees and subscriptions.
Miscellaneous income
Comprises contracting, cottage rents, wayleaves and any other miscellaneous income. Includes revenue from other enterprises not shown.
Owner equity Net worth as percentage of total assets.
Stocking Rate (glu/adj.forage ha),
Grazing Livestock Units per adjusted forage hectare of land.
Livestock Units (LU) and Grazing Livestock Units (GLU)
Livestock numbers are converted to livestock units, based on estimated energy requirements, to calculate the total stocking of grazing livestock on the farm.
Dairy other output Net output from sales/purchases of cows and calves. Includes valuation changes.

4
Paid labour Includes actual paid casual, part-time and whole-time labour.
Unpaid labour (not including farmer and spouse)
Unpaid labour or labour receiving less remuneration than the market rate. Unpaid labour is not included in profit after rent and finance.
Land expenses Repairs to building and land resources e.g. hedges, fences, walls, ditches and gates. Also includes water costs.
Finance Includes bank charges, interest and lease/hire purchase interest. No capital repayments included.
Gross Margin Data Other livestock costs Forage variable costs / Forage
On a per head basis. Calculated by subtracting the direct (variable) costs from the relevant output. Purchased bedding materials, sales commission and other costs incurred specifically for livestock enterprises. Includes other crop costs for forage, fertilisers, forage contracting and grass keep.
Production Costs Data
Calculated by dividing all variable and overhead costs by kilograms of meat (in liveweight terms) or litres of milk produced. Overheads are allocated on a livestock unit basis after a share for any arable and/or miscellaneous income enterprises have been deducted. Ranked by net margin.
Herd / Flock replacement
Breeding livestock valuation change less culls, plus breeding stock purchases.
Power and machinery
Includes machinery repairs, fuel, other contracting and machinery depreciation.
Buildings Land expenses and building depreciation.
Net margin Output less input/costs for enterprise.

5
HILL CATTLE AND SHEEP FARMS 2012/13
WHOLE FARM DATA Number of farms : 127
All farms All farms Top third
£/farm £/eff.ha. £/eff.ha.
OUTPUTS
Beef 41862 341 421
Sheep 41725 340 473
Crops and forage 2175 18 19
Single Payment Scheme 31119 254 315
Indirect subsidies 6675 54 65
Miscellaneous income 5928 48 59
TOTAL OUTPUTS 129484 1055 1352
INPUTS
Feeds 21016 171 189
Tack and grass keep 4967 41 50
Veterinary and medicines 4955 40 48
Other livestock costs 9056 74 85
Fertilisers 8405 69 75
Other crop costs 1822 15 18
Allocatable contracting 3796 31 40
TOTAL VARIABLE COSTS 54017 441 505
Paid labour 4062 33 26
Other contracting / machinery hire 829 7 8
Fuel and repairs 11318 92 102
Machinery depreciation 12464 102 112
General farming costs 10025 82 87
Land expenses 4324 35 36
Buildings depreciation 3242 26 29
TOTAL OVERHEAD COSTS 46264 377 400
TOTAL INPUTS 100281 818 905
PROFIT BEFORE RENT AND FINANCE 29203 237 447
Rent 2371 19 20
Finance 3019 25 22
PROFIT AFTER RENT AND FINANCE 23813 193 405
Unpaid labour 6609 54 62

6
HILL CATTLE AND SHEEP FARMS 2012/13
Owned Tenant Mixed
BALANCE SHEET £/farm £/farm £/farm
Number of farms by tenure type 66 5 56
TOTAL ASSETS 1017243 260038 984513
TOTAL EXTERNAL LIABILITIES 69349 46031 80539
NET WORTH 947894 214007 903974
Owner equity (%) 93 82 92
PHYSICAL DATA All farms Top third
LAND AREA Hectares Hectares
Grassland and forage crops 109.31 98.66
Cereals and other crops 0.84 1.39
Rough grazing, fallow, woods etc. 41.41 45.77
TOTAL AREA (actual) 151.56 145.82
TOTAL AREA (effective) 122.59 111.28
All farms Top third
LIVESTOCK Numbers Numbers
Suckler cows 43 43
Other cattle 89 86
Breeding sheep 602 668
Other sheep 400 463
PERFORMANCE INDICATORS All farms Top third
Lambs reared (numbers per ewe) 1.24 1.35
Finished lamb sales (numbers per ewe) 0.91 1.01
Finished lamb sales (£ per lamb) 67.44 69.54
Calves reared (numbers per cow) 0.89 0.91
Finished cattle sales (£ per head) 1206 1294
Store cattle sales (£ per head) 883 972
Stocking rate (glu/adj. forage ha.) 1.05 1.16

7
HILL SHEEP FARMS 2012/13
WHOLE FARM DATA Number of farms : 117
All farms All farms Top third
£/farm £/eff.ha. £/eff.ha.
OUTPUTS
Beef 14307 95 168
Sheep 52663 350 535
Crops and forage 865 6 6
Single Payment Scheme 30713 204 276
Indirect subsidies 9273 62 68
Miscellaneous income 5245 35 73
TOTAL OUTPUTS 113066 752 1126
INPUTS
Feeds 15739 105 140
Tack and grass keep 5232 35 51
Veterinary and medicines 4069 27 41
Other livestock costs 5953 40 56
Fertilisers 6141 41 62
Other crop costs 1339 9 11
Allocatable contracting 2670 18 22
TOTAL VARIABLE COSTS 41143 275 383
Paid labour 3257 22 26
Other contracting / machinery hire 898 6 9
Fuel and repairs 10651 71 104
Machinery depreciation 11152 74 95
General farming costs 8877 59 73
Land expenses 3561 24 33
Buildings depreciation 2399 16 16
TOTAL OVERHEAD COSTS 40795 272 356
TOTAL INPUTS 81938 547 739
PROFIT BEFORE RENT AND FINANCE 31128 205 387
Rent 3392 23 23
Finance 2739 18 17
PROFIT AFTER RENT AND FINANCE 24997 164 347
Unpaid labour 5341 36 47

8
HILL SHEEP FARMS 2012/13
Owned Tenant Mixed
BALANCE SHEET £/farm £/farm £/farm
Number of farms by tenure type 58 11 48
TOTAL ASSETS 1016505 207117 705697
TOTAL EXTERNAL LIABILITIES 66483 45800 85670
NET WORTH 950022 161317 620027
Owner equity (%) 93 78 88
PHYSICAL DATA All farms Top third
LAND AREA Hectares Hectares
Grassland and forage crops 124.91 92.54
Cereals and other crops 0.29 0.05
Rough grazing, fallow, woods etc. 90.28 57.11
TOTAL AREA (actual) 215.48 149.70
TOTAL AREA (effective) 150.35 107.28
All farms Top third
LIVESTOCK Numbers Numbers
Suckler cows 14 14
Other cattle 30 35
Breeding sheep 957 898
Other sheep 616 549
PERFORMANCE INDICATORS All farms Top third
Lambs reared (numbers per ewe) 1.13 1.17
Finished lamb sales (numbers per ewe) 0.78 0.81
Finished lamb sales (£ per lamb) 60.88 62.66
Calves reared (numbers per cow) 0.92 0.93
Finished cattle sales (£ per head) 1217 1145
Store cattle sales (£ per head) 826 891
Stocking rate (glu/adj. forage ha.) 0.72 0.98

9
UPLAND CATTLE AND SHEEP FARMS 2012/13
WHOLE FARM DATA Number of farms : 91
All farms All farms Top third
£/farm £/eff.ha. £/eff.ha.
OUTPUTS
Beef 42139 414 549
Sheep 35943 353 563
Crops and forage 6359 62 67
Single Payment Scheme 23996 236 300
Indirect subsidies 3680 36 42
Miscellaneous income 5255 52 69
TOTAL OUTPUTS 117372 1153 1590
INPUTS
Feeds 16807 165 225
Tack and grass keep 3440 34 37
Veterinary and medicines 3910 38 46
Other livestock costs 7585 75 84
Fertilisers 9759 96 132
Other crop costs 2497 25 27
Allocatable contracting 4318 42 36
TOTAL VARIABLE COSTS 48316 475 587
Paid labour 3438 34 33
Other contracting / machinery hire 1127 11 11
Fuel and repairs 10750 106 123
Machinery depreciation 12341 121 131
General farming costs 8982 88 96
Land expenses 3584 35 39
Buildings depreciation 3017 30 32
TOTAL OVERHEAD COSTS 43239 425 465
TOTAL INPUTS 91555 900 1052
PROFIT BEFORE RENT AND FINANCE 25817 253 538
Rent 3288 32 28
Finance 2561 25 24
PROFIT AFTER RENT AND FINANCE 19968 196 486
Unpaid labour 4380 43 73

10
UPLAND CATTLE AND SHEEP FARMS 2012/13
Owned Tenant Mixed
BALANCE SHEET £/farm £/farm £/farm
Number of farms by tenure type 52 5 34
TOTAL ASSETS 803747 168608 900231
TOTAL EXTERNAL LIABILITIES 45352 1734 96424
NET WORTH 758395 166874 803807
Owner equity (%) 94 99 89
PHYSICAL DATA All farms Top third
LAND AREA Hectares Hectares
Grassland and forage crops 95.80 101.15
Cereals and other crops 3.23 4.20
Rough grazing, fallow, woods etc. 9.11 8.77
TOTAL AREA (actual) 108.14 114.12
TOTAL AREA (effective) 101.80 108.83
All farms Top third
LIVESTOCK Numbers Numbers
Suckler cows 33 29
Other cattle 89 104
Breeding sheep 457 604
Other sheep 325 498
PERFORMANCE INDICATORS All farms Top third
Lambs reared (numbers per ewe) 1.34 1.48
Finished lamb sales (numbers per ewe) 1.18 1.30
Finished lamb sales (£ per lamb) 72.79 79.11
Calves reared (numbers per cow) 0.90 0.94
Finished cattle sales (£ per head) 1193 1279
Store cattle sales (£ per head) 878 1168
Stocking rate (glu/adj. forage ha.) 1.16 1.31

11
LOWLAND CATTLE AND SHEEP FARMS 2012/13
WHOLE FARM DATA Number of farms : 57
All farms All farms Top third
£/farm £/eff.ha. £/eff.ha.
OUTPUTS
Beef 34480 453 595
Sheep 32480 427 664
Crops and forage 11946 157 129
Single Payment Scheme 20129 265 306
Indirect subsidies 2446 32 31
Miscellaneous income 6057 80 106
TOTAL OUTPUTS 107538 1414 1831
INPUTS
Feeds 14099 185 203
Tack and grass keep 2663 35 60
Veterinary and medicines 2599 34 38
Other livestock costs 5772 76 101
Fertilisers 6387 84 82
Other crop costs 3154 41 32
Allocatable contracting 3817 50 57
TOTAL VARIABLE COSTS 38491 505 573
Paid labour 2784 37 36
Other contracting / machinery hire 708 9 9
Fuel and repairs 8910 117 130
Machinery depreciation 10127 133 131
General farming costs 8671 114 136
Land expenses 3004 39 35
Buildings depreciation 2335 31 34
TOTAL OVERHEAD COSTS 36539 480 511
TOTAL INPUTS 75030 985 1084
PROFIT BEFORE RENT AND FINANCE 32508 429 747
Rent 4712 62 21
Finance 2169 29 12
PROFIT AFTER RENT AND FINANCE 25627 338 714
Unpaid labour 3594 47 65
12
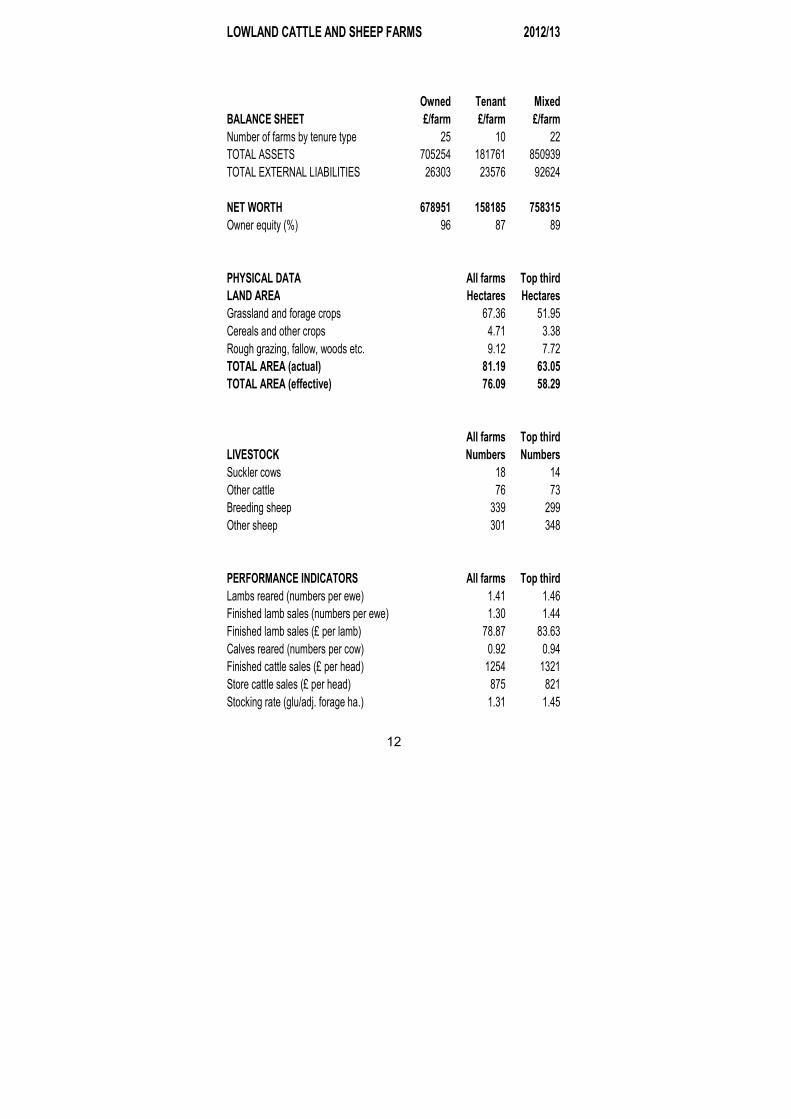
LOWLAND CATTLE AND SHEEP FARMS 2012/13
Owned Tenant Mixed
BALANCE SHEET £/farm £/farm £/farm
Number of farms by tenure type 25 10 22
TOTAL ASSETS 705254 181761 850939
TOTAL EXTERNAL LIABILITIES 26303 23576 92624
NET WORTH 678951 158185 758315
Owner equity (%) 96 87 89
PHYSICAL DATA All farms Top third
LAND AREA Hectares Hectares
Grassland and forage crops 67.36 51.95
Cereals and other crops 4.71 3.38
Rough grazing, fallow, woods etc. 9.12 7.72
TOTAL AREA (actual) 81.19 63.05
TOTAL AREA (effective) 76.09 58.29
All farms Top third
LIVESTOCK Numbers Numbers
Suckler cows 18 14
Other cattle 76 73
Breeding sheep 339 299
Other sheep 301 348
PERFORMANCE INDICATORS All farms Top third
Lambs reared (numbers per ewe) 1.41 1.46
Finished lamb sales (numbers per ewe) 1.30 1.44
Finished lamb sales (£ per lamb) 78.87 83.63
Calves reared (numbers per cow) 0.92 0.94
Finished cattle sales (£ per head) 1254 1321
Store cattle sales (£ per head) 875 821
Stocking rate (glu/adj. forage ha.) 1.31 1.45

13
HILL AND UPLAND DAIRY FARMS 2012/13
WHOLE FARM DATA Number of farms : 68
All farms All farms Top third
£/farm £/eff.ha. £/eff.ha.
OUTPUTS
Dairy - milk 209638 2365 3111
- other output 2745 31 58
Other cattle 39194 442 489
Sheep 10432 118 100
Crops and forage 5804 65 39
Single Payment Scheme 23917 270 327
Indirect subsidies 1783 20 23
Miscellaneous income 3633 41 56
TOTAL OUTPUTS 297146 3352 4203
INPUTS
Feeds 81044 914 1033
Tack and grass keep 11067 125 141
Veterinary and medicines 9435 106 119
Other livestock costs 21926 247 271
Fertilisers 18397 208 211
Other crop costs 5621 63 59
Allocatable contracting 12910 146 143
TOTAL VARIABLE COSTS 160400 1809 1977
Paid labour 9963 112 133
Other contracting / machinery hire 2045 23 15
Fuel and repairs 17988 203 213
Machinery depreciation 17751 200 250
General farming costs 16612 187 197
Land expenses 7599 86 92
Buildings depreciation 8387 95 83
TOTAL OVERHEAD COSTS 80345 906 983
TOTAL INPUTS 240745 2715 2960
PROFIT BEFORE RENT AND FINANCE 56401 637 1243
Rent 3991 45 55
Finance 7951 90 45
PROFIT AFTER RENT AND FINANCE 44459 502 1143
Unpaid labour 9815 111 145

14
HILL AND UPLAND DAIRY FARMS 2012/13
Owned Tenant Mixed
BALANCE SHEET £/farm £/farm £/farm
Number of farms by tenure type 35 2 31
TOTAL ASSETS 1166607 - 851078
TOTAL EXTERNAL LIABILITIES 197529 - 198880
NET WORTH 969078 - 652198
Owner equity (%) 83 - 77
PHYSICAL DATA All farms Top third
LAND AREA Hectares Hectares
Grassland and forage crops 84.14 76.21
Cereals and other crops 1.80 0.96
Rough grazing, fallow, woods etc. 10.47 8.28
TOTAL AREA (actual) 96.41 85.45
TOTAL AREA (effective) 88.65 78.88
All farms Top third
LIVESTOCK Numbers Numbers
Dairy cattle 114 122
Suckler cows 1 2
Other cattle 109 102
Breeding sheep 195 147
Other sheep 87 62
PERFORMANCE INDICATORS All farms Top third
Milk yield (litres per cow) 6720 7164
Margin over concentrates (£ per cow) 1219 1401
Milk disposal (£ per cow) 1799 1976
Milk price (pence per litre) 27.26 28.04
Stocking rate (glu/adj. forage ha.) 1.91 2.00

15
LOWLAND DAIRY FARMS 2012/13
WHOLE FARM DATA Number of farms : 58
All farms All farms Top third
£/farm £/eff.ha. £/eff.ha.
OUTPUTS
Dairy - milk 320866 2797 3285
- other output -5042 -44 9
Other cattle 51013 445 485
Sheep 4264 37 63
Crops and forage 7036 61 98
Single Payment Scheme 33579 293 322
Indirect subsidies 2492 22 15
Miscellaneous income 4951 43 33
TOTAL OUTPUTS 419159 3654 4310
INPUTS
Feeds 111356 971 1116
Tack and grass keep 12465 109 112
Veterinary and medicines 12757 111 118
Other livestock costs 28585 249 238
Fertilisers 22420 195 179
Other crop costs 8679 76 89
Allocatable contracting 19245 168 157
TOTAL VARIABLE COSTS 215507 1879 2009
Paid labour 25361 221 131
Other contracting / machinery hire 3108 27 22
Fuel and repairs 25408 221 212
Machinery depreciation 22954 200 228
General farming costs 25139 219 209
Land expenses 7983 70 85
Buildings depreciation 10866 95 104
TOTAL OVERHEAD COSTS 120819 1053 991
TOTAL INPUTS 336326 2932 3000
PROFIT BEFORE RENT AND FINANCE 82833 722 1310
Rent 7202 63 39
Finance 9884 86 28
PROFIT AFTER RENT AND FINANCE 65747 573 1243
Unpaid labour 10562 92 136

16
LOWLAND DAIRY FARMS 2012/13
Owned Tenant Mixed
BALANCE SHEET £/farm £/farm £/farm
Number of farms by tenure type 25 6 27
TOTAL ASSETS 1602312 275015 1380232
TOTAL EXTERNAL LIABILITIES 274182 36953 275500
NET WORTH 1328130 238062 1104732
Owner equity (%) 83 87 80
PHYSICAL DATA All farms Top third
LAND AREA Hectares Hectares
Grassland and forage crops 108.98 90.75
Cereals and other crops 5.17 6.61
Rough grazing, fallow, woods etc. 6.97 6.70
TOTAL AREA (actual) 121.12 104.06
TOTAL AREA (effective) 114.73 98.23
All farms Top third
LIVESTOCK Numbers Numbers
Dairy cattle 169 147
Suckler cows 0 0
Other cattle 151 128
Breeding sheep 80 112
Other sheep 35 38
PERFORMANCE INDICATORS All farms Top third
Milk yield (litres per cow) 6655 7573
Margin over concentrates (£ per cow) 1315 1536
Milk disposal (£ per cow) 1875 2159
Milk price (pence per litre) 28.57 29.00
Stocking rate (glu/adj. forage ha.) 2.13 2.18

17
GROSS MARGINS : HILL SHEEP 2012/13All flocks Top third
Number of flocks in sample 211 70
Flock size (ewes and ewe lambs put to ram) 661 528
Lambs reared (numbers per ewe) 1.18 1.35
ENTERPRISE OUTPUT £ per ewe £ per ewe
Lamb sales - store 3.32 1.34
- finished 52.17 74.43
Other sheep sales 14.31 20.27
Wool sales 2.65 3.09
Miscellaneous 0.10 0.08
Valuation change 2.28 3.23
Sheep purchases -6.35 -8.84
TOTAL ENTERPRISE OUTPUT 68.48 93.60
VARIABLE COSTS
Concentrates and bulk feed 16.73 17.74
Stock keep 2.90 1.80
Veterinary and medicines 4.57 5.39
Other livestock costs 5.52 6.28
Allocatable contracting 1.05 1.09
Forage variable costs 11.15 11.56
TOTAL VARIABLE COSTS 41.92 43.86
GROSS MARGIN 26.56 49.74
GROSS MARGINS : UPLAND SHEEP 2012/13
All flocks Top third
Number of flocks in sample 73 24
Flock size (ewes and ewe lambs put to ram) 478 591
Lambs reared (numbers per ewe) 1.36 1.58
ENTERPRISE OUTPUT £ per ewe £ per ewe
Lamb sales - store 2.77 0.66
- finished 88.64 117.96
Other sheep sales 14.00 18.73
Wool sales 3.12 3.52
Miscellaneous 0.00 0.00
Valuation change 1.62 3.97
Sheep purchases -18.14 -24.01
TOTAL ENTERPRISE OUTPUT 92.01 120.83
VARIABLE COSTS
Concentrates and bulk feed 20.15 21.10
Stock keep 1.51 1.13
Veterinary and medicines 5.28 5.15
Other livestock costs 6.85 7.05
Allocatable contracting 1.09 1.21
Forage variable costs 17.07 17.91
TOTAL VARIABLE COSTS 51.95 53.55
GROSS MARGIN 40.06 67.28

18
GROSS MARGINS : LOWLAND SHEEP 2012/13All flocks Top third
Number of flocks in sample 45 15
Flock size (ewes and ewe lambs put to ram) 326 341
Lambs reared (numbers per ewe) 1.46 1.61
ENTERPRISE OUTPUT £ per ewe £ per ewe
Lamb sales - store 0.45 0.61
- finished 101.85 120.08
Other sheep sales 16.56 24.24
Wool sales 3.22 3.71
Miscellaneous 0.04 0.12
Valuation change 3.23 1.94
Sheep purchases -18.22 -21.26
TOTAL ENTERPRISE OUTPUT 107.13 129.44
VARIABLE COSTS
Concentrates and bulk feed 20.77 18.58
Stock keep 1.06 1.09
Veterinary and medicines 6.26 6.17
Other livestock costs 7.77 8.50
Allocatable contracting 1.24 1.41
Forage variable costs 16.70 15.38
TOTAL VARIABLE COSTS 53.80 51.13
GROSS MARGIN 53.33 78.31 GROSS MARGINS : LOWLAND SUCKLER COWS 2012/13
All herds Top third
Number of herds in sample 24 8
Herd size (breeding cows) 41 57
Calves reared (numbers per cow) 0.91 0.94
Finished cattle sales (£ per head) 1253 1286
Store cattle sales (£ per head) 813 1111
ENTERPRISE OUTPUT £ per cow £ per cow
Calf and store cattle sales 225.33 124.12
Bull and cow sales 149.89 186.56
Finished cattle sales 854.85 1283.27
Valuation change 56.19 -45.33
Cattle purchases -140.87 -78.88
TOTAL ENTERPRISE OUTPUT 1145.39 1469.74
VARIABLE COSTS
Concentrates and bulk feed 191.39 267.64
Veterinary and medicines 40.16 46.04
Other livestock costs 98.01 91.51
Allocatable contracting 10.72 19.88
Forage variable costs 225.55 217.79
TOTAL VARIABLE COSTS 565.83 642.86
GROSS MARGIN 579.56 826.88
19
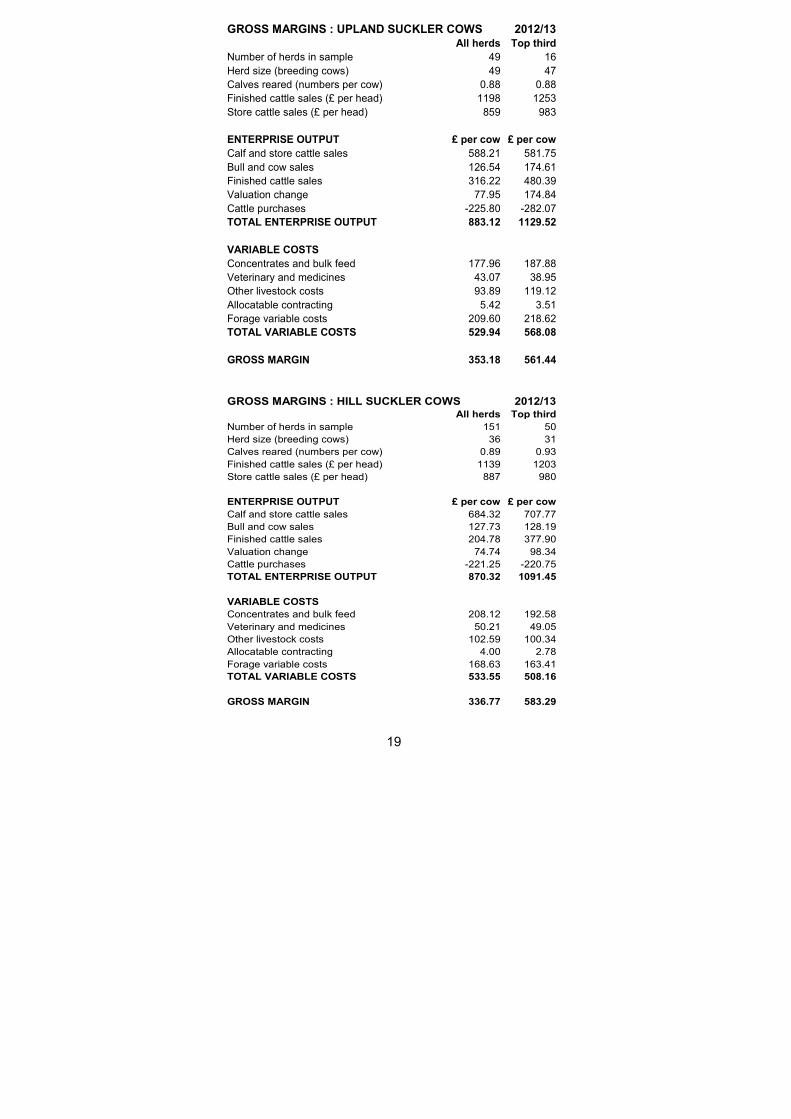
GROSS MARGINS : UPLAND SUCKLER COWS 2012/13All herds Top third
Number of herds in sample 49 16
Herd size (breeding cows) 49 47
Calves reared (numbers per cow) 0.88 0.88
Finished cattle sales (£ per head) 1198 1253
Store cattle sales (£ per head) 859 983
ENTERPRISE OUTPUT £ per cow £ per cow
Calf and store cattle sales 588.21 581.75
Bull and cow sales 126.54 174.61
Finished cattle sales 316.22 480.39
Valuation change 77.95 174.84
Cattle purchases -225.80 -282.07
TOTAL ENTERPRISE OUTPUT 883.12 1129.52
VARIABLE COSTS
Concentrates and bulk feed 177.96 187.88
Veterinary and medicines 43.07 38.95
Other livestock costs 93.89 119.12
Allocatable contracting 5.42 3.51
Forage variable costs 209.60 218.62
TOTAL VARIABLE COSTS 529.94 568.08
GROSS MARGIN 353.18 561.44 GROSS MARGINS : HILL SUCKLER COWS 2012/13
All herds Top third
Number of herds in sample 151 50
Herd size (breeding cows) 36 31
Calves reared (numbers per cow) 0.89 0.93
Finished cattle sales (£ per head) 1139 1203
Store cattle sales (£ per head) 887 980
ENTERPRISE OUTPUT £ per cow £ per cow
Calf and store cattle sales 684.32 707.77
Bull and cow sales 127.73 128.19
Finished cattle sales 204.78 377.90
Valuation change 74.74 98.34
Cattle purchases -221.25 -220.75
TOTAL ENTERPRISE OUTPUT 870.32 1091.45
VARIABLE COSTS
Concentrates and bulk feed 208.12 192.58
Veterinary and medicines 50.21 49.05
Other livestock costs 102.59 100.34
Allocatable contracting 4.00 2.78
Forage variable costs 168.63 163.41
TOTAL VARIABLE COSTS 533.55 508.16
GROSS MARGIN 336.77 583.29
20
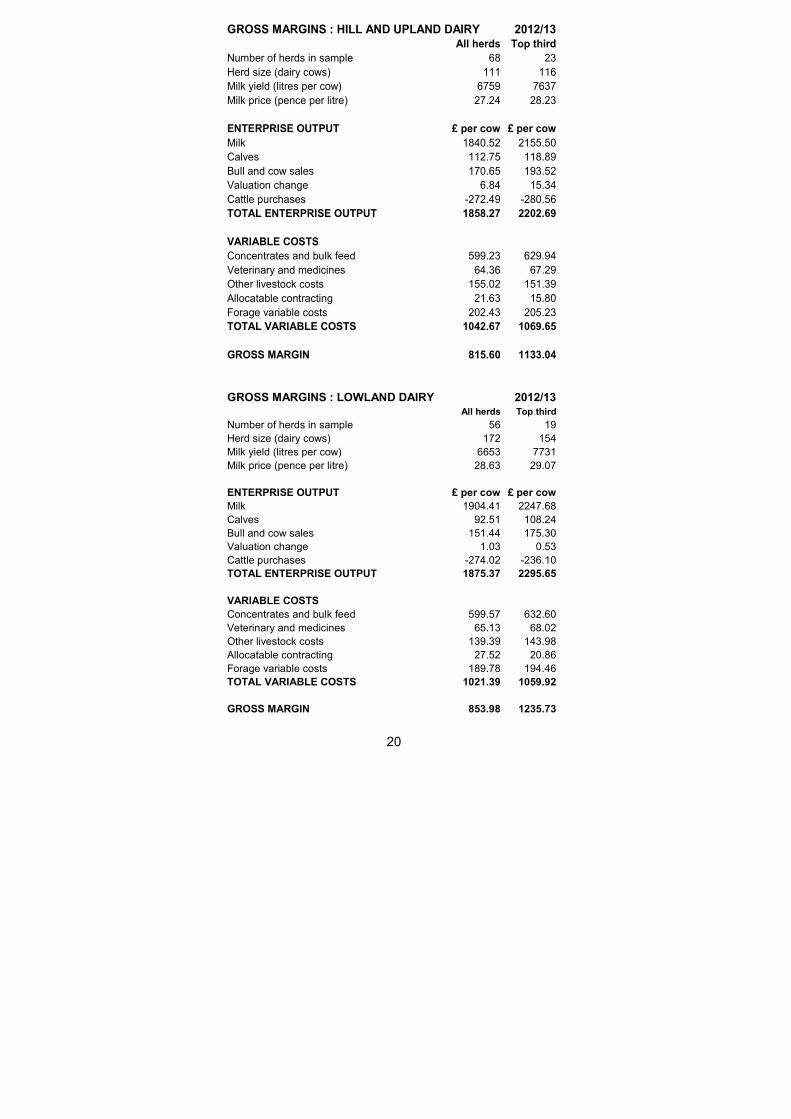
GROSS MARGINS : HILL AND UPLAND DAIRY 2012/13All herds Top third
Number of herds in sample 68 23
Herd size (dairy cows) 111 116
Milk yield (litres per cow) 6759 7637
Milk price (pence per litre) 27.24 28.23
ENTERPRISE OUTPUT £ per cow £ per cow
Milk 1840.52 2155.50
Calves 112.75 118.89
Bull and cow sales 170.65 193.52
Valuation change 6.84 15.34
Cattle purchases -272.49 -280.56
TOTAL ENTERPRISE OUTPUT 1858.27 2202.69
VARIABLE COSTS
Concentrates and bulk feed 599.23 629.94
Veterinary and medicines 64.36 67.29
Other livestock costs 155.02 151.39
Allocatable contracting 21.63 15.80
Forage variable costs 202.43 205.23
TOTAL VARIABLE COSTS 1042.67 1069.65
GROSS MARGIN 815.60 1133.04 GROSS MARGINS : LOWLAND DAIRY 2012/13
All herds Top third
Number of herds in sample 56 19
Herd size (dairy cows) 172 154
Milk yield (litres per cow) 6653 7731
Milk price (pence per litre) 28.63 29.07
ENTERPRISE OUTPUT £ per cow £ per cow
Milk 1904.41 2247.68
Calves 92.51 108.24
Bull and cow sales 151.44 175.30
Valuation change 1.03 0.53
Cattle purchases -274.02 -236.10
TOTAL ENTERPRISE OUTPUT 1875.37 2295.65
VARIABLE COSTS
Concentrates and bulk feed 599.57 632.60
Veterinary and medicines 65.13 68.02
Other livestock costs 139.39 143.98
Allocatable contracting 27.52 20.86
Forage variable costs 189.78 194.46
TOTAL VARIABLE COSTS 1021.39 1059.92
GROSS MARGIN 853.98 1235.73

21
LAMB PRODUCTION COSTS 2012/13
Pence per kg liveweight Top Bottom
All farms third third
Number of farms 124 41 41
Feed 39.42 32.21 45.03
Veterinary and medicines 10.73 9.03 12.33
Other livestock costs 16.47 14.21 17.34
Forage 27.66 20.69 33.07
TOTAL VARIABLE COSTS 94.28 76.14 107.77
FLOCK REPLACEMENT 14.97 8.68 23.78
Paid labour 6.27 3.77 8.56
Power and machinery 45.77 32.58 63.78
Buildings 12.83 9.51 17.59
General farm costs 18.95 13.89 24.97
Rent 7.20 3.60 14.19
Finance 5.09 2.41 7.90
TOTAL OVERHEAD COSTS 96.11 65.76 136.99
TOTAL COSTS 205.36 150.58 268.54
NET MARGIN -26.32 32.03 -96.19
Lambs reared (nos. per ewe) 1.32 1.44 1.18
Flock size 642 579 681
Average lamb liveweight (kg) 38.77 41.20 35.50
MILK PRODUCTION COSTS 2012/13
Pence per litre Top Bottom
All farms third third
Number of farms 124 41 41
Feed 8.50 7.55 9.63
Veterinary and medicines 0.94 0.87 1.04
Other livestock costs 2.62 1.93 3.20
Forage 2.81 2.26 3.50
TOTAL VARIABLE COSTS 14.87 12.61 17.37
HERD REPLACEMENT 1.65 0.74 2.56
Paid labour 0.91 0.49 1.53
Power and machinery 3.05 2.82 3.16
Buildings 1.09 0.97 1.17
General farm costs 1.46 1.28 1.67
Rent 0.34 0.28 0.36
Finance 0.50 0.16 0.85
TOTAL OVERHEAD COSTS 7.35 6.00 8.74
TOTAL COSTS 23.87 19.35 28.67
NET MARGIN 5.18 10.01 0.04
Margin over concentrates 19.54 20.71 18.59
Milk price 27.40 27.77 27.02

22
BEEF PRODUCTION COSTS : SUCKLED CALF 2012/13
Pence per kg liveweight Top Bottom
All farms third third
Number of farms 37 12 12
Feed 22.75 10.52 38.59
Veterinary and medicines 12.79 10.28 12.12
Other livestock costs 16.90 14.78 25.00
Forage 45.88 32.02 62.71
TOTAL VARIABLE COSTS 98.32 67.60 138.42
HERD REPLACEMENT 4.34 1.17 5.58
Paid labour 12.28 2.02 28.14
Power and machinery 80.30 61.19 102.27
Buildings 23.34 15.56 29.03
General farm costs 31.80 22.63 39.32
Rent 7.42 2.84 6.73
Finance 5.38 2.60 6.62
TOTAL OVERHEAD COSTS 160.52 106.84 212.11
TOTAL COSTS 263.18 175.61 356.11
NET MARGIN -108.42 -20.01 -211.26
Suckled calf production covers suckler cow and calf costs up to weaning. BEEF PRODUCTION COSTS : FINISHING 2012/13
Pence per kg liveweight Top Bottom
All farms third third
Number of farms 20 7 7
Feed 66.11 54.17 90.02
Veterinary and medicines 5.02 5.44 4.30
Other livestock costs 28.74 21.12 38.70
Forage 34.78 30.39 31.58
TOTAL VARIABLE COSTS 134.65 111.12 164.60
Paid labour 8.23 11.50 8.53
Power and machinery 59.55 43.40 69.71
Buildings 15.73 9.90 17.54
General farm costs 25.52 17.56 30.64
Rent 4.62 3.11 5.89
Finance 3.82 1.56 2.79
TOTAL OVERHEAD COSTS 117.47 87.03 135.10
TOTAL COSTS 252.12 198.15 299.70
NET MARGIN -12.53 41.35 -78.11
Finishing enterprises include those purchasing young and forward store cattle, as well as those finishing weaned home-bred calves.
23
Farming Connect – support to develop your business
Farming Connect is the Welsh Government’s support service for farm and forestry businesses in Wales. Our regionally based delivery staff can help you access a package of support, tailored to supporting and developing your business.
• Knowledge Transfer Programme – our wide range of fully funded Farming Connect events, meetings and workshops will keep you up to date with the latest technical information and guidance, while also enabling you to share best practice and learn from industry specialists.
• Whole Farm Plan and Farm Advisory Service - providing eligible businesses with business and technical guidance. Eligible farmers can claim back 80% funding towards the cost of one-to-one support and advice on a wide range of topics.
• Skills Development Programme – a wide range of training courses available to eligible farmers, who can claim back 80% of the cost. Ask for a free skills assessment and learn how to improve your working practices, meet statutory requirements or diversify into new areas.
• Events and networking - join our facilitated local discussion groups and wide range of networking events or one-to-one surgeries to share experiences with other farmers, discuss topical issues with specialists and develop your business.
• Diversification and business management - Our Agrisgôp groups meet on a regular basis providing support on a wide range of topics.
Call the Farming Connect Service Centre on 08456 000 813 or visit www.farmingconnect.co.uk
Farming Connect is funded through the Rural Development Plan 2007-2013, which is financed by the European Agricultural Fund for Rural Development and the Welsh Government.