Embed Size (px)
Citation preview
Prices for Local Area Network Equipment
Mark DomsBoard of Governors of the Federal Reserve
Christopher FormanKellogg Graduate School of Management, Northwestern University
July 2, 2001
Please send correspondence to [email protected] or [email protected] are grateful to Carol Corrado, Shane Greenstein, Jack Triplett, and participants at theBrookings Workshop on Communications Output and Productivity for helpful comments andassistance. We wish to thank Jason Coburn, Jonathan Eller and Susan Polatz for outstandingresearch assistance. We also wish to thank Gregory Goldstein and Robert Drzyzgula for sharingtheir expertise about computer networks. The statements and results in this paper do notnecessarily reflect the views of the Board of Governors of the Federal Reserve.

1
I. Introduction
Though local area networking (LAN) equipment is seldom noticed and has received
comparatively little study, the importance of such hardware is vast. LAN equipment routes
information between computers and plays a part in every message sent and received over the
Internet. By 1999, sales of LAN equipment in the United States totaled close to $16 billion
dollars to become one of the single largest categories of communications equipment. In 1992,
spending on LAN equipment was just $3 billion. The rapid growth in the power, and the
reduction of price, of LAN equipment has facilitated the rapid growth in the use of personal
computers and the explosion in popularity of the Internet.
This paper presents the results of an analysis of price changes for four types in LAN
equipment--routers, switches, LAN cards, and hubs. Hedonic regressions were used to estimate
price changes for the two largest classes of LAN equipment, routers and switches. A matched
model was used for LAN cards and the prices for hubs were inferred by using an economic
relationship to switches.
As a preview to our conclusions, we find that prices the four groups of LAN equipment
fell at double-digit rates in the last half of the 1990s. Routers fell an average of about 14 percent
between 1995 and 1999, although results vary considerably across router classes. We also find
that between 1996 and 2000, the prices for switches fell faster than routers, averaging an annual
decline of about 22 percent. The prices for LAN cards dropped at an annual average rate of 18.3
percent. We estimate that the prices for hubs, the smallest portion of the LAN category, fell an
average of 19 percent. Between 1995 and 1999, our estimate of the price index for all LAN
equipment fell an average of 17 percent--pulled down by switches and hubs but held up by
routers. These results stand in sharp contrast to the PPI for communications equipment that is
nearly flat over the 1990s. However, the declines in the prices for LAN equipment, although
dramatic, are less than the decline in computer prices.
The rest of this introduction attempts to answer the question: Why do we examine this
topic? There are three basic reasons. First, a greater share of communications equipment is
being used for data instead of voice; LAN equipment is one chunk of the data communications
revolution. Looking into the future, the importance of data communications is likely to grow.
So, gaining a better understanding LAN equipment will give us a much better understanding of
equipment that is becoming an increasing share of total communications equipment.

2
The second reason we explore prices for LAN equipment is that there is a widespread
belief that official measures for prices in the more aggregate category of communications
equipment do not accurately capture quality changes. This belief stems from several sources,
including a couple of studies that examined small parts of the communications equipment
spectrum previously, and the high-tech nature of communications equipment. Once we get a
better handle on what has happened to prices for LAN equipment, we will then be better able to
address questions on how investment in communications equipment affects output measurement,
and how communications equipment investment may be related to the acceleration in aggregate
productivity growth.1
Lastly, segments of the LAN equipment market are dominated by Cisco. We generally
find that the segments where Cisco faces the greatest competition are the segments where prices
fall the fastest. Although in no way do we formally test this relationship, our findings are
suggestive of areas for further research.
How important is LAN equipment?
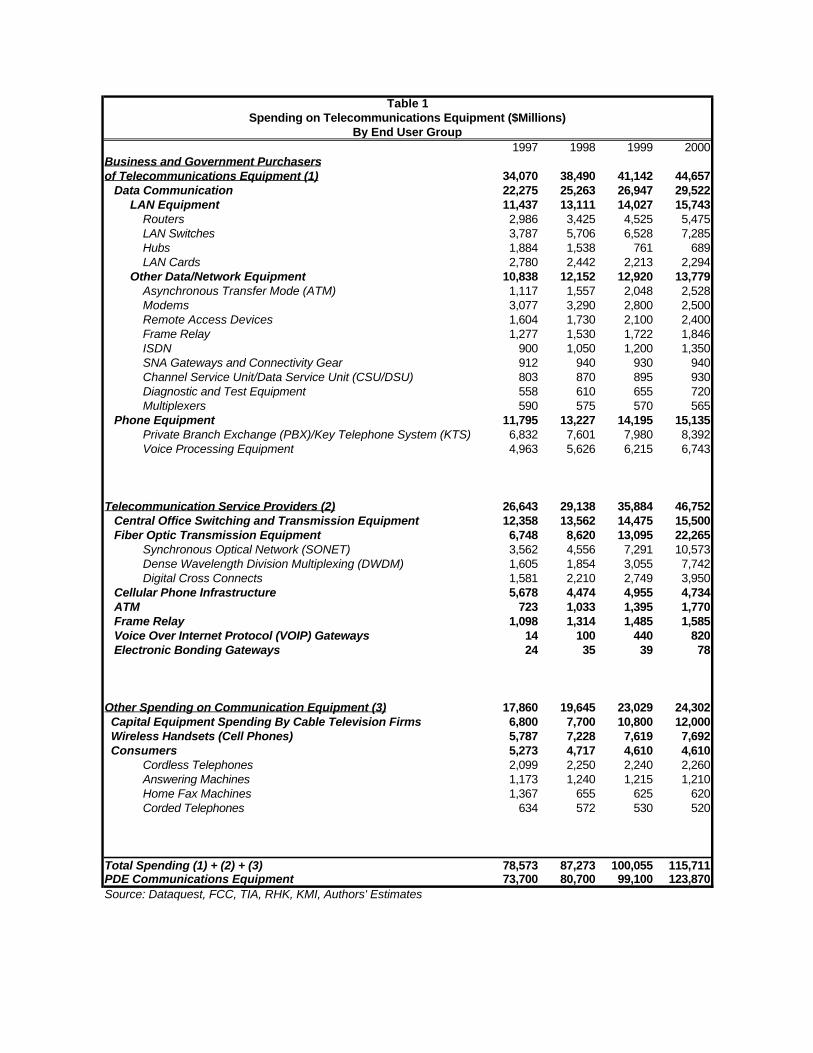
Table 1 presents estimates of communications equipment spending by end user group and
type of equipment. The estimates come from a large array of sources, most of which are private
firms that track portions of the communications equipment industry. The end users groups are
telecommunication service providers, business and government, and other. It is surprising to see
that the business and government group spent more on communications equipment then telecom
service providers in three of the last four years--in 2000, telecom service providers had a large
surge in spending, especially in fiber optic transmission equipment. Within the business and
government group, a majority of communications equipment expenditures is on data
communications equipment, the largest component being LAN equipment.
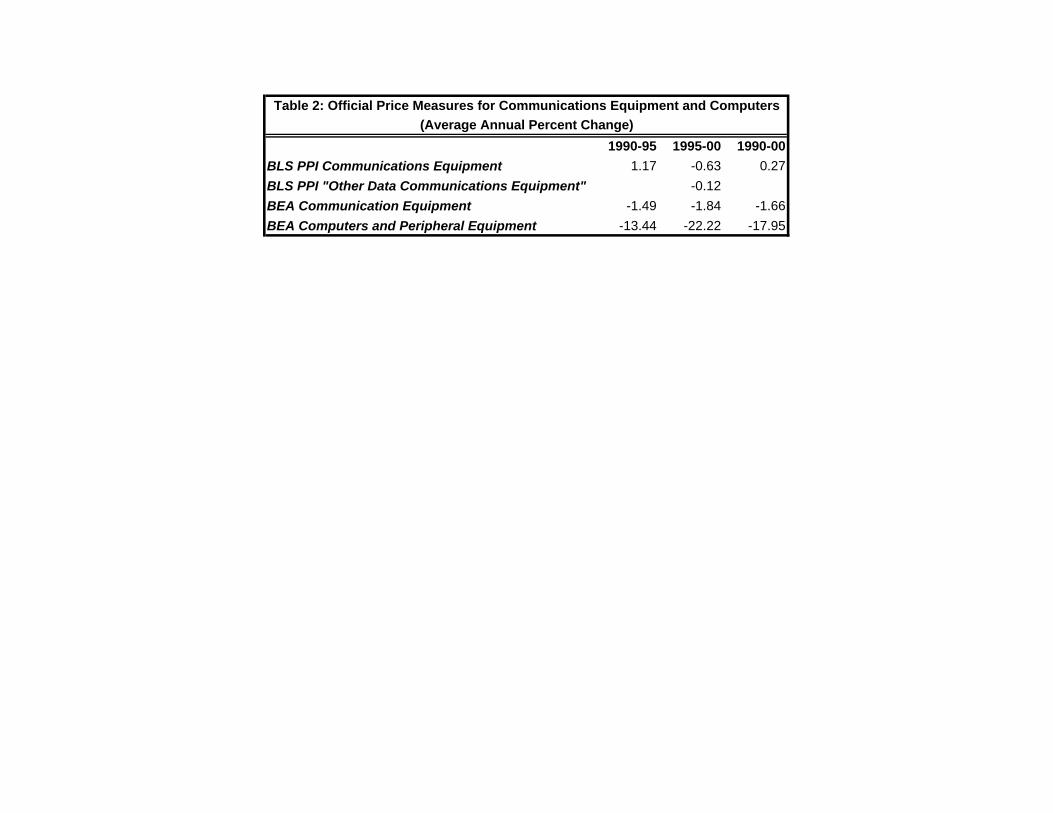
Official prices measures
Table 2 presents summaries of some official price measures for communications
equipment and computers during the past decade. The table shows the average annual percent
change in price for the selected series for the 1990-1995, 1995-2000, and the 1990-2000 periods.
The PPI for overall communications equipment grows slightly (0.3 percent per year) over the
1 Jorgenson and Stiroh (2000) examine the implications of falling communications equipment prices onproductivity growth
3
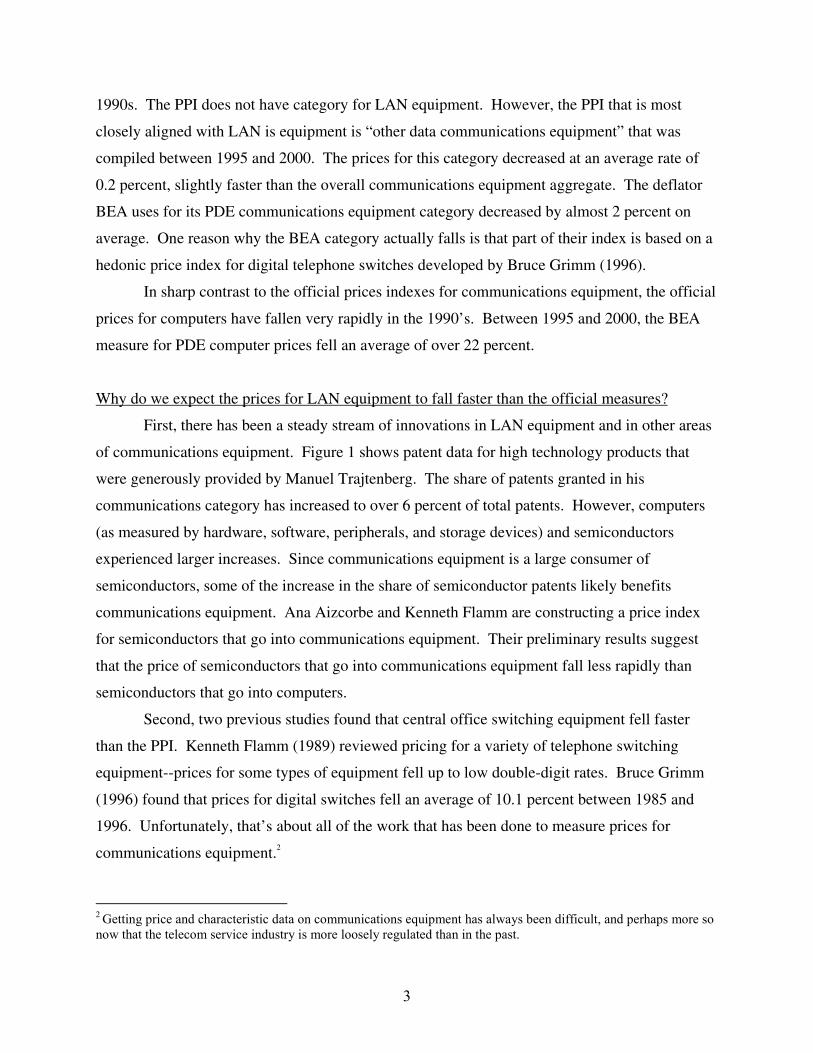
1990s. The PPI does not have category for LAN equipment. However, the PPI that is most
closely aligned with LAN is equipment is “other data communications equipment” that was
compiled between 1995 and 2000. The prices for this category decreased at an average rate of
0.2 percent, slightly faster than the overall communications equipment aggregate. The deflator
BEA uses for its PDE communications equipment category decreased by almost 2 percent on
average. One reason why the BEA category actually falls is that part of their index is based on a
hedonic price index for digital telephone switches developed by Bruce Grimm (1996).
In sharp contrast to the official prices indexes for communications equipment, the official
prices for computers have fallen very rapidly in the 1990’s. Between 1995 and 2000, the BEA
measure for PDE computer prices fell an average of over 22 percent.
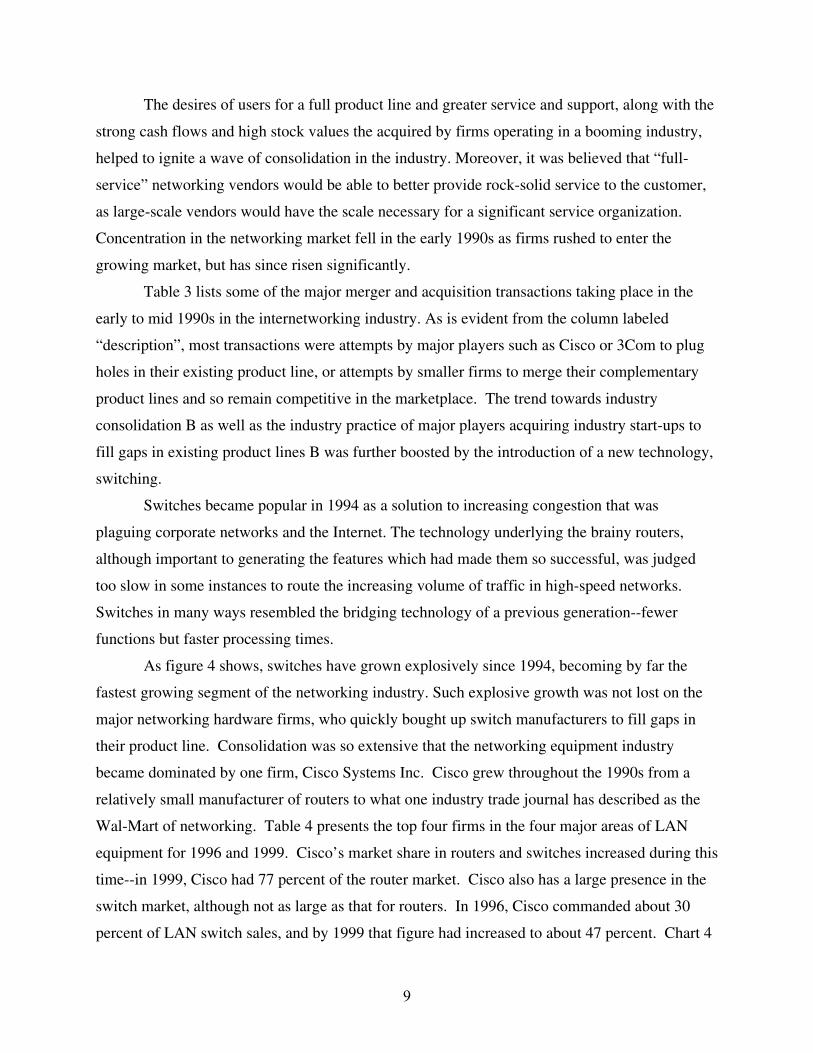
Why do we expect the prices for LAN equipment to fall faster than the official measures?
First, there has been a steady stream of innovations in LAN equipment and in other areas
of communications equipment. Figure 1 shows patent data for high technology products that
were generously provided by Manuel Trajtenberg. The share of patents granted in his
communications category has increased to over 6 percent of total patents. However, computers
(as measured by hardware, software, peripherals, and storage devices) and semiconductors
experienced larger increases. Since communications equipment is a large consumer of
semiconductors, some of the increase in the share of semiconductor patents likely benefits
communications equipment. Ana Aizcorbe and Kenneth Flamm are constructing a price index
for semiconductors that go into communications equipment. Their preliminary results suggest
that the price of semiconductors that go into communications equipment fall less rapidly than
semiconductors that go into computers.
Second, two previous studies found that central office switching equipment fell faster
than the PPI. Kenneth Flamm (1989) reviewed pricing for a variety of telephone switching
equipment--prices for some types of equipment fell up to low double-digit rates. Bruce Grimm
(1996) found that prices for digital switches fell an average of 10.1 percent between 1985 and
1996. Unfortunately, that’s about all of the work that has been done to measure prices for
communications equipment.2
2 Getting price and characteristic data on communications equipment has always been difficult, and perhaps more sonow that the telecom service industry is more loosely regulated than in the past.

4
Third, the most convincing reason is also the most difficult to quantify--throughout the
communications equipment universe, significant changes have occurred in the last decade, so
many changes that it is very difficult for financially hamstrung statistical agencies to keep track.
As shown in this paper, LAN equipment has drastically improved.
The rest of the paper is as follows. In section II we briefly discuss the technology of
computer networking. In particular, we discuss networking equipment products known as
routers, switches, LAN cards, and hubs. These products act as “traffic cops”, routing the flow of
information through a network or through the Internet. We also discuss the history and
development of the computer networking industry. In section III we discuss the construction of
and regression diagnostics on hedonic price regressions for routers and switches. This section
also includes the matched-model analysis of LAN cards. Section IV presents some alternative
price measures based on our hedonic results for routers. Section V presents the aggregate price
index for LAN equipment and some concluding thoughts.
II. Local Area Networks
II.1 Overview of LAN equipmentThe basic manner in which data communications takes place is, broadly speaking, little
different from the method by which voice communications takes place--a common language, or
protocol, is used so that communications can be sent from a sender to a receiver. This language
is translated by various means into a signal that travels over a physical medium, such as copper
wire, fiber optic cable, or over the airwaves. Because of the physical impossibility of maintaining
direct communications links between every possible sender and receiver of data, network traffic
travels over the physical medium through a series of nodes which, like circuit switches in the
telephone communications infrastructure, act to guide and regulate traffic over the network.
LAN equipment are the devices that direct traffic between computers, making possible
email transmission, Internet browsing, and file sharing with co-workers. LANs are used to
connect small groups of users who are usually located physically close to one another and who
may often wish to utilize a shared resource such as a printer or some other peripheral. Users in a
LAN are often grouped not only physically but also functionally, so that the most frequent
contacts for a user within a LAN will usually be other users within the same LAN.
To make some sense of the various LAN devices, figure 2 has a simplified and partial
diagram of the LAN at the Federal Reserve. When an email is sent from a computer in the

5
Research and Statistics Division (the bottom right of the figure), the computer breaks the
message into pieces, called packets. The packets are sent through the computer’s network
interface card, a device that physically connects the PC to the computer network. The packets go
to a switch. Switches act as filters, making simple decisions as to which packets are to be sent
up to the next level and which packets should be sent to other users that share the switch. For
instance, if a file is to be printed, the packets of information can stay in the local loop and not
congest network traffic further up. Switches operate much like circuit switches in the public
telephone network, acting as nodes that take incoming traffic and then redirect it in a direction
toward its final destination. Basically, a switch is a device with multiple ports in which
messages enter into one port and are then processed internally and redirected on toward another
port to send the message on to its final destination. Today’s switches are advanced products,
often coming complete with hundreds of ports and capable of redirecting millions of packets of
information a second.
The switch sends the email message up to a router that oversees the Research and
Division. A router is a sophisticated device that decides where packets should be sent next,
depending on traffic congestion and the packet’s final destination. If the message is intended for
a coworker, the router send the message back down the network. In the case of an email to
someone outside the board, the message will be sent along a fiber optic loop that connects all of
the divisions at the Board. The message then hits another router and sends them to the Internet.
Routers are often the central “brains” behind any network. Like switches, routers work to direct
packets of information across a network. However, differences in the ways in which routers and
switches work have given routers some functionality that switches do not have. Routers are able
to communicate with one another in a way that allows the router to optimize network traffic,
determining the optimal path through which a packet of information should flow. In addition, the
architecture of routers allow them to include network management and security features that
switches are incapable of providing, allowing network managers to identify problems and
congestion within a network with ease as well as providing protection to keep the network safe
from outside intruders.
When an email is sent from one of the Federal Reserve Governors, packets of
information are again sent through a computer interface card into the LAN. Packets in this case
travel to a hub. Like switches, hubs are used to connect computers in a LAN, or to allow multiple
computers to share a given network line. Unlike switches or routers, however, hubs do not filter

6
packets. Instead, they simply route packets received from one port to all of the other ports, so
that all segments of the LAN can see the packets. While still commonly used, hubs are much
simpler devices than either routers or switches, generally lacking many of the management
features as well as the filtering capabilities of those products.
Today’s routers and switches are very complicated devices, carrying advanced processing
devices and sometimes costing hundreds of thousands of dollars. Some are capable of handling
millions of packets of information every second, redirecting them along complicated networks
with seemingly limitless branches. Development of this technology over the past decade has
been extraordinarily rapid. Maintaining abreast of this market was difficult for even the most
informed of network managers. It is in this complicated, even bewildering, environment that the
IS managers have been forced to choose equipment for their company’s networks throughout the
1980s and 1990s. As we shall see, the extremely complicated nature of these products will have
important implications for how we view the welfare benefits of networking equipment.
II.2 A Brief History of Computer Networking and Internetworking
II.2.1 Early History, the 1980s
The history of the development of computer networking equipment has paralleled the
development of the computer. Computer networking emerged first as a means by which users
could interface remotely with mainframe computers. International Business Machines (IBM)
and Digital Equipment Corporation (DEC) developed communications protocols named Systems
Network Architecture (SNA) and DECnet, respectively, to allow users to interact with their
mainframes and minicomputers. Throughout the 1970s and 1980s, these communications
protocols, and their associated network architectures, dominated the data communications
landscape. With the birth of personal computers, simple LANs came into use. Small LANs that
covered short distances were the most common at first since there were difficulties in
transmitting data over far distances.
LANs were found to be very useful, as users were able to communicate and share files in
ways that before seemed impossible. However, there was soon found to be a limit to the number
of computers that could be on a given LAN. Networks require open bandwidth for information
to travel, and a network that has too many users quickly becomes congested, slowing traffic on
the network. To solve this problem, network managers divided their networks into sets of
smaller LANs. These smaller LANs would in turn be linked together by devices known as

7
bridges or routers, which route network traffic from one LAN segment to another. Though the
tasks performed by routers and bridges were similar, they were accomplished by slightly
different means. Routers were intelligent devices that were slower than bridges but had
additional functionality that allowed them to determine the optimal path through which any
message should travel through the network. Bridges were faster, but had no such functionality.
In time, the added functionality of routers was seen to be very beneficial, and routers became the
predominant form of internetworking equipment.
A trend that began in the 1980s that had important ramifications for the LAN industry
was that users and manufacturers came to rely more and more on open protocols. The major set
of protocols used for the Internet, TCP/IP, had been developed in the 1970s by the Department of
Defense. LANs used a set of standards and protocols called ethernet that was developed at
Xerox Corporation’s Palo Alto Research Center in the late 1970s and early 1980s. Xerox’s
ethernet was an open standard. Still, the new openness of standards did not evolve into a single
new, openly published protocol, but rather developers learned to use a variety of protocols
already in use by manufacturers. Thus, many open protocols came into widespread acceptance--
token ring, ATM, TCP/IP, ethernet--and many more. However, two standards gained the most
widespread acceptance; ethernet came to be used most often for corporate networks while
TCP/IP became the dominant standard in the Internet.3
3 This is oversimplifying things a bit. To be precise, data communications takes place in several stages, or layers.Each layer must be conducted within the parameters of a specific protocol, and the protocols in use vary dependingon layer. The protocols mentioned refer to the network layer of data communications, and are the standards mostcommonly thought of when referring to network protocols.

8
II.2.2 Computer Networking in the 1990s
By the early 1990’s the networking business soared, boosted by the migration of
information systems from mainframe to client/server (C/S) computing platforms. The advent of
open standards and the continued proliferation of networking protocols used in C/S helped to
make multiprotocol routers--routers that were capable of supporting a variety of differing
protocols--particularly popular. The June 1991 issue of Data Communications magazine noted
that “no less than 10 vendors have announced multiprotocol routers during the past 6 months.”
Established vendors also focused their energies on the multiprotocol router market. In 1991 IBM
and DEC announced that they would begin supporting other protocols on an equal footing with
their native SNA and DECnet, while in the same year both vendors brought to production their
first multiprotocol routers. In the same year another major networking company, 3Com, exited
their LAN operating systems business to concentrate on becoming a networking hardware
company. In the early 1990s the rapid growth and changing landscape of networking left an
array of bewildering choices for IS managers.
Because of the difficulty involved in maintaining abreast of the latest changes in
technology and the increasing importance of network reliability, industry trade publications
noted that networking professionals seemed to desire some standardization of product line.
Indeed, as we discuss below, IS departments seemed to prefer some consolidation in the
industry--despite fewer choices and potentially higher prices--because of the added simplicity
such consolidation would bring to the network design process. Because networks and
internetworking equipment had become an important part of the corporate infrastructure,
networks increasingly needed to be reliable, easily maintained, and serviceable by the
manufacturer.
The industry structure of the early 1990s was ill-suited to address these concerns of
network buyers. The proliferation of new vendors and products, along with the accompanying
concerns over lack of standardization, made network design and product choice very difficult.
Many networking equipment firms did not have the products available to eliminate
interoperability concerns by providing complete “network solutions” for clients. Moreover,
while the technology of multiprotocol equipment such as routers was improving tremendously,
levels of service provided by vendors to configure and maintain systems were not. New start-up
firms had the technology to provide impressive new products, but did not have the staff or the
training to provide extensive support.
9
The desires of users for a full product line and greater service and support, along with the
strong cash flows and high stock values the acquired by firms operating in a booming industry,
helped to ignite a wave of consolidation in the industry. Moreover, it was believed that “full-
service” networking vendors would be able to better provide rock-solid service to the customer,
as large-scale vendors would have the scale necessary for a significant service organization.
Concentration in the networking market fell in the early 1990s as firms rushed to enter the
growing market, but has since risen significantly.
Table 3 lists some of the major merger and acquisition transactions taking place in the
early to mid 1990s in the internetworking industry. As is evident from the column labeled
“description”, most transactions were attempts by major players such as Cisco or 3Com to plug
holes in their existing product line, or attempts by smaller firms to merge their complementary
product lines and so remain competitive in the marketplace. The trend towards industry
consolidation B as well as the industry practice of major players acquiring industry start-ups to
fill gaps in existing product lines B was further boosted by the introduction of a new technology,
switching.
Switches became popular in 1994 as a solution to increasing congestion that was
plaguing corporate networks and the Internet. The technology underlying the brainy routers,
although important to generating the features which had made them so successful, was judged
too slow in some instances to route the increasing volume of traffic in high-speed networks.
Switches in many ways resembled the bridging technology of a previous generation--fewer
functions but faster processing times.
As figure 4 shows, switches have grown explosively since 1994, becoming by far the
fastest growing segment of the networking industry. Such explosive growth was not lost on the
major networking hardware firms, who quickly bought up switch manufacturers to fill gaps in
their product line. Consolidation was so extensive that the networking equipment industry
became dominated by one firm, Cisco Systems Inc. Cisco grew throughout the 1990s from a
relatively small manufacturer of routers to what one industry trade journal has described as the
Wal-Mart of networking. Table 4 presents the top four firms in the four major areas of LAN
equipment for 1996 and 1999. Cisco’s market share in routers and switches increased during this
time--in 1999, Cisco had 77 percent of the router market. Cisco also has a large presence in the
switch market, although not as large as that for routers. In 1996, Cisco commanded about 30
percent of LAN switch sales, and by 1999 that figure had increased to about 47 percent. Chart 4

10
shows worldwide spending on switches by networking standard. The chart illustrates the
fantastic growth of 10 Mbps and 100 Mbps ethernet switches relative to other technologies such
as ATM and Token Ring (plots of alternative technologies such as FDDI exhibit a similarly slow
rate of growth).4
III. Hedonic Analysis for Routers and Switches
In this section we describe and present results from a hedonic analysis of routers and
switches. The problems of using hedonics to calculate price changes while attempting to hold
quality constant are well known. Trajtenberg (1989) notes that, in particular, the hedonic method
may be insufficient to capture price or quality improvements for products such as routers and
switches undergoing rapid technological change. When using the hedonic method there are often
difficult questions over the proper right hand side variables to employ, and the regression results
can often be quite sensitive to the particular specification chosen. Still, the hedonic method is
well known and is one of the most common methods employed for estimating quality-adjusted
price changes.
III.1 Routers
III.1.1 Data and characteristics selection
The hedonic method requires data on the prices and characteristics of the goods in
question. We collected data from Cisco Systems pricing guides for the summer quarters of
1995-1998. Pricing information for 1999 was also collected directly from the firm’s World
Wide Web site. The information collected from these sources were list prices rather than
transactions prices. The problems of using list price data is discussed in further detail below. We
include data only from Cisco Systems in our hedonic price regressions, and, due to Cisco’s large
market share, this should provide us with a good indication of market conditions. We were
unsuccessful in obtaining comparable data for routers made by other firms.
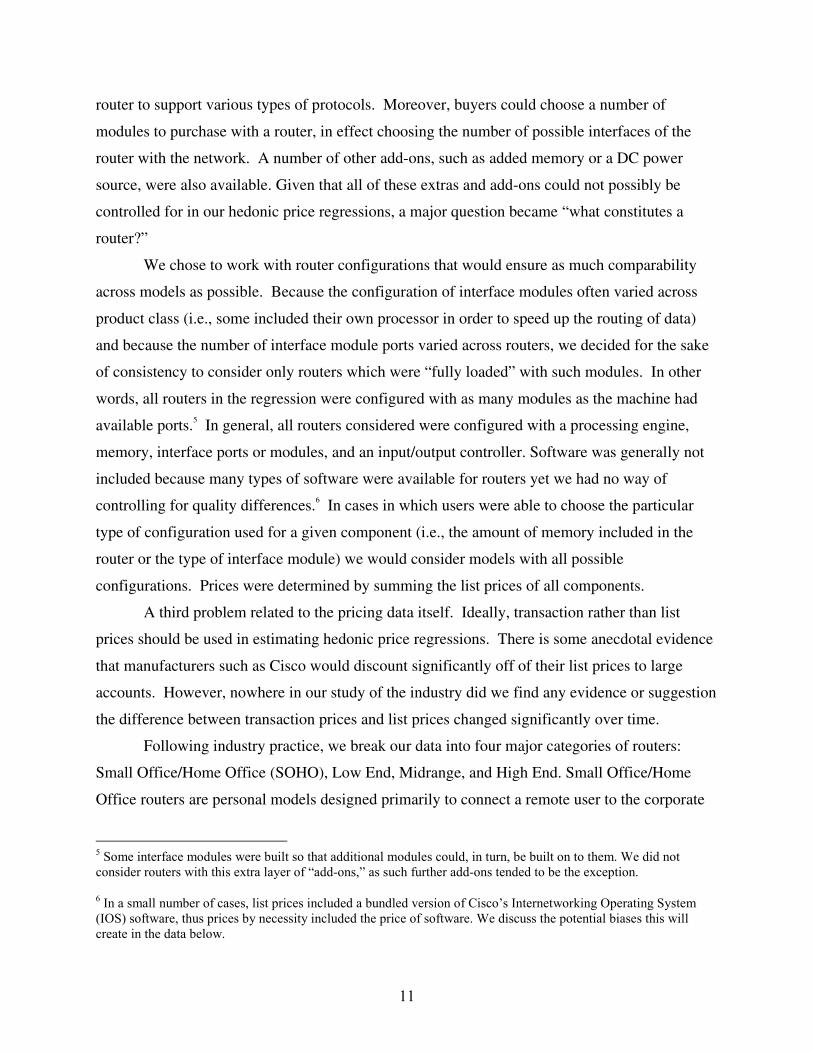
A second problem related to the particular definition of router used. Buyers often had
great flexibility in choosing the features bundled with a final purchased product. In the case of
multiprotocol routers, users often had the choice of over 40 interface modules that allow the
4 Switches vary mainly by how fast they are, the languages they speak, and by the number of ports. When switcheswere first introduced, they were noticeably simpler and cheaper than routers. More recently, higher end switches arevery complex and the distinction between switches and routers is becoming blurred.
11
router to support various types of protocols. Moreover, buyers could choose a number of
modules to purchase with a router, in effect choosing the number of possible interfaces of the
router with the network. A number of other add-ons, such as added memory or a DC power
source, were also available. Given that all of these extras and add-ons could not possibly be
controlled for in our hedonic price regressions, a major question became “what constitutes a
router?”
We chose to work with router configurations that would ensure as much comparability
across models as possible. Because the configuration of interface modules often varied across
product class (i.e., some included their own processor in order to speed up the routing of data)
and because the number of interface module ports varied across routers, we decided for the sake
of consistency to consider only routers which were “fully loaded” with such modules. In other
words, all routers in the regression were configured with as many modules as the machine had
available ports.5 In general, all routers considered were configured with a processing engine,
memory, interface ports or modules, and an input/output controller. Software was generally not
included because many types of software were available for routers yet we had no way of
controlling for quality differences.6 In cases in which users were able to choose the particular
type of configuration used for a given component (i.e., the amount of memory included in the
router or the type of interface module) we would consider models with all possible
configurations. Prices were determined by summing the list prices of all components.
A third problem related to the pricing data itself. Ideally, transaction rather than list
prices should be used in estimating hedonic price regressions. There is some anecdotal evidence
that manufacturers such as Cisco would discount significantly off of their list prices to large
accounts. However, nowhere in our study of the industry did we find any evidence or suggestion
the difference between transaction prices and list prices changed significantly over time.
Following industry practice, we break our data into four major categories of routers:
Small Office/Home Office (SOHO), Low End, Midrange, and High End. Small Office/Home
Office routers are personal models designed primarily to connect a remote user to the corporate
5 Some interface modules were built so that additional modules could, in turn, be built on to them. We did notconsider routers with this extra layer of “add-ons,” as such further add-ons tended to be the exception.
6 In a small number of cases, list prices included a bundled version of Cisco’s Internetworking Operating System(IOS) software, thus prices by necessity included the price of software. We discuss the potential biases this willcreate in the data below.

12
network. Small branch offices of corporations, to organize traffic within the branch and to
connect the office to the larger corporate network, generally use Low End models. Midrange
routers are the brains behind many small to mid-size corporate networks, and High End routers
are typically employed only by large multinational corporations or Internet Service Providers
(ISPs). More recently, multi-gigabit routers have come onto the market, but there was not
enough data on these routers to include in our analysis.
As in hedonic studies of computers, there exist two classes of characteristics that one may
use for the vector of characteristics. One class of characteristics variables uses data from
performance studies to measure attributes such as the speed of the device (in our case, packet
throughput) or, perhaps, reliability (in the case of routers, packet loss rate). A major problem
with the use of such benchmark studies is that the manufacturers themselves often sponsor them.
Thus, because the measurement of product attributes such as speed will depend the particular
conditions under which the test is run so that the “best” router in such studies is, not surprisingly,
often found to be the one from the manufacturer sponsoring the study. A major exception is the
Harvard Device Testing Lab, which until recently conducted and published benchmark tests of
internetworking product performance. Unfortunately, the Harvard Lab closed down.
We instead employ primarily engineering data on the main components of the router as
our characteristics variables. Table 5A lists the variables used and their mean and standard
deviation by market segment. The variable BANDWIDTH measures the theoretical maximum
bandwidth, measured in Mbps (megabits per second), that the router is capable of networking. In
other words, BANDWIDTH represents the total amount of network data that can be sent to the
router at one time, and is found by summing the theoretical maximum data throughput from the
cables connected to the router. The variable is a measure of the data capacity capable of being
sent to the router, however it says nothing about the speed with which that data will be
processed.
The variables MPORTS indicates the number of ports available for network interface
modules. The variable DRAM indicates the amount of standard DRAM memory included with
the router, while FLASH indicates the amount of flash memory included. Both variables are
measured in megabytes. The variable PROCESS indicates the processor speed of the router,
measured in MHz. The variable DC is a dummy variable indicating whether the router includes a
DC power source.

13
We also employ dummy variables to indicate the year and market segment of a particular
router. Table 5B provides a list of the dummy variables and their sample means. The variables
D95-D99 are time dummies indicating model year. The variables DSOHO, DLOW, DMID, and
DHIGH indicate whether the router is included in the SOHO, Low End, Midrange, or High End
markets, respectively. The variables DHE is one if the router is in the Midrange or High End of
the market and zero otherwise, and will be used to allow coefficients to vary across different
parts of the product spectrum.
III.2 Hedonic estimation and results
We now turn to a discussion of the empirical methods used and our results. The hedonic
method provides little guidance in the way of a priori restrictions on specification of the model.
We confront three major specification issues. First, there are a variety of functional forms from
which to choose. Like many other hedonic studies, we consistently found that log-log models
were superior to other functional forms and only those results will be discussed. Second, there is
a question as to whether the relationship between prices and characteristics is stable across the
four major router product classes. Last, we ask if the valuations of product characteristics are
constant through time. Given the vast technical change in these products, consumers’ valuation
of characteristics may have changed as product characteristics have improved.
III.2.1 Parameter stability across router classes
We expect there is likely to be some difference in consumers’ valuation of product
characteristics across product classes, particularly between the very high and low end groups. As
noted above, the products at the top and bottom of the product spectrum serve very different
purposes and target very different audiences, implying, as Triplett (1989) notes, that the contour
of the hedonic surfaces are likely to be different.7
7 To see this, it may be useful to examine an example. Consider the cost of an ethernet port across the fourcategories in our data in 1999. In our hedonic regressions, because ethernet lines have bandwidth of 10 Mbps, thiswould translate into the cost of 10 Mps of BANDWIDTH. In the High End sample, a 6-port ethernet processormodule configured for a High End Cisco 7500 router had a list price of $16,000, for an approximate cost of$2666.67 per ethernet port. Among the 7200 series routers, which are included in both the High End and Midrangesamples, the cost of a 4-port ethernet module was $4500, or $1125 per port. However, in the Low End of oursample, the cost of a complete Cisco 2501 router which included both an ethernet and two serial ports was $995,while in the SOHO category the cost of a complete Cisco 1005 router with one ethernet and one serial port was$395. Although the conclusions one can draw from an example such as this are limited, it does suggest one shouldbe careful about assumptions of parameter constancy.
14
A more systematic way of examining the hypothesis of parameter constancy is to
compute F-tests. However, as Berndt, Griliches, and Rappaport (1995) note, when samples are
large and standard test procedures employed (as they are in this case), F-tests may reject
simplifying parameter restrictions on purely statistical grounds. We follow their procedure of
applying 0.01 significance levels to F-tests and examining the change in root mean squared error
(RMSE) in determining whether the hypothesis of parameter restrictions should be rejected. As
in their paper, we consider cases in which (1) the p-value of F-tests is less than .01 and (2) the
change in RMSE from moving to an unrestricted regression is greater than 5% as a clear
rejection of the hypothesis of parameter constancy.
We divided our sample into high (consisting of High End and Midrange) and low
(consisting of Low End and SOHO) groups and test for parameter constancy across the two
groups. The results suggested we should allow parameters to vary across the two sample groups.
We also investigated the hypothesis that the coefficients on the characteristics variables should
be allowed to vary across all four product segments. Unfortunately, there was insufficient
variation in the product characteristics variables within a given segment and year to allow
reliable estimation for the early years of the sample in which we have fewer observations.
We chose to specify a model that allows parameters to vary between the higher (High
End and Midrange) and lower (SOHO and Low End) ends of the sample but not across all
product classes. This specification also fits within our knowledge of the industry. The low end
sample, consisting of the SOHO and Low End segments, consist primarily of self-contained
routers selling mostly for under $3,000 and which are meant to be used by branch offices or
single users connecting to the corporate network. In contrast, the Midrange and High End
segments are much higher priced equipment which are meant to serve as the brains behind a
firm’s central corporate network. We expect the relationship between parameters and price to
vary across these two groups. Moreover, although there is a distinction made between the
SOHO and Low End groups and the Midrange and High End groups, both within our data and
the industry, the dividing line between products in each of these groups is not clear. In fact, our
classification system, which is the same as that used by industry consulting group Dataquest,
places some product series in two different classification groups,8 placing the Cisco 1600 series
8 DATAQUEST divides its product line both into product series and then models within that series. For instance, theCisco 2501 is a particular model within the 2500 series. Models within the same series often share commoncharacteristics, such as memory or processor speed.

15
and 7200 series within both the SOHO and Low End and Midrange and High End product
groups, respectively. For instance, the determination of whether a 1600 series belongs in the
SOHO or Low End category depends on whether the router includes an optional Wan Interface
Card (WIC). Moreover, the Cisco 7202 and 7204 models, both members of the 7200 series, are
included within the Midrange group, while the 7206 is classified as a High End product.
III.2.2 Parameter stability through time
There are typically three methods used to estimate hedonic regressions. First, one can
estimate yearly regressions and allow parameter estimates to vary by year. Second, one can
estimate pooled regressions holding coefficients constant over adjacent two-year time periods.
Last, one can estimate a single pooled regression over the entire sample period. Estimating
pooled regressions will, of course, have the advantage of improved efficiency if the hypothesis of
parameter stability is correct.
To examine the hypothesis of parameter stability through time we again use F-tests and
examine the change in RMSE by moving from the restricted to unrestricted regression estimates.
There is fairly strong evidence that parameters do not remain stable over the entire sample
period. Perhaps this supports the Triplett (1989) notion that pooled regressions are only
appropriate if the hedonic surface remains constant over time. The comparison between our
yearly and adjacent years regression models is not as clear cut; F-tests reject the hypothesis of
parameter stability at the one percent level in all cases, however the improvement in RMSE is
often less than the 5% level suggested by Berndt, Griliches, and Rappaport (1995). Because of
this, this section will present the results from the adjacent year regressions and section IV will
explore price indexes based on yearly regressions.
III.2.3 Router results
Table 6 presents the results from the adjacent year regression results used for index
computation in later in this section. The variables BWHE, MPORTSHE, FLASHHE,
PROCESSHE, DRAMHE, and DCHE refer to the interaction of BW, MPORTS, FLASH,
PROCESS, DRAM and DC with DHE. These interaction terms are provided to allow for varying
coefficients across the lower and higher ends of the product spectrum. In our adjacent year
regressions, we include year dummies interacted with product spectrum dummies DSOHO,
DLOW, DMID, and DHIGH so that we may calculate >dummy= price indexes for comparison
16
purposes (described further below). Standard errors are in parentheses and are calculated using
the White (1980) heteroskedasticity-robust procedure.
Table 7 presents the price indexes that are generated from the dummy variables reported
in table 6. There are several items to note. First, there is tremendous variation across router
classes in the average annual decline in prices. Second, there is tremendous variation across
time. We have some stories to explain the first result, not so much the second.
Cisco is a dominant firm in the router industry, but its influence does vary by router
segment. We believe that some of the variation in results across router classes Figure 5 presents
Cisco’s market share by router class between 1996 and 2000. The most competitive router
segment is SOHO, and that is the category that has the highest average price declines. Although
Cisco has a dominant presence in the high-end market, it is this end of the market that has faced
the greatest threat of entry from the new multi-gigabit segment. Many firms over the years that
have entered the router business have entered by offering high-end products. A surprising result
in table 7 is that for Midrange routers where prices actually increased. In section 4, we discuss
this result in more detail and specifically discuss how this result may be a result of improperly
assuming that the coefficients are consistent across 1996 and 1998 for this class of routers.
The last lines in table 7 show our composite, chain weighted, router index based on North
American sales for the four router categories. Overall, router prices fell an average of 13.6
percent between 1995 and 1999. However, these results are based on adjacent year regressions.
Section IV presents results based on yearly regressions.
III.3 Switches
III.3.1 Data and Characteristics Selection for Switches
The analysis of switches closely follows that of routers, with some exceptions. The data
(prices and characteristics) used in our analysis came from Datapro, a service that periodically
issues reports that compares switches from a variety of vendors. The reports typically list a
series of switches across columns and the rows in the reports contain information on the
characteristics of the switches, such as number of ports, interfaces et cetera. We cross checked
our data against Cisco product catalogues for Cisco switches and generally found that the two
sources of data for Cisco switches agreed. However, we thought it important to gather data on
switches from other vendors since the switch market is much more competitive than the router
market, as was shown in table 4.

17
Several problems were encountered in collecting this data. First, not all reports contained
the same information on the characteristics, and many observations had to be dropped for
inadequate information on the characteristics of the switch. Second, we were not able to obtain
data for 1998. Third, our sample in 1997 is small (18 observations) because many of the Datapro
reports in 1997 were simply copies of the 1996 reports with no changes. Finally, the prices in
the reports are list prices, like the case with routers, and not transaction prices. When all is said
and done, we were able to gather usable data for a total of 366 observations from 1996 to 2000.
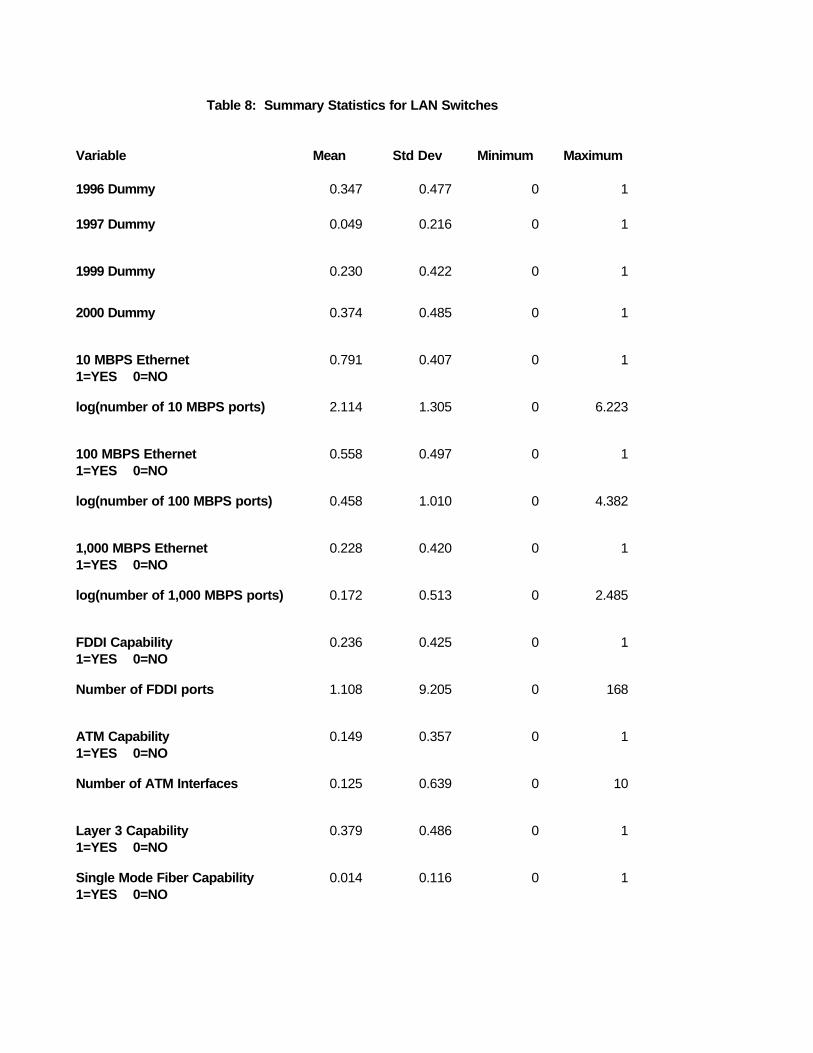
Table 8 presents summary statistics for the LAN switch database. Like routers, measures
of performance are difficult to come by. Characteristics that we were able to gather consistently
across all types of routers fell into two catergories--the number and types of ports and other
capabilities. In terms of ports, the regressions control for the presence of and the log of the
number of 10, 100, and 1,000 megabit ethernet ports. Additionally, the regressions controlled
for the presence and number of FDDI (fiber data distributed interface) and ATM ports. Switches
also vary by whether they have layer three switching capability, single mode fiber capability.
Many of the switches in our sample had a wide array of characteristics--enabling them to
speak a variety of languages and operate at varying speeds. We included all of the switches into
the regressions. We did try breaking the sample into various groupings, but found no clear
advantage to doing so. In fact, there was no clear dividing line between switches. Additionally,
the samples by year were small (especially for 1997), so dividing the sample further greatly
increased the standard errors of our estimates.
III.3.2 Switch results
Table 9 presents the results from a pooled regression and from adjacent year regressions.
Annual regressions were not run because of the small samples, especially in 1997. Not shown in
the table is a list of firm dummy variables. The coefficients on many of the variables came in
with the expected sign. Using the dummy variables from the adjacent year regressions, we found
the average annual price decrease was 21.9 percent, a faster rate of decline than that for routers.
The pooled regression results generate a 22.2 percent annual decline. These results are
consistent with several purchasers of LAN equipment that we talked to--they felt that switch
prices fell faster than routers.
18
III.4 LAN Cards
The third component of local area network equipment that we examine is LAN cards, the
device in a computer that is physically connected to a computer network. Like routers and
switches, LAN cards vary in terms of speed and interfaces. Unlike routers and switches, LAN
cards have a very small set of characteristics, and the data are fairly homogenous within each
LAN card category. Price and quantity data for LAN cards between 1995 and 2000 for the
worldwide market is displayed in table 10. This data comes from Dataquest. We computed a
chain-weighted, matched-model price index with this data. Prices for LAN cards fell an average
of 18.3 percent per year between 1995 and 2000.
III.5 Hubs
The final component of LAN equipment, hubs, are also simple devices that have been
replaced over the years by switches. We have not performed an analysis of hubs like that of
routers and switches. Instead, we use an indirect approach. The approach examines the
relationship between changes in the price per port for switches and compares that to the price per
port for hubs. The reason we exploit this relationship is that we have price per port data for hubs
and for switches. For each year, we have data on revenue and the number of ports shipped for
hubs and switches. The price per-port measures are Fisher indexes based on data for a handful of
switch and hub classes.
Figure 6 presents these data. Between 1996 and 2000, the price per-port measures for
switches fell at an annual average rate of 34.7 percent whereas the price per-port measure for
hubs fell 30.1 percent. We construct a price index for hubs by taking the ratio of the two Fisher
per-port indexes and multiplying by the switch price index. Since the per-port index for hubs
doesn’t fall as fast as the per-port measure for switches, the price index for hubs doesn’t fall as
fast as that for switches. From 1996 to 2000, we estimate that the prices for hubs fell at an
annual average rate of 19.0 percent.
IV. Yearly Regression Results for Routers
In the previous section we calculated pooled adjacent-year regressions and used the
coefficients on time dummies as the basis for our price index for routers and switches. As noted
by Triplett (1989), this method relies on the assumption of stability in the hedonic surface over
time. Because our tests of parameter constancy across adjacent year regressions for routers were

19
inconclusive, we calculate alternative yearly regressions and use the results to calculate imputed
price indexes.
Table 11 displays the results of the yearly regressions. Once again, the variables BWHE,
MPORTSHE, FLASHHE, PROCESSHE, DRAMHE, and DCHE refer to the interaction of BW,
MPORTS, FLASH, PROCESS, DRAM and DC with DHE. These interaction terms are provided
to allow for varying coefficients across the lower and higher ends of the product spectrum.
Standard errors are in parentheses and are calculated using the White (1980) heteroskedasticity-
robust procedure.
In this section, we utilize the results from our hedonic regressions to compute elementary
price indexes. We first compute a form of imputed price indexes of the type used by
Prud’homme and Yu (1999). Fitted prices may be calculated by exponentiating the results of our
hedonic regressions at the observed vector of characteristics. Thus, one has
01
ˆ ˆˆ exp( log ) m
it t jt ijtj
P Xβ β=
= +∑ (1)
where itP̂ refers to the imputed price of model i in time t and tβ̂ refers to the estimated vector of
coefficients for time t. In our yearly regressions, imputed prices can be calculated using the
vector of estimated coefficients tβ̂ both for the year in which coefficients were estimated and
some other adjacent year. Thus, for example, we may calculate the imputed prices of a 1996
model i in 1996 and 1998 by imputing prices using 96β̂ and 98β̂ , respectively. The same
procedure can be repeated for all i in 1996. Moreover, we can similarly calculate the imputed
price of any 1998 models k in 1996 and 1998. These imputed prices can be used as the basis for
a bilateral price index.
Unfortunately, a lack of quantity data at the model level prevents us from computing
standard quantity-weighted price indexes. Instead, we compute simple Dutot, Carli, and Jevons
price indexes. These are bilateral price indexes that compute the change in prices between years
t-1 and t as follows:
1. Dutot
∑
∑
=
−
=− = n
i
ti
n
i
ti
Dtt
NP
NPI
1
1
1,1
/
/

20
2. Carli
∑=
−
− =n
i
ti
tiC
tt NPPI
1
1
,1)/(
3. Jevons
N
ti
tin
iJtt P
PI/1
11,1
∏= −=−
Thus, the Dutot computes the ratio of the arithmetic average of prices, while the Carli and Jevons
compute the arithmetic and geometric averages of the price ratios, respectively.
We compute these indexes using base-weighted and reference-weighted version of these
indexes, and as in Prud’homme and Yu (1999), we take the geometric mean of the base-weighted
and comparison-weighted version of these indexes, computing a ‘Fisher-type’ index. A
multilateral price index 0,tI for 1995-1999 can be computed by chaining the bilateral price
indexes ttt IIII ,12,11,0,0 −×××= L .
Table 12 displays the results of our Dutot, Carli, and Jevons indexes. The results of our
previous dummy price indexes are also included for comparison purposes. Although within each
router segment the four indexes produce similar results, there are some differences. In particular,
for all router classes except for Midrange, the dummy price indexes show more rapid rates of
price declines than any of the imputed indexes. Moreover, the disparity in results between the
dummy and imputed price indexes in the Midrange segment is particularly large. One potential
reason for the disparity is that the assumption of parameter stability used in the dummy
regressions may be incorrect; indeed our F-tests of parameter stability for the Midrange segment
reject the hypothesis of parameter constancy for this segment. In computations not reported
here, we found that the index results varied substantially depending on whether we use base- or
reference-period models as the basis for index construction, and that by removing new models
from the computation of the imputed price index we obtained results qualitatively similar to our
dummy price index. This result of index sensitivity to the use of base- or reference-period
weights has been reported in other papers in the literature (e.g., Berndt, Dulberger, and
Rappaport (2000)).
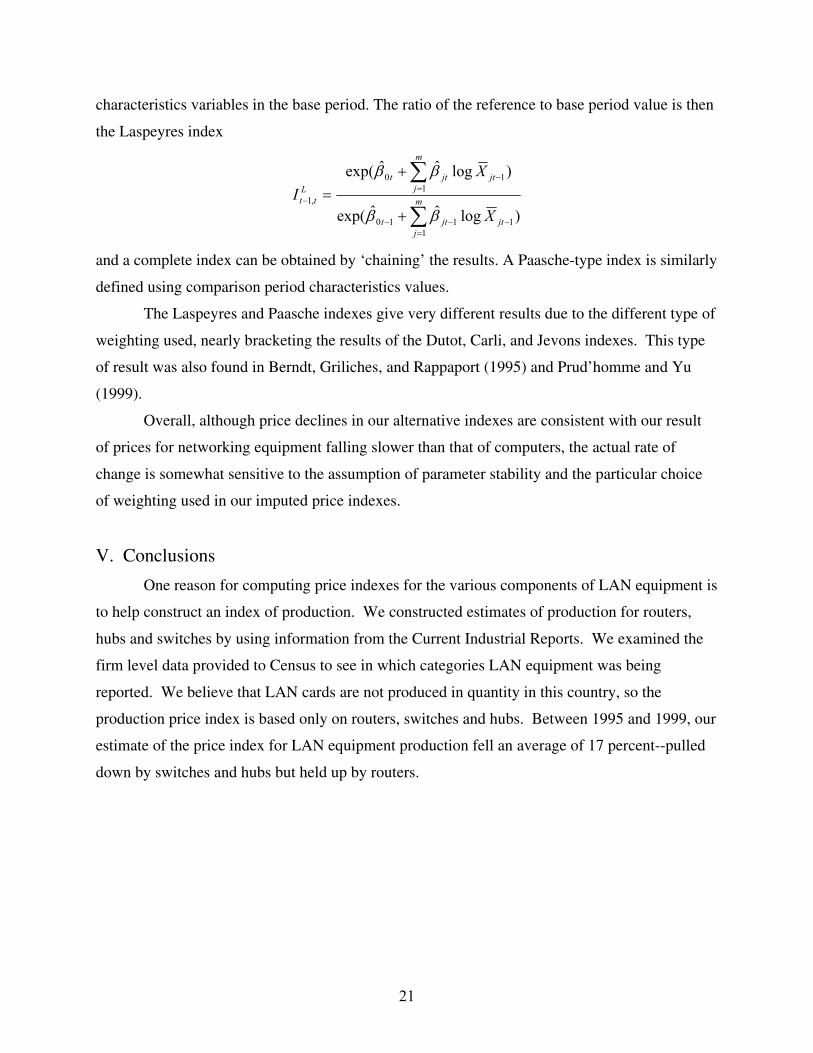
One can also compute Laspeyres-type price indexes by computing equation (1) using
base and comparison period coefficients and calculating fitted prices at the sample mean of
21
characteristics variables in the base period. The ratio of the reference to base period value is then
the Laspeyres index
)logˆˆexp(
)logˆˆexp(
11110
110
,1
∑
∑
=−−−
=−
−
+
+= m
jjtjtt
m
jjtjtt
Ltt
X
XI
ββ
ββ
and a complete index can be obtained by ‘chaining’ the results. A Paasche-type index is similarly
defined using comparison period characteristics values.
The Laspeyres and Paasche indexes give very different results due to the different type of
weighting used, nearly bracketing the results of the Dutot, Carli, and Jevons indexes. This type
of result was also found in Berndt, Griliches, and Rappaport (1995) and Prud’homme and Yu
(1999).
Overall, although price declines in our alternative indexes are consistent with our result
of prices for networking equipment falling slower than that of computers, the actual rate of
change is somewhat sensitive to the assumption of parameter stability and the particular choice
of weighting used in our imputed price indexes.
V. Conclusions
One reason for computing price indexes for the various components of LAN equipment is
to help construct an index of production. We constructed estimates of production for routers,
hubs and switches by using information from the Current Industrial Reports. We examined the
firm level data provided to Census to see in which categories LAN equipment was being
reported. We believe that LAN cards are not produced in quantity in this country, so the
production price index is based only on routers, switches and hubs. Between 1995 and 1999, our
estimate of the price index for LAN equipment production fell an average of 17 percent--pulled
down by switches and hubs but held up by routers.
22
References
Berndt, E., Z. Griliches, and N. Rappaport (1995) “Econometric Estimates of Price Indexes forPersonal Computers in the 1990’s” Journal of Econometrics. 243-268.
Berry, S., J. Levinsohn, and A. Pakes (1995) “Automobile Prices in Market Equilibrium”Econometrica. 841-890.
Brynjolfsson, E. (1996) “The Contribution of Information Technology to Consumer Welfare.”Information Systems Research 7(3): 281-300.
Diewert, E. (1987) “Index Numbers” in J. Eatwell, M. Milgate, and P. Newman, eds. The NewPalgrave: A Dictionary of Economics. New York: Stockton Press, 767-780.
Diewert, E. (1995) “Axiomatic and Economic Approaches to Elementary Price Indexes”Discussion Paper No. 95-01, Department of Economics, University of British Columbia.
Dulberger, E. (1989) “The Application of a Hedonic Model to a Quality-Adjusted Price Index forComputer Processors” in D. Jorgenson and R. Landau, eds. Technology and Capital Formation.Cambridge, MA: MIT Press. 37-76.
Flamm, K. (1987) Targeting the Computer: Government Support and International Competition.Washington, DC: The Brookings Institution.
Freed, L. and F. Derfler (1998) How Networks Work. Que Corp.
Griliches, Z. (1958) “Research Costs and Social Returns: Hybrid Corn and Related Innovations”Journal of Political Economy, 66(5): 419-431.
Grimm, Bruce (1996), “A Quality Adjusted Price Index for Digital Telephone Switches”, BEAmemo.
Jorgenson, Dale and Kevin Stiroh (2000), “Raising the Speed Limit: U.S. Economic Growth inthe Information Age”, Brookings Papers on Economic Activity, v.0, pp. 125-211.
Luzio, E. and S. Greenstein (1995) “Measuring the Performance of a Protected Infant Industry:The Case of Brazilian Microcomputers” Review of Economics and Statistics. 622-633.
Petrin, A. (1999) “Quantifying the Benefits of New Products: The Case of the Minivan”Working Paper, Graduate School of Business, University of Chicago.
Prud’homme, M. and K. Yu (1999) “Towards an Elementary Price Index for Internet Services”Working Paper, Department of Economics, University of British Columbia.
Shapiro, C. and H. Varian (1999) Information Rules: A Strategic Guide to the Network Economy.Boston, MA: Harvard Business School Press.

23
Trajtenberg, M. (1989) Economic Analysis of Product Innovation: The Case of CT Scanners.Cambridge, Massachusetts: Harvard University Press.
Triplett, J. (1989) Price and Technical Change in a Capital Good: A Survey of Research onComputers. in D. Jorgenson and R. Landau, eds. Technology and Capital Formation.Cambridge, MA: MIT Press. 127-213.
White, ….
1997 1998 1999 2000Business and Government Purchasersof Telecommunications Equipment (1) 34,070 38,490 41,142 44,657
Data Communication 22,275 25,263 26,947 29,522 LAN Equipment 11,437 13,111 14,027 15,743 Routers 2,986 3,425 4,525 5,475 LAN Switches 3,787 5,706 6,528 7,285 Hubs 1,884 1,538 761 689 LAN Cards 2,780 2,442 2,213 2,294 Other Data/Network Equipment 10,838 12,152 12,920 13,779 Asynchronous Transfer Mode (ATM) 1,117 1,557 2,048 2,528 Modems 3,077 3,290 2,800 2,500 Remote Access Devices 1,604 1,730 2,100 2,400 Frame Relay 1,277 1,530 1,722 1,846 ISDN 900 1,050 1,200 1,350 SNA Gateways and Connectivity Gear 912 940 930 940 Channel Service Unit/Data Service Unit (CSU/DSU) 803 870 895 930 Diagnostic and Test Equipment 558 610 655 720 Multiplexers 590 575 570 565
Phone Equipment 11,795 13,227 14,195 15,135 Private Branch Exchange (PBX)/Key Telephone System (KTS) 6,832 7,601 7,980 8,392 Voice Processing Equipment 4,963 5,626 6,215 6,743
Telecommunication Service Providers (2) 26,643 29,138 35,884 46,752Central Office Switching and Transmission Equipment 12,358 13,562 14,475 15,500Fiber Optic Transmission Equipment 6,748 8,620 13,095 22,265
Synchronous Optical Network (SONET) 3,562 4,556 7,291 10,573Dense Wavelength Division Multiplexing (DWDM) 1,605 1,854 3,055 7,742Digital Cross Connects 1,581 2,210 2,749 3,950
Cellular Phone Infrastructure 5,678 4,474 4,955 4,734ATM 723 1,033 1,395 1,770Frame Relay 1,098 1,314 1,485 1,585Voice Over Internet Protocol (VOIP) Gateways 14 100 440 820Electronic Bonding Gateways 24 35 39 78
Other Spending on Communication Equipment (3) 17,860 19,645 23,029 24,302 Capital Equipment Spending By Cable Television Firms 6,800 7,700 10,800 12,000 Wireless Handsets (Cell Phones) 5,787 7,228 7,619 7,692 Consumers 5,273 4,717 4,610 4,610
Cordless Telephones 2,099 2,250 2,240 2,260Answering Machines 1,173 1,240 1,215 1,210Home Fax Machines 1,367 655 625 620Corded Telephones 634 572 530 520
Total Spending (1) + (2) + (3) 78,573 87,273 100,055 115,711PDE Communications Equipment 73,700 80,700 99,100 123,870Source: Dataquest, FCC, TIA, RHK, KMI, Authors' Estimates
Table 1Spending on Telecommunications Equipment ($Millions)
By End User Group
1990-95 1995-00 1990-00BLS PPI Communications Equipment 1.17 -0.63 0.27
BLS PPI "Other Data Communications Equipment" -0.12
BEA Communication Equipment -1.49 -1.84 -1.66
BEA Computers and Peripheral Equipment -13.44 -22.22 -17.95
Table 2: Official Price Measures for Communications Equipment and Computers(Average Annual Percent Change)

Table 3: Notable Mergers and Acquisitions, LAN Equipment Manufacturers
Acquirer Target Year Value ReasonNortel Networks JDS Uniphase's Zurich subsidiary 2001 $2.5 billion Optical technology (pump-laser chips)Cisco Systems ArrowPoint Communications 2000 $5.7 billion Content switches that optimize delivery of web contentLucent Technologies Chromatis Networks 2000 $4.5 billion Metropolitan optical networking systemsAlcatel Xylan Corp. 1999 $2.0 billion Xylan's switching systemsCisco Systems Pirelli Optical Systems 1999 $2.2 billion Pirelli's optical systems businessCisco Systems Cerent Corporation 1999 $6.9 billion Optical transport productsCisco Systems StratumOne Communications, Inc. 1999 $435 million Integrated, high-performance semiconductor technology General Electric Company, PLC (GEC) FORE Systems 1999 $4.5 billion ATM routers and switchesLucent Technologies Ascend Communications 1999 $24 billion ATM and frame relay high-speed WAN switching, WAN Lucent Technologies Nexabit Networks 1999 $900 million WAN routers and switchesNortel Networks Shasta Networks 1999 $340 million IP routing switchAscend Communications Stratus Computer 1998 $822 million Obtained SS7 and OSS technology and products. Cabletron Systems YAGO Systems 1998 $213 million Gigabit switch router Cisco Systems Summa Four Inc. 1998 $116 million Programmable switches Intel Shiva 1998 $185 million Remote access and VPN capability Nortel Networks Bay Networks 1998 $9.1 billion Bay Networks entire data communications business3Com U.S. Robotics 1997 $7.3 billion Modems and access serversAscend Communications Cascade Communications Corp. 1997 $2.6 billion ATM and frame relay switching technology and products. Bay Networks Rapid City Communications 1997 $155 million Gigabit ethernet switch router Cabletron Systems Digital Equipment Corp. Network 1997 $430 million Digital's network product businessLucent Technologies Livingston Enterprises 1997 $610 million Remote access networking products Cisco Systems Granite Systems, Inc. 1996 $220 million Multilayer Gigabit Ethernet switching Cisco Systems StrataCom, Inc. 1996 $4.7 billion ATM and frame relay high-speed WAN switching 3Com Chipcom Corporation 1995 $775 million High-end chassis hubs and switchingSynoptics Communications Welfleet Communications 1994 $1.0 billion Synoptics and Wellfleet merger to form Bay NetworksCisco Systems Crescendo Communications, Inc. 1993 $97 million High-performance workgroup solutions 3Com Bridge Communications 1987 $240.8 million Bridges and routers
Source: Datapro Information Services, Wheelwright and Holloway (2000), and authors' researchAcquisition values for stock acquisitions calculated at time of agreement.All acquisition values in U.S. dollars.

Table 4Market Share of Four Largest Firms by LAN Equipment Type
1996 1999Firm Market Share Firm Market Share
Routers Cisco Systems 54.6% Cisco Systems 77.0%Bay Networks Inc. 10.3% Nortel Networks 6.9%Ascend Communications Inc. 9.2% Fujitsu 2.5%3Com 6.4% 3Com 2.4%
Switches Cisco Systems 29.6% Cisco Systems 46.8%3Com 21.2% 3Com 12.6%Cabletron Systems Inc. 11.0% Nortel Networks 8.7%Bay Networks Inc. 9.9% Fore Systems 6.4%
LAN Cards 3Com 33.2% 3Com 35.4%IBM 13.7% Intel 23.2%Standard Microsystems Inc. 6.9% IBM 4.9%Madge Networks 5.8% Xircom 4.7%
Hubs Bay Networks Inc. 24.5% 3Com 30.3%3Com 18.8% Nortel Networks 16.7%Cabletron Systems Inc. 14.7% D-Link Systems 7.4%IBM 4.8% Intel 4.3%
Source: Dataquest

Table 5 Summary of Router Data, 1995-1996, 1998-1999
Table 5(a): Router Characteristics Data by Market Segment
Small Office/Home Office (SOHO) Data
Variable Mean Std. Dev. Min Max
PRICE 769.05 243.78 395.00 1399.00BANDWIDTH 17.81 13.09 10.11 40.23MPORTS 0.00 0.00 0.00 0.00FLASH 1.34 2.36 0.00 8.00PROCESS 27.93 5.20 16.00 33.00DRAM 2.83 1.77 1.00 8.00DC 0.00 0.00 0.00 0.00
Low End Data
Variable Mean Std. Dev. Min Max
PRICE 4300.99 1860.52 895.00 8195.00BANDWIDTH 54.28 63.88 1.54 372.22MPORTS 1.03 0.92 0.00 3.00FLASH 6.92 1.79 2.00 8.00PROCESS 31.74 9.92 20.00 50.00DRAM 14.36 10.12 2.00 24.00DC 0.43 0.50 0.00 1.00
Midrange Data
Variable Mean Std. Dev. Min Max
PRICE 41525.60 16707.19 4600.00 78550.00BANDWIDTH 284.57 187.49 1.00 630.00MPORTS 3.72 0.57 2.00 4.00FLASH 14.45 6.06 4.00 20.00PROCESS 157.31 59.20 40.00 263.00DRAM 28.36 7.58 8.00 32.00DC 0.12 0.33 0.00 1.00
High End Data
Variable Mean Std. Dev. Min Max
PRICE 85899.71 47704.98 38200.00 326900.00BANDWIDTH 539.67 258.91 7.50 1460.00MPORTS 6.17 1.62 3.00 11.00FLASH 16.77 3.58 4.00 20.00PROCESS 187.20 66.35 25.00 300.00DRAM 30.77 4.27 16.00 32.00DC 0.00 0.00 0.00 0.00

Table 5 (b)Sample means of dummy variables
D95 0.0200 DSOHO 0.0077D96 0.0567 DLOW 0.0692D98 0.2545 DMID 0.4647D99 0.6688 DHIGH 0.4584
DHE 0.9231

Table 6Parameter estimates for adjacent year regressions(heterosekdasticity-robust standard errors in parentheses)
1995-1996 1996-1998 1998-1999
DSOHO 5.2544 4.8741 8.3544(0.1948) (1.3034) (0.4466)
DLOW 6.2668 3.9190 8.5126(0.7183) (1.6818) (0.4927)
DMID 7.7547 6.3414 6.5147(0.1259) (0.1249) (0.1208)
DHIGH 9.1135 6.9860 6.6322(0.1681) (0.1387) (0.1291)
YEARDUMMY * SOHO 0.0126 -0.9337 -0.2556(0.0676) (0.2468) (0.1257)
YEARDUMMY*LOW 0.1806 -0.9951 -0.0782(0.0885) (0.2213) (0.0541)
YEARDUMMY*MID 0.1187 0.0050 -0.0007(0.0318) (0.0424) (0.0132)
YEARDUMMY*HIGH -0.0825 -0.4448 -0.1766(0.0281) (0.0398) (0.0149)
LOG(BANDWIDTH) 0.2286 0.1894 0.0417(0.0477) (0.0474) (0.0142)
LOG(BANDWIDTHHE) -0.0446 -0.0350 0.0983(0.0492) (0.0486) (0.0152)
LOG(MPORTS) 0.4388 0.4332 0.3676(0.0689) (0.0534) (0.0494)
LOG(MPORTSHE) 0.4815 0.5757 0.7951(0.0763) (0.0723) (0.0641)
LOG(FLASH) -0.3632 1.0553 0.2122(0.3851) (0.3592) (0.0996)
LOG(FLASHHE) -0.4412 -1.2131 -0.0250(0.3874) (0.3619) (0.1034)
LOG(PROCESS) 0.4832 0.3437 -0.7665(0.0002) (0.3825) (0.1220)
LOG(PROCESSHE) -0.2405 -0.1254 1.1515(0.0249) (0.3830) (0.1229)
LOG(DRAM) -0.5732 0.5573 0.6451(0.1173) (0.0624) (0.0444)
LOG(DRAMHE) 0.6302 -0.2076 -0.9201(0.1307) (0.0871) (0.0633)
DC 0.1391 0.1715 0.1496(0.0730) (0.0582) (0.0307)
DCHE -0.0564 -0.2134 -0.1849(0.0785) (0.0710) (0.0435)
Number of observations 399 1595 4744
0.9802 0.9204 0.91742R

Table 7Price Indexes For Routers Based on Adjacent Year Regressions
1995 1996 1998 1999 AAGR
SOHO (Index) 1.000 1.015 0.411 0.321 -24.72 (Percent change) 1.50 -59.48 -21.94
Low End (Index) 1.000 1.203 0.456 0.422 -19.40 (Percent change) 20.26 -62.11 -7.39
Midrange (Index) 1.000 1.127 1.133 1.133 3.16 (Percent change) 12.67 0.59 -0.06
High End (Index) 1.000 0.921 0.591 0.495 -16.11 (Percent change) -7.88 -35.85 -16.18
All Routers (Index) 1.000 1.066 0.622 0.557 -13.62 (Percent change) 6.56 -23.57 -10.55
Variable Mean Std Dev Minimum Maximum
1996 Dummy 0.347 0.477 0 1
1997 Dummy 0.049 0.216 0 1
1999 Dummy 0.230 0.422 0 1
2000 Dummy 0.374 0.485 0 1
10 MBPS Ethernet 0.791 0.407 0 11=YES 0=NO
log(number of 10 MBPS ports) 2.114 1.305 0 6.223
100 MBPS Ethernet 0.558 0.497 0 11=YES 0=NO
log(number of 100 MBPS ports) 0.458 1.010 0 4.382
1,000 MBPS Ethernet 0.228 0.420 0 11=YES 0=NO
log(number of 1,000 MBPS ports) 0.172 0.513 0 2.485
FDDI Capability 0.236 0.425 0 11=YES 0=NO
Number of FDDI ports 1.108 9.205 0 168
ATM Capability 0.149 0.357 0 11=YES 0=NO
Number of ATM Interfaces 0.125 0.639 0 10
Layer 3 Capability 0.379 0.486 0 11=YES 0=NO
Single Mode Fiber Capability 0.014 0.116 0 11=YES 0=NO
Table 8: Summary Statistics for LAN Switches

1996-2000 1996-1997 1997-1999 1999-2000
1997 Dummy -0.180 -0.189 NA NA(0.128) (0.121)
1999 Dummy -0.900 NA -0.572 NA(0.11) (0.208)
2000 Dummy -1.005 NA NA -0.227(0.096) (0.105)
10 MBPS Ethernet -1.263 -0.829 -1.029 -1.6651=YES 0=NO (0.169) (0.202) (0.373) (0.244)
log(number of 10 MBPS ports) 0.391 0.143 0.402 0.595(0.048) (0.057) (0.111) (0.069)
100 MBPS Ethernet -0.284 -0.302 -0.105 -0.0911=YES 0=NO (0.075) (0.083) (0.185) (0.112)
log(number of 100 MBPS ports) 0.119 0.143 0.083 0.112(0.047) (0.089) (0.086) (0.056)
1,000 MBPS Ethernet 0.419 NA 0.159 0.3671=YES 0=NO (0.113) (0.235) (0.126)
log(number of 1,000 MBPS ports) 0.307 NA 0.45 0.34(0.082) (0.15) (0.088)
FDDI Capability 0.192 0.091 0.219 0.3291=YES 0=NO (0.085) (0.080) (0.19) (0.181)
Number of FDDI ports -0.012 -0.005 -0.013 -0.028(0.004) (0.003) (0.005) (0.021)
ATM Capability 0.047 -0.051 0.359 0.8721=YES 0=NO (0.108) (0.105) (0.309) (0.236)
Number of ATM Interfaces 0.247 0.216 -0.394 -0.466(0.056) (0.046) (0.431) (0.305)
Layer 3 Capability 0.529 0.339 0.554 0.6941=YES 0=NO (0.084) (0.099) (0.175) (0.120)
Single Mode Fiber Capability 1.203 1.223 1.198 1.1061=YES 0=NO (0.295) (0.452) (0.593) (0.421)
N 366 145 101 220
R2 0.740 0.537 0.678 0.796
Table 9: Hedonic Regression Models for LAN Switches

Table 10Average Price and Revenue for Different Types of LAN Cards
Average annualgrowth rate
1995 1996 1997 1998 1999 2000 (percent)10-Mbps Revenue ($ millions) 2,651 2,836 1,990 886 478 278 Price ($/card) 115 101 73 51 41 37 -20.2100-Mbps Revenue 142 736 1,879 2,582 2,826 3,023 Price 199 143 110 79 66 56 -22.41,000-Mbps Revenue 2 34 70 152 Price 2,111 850 735 681 -31.4Token-Ring Revenue 1,236 1,131 1,099 843 472 350 Price 310 283 228 196 169 174 -10.9FDDI Revenue 136 160 121 84 51 26 Price 1,123 1,069 904 838 751 731 -8.2ATM Revenue 43 66 79 98 73 75 Price 964 614 653 562 432 437 -14.7Wireless Revenue 105 188 316 488 Price 327 340 275 250 -8.6Matched Model Price Index
1.00 0.87 0.66 0.49 0.41 0.36 -18.3Reported data is for the world market.

Table 11Parameter estimates for yearly router regressions(heterosekdasticity-robust standard errors in parentheses)
1995 1996 1998 1999
CONSTANT 4.5046 5.9191 5.5472 9.5174(0.1603) (0.5087) (0.9157) (0.7570)
DHE -- 0.1361 0.4655 -1.8443(0.5489) (0.9286) (0.7878)
LOG(BANDWIDTH) 0.2090 0.2408 0.1553 0.0601(0.0697) (0.0650) (0.0581) (0.0160)
LOG(BANDWIDTHHE) -0.0240 -0.0403 -0.0376 0.0874(0.0712) (0.0702) (0.0593) (0.0171)
LOG(MPORTS) 1.0097 0.4489 0.3985 0.4860(0.0944) (0.0760) (0.0773) (0.0691)
LOG(MPORTSHE) -- 0.8242 0.8323 0.6003(0.0952) (0.0862) (0.0737)
LOG(FLASH) 0.5297 0.3843 0.4330 0.2540(0.0743) (0.0853) (0.1208) (0.0997)
LOG(FLASHHE) -2.0911 -0.5169 -0.1677 -0.0050(0.2622) (0.1235) (0.1344) (0.1051)
LOG(PROCESS) 0.4833 0.1776 -0.0514 -1.2302(0.0003) (0.1469) (0.2534) (0.2297)
LOG(PROCESSHE) -0.1988 -0.2848 0.5349 1.5465(0.0401) (0.1507) (0.2548) (0.2305)
LOG(DRAM) -- -0.2936 0.5670 0.7660(0.0604) (0.0905) (0.0823)
LOG(DRAMHE) 2.0568 1.1831 -0.8818 -1.3069(0.0919) (0.0949) (0.1257) (0.1090)
DC 0.1399 0.1418 0.1927 0.1316(0.1173) (0.0933) (0.0739) (0.0321)
DCHE -0.0411 -0.2778 -0.2032 -0.2042(0.1229) (0.1085) (0.0883) (0.0494)
N 104 295 1300 3444
0.9887 0.9563 0.9092 0.9229
Note: Double dashes (--) indicate variable was dropped due to multicollinearity.
2R
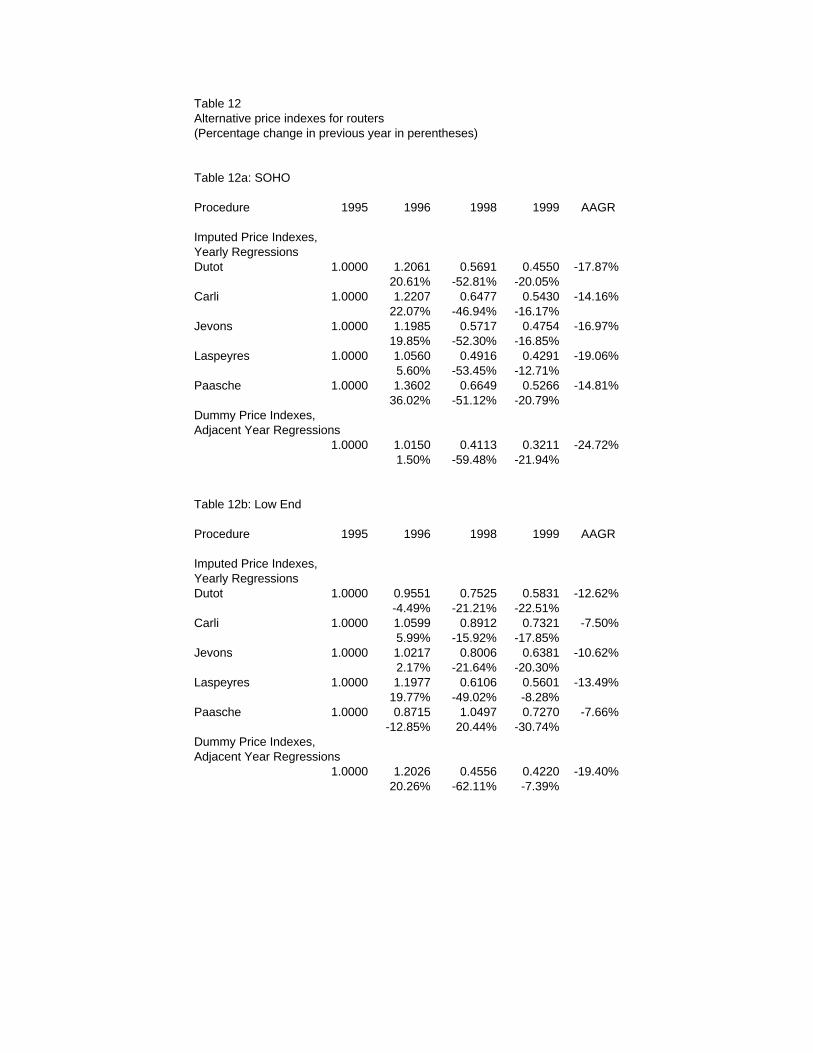
Table 12Alternative price indexes for routers(Percentage change in previous year in perentheses)
Table 12a: SOHO
Procedure 1995 1996 1998 1999 AAGR
Imputed Price Indexes,Yearly RegressionsDutot 1.0000 1.2061 0.5691 0.4550 -17.87%
20.61% -52.81% -20.05%Carli 1.0000 1.2207 0.6477 0.5430 -14.16%
22.07% -46.94% -16.17%Jevons 1.0000 1.1985 0.5717 0.4754 -16.97%
19.85% -52.30% -16.85%Laspeyres 1.0000 1.0560 0.4916 0.4291 -19.06%
5.60% -53.45% -12.71%Paasche 1.0000 1.3602 0.6649 0.5266 -14.81%
36.02% -51.12% -20.79%Dummy Price Indexes,Adjacent Year Regressions
1.0000 1.0150 0.4113 0.3211 -24.72%1.50% -59.48% -21.94%
Table 12b: Low End
Procedure 1995 1996 1998 1999 AAGR
Imputed Price Indexes,Yearly RegressionsDutot 1.0000 0.9551 0.7525 0.5831 -12.62%
-4.49% -21.21% -22.51%Carli 1.0000 1.0599 0.8912 0.7321 -7.50%
5.99% -15.92% -17.85%Jevons 1.0000 1.0217 0.8006 0.6381 -10.62%
2.17% -21.64% -20.30%Laspeyres 1.0000 1.1977 0.6106 0.5601 -13.49%
19.77% -49.02% -8.28%Paasche 1.0000 0.8715 1.0497 0.7270 -7.66%
-12.85% 20.44% -30.74%Dummy Price Indexes,Adjacent Year Regressions
1.0000 1.2026 0.4556 0.4220 -19.40%20.26% -62.11% -7.39%

Table 12c: Midrange
Procedure 1995 1996 1998 1999 AAGR
Imputed Price Indexes,Yearly RegressionsDutot 1.0000 0.8078 0.6028 0.5871 -12.47%
-19.22% -25.37% -2.62%Carli 1.0000 1.0103 0.8313 0.8159 -4.96%
1.03% -17.72% -1.85%Jevons 1.0000 0.9331 0.7367 0.7175 -7.96%
-6.69% -21.05% -2.60%Laspeyres 1.0000 1.1165 1.1492 1.1874 4.39%
11.65% 2.93% 3.33%Paasche 1.0000 0.7799 0.4723 0.4336 -18.85%
-22.01% -39.44% -8.20%Dummy Price Indexes,Adjacent Year Regressions
1.0000 1.1267 1.1333 1.1327 3.16%12.67% 0.59% -0.06%
Table 12d: High End
Procedure 1995 1996 1998 1999 AAGR
Imputed Price Indexes,Yearly RegressionsDutot 1.0000 1.0033 0.6392 0.5458 -14.05%
0.33% -36.29% -14.61%Carli 1.0000 1.0456 0.6604 0.5748 -12.93%
4.56% -36.84% -12.95%Jevons 1.0000 0.9946 0.5727 0.4975 -16.01%
-0.54% -42.42% -13.13%Laspeyres 1.0000 0.8653 0.5274 0.4614 -17.58%
-13.47% -39.05% -12.52%Paasche 1.0000 1.1432 0.6219 0.5366 -14.41%
14.32% -45.60% -13.72%Dummy Price Indexes,Adjacent Year Regressions
1.0000 0.9212 0.5909 0.4953 -16.11%-7.88% -35.85% -16.18%

1996 1997 1998 1999 2000 AAGR (%)SONET Systems Units
OC3 (155.52 megabits per second) 32,250 45,948 41,505 56,420 80,900 25.9OC12 (622.08 megabits per second) 13,208 21,064 20,857 34,166 52,399 41.1OC48 (2,488.32 megabits per second) 11,126 13,051 16,992 28,283 48,502 44.5OC192 (9,953.28 megabits per second) - 303 1,913 5,495 11,611 146.3Total 56,584 80,366 81,269 124,365 193,411 36.0
Revenue ($ millions)OC3 645 827 706 846 1,092 14.1OC12 634 843 772 1,127 1,574 25.5OC48 1,680 1,892 2,317 3,394 4,656 29.0OC192 - NA 761 1,923 3,251 106.6Total 2,959 3,562 4,556 7,291 10,573 37.5
SONET IXC ASP Pricing ($ thousands/unit)OC3 20 18 17 15 14 -9.4OC12 48 40 37 33 30 -11.1OC48 151 145 136 120 96 -10.7OC192 - NA 398 350 280 -16.1
Change in Prices (Percent)OC3 - -10.0 -5.6 -11.8 -10.0OC12 - -16.7 -7.5 -10.8 -9.0OC48 - -4.0 -6.0 -12.0 -20.0OC192 - - - -12.1 -20.0
Matched Model Price Index 1.00 0.92 0.86 0.76 0.63 -11.0
NA=not availableSource: RHKNote: Prices are for add/drop multiplexers, which are more expensive than standard terminals.Pricing for each follows similar trends, but ADMs are more expensive due to added equipment to add and drop traffic.
Supplemental Table 1Synchronous Optical Network (SONET) Equipment

Figure 1: Share of U.S. Patents by High-Technology Category
0
2
4
6
8
10
12
14
16
1963 1967 1971 1975 1979 1983 1987 1991 1995 1999
Year
Per
cen
t
Communications
SemiconductorDevicesComputers andPeripherials
Source: Manuel TrajtenbergComputers and Peripherials= Computer Hardware and Software + Computer Peripherials + Information Storage

ReserveBanks
Router Router
Router
Fiber Optic Loop
Internet
Switch
Hub
allows multipleusers to share asingle line
decides wherepackets shouldbe sent next
makes simpledecisions aboutwhere packetsshould be sent
Greenspan and other Governors Division of Research and Statistics
Figure 2
A Simplified Version of the Federal Reserve Board’s Local Area Network

Figure 3: Manufacturer's Revenue for Switches, Worldwide
0
1000
2000
3000
4000
5000
6000
7000
8000
1995 1996 1997 1998 1999 2000
(in $
Mill
ions
)
10-Mpbs Ethernet
100-Mbps Ethernet
1000-Mbps Ethernet
ATM
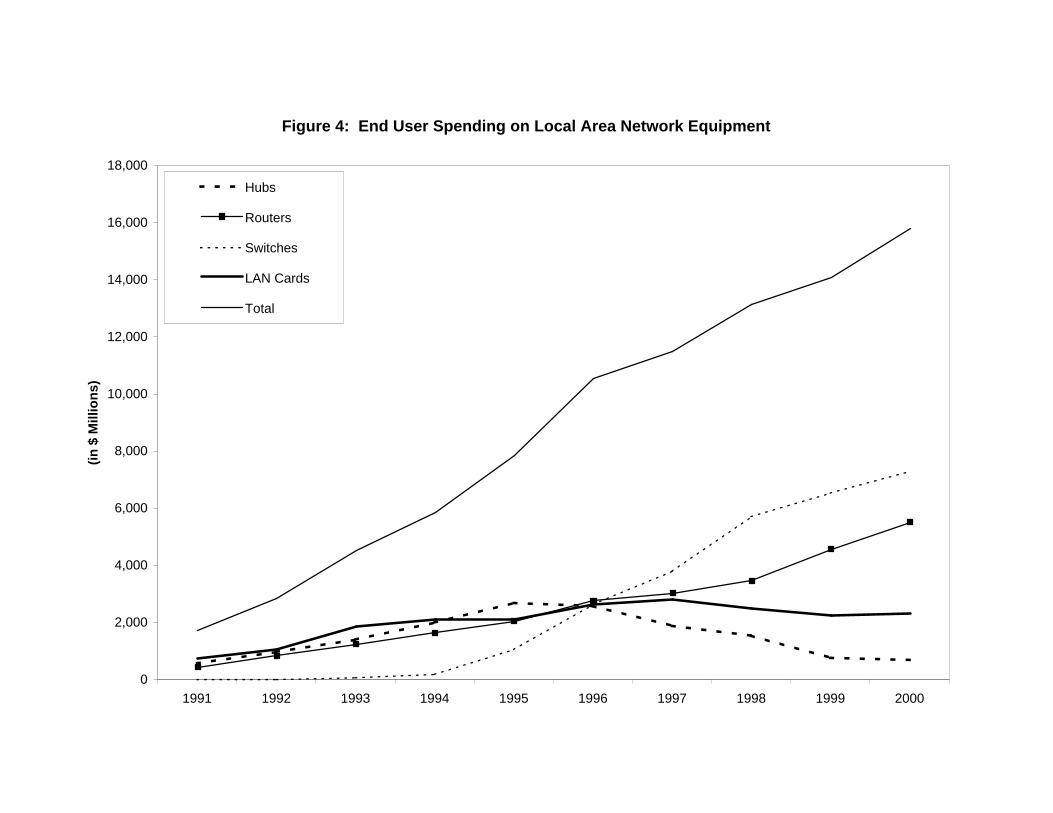
Figure 4: End User Spending on Local Area Network Equipment
0
2,000
4,000
6,000
8,000
10,000
12,000
14,000
16,000
18,000
1991 1992 1993 1994 1995 1996 1997 1998 1999 2000
(in
$ M
illio
ns)
Hubs
Routers
Switches
LAN Cards
Total
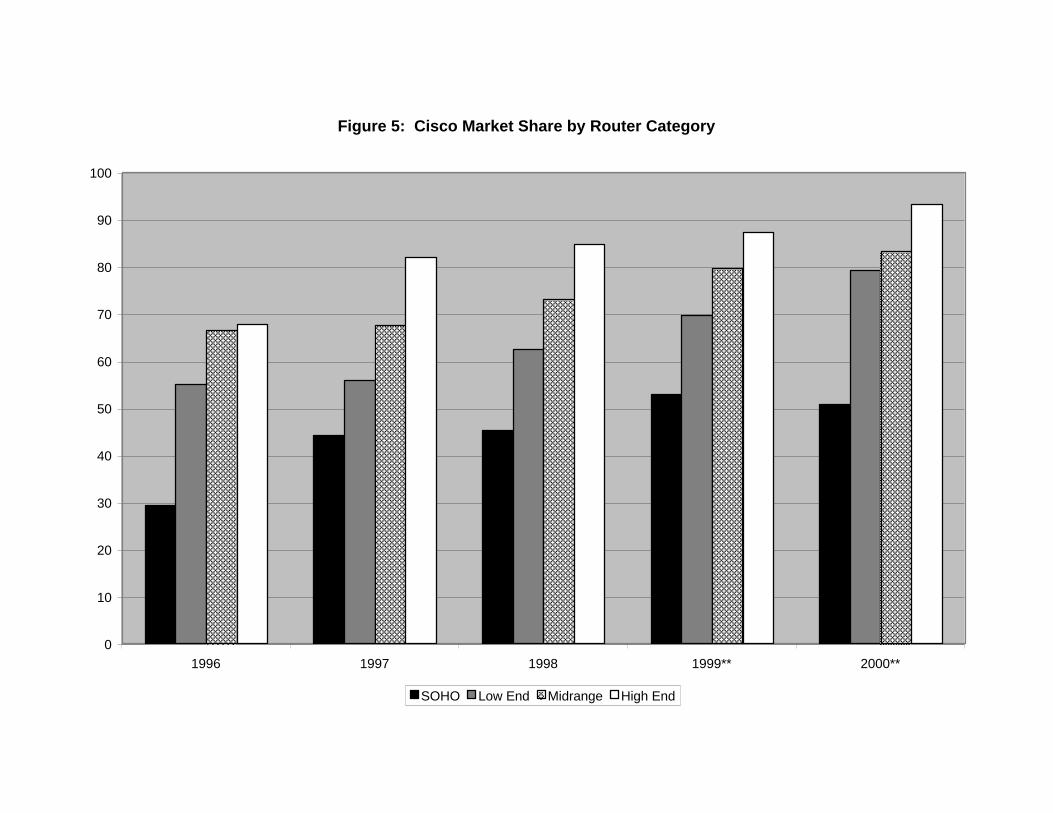
Figure 5: Cisco Market Share by Router Category
0
10
20
30
40
50
60
70
80
90
100
1996 1997 1998 1999** 2000**
SOHO Low End Midrange High End

Figure 6: Price Indexes for Hubs and Switches (Index 1996 = 100)
1996 1997 1998 1999 20000
20
40
60
80
100
120
0
20
40
60
80
100
120
Hedonic Switch Price Index, AAGR = -21.9%Chain-Weighted Price Per Port Switch Index, AAGR = -34.7%Chain-Weighted Price Per Port Hub Index, AAGR = -30.1%
1997 1998 1999 2000-50
-40
-30
-20
-10
-50
-40
-30
-20
-10
Hedonic Switch Price Index, Percent Change From Preceding YearChain-Weighted Price Per Port Switch Index, Percent Change From Preceding YearChain-Weighted Price Per Port Hub Index, Percent Change From Preceding Year