Embed Size (px)
Citation preview

www.irjhis.com ©2021 IRJHIS | Volume 2, Issue 6, June 2021 | ISSN 2582-8568 | Impact Factor 5.71
IRJHIS2106016 | International Research Journal of Humanities and Interdisciplinary Studies (IRJHIS) | 110
Price Spread Study of Chironji (Buchanania lanzan Sperg) - Assessing the Share of Primary Suppliers
Dr. (Mrs) Jyoti Pandey Assistant Professor
Department of Economics, Nirmala College, Doranda,
Ranchi (Jharkhand)
DOI No. 03.2021-11278686 DOI Link :: https://doi-ds.org/doilink/06.2021-36328941/IRJHIS2106016
Abstract: The price spread study of Chironji kernel in the state of Jharkhand brings out important
features of marketing of the forest produce. There were five marketing channels. The primary suppliers selling through channels I and II received less than 15% of the share in the consumer’s price while the share of retailers was nearly 49%. The primary suppliers having access to channels III and IV that enabled them to sell processed produce obtained a higher share of about 25%. The channel V, which was the most efficient resulted in highest share of 40% for the primary supplier as well as the least cost for the users. The number of market functionaries in this channel were the least and the primary suppliers sold the seeds directly to the processing unit located in their vicinity. At present most of the Chironji collected is sent to neighbouring states for processing. The promotion of primary processing as well as value addition of NTFPs in the state has immense scope for employment generation, poverty alleviation, and conservation of bio diversity. Keywords: NTFPS, Chironji, Price Spread, Market channels, market efficiencies
Introduction:
Price spread studies of traded Non-Timber forest produce (NTFPs) such as Chironji are of
much relevance for various reasons. NTFPs are a significant source of livelihood for the forest
households and are an integral part of their cultural identity. They have been given increasingly more
place in recent literature on forests in context to conservation of forest with people’s participation.
These studies can be used for policy formulations to improve the technical as well as allocative
efficiency of the non wood produce collected from our forests.
Chironji (Buchanania lanzan Sperg) that belongs to the Anacardiaceous family ‘is a forest
sensitive tree species’, (Troup, 1921). It is an NTPF which has robust demand and fetches good price
in the national and international retail market. The leaves and roots of the tree are used by traditional

www.irjhis.com ©2021 IRJHIS | Volume 2, Issue 6, June 2021 | ISSN 2582-8568 | Impact Factor 5.71
IRJHIS2106016 | International Research Journal of Humanities and Interdisciplinary Studies (IRJHIS) | 111
healers for curing several ailments. However, it is in demand mostly for the kernel contained in the
seed of the fruit. “These kernels have almond like flavor, that can be eaten raw or in roasted
form”…“ Chironji is an active source of phenolics, natural antioxidants, fatty acids and minerals”
(Rajput, 2018). Its users include industries such as pharmaceuticals, ayurvedic medicines, cosmetics
and Chironji oil (GoJ, 2018).
The state of Jharkhand in India, with more than 28% of area under forest (FSI, 2019) has a
tribal population of 26% (GoI, census 2011). Of this tribal population, more than 90% is rural
population, belonging to various tribal groups dependent on forests. World Bank supported, JOHAR
project report estimated that about one lakh Households (HHs) were engaged in collection of
Chironji in the state and 85% of the HHs earned between Rs 1000 to Rs 10,000 per year from this
source. However, the production of this unique forest produce is declining due to various factors.
Accelerated deforestation, climate change, competitive harvesting and unprofessional attitude of
primary suppliers have contributed to such a situation. Plantations of Chironji are not very
successful. The demand and supply imbalance has lead to a rising trend in the market price which
has resulted in nearly a 100% increase in the last ten years (JOHAR).
Literature survey:
Price spread studies show that processed or semi processed produce fetches higher share to
the primary suppliers. According to Yadav et al (2008) the price spread of unseeded tamarind was
larger than the price spread of seeded tamarind sold by the primary suppliers. The primary suppliers
could get 32% to 36 % share in case of deseeded tamarind while for seeded tamarind it was smaller
share of only14.4 % of the price paid by the consumer.
Shylanjan and Mythili (2007) analysed the price spread of NTFPs in a community in Kerala. They
concluded that monopoly of a marketing federation was not a guarantee of fair returns to the primary
suppliers. However, presence of multiple agencies in the market created more competition and
higher share for them.
The price spread in case of NTFPs is expected to be large due to the underdeveloped nature
of the market, large number of intermediaries, lack of infrastructure as well as absence of enabling
institutions in the forest areas.
The present study was taken up to analyze the price spread of Chironji kernel with the following
objectives -
To find out the alternative channels in the marketing of Chironji in Jharkhand.
To assess the marketing costs, margins, efficiencies and price spread in the different
channels.
To examine the share of different market functionaries in consumer’s rupee.

www.irjhis.com ©2021 IRJHIS | Volume 2, Issue 6, June 2021 | ISSN 2582-8568 | Impact Factor 5.71
IRJHIS2106016 | International Research Journal of Humanities and Interdisciplinary Studies (IRJHIS) | 112
To suggest measures to improve marketing efficiency of the produce.
Methodology:
The study uses descriptive research design. The qualitative research is useful in establishing
the broad pattern and interconnection of different stakeholders in the marketing of Chironji. In situ
observations and focused group discussions were essential to understand the behaviours and attitudes
of the market functionaries and identify the different market channels. The quantitative research was
instrumental in finding the averages and the relative importance of different marketing channels.
Surveys, structured interviews and questionnaires were the tools used.
The scope of the study extends from the primary suppliers to the users who may be industrial units
(user 1) and consumers (user 2). The primary suppliers are the forest household who collect Chironji
fruit and sell it mostly in semi processed form. In between the primary suppliers and the users, there
are a number of market functionaries. They include commission agents, trader aggregators,
wholesalers of kernel and seed, processors and retailers.
The selection of the study area was purposive based on data of production and market
centers. Primary data was collected by field visits from Ranchi and Khunti districts of Jharkhand
between months of May 2019 to February 2020. Also during the Covid -19 lockdown, telephonic
interviews helped in gathering information on prices prevailing in markets of cities in Odisha, Delhi
and Uttar Pradesh. Blocks and villages have been selected by purposive sampling, on the basis of
forest area and availability of Chironji trees. The selection of Households (HHs) was random,
selecting five to fifteen HHs from each village. A total of 67 HHs from10 villages were taken as
sample along with 10 traders, 8 commission agents and 5 wholesalers.
The forest HHs sell either the Chironji seed or Chironji kernel. About 4.5 kg of seed is taken
to be equivalent of 1kg kernel while calculating the price spread in various channels. In order to
calculate the cost of collection and marketing for the HHs, the imputed cost of their labour is
considered. The cost of labour is taken to be the rate as given under MANREGA which is Rs 171
per day per person. Villages within 0 to 3km from the forest were able to collect the fruits.
Price Spread (PS) and marketing efficiency are calculated by using formula given by
Acharya and Agarwal (2001). PS is defined as the difference between the price paid by the consumer
and the net price received by the primary producer for the equivalent quantity of the produce. It may
be expressed as a percentage of consumer’s price as
Price Spread = (Consumer’s Price - Primary Supplier’s net Price) X 100
Consumer’s Price
www.irjhis.com ©2021 IRJHIS | Volume 2, Issue 6, June 2021 | ISSN 2582-8568 | Impact Factor 5.71
IRJHIS2106016 | International Research Journal of Humanities and Interdisciplinary Studies (IRJHIS) | 113
The marketing efficiency is measured by using the following formula -
ܧܯ =ݎݐ ݕ ݒ ݎ ݐ
ܥܯ + ܯܯ
Where MC= Marketing cost and MM = Marketng Margin.
The price spread for 1kg of Chironji is taken as the difference between the retail price per kg
of Chironji kernel and the price received by the farmer for the equivalent amount of Chironji seed or
guthli. The difference between the wholesale price and the retail price is the retailer’s receipt,
inclusive of the marketing cost (MC) incurred by him. The retailer’s receipts minus the cost incurred
by him give his marketing margin (MM). Similarly, the MM and MC have been calculated for each
of the market functionaries.
Marketing efficiency Index is also used to compare the efficiency of the channels. Marketing is
said to be efficient, if the total marketing margin is reduced for a given marketing cost. In other
words, among the marketing margins of the different channels, that with the lowest value would
reveal a channel to be efficient. As in Solanke, (2013)
Efficiency index= (I+MM )/MC Where, I = MC, MM = Marketing Margin
MC = Marketing Cost
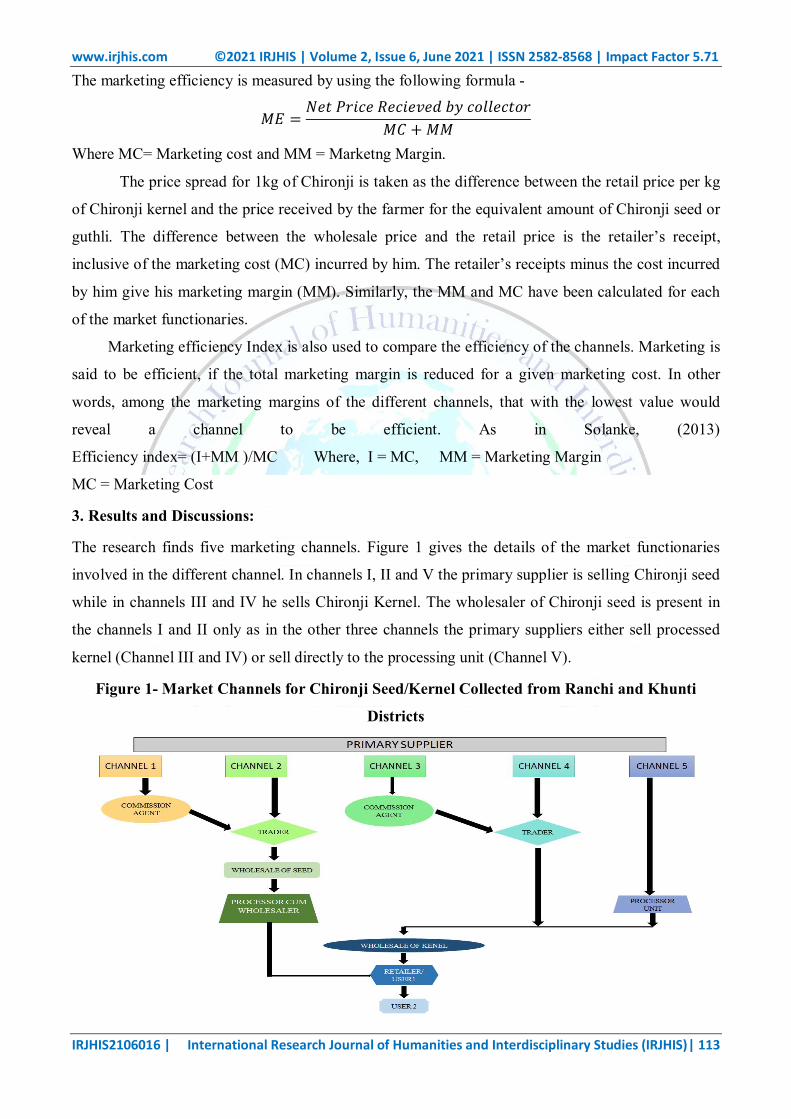
3. Results and Discussions:
The research finds five marketing channels. Figure 1 gives the details of the market functionaries
involved in the different channel. In channels I, II and V the primary supplier is selling Chironji seed
while in channels III and IV he sells Chironji Kernel. The wholesaler of Chironji seed is present in
the channels I and II only as in the other three channels the primary suppliers either sell processed
kernel (Channel III and IV) or sell directly to the processing unit (Channel V).
Figure 1- Market Channels for Chironji Seed/Kernel Collected from Ranchi and Khunti
Districts

www.irjhis.com ©2021 IRJHIS | Volume 2, Issue 6, June 2021 | ISSN 2582-8568 | Impact Factor 5.71
IRJHIS2106016 | International Research Journal of Humanities and Interdisciplinary Studies (IRJHIS) | 114
3.1 As shown in table 1, the primary supplier received gross price of Rs 360(25.7%) to Rs 600(60%)
for per kg of Chironji kernel and the net price (gross price minus marketing cost) that he received
varied from Rs 155 to Rs 395 across the five channels. In relative terms, his net share in consumer’s
price was the lowest at 11% in channel I and highest 39.5% in channel V. The Channel III and IV
give net price of Rs. 345(24.65%) and Rs. 325 (23.22). Hence, from the primary suppliers’ point of
view, channel V gives the best results.
Table 1 - Marketing Costs and Marketing Margins of Chironji in different channels
( Per Kg Chironji kernel or equivalent Chironji seed) Net Price received /Marketing costs / Marketing margins
Channels
I II III IV V Amount (in Rs.)(% of Consumer’s Price)
1. Primary Supplier i) Net price received 155
(11.08) 195 (13.94)
345 (24.65)
325 (23.22)
395 (39.5)
ii) Marketing cost 205 (14.65)
205 (14.64)
305 (21.79)
325 (23.22)
205 (20.5)
iii) Gross price received 360 (seed)
400 (seed)
650 (Kernel)
650 (kernel)
600 (seed)
2. Commission agent/ Collection agent i.) Marketing cost 10
(0.71) - 5
(0.36) - -
ii.) Marketing margin 30 (2.14)
- 95 (6.79)
- -
iii.) Price received or paid by the aggregator 400 - 750 - - 3. Aggregator/ Trader
i.) Marketing Cost 8 (0.57)
8 (0.57)
5 (0.36)
5 (0.36)
-
ii.) Marketing Margin 32 (2.29)
32 (2.28)
195 (13.93)
295 (21.07)
-
iii) Price received 440 440 950 950 - 4. Wholesaler of seed
i.) Marketing Cost 47.50 (3.39)
47.50 (3.39)
- - -
ii.) Marketing Margin 87.50 (6.25)
87.50 (6.25)
- - -
iii) Price received or paid by the processor 575 575 - - -
5. Processor / Wholesaler of Kernel i.) Marketing Cost 35
(2.5) 35 (2.5)
47.50 (3.39)
47.50 (3.39)
140 (14)
ii.) Marketing Margin 140 (10)
140 (10)
102.50 (7.32)
100 (7.14)
60 (6)
iii) Price received or paid by User one / Retailer 750 750 1100 1097.50 800 6. Retailer
i.) Marketing Cost 100 (7.14)
100 (7.14)
100 (7.14)
100 (7.14)
100 (10)

www.irjhis.com ©2021 IRJHIS | Volume 2, Issue 6, June 2021 | ISSN 2582-8568 | Impact Factor 5.71
IRJHIS2106016 | International Research Journal of Humanities and Interdisciplinary Studies (IRJHIS) | 115
ii.) Marketing Margin 550 (39.28)
550 (39.28)
200 (14.28)
202.50 (14.46)
100 (10)
7. Price paid by User Two/Consumer 1400/- (100%)
1400/- (100%)
1400/- (100%)
1400 (100%)
1000 (100%)
Source : Primary Data
3.2 After the primary supplier, the market functionaries that form the chain are Commission agents
and / or the trader aggregators. They work with small margins and low cost. Since they do not store
the produce but sell it quickly to the wholesaler, they do not have to bear the cost of storage or of
locked up capital. The commission agents specially work on small margins as they are assured of
fixed return by the traders who invest capital for purchase of the produce and their net share ranged
from 2.14% to 6.79%. The net share of trader also varied from 2.29% to 21.07%.The share of trader
aggregator increased when he bought directly from the primary supplier and when he traded in
chironji kernel.
3.3 The wholesaler of seed performs an important function of storing the produce and invests huge
capital in handling it, till it is sold to the processing units. Their gross share in consumer’s price was
nearly 10%. Except in channel V all other channels showed sale of Chironji by aggregators and
wholesalers in Jharkhand to wholesalers/ processors of neighbouring states of Chhattisgarh, Bihar
and West Bengal.
The demand for the produce is said to be higher in big cities like Delhi, Bombay and Kanpur
during the festive seasons. Traders and processors come to the market from neighboring states to
purchase Chironji seeds from the wholesalers. They play an important part in determining the price,
and their expectation of demand and supply in the market and the inventory position has a lot of
bearing on the price that comes to settle in the wholesale market. It may increase or even decrease
the share of the wholesalers.
3.4 The share of retailers shows a lot of variation across the channels, highest being around 40% in
the first two channels (accounting for sale by 80% of HHs) and as low as 10% in the fifth channel.
Less than 10% of the HHs had access to sale through channel V, i.e. directly to a processing unit
which could sell to wholesalers of the kernel.
Strikingly, only 6% of HHs were able to sell processed Chironji ( using channels III and IV). The
channel V is the only channel where intervention by government agency is seen. The Chironji is
procured in the village by the processing unit run by a producers’ cooperative society. The processed
Chironji kernel is bought by JHAMCOFED (Jharkhand State Minor Forest Produce Co-operative
Development and Marketing Federation Limited) at Rs 800/ kg and sells it at retail price between Rs
800 to 1000/kg. It also sells in the wholesale market at the state capital, Ranchi. The processing unit
funded by it, pays higher than average market price for the purchase of Chironji from the primary
suppliers.

www.irjhis.com ©2021 IRJHIS | Volume 2, Issue 6, June 2021 | ISSN 2582-8568 | Impact Factor 5.71
IRJHIS2106016 | International Research Journal of Humanities and Interdisciplinary Studies (IRJHIS) | 116
3.5 The details of marketing margin (MM), marketing cost (MC), marketing efficiency and price
spread of all five channels are shown in table 2. Being the most efficient channel V has the smallest
price spread (Rs 605) and largest share for the primary supplier (39.5%).This channel also makes the
retail price lower than all other channels. It has the lowest total marketing margin of Rs 160 only as
compared to Rs 839.50 in case of channel I. The large number of intermediaries account for the high
cost in the other channels.
MC varies between Rs. 400 to Rs. 500 per kg kernel for all the five channels which is 30% to 50%
of consumers’ price.
Table 2 - Price spread of Primary Suppliers and related values for Chironji (per kg)
The efficiency index brings out the relative efficiency of different channels. The lower the
value of the index higher is the efficiency because it implies smaller relative marketing margins. The
value of the index is more than three for the channels I and II , it is more than 2.2 for the channels III
and IV; and at 1.35 it is the lowest for channel V.
The channel II , which was opted for by the majority of HHs, gave less than 14% of the consmers’
price as net share to the primary supplier, had a very high marketing margin of over Rs 800 and a
low marketing efficiency of 0.161.
The marketing chain suffers from several inefficiencies. The primary market is very
unorganized with minimum value addition. The market is a combination of unorganized rural market
and an organized sophisticated market of super markets, exports and online sale. Producers’ and
Particular Channels
I II III IV V
Net Price of PS 155 195 345 325 395
% of consumer Price 11.07 13.92 24.64 23.21 39.5
Marketing Margin 839.5 809.5 592.5 597.5 160
Marketing Cost 405.5 395.5 462.5 477.5 445
Marketing efficiency 0.124 0.161 0.321 0.302 0.652
Efficiency Index 3.07 3.04 2.28 2.25 1.35
Users price 1400 1400 1400 1400 1000
Price Spread 1245 1205 1055 1075 605
Price Spread as (%) of user
price
88.93 86.08 75.36 76.79 60.5
% of Sample HH 21.9 62.5 3.0 3.2 9.4
www.irjhis.com ©2021 IRJHIS | Volume 2, Issue 6, June 2021 | ISSN 2582-8568 | Impact Factor 5.71
IRJHIS2106016 | International Research Journal of Humanities and Interdisciplinary Studies (IRJHIS) | 117
marketing societies are not very vibrant. Institutions like JHAMFCOFED, have been in the field of
marketing since 1963 with the objective of providing reasonable prices to the forest HHs for their
labour. However, it is not a very popular option among villagers who often find its price, the MSP
fixed by the government (Rs 109 per kg of seed for the current year; GoI, MoTA, 2018) below
market price. “It was once widely thought that governmental intervention could readily attenuate the
most serious coordination failures.….But now there is sceptism.” (Bowles, 2002, pp55)
Majority of the traders are non tribal while primary suppliers or collectors are tribal. The
question often asked is-Why have the primary suppliers not been able to shift to the more profitable
segment of the marketing chain? On adaptive behaviour Bowles(2002) comments “ People acquire
their behavioural responses in part by copying the behaviour of those who in similar situations, they
perceive as successful by some standard or by acting to maximize one’s gains given one’s belief,
about how others will act. But other influences are also at work.”( pp 11 ). In the study, formal laws
on forest rights, social conventions and beliefs as well as the asymmetry in resources and market
information were found to be the other influences responsible for this situation.
Conclusions:
A comparison of different market channels reveals that the primary market is in need of
major reforms. “A complementary configuration of market, state and community governance may be
the best hope for mobilizing the heterogenous and versatile capacities and motives of people …”
(Bowles, 2002, pp 501).Most fruitful intervention may be in setting up processing units in the region,
then the number of market functionaries and the price spread can be reduced sufficiently. It may not
be viable to have large processing units at one place. But small mobile processing units, called
“factory on wheels”, equipped with packing units can be useful in bringing professional processing
to the door step of the primary suppliers and aggregators (adapted from a model suggested by Prof.
Alok Ratnam Chaturvedi for empowering young girls of poor families through employment
generation, personal communication,19th March, 2016). Such units owned privately by individuals
or SHGs may be for the purpose of processing the produce. As mentioned by a progressive farmer in
his interview, “the farmers have been selling NTFPs in unprocessed form for ages but now they must
change.” Jharkhand is mainly a factor driven economy at present. It is time to transform it into an
efficiency driven one. The process of becoming innovation driven economy may then be self-
propagating.
Acknowledgement:
Author is thankful to the Indian Council for Social Sciences and Research, New Delhi for
funding the project on study of price spread of NTFPs under IMPRESS scheme. The work done by
research assistant Vidya Sagar is also acknowledged.

www.irjhis.com ©2021 IRJHIS | Volume 2, Issue 6, June 2021 | ISSN 2582-8568 | Impact Factor 5.71
IRJHIS2106016 | International Research Journal of Humanities and Interdisciplinary Studies (IRJHIS) | 118
Bibliography:
1. Acharya S.S and Agarwal N.L., (2001), Agricultural Marketing in India, Oxford and IBH
Publishing Co. , New Delhi.
2. Bowles, Samuel,(2002),Microeconomics: Behavior, Institutions and Evolution, Princeton
University Press,
3. GoI, MoEF, FSI, INDIA STATE OF FOREST REPORT (2019)
4. GoI, MoTA,(2018) Government introduces Minimum Support Price for 17 new items of
Minor Forest Produce; revises MSP for 23 items of
MFP;https://pib.gov.in/Pressreleaseshare.aspx?PRID=1557528
5. GOI, (2011) Census of India, Jharkhand, Series 21, Part XII-A
http://censusindia.gov.in/2011census/dchb/DCHB_A/20/2020_PART_A_DCHB_KHUNTI.
6. GoJ, JSLPS, (n.d.), Market Assessment of Non Timber Forest,Producer (NTFP) Commodities
Under JOHAR,Project Jharkhand,Final Draft Report, supported by world Bank.
7. Rajput,B.S., Gupta, D.,Kumar, S., Singh, K. and Tiwari, C. (2018),Buchanania lanzan
Spreng (Chironji): A vulnerable multipurpose tree species in Vindhyan region Journal of
Pharmacognosy and Phytochemistry; 7(5): 833-836 available online on
www.phytojournal.com
8. Shylanjan, C.S. and G. Mythili (2007),Community Dependence on Non-timber Forest
Products: A Household Analysis and its Implication for Forest Conservation, Indira Gandhi
Institute of Development Research, Mumbai
9. Solanke, S.S., Krishnan, M. , Sarda, C., Devi, N. B., Shivraman, I. and Debnathan, B.(2013)
-Production, price spread and marketing efficiency of farmed shrimp in Thane District of
Maharashtra, Indian Journal of Fisheries, , 60(3) : 47-53, July, 2013
10. Troup, R.S.,(1921)The Silviculture of Indian Trees, Vol.I,1921, Oxford At the Clarendon
Press, available
at,https://www.indiawaterportal.org/sites/indiawaterportal.org/files/silviculture_of_indian_tre
es_rstroup_vol_1.pdf, accessed on 3.5. 2019
11. Yadav, M., Dugaya, D. (2008), Issues in NTFP
marketinghttps://www.ignfa.gov.in/document/biodiversity-cell-ntfp-related-issues5.pdf

www.irjhis.com ©2021 IRJHIS | Volume 2, Issue 6, June 2021 | ISSN 2582-8568 | Impact Factor 5.71
IRJHIS2106016 | International Research Journal of Humanities and Interdisciplinary Studies (IRJHIS) | 119
Source: Field Survey of the ICSSR IMPRESS Project
First Row- Left to Right Chironji- Seed and Kernel, Measuring bowl PAILA
Second Row- Left to Right -Worker at Big Trader’s stall, Small Trader at Rural NTFPs Market