Embed Size (px)
Citation preview
Price History Tables and Charts
USA China
Western Europe World Export
Hot-rolled Band
Cold-rolled Coil
Standard Plate
Rebar
Steel Scrap
Register at: www.steelbenchmarker.com

1
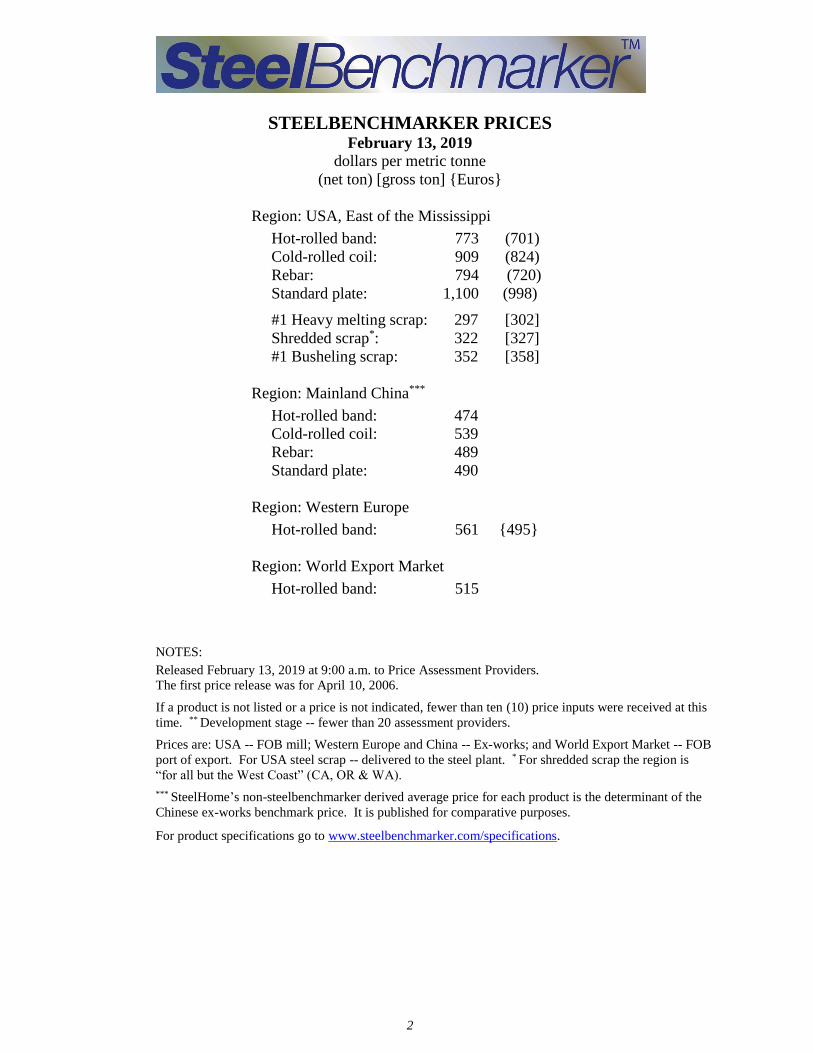
Global HRB Pricing Rebound World Export, Western Europe, China and USA up 3.4%, 2.4%, 1.5% and 1.2%
SteelBenchmarkerTM Report #308
ENGLEWOOD CLIFFS, NJ – The bi-monthly SteelBenchmarkerTM World Export HRB price
for February 13th was up 3.4% to $515 per tonne after decreasing in the prior report. The
Western European HRB price increased 2.4% to $561 per tonne (on a Euro basis, it was up
3.5%) after decreasing the prior two reports. The Chinese HRB price for February 13th was up
1.5% at $474 for the second consecutive time. The United States HRB price increased 1.2% to
$773 per tonne after decreasing eleven consecutive times.
In its three hundred eighth report, the SteelBenchmarkerTM released 10 steel products and 3
USA scrap prices. Of these, here are four benchmark prices for hot-rolled band for February
13, 2019:
USA – $773 per metric tonne ($701 per net ton), FOB the mill – up $9 per tonne from $764
($693 nt) two weeks ago, up $361 from the recent low of $412 ($374 nt) on Dec. 14, 2015 and
up $344 from the low of $429 per tonne ($390 nt) on May 25, 2009. It is down $233 per
tonne from the recent high of $1,006 ($912 nt) on Jul. 11, 2018 and down $430 (35.7%) from
the record peak of $1,203 per tonne ($1,091 nt) on July 28, 2008.
China – $474 per metric tonne, ex-works – up $7 from $467 two weeks ago, up $243 per
tonne from the recent low of $231 on Dec. 14, 2015 and up $67 per tonne from the low of
$407 per tonne on Oct. 12, 2009. It is down $163 per tonne from the recent high of $637 on
Aug. 22, 2011 and down $259 (35.3%) from the record peak of $733 per tonne on July 14,
2008.
Western Europe – $561 (€496) per metric tonne, ex-works – up $13 from $548 (€479) two
weeks ago (up €17 on a Euro basis), up $215 (up €171) from the recent low of $346 (€325) on
Nov. 23, 2015 and down $10 (up €115) from the low of $571 (€381) per tonne on Nov. 23,
2009. It is down $291 (€109) per tonne from the recent high of $852 (€605) on Mar. 28, 2011
and down $643 (53.4%) (€260) (34.4%) from the record peak of $1,204 (€756) per tonne on
July 14, 2008.
World Export Price – $515 per metric tonne, FOB the port of export – up $17 from $498
two weeks ago, up $243 per tonne from the recent low of $272 on Feb. 8, 2016 and up $19
from the low of $496 per tonne on Nov. 9, 2009. It is down $258 per tonne from the recent
high of $773 on Feb 14, 2011 and down $598 (53.7%) from the record peak of $1,113 per
tonne on July 28, 2008.
2
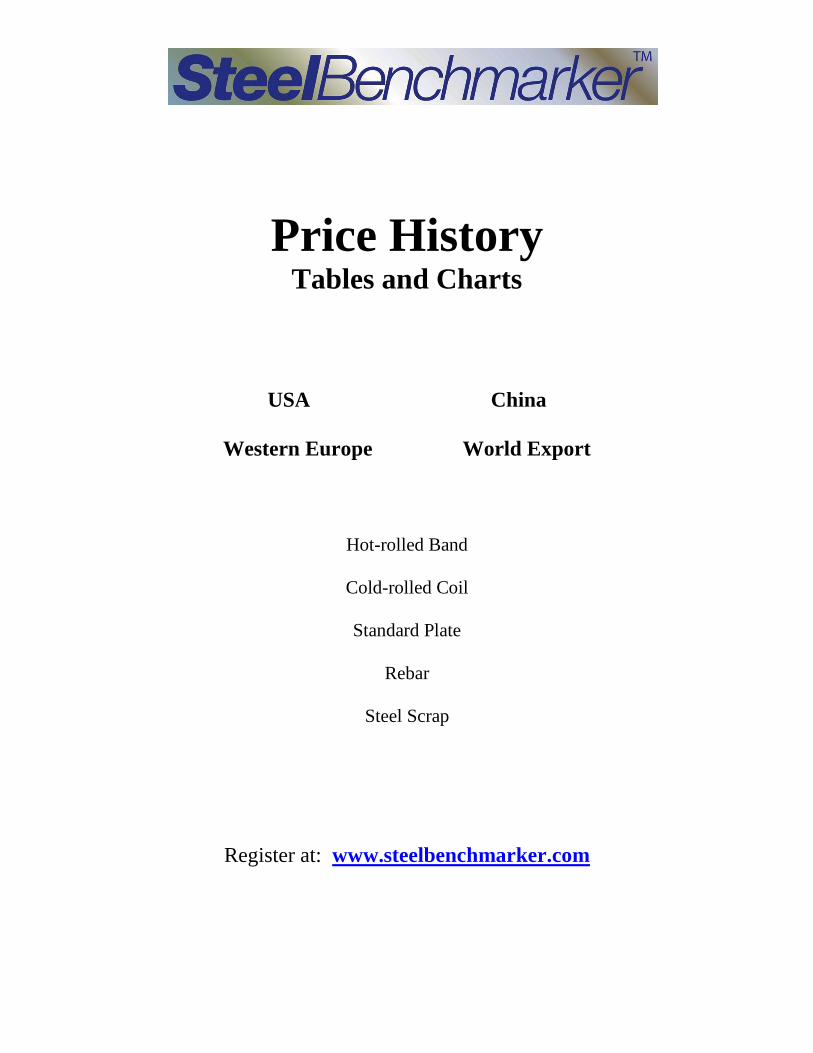
STEELBENCHMARKER PRICES February 13, 2019
dollars per metric tonne
(net ton) [gross ton] {Euros}
Region: USA, East of the Mississippi
Hot-rolled band: 773 (701)
Cold-rolled coil: 909 (824)
Rebar: 794 (720)
Standard plate: 1,100 (998)
#1 Heavy melting scrap: 297 [302]
Shredded scrap*: 322 [327]
#1 Busheling scrap: 352 [358]
Region: Mainland China***
Hot-rolled band: 474
Cold-rolled coil: 539
Rebar: 489
Standard plate: 490
Region: Western Europe
Hot-rolled band: 561 {495}
Region: World Export Market
Hot-rolled band: 515
NOTES:
Released February 13, 2019 at 9:00 a.m. to Price Assessment Providers.
The first price release was for April 10, 2006.
If a product is not listed or a price is not indicated, fewer than ten (10) price inputs were received at this
time. ** Development stage -- fewer than 20 assessment providers.
Prices are: USA -- FOB mill; Western Europe and China -- Ex-works; and World Export Market -- FOB
port of export. For USA steel scrap -- delivered to the steel plant. * For shredded scrap the region is
“for all but the West Coast” (CA, OR & WA).
*** SteelHome’s non-steelbenchmarker derived average price for each product is the determinant of the
Chinese ex-works benchmark price. It is published for comparative purposes.
For product specifications go to www.steelbenchmarker.com/specifications.
3
773
474
515
192
561
100
200
300
400
500
600
700
800
900
1000
1100
1200
Jan
-02
Ap
r-02
Jul-0
2O
ct-
02
Jan
-03
Ap
r-03
Jul-0
3O
ct-
03
Jan
-04
Ap
r-04
Jul-0
4O
ct-
04
Jan
-05
Ap
r-05
Jul-0
5O
ct-
05
Jan
-06
Ap
r-06
Jul-0
6O
ct-
06
Jan
-07
Ap
r-07
Jul-0
7O
ct-
07
Jan
-08
Ap
r-08
Jul-0
8O
ct-
08
Jan
-09
Ap
r-09
Jul-0
9O
ct-
09
Jan
-10
Ap
r-10
Jul-1
0O
ct-
10
Jan
-11
Ap
r-11
Jul-1
1O
ct-
11
Jan
-12
Ap
r-12
Jul-1
2O
ct-
12
Jan
-13
Ap
r-13
Jul-1
3O
ct-
13
Jan
-14
Ap
r-14
Jul-1
4O
ct-
14
Jan
-15
Ap
r-15
Jul-1
5O
ct-
15
Jan
-16
Ap
r-16
Jul-1
6O
ct-
16
Jan
-17
Ap
r-17
Jul-1
7O
ct-
17
Jan
-18
Ap
r-18
Jul-1
8O
ct-
18
Jan
-19
Ap
r-19
Do
lla
rs p
er
me
tric
to
nn
e
SteelBenchmarkerTM HRB Price
USA, China, Western Europe and World Export(WSD's PriceTrack data, Jan. 2002 - March 2006; SteelBenchmarker data begins April 2006)
USAFOB mill
World ExportFOB port of export
Chinaex-works
Western Europeex-works
February 11, 2019

4
909
539
200
300
400
500
600
700
800
900
1000
1100
1200
1300
Jan
-02
Ap
r-02
Jul-0
2O
ct-
02
Jan
-03
Ap
r-03
Jul-0
3O
ct-
03
Jan
-04
Ap
r-04
Jul-0
4O
ct-
04
Jan
-05
Ap
r-05
Jul-0
5O
ct-
05
Jan
-06
Ap
r-06
Jul-0
6O
ct-
06
Jan
-07
Ap
r-07
Jul-0
7O
ct-
07
Jan
-08
Ap
r-08
Jul-0
8O
ct-
08
Jan
-09
Ap
r-09
Jul-0
9O
ct-
09
Jan
-10
Ap
r-10
Jul-1
0O
ct-
10
Jan
-11
Ap
r-11
Jul-1
1O
ct-
11
Jan
-12
Ap
r-12
Jul-1
2O
ct-
12
Jan
-13
Ap
r-13
Jul-1
3O
ct-
13
Jan
-14
Ap
r-14
Jul-1
4O
ct-
14
Jan
-15
Ap
r-15
Jul-1
5O
ct-
15
Jan
-16
Ap
r-16
Jul-1
6O
ct-
16
Jan
-17
Ap
r-17
Jul-1
7O
ct-
17
Jan
-18
Ap
r-18
Jul-1
8O
ct-
18
Jan
-19
Ap
r-19
Do
lla
rs p
er
me
tric
to
nn
e
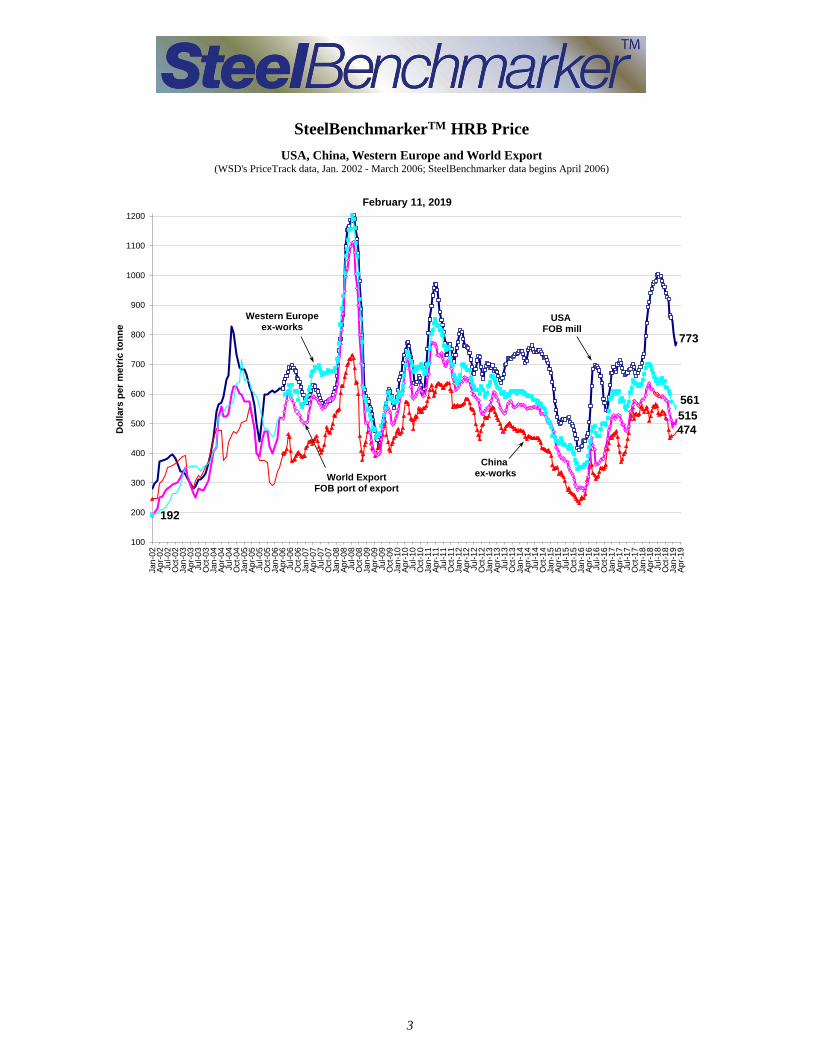
SteelBenchmarkerTM CRC Price
USA, China, Western Europe and World Export(WSD's PriceTrack data, Jan. 2002 - March 2006; SteelBenchmarker data begins April 2006)
USAFOB mill
World ExportFOB port of export
Chinaex-works
Western Europeex-works
February 11, 2019

5
1100
490
200
400
600
800
1000
1200
1400
1600
Jan
-02
Apr-
02
Jul-0
2O
ct-
02
Jan
-03
Apr-
03
Jul-0
3O
ct-
03
Jan
-04
Apr-
04
Jul-0
4O
ct-
04
Jan
-05
Apr-
05
Jul-0
5O
ct-
05
Jan
-06
Apr-
06
Jul-0
6O
ct-
06
Jan
-07
Apr-
07
Jul-0
7O
ct-
07
Jan
-08
Apr-
08
Jul-0
8O
ct-
08
Jan
-09
Apr-
09
Jul-0
9O
ct-
09
Jan
-10
Apr-
10
Jul-1
0O
ct-
10
Jan
-11
Apr-
11
Jul-1
1O
ct-
11
Jan
-12
Apr-
12
Jul-1
2O
ct-
12
Jan
-13
Apr-
13
Jul-1
3O
ct-
13
Jan
-14
Apr-
14
Jul-1
4O
ct-
14
Jan
-15
Apr-
15
Jul-1
5O
ct-
15
Jan
-16
Apr-
16
Jul-1
6O
ct-
16
Jan
-17
Apr-
17
Jul-1
7O
ct-
17
Jan
-18
Apr-
18
Jul-1
8O
ct-
18
Jan
-19
Apr-
19
Do
llars
pe
r m
etr
ic t
on
ne
SteelBenchmarkerTM Plate Price
USA, China, Western Europe and World Export(WSD's PriceTrack data, Jan. 2002 - March 2006; SteelBenchmarker data begins April 2006)
USAFOB mill
World ExportFOB port of export
Chinaex-works
Western Europeex-works
February 11, 2019

6
489
100
200
300
400
500
600
700
800
900
1000
1100
1200
Jan
-02
Apr-
02
Jul-0
2O
ct-
02
Jan
-03
Apr-
03
Jul-0
3O
ct-
03
Jan
-04
Apr-
04
Jul-0
4O
ct-
04
Jan
-05
Apr-
05
Jul-0
5O
ct-
05
Jan
-06
Apr-
06
Jul-0
6O
ct-
06
Jan
-07
Apr-
07
Jul-0
7O
ct-
07
Jan
-08
Apr-
08
Jul-0
8O
ct-
08
Jan
-09
Apr-
09
Jul-0
9O
ct-
09
Jan
-10
Apr-
10
Jul-1
0O
ct-
10
Jan
-11
Apr-
11
Jul-1
1O
ct-
11
Jan
-12
Apr-
12
Jul-1
2O
ct-
12
Jan
-13
Apr-
13
Jul-1
3O
ct-
13
Jan
-14
Apr-
14
Jul-1
4O
ct-
14
Jan
-15
Apr-
15
Jul-1
5O
ct-
15
Jan
-16
Apr-
16
Jul-1
6O
ct-
16
Jan
-17
Apr-
17
Jul-1
7O
ct-
17
Jan
-18
Apr-
18
Jul-1
8O
ct-
18
Jan
-19
Apr-
19
Do
llars
pe
r m
etr
ic t
on
ne
SteelBenchmarkerTM Rebar Price
USA, China, Western Europe and World Export(WSD's PriceTrack data, Jan. 2002 - March 2006; SteelBenchmarker data begins April 2006)
USAFOB mill
World ExportFOB port of export
Chinaex-works
Western Europeex-works
February 11, 2019

7
302
327358
0
100
200
300
400
500
600
700
800
900
Jan
-02
Ap
r-02
Jul-0
2O
ct-
02
Jan
-03
Ap
r-03
Jul-0
3O
ct-
03
Jan
-04
Ap
r-04
Jul-0
4O
ct-
04
Jan
-05
Ap
r-05
Jul-0
5O
ct-
05
Jan
-06
Ap
r-06
Jul-0
6O
ct-
06
Jan
-07
Ap
r-07
Jul-0
7O
ct-
07
Jan
-08
Ap
r-08
Jul-0
8O
ct-
08
Jan
-09
Ap
r-09
Jul-0
9O
ct-
09
Jan
-10
Ap
r-10
Jul-1
0O
ct-
10
Jan
-11
Ap
r-11
Jul-1
1O
ct-
11
Jan
-12
Ap
r-12
Jul-1
2O
ct-
12
Jan
-13
Ap
r-13
Jul-1
3O
ct-
13
Jan
-14
Ap
r-14
Jul-1
4O
ct-
14
Jan
-15
Ap
r-15
Jul-1
5O
ct-
15
Jan
-16
Ap
r-16
Jul-1
6O
ct-
16
Jan
-17
Ap
r-17
Jul-1
7O
ct-
17
Jan
-18
Ap
r-18
Jul-1
8O
ct-
18
Jan
-19
Ap
r-19
Do
lla
rs p
er
gro
ss
to
n
SteelBenchmarkerTM Scrap Price
USA, delivered to steel plant
(AMM scrap price data, Jan. 2002 - Jan. 2007; SteelBenchmarker data begins Feb. 2007)
#1 Heavy Melting
Shredded Scrap
February 11, 2019
#1 Busheling

8
FOB mill* FOB mill*
Dollars per Net Ton Dollars per Metric Tonne
---------HRB-------- ---------CRC--------- ---------Plate--------- --------Rebar---------
Dlr Pct Dlr Pct Dlr Pct Dlr Pct
Price Chng Chng Price Chng Chng Price Chng Chng Price Chng Chng
25-Sep-17 626 -11 -1.8% 797 -2 -0.2% 703 -18 -2.5% na - -
09-Oct-17 610 -16 -2.6% 781 -16 -2.0% 669 -34 -4.8% 584 - -
23-Oct-17 600 -10 -1.7% 765 -16 -2.1% 684 15 2.3% na - -
13-Nov-17 609 9 1.6% 774 9 1.2% 685 0 0.1% na - -
27-Nov-17 618 9 1.5% 770 -3 -0.4% 678 -7 -1.0% na - -
11-Dec-17 626 8 1.3% 807 37 4.8% 738 60 8.8% na - -
25-Dec-17 638 12 1.9% 817 10 1.2% 713 -24 -3.3% na - -
08-Jan-18 658 21 3.2% 822 5 0.6% 732 19 2.7% 601 - -
22-Jan-18 668 9 1.4% 826 4 0.5% 762 30 4.1% na - -
12-Feb-18 720 53 7.9% 857 31 3.7% 800 38 4.9% 644 - -
26-Feb-18 760 40 5.6% 876 19 2.3% 846 46 5.8% 673 29 4.5%
12-Mar-18 811 51 6.7% 944 68 7.8% 879 33 4.0% 699 26 3.9%
26-Mar-18 825 14 1.7% 951 7 0.7% 924 44 5.1% 706 7 0.9%
09-Apr-18 854 29 3.5% 977 26 2.7% 935 12 1.3% 742 36 5.1%
23-Apr-18 866 12 1.4% 973 -4 -0.4% 938 3 0.3% 725 -17 -2.3%
14-May-18 881 15 1.8% 995 22 2.2% 927 -11 -1.2% 732 7 1.0%
28-May-18 886 4 0.5% 996 2 0.2% 935 8 0.9% 766 34 4.6%
11-Jun-18 890 5 0.5% 1013 16 1.6% 925 -10 -1.1% 673 -93 -12.2%
25-Jun-18 907 16 1.9% 1012 -1 -0.1% 970 45 4.8% 725 52 7.8%
09-Jul-18 912 5 0.6% 1000 -11 -1.1% 990 20 2.0% 758 33 4.6%
23-Jul-18 903 -10 -1.1% 994 -6 -0.6% 978 -12 -1.2% 762 4 0.5%
13-Aug-18 904 2 0.2% 965 -29 -3.0% 993 15 1.6% na - -
27-Aug-18 890 -14 -1.5% 966 1 0.1% 989 -4 -0.4% 724 - -
10-Sep-18 878 -12 -1.4% 959 -7 -0.7% 990 1 0.1% na - -
24-Sep-18 872 -7 -0.7% 957 -2 -0.2% 984 -5 -0.5% na - -
08-Oct-18 853 -19 -2.2% 933 -24 -2.5% 1003 19 1.9% na - -
22-Oct-18 842 -11 -1.3% 923 -11 -1.1% 994 -9 -0.9% na - -
12-Nov-18 835 -7 -0.8% 926 3 0.3% 992 -2 -0.2% na - -
26-Nov-18 784 -51 -6.1% 899 -27 -2.9% 1014 22 2.2% na - -
10-Dec-18 778 -6 -0.8% 894 -5 -0.5% 986 -28 -2.8% na - -
24-Dec-18 767 -11 -1.4% 884 -11 -1.2% 1029 43 4.4% na - -
14-Jan-19 731 -36 -4.7% 843 -41 -4.6% 995 -34 -3.3% 717 - -
28-Jan-19 693 -38 -5.2% 822 -21 -2.5% 1007 12 1.2% 731 15 2.0%
11-Feb-19 701 8 1.2% 825 3 0.3% 998 -9 -0.9% 720 -11 -1.5%
Notes: * Ex-works (the same as FOB mill)
Prices released on Wednesdays following the 2nd and 4th Mondays of the month at 9:00 AM to Price
Assessment Providers. If a price is not indicated, fewer than ten (10) price inputs were received at that time.
The first price release was for April 10, 2006 for data go to steelbenchmarker.com/files/history2.pdf.
For product specifications refer to last page, or go to steelbenchmarker.com/specifications.
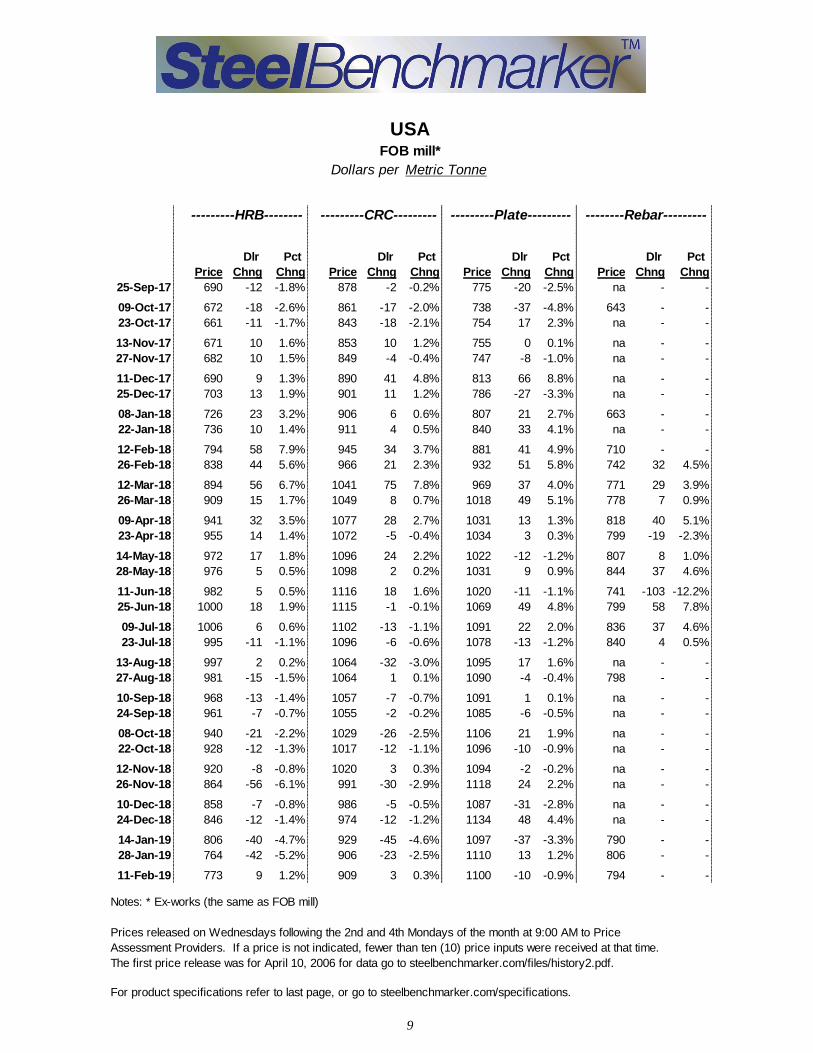
USA
9
FOB mill*
Dollars per Metric Tonne
--------Rebar--------- ---------HRB-------- ---------CRC--------- ---------Plate--------- --------Rebar---------
Dlr Pct Dlr Pct Dlr Pct Dlr Pct
Price Chng Chng Price Chng Chng Price Chng Chng Price Chng Chng
25-Sep-17 690 -12 -1.8% 878 -2 -0.2% 775 -20 -2.5% na - -
09-Oct-17 672 -18 -2.6% 861 -17 -2.0% 738 -37 -4.8% 643 - -
23-Oct-17 661 -11 -1.7% 843 -18 -2.1% 754 17 2.3% na - -
13-Nov-17 671 10 1.6% 853 10 1.2% 755 0 0.1% na - -
27-Nov-17 682 10 1.5% 849 -4 -0.4% 747 -8 -1.0% na - -
11-Dec-17 690 9 1.3% 890 41 4.8% 813 66 8.8% na - -
25-Dec-17 703 13 1.9% 901 11 1.2% 786 -27 -3.3% na - -
08-Jan-18 726 23 3.2% 906 6 0.6% 807 21 2.7% 663 - -
22-Jan-18 736 10 1.4% 911 4 0.5% 840 33 4.1% na - -
12-Feb-18 794 58 7.9% 945 34 3.7% 881 41 4.9% 710 - -
26-Feb-18 838 44 5.6% 966 21 2.3% 932 51 5.8% 742 32 4.5%
12-Mar-18 894 56 6.7% 1041 75 7.8% 969 37 4.0% 771 29 3.9%
26-Mar-18 909 15 1.7% 1049 8 0.7% 1018 49 5.1% 778 7 0.9%
09-Apr-18 941 32 3.5% 1077 28 2.7% 1031 13 1.3% 818 40 5.1%
23-Apr-18 955 14 1.4% 1072 -5 -0.4% 1034 3 0.3% 799 -19 -2.3%
14-May-18 972 17 1.8% 1096 24 2.2% 1022 -12 -1.2% 807 8 1.0%
28-May-18 976 5 0.5% 1098 2 0.2% 1031 9 0.9% 844 37 4.6%
11-Jun-18 982 5 0.5% 1116 18 1.6% 1020 -11 -1.1% 741 -103 -12.2%
25-Jun-18 1000 18 1.9% 1115 -1 -0.1% 1069 49 4.8% 799 58 7.8%
09-Jul-18 1006 6 0.6% 1102 -13 -1.1% 1091 22 2.0% 836 37 4.6%
23-Jul-18 995 -11 -1.1% 1096 -6 -0.6% 1078 -13 -1.2% 840 4 0.5%
13-Aug-18 997 2 0.2% 1064 -32 -3.0% 1095 17 1.6% na - -
27-Aug-18 981 -15 -1.5% 1064 1 0.1% 1090 -4 -0.4% 798 - -
10-Sep-18 968 -13 -1.4% 1057 -7 -0.7% 1091 1 0.1% na - -
24-Sep-18 961 -7 -0.7% 1055 -2 -0.2% 1085 -6 -0.5% na - -
08-Oct-18 940 -21 -2.2% 1029 -26 -2.5% 1106 21 1.9% na - -
22-Oct-18 928 -12 -1.3% 1017 -12 -1.1% 1096 -10 -0.9% na - -
12-Nov-18 920 -8 -0.8% 1020 3 0.3% 1094 -2 -0.2% na - -
26-Nov-18 864 -56 -6.1% 991 -30 -2.9% 1118 24 2.2% na - -
10-Dec-18 858 -7 -0.8% 986 -5 -0.5% 1087 -31 -2.8% na - -
24-Dec-18 846 -12 -1.4% 974 -12 -1.2% 1134 48 4.4% na - -
14-Jan-19 806 -40 -4.7% 929 -45 -4.6% 1097 -37 -3.3% 790 - -
28-Jan-19 764 -42 -5.2% 906 -23 -2.5% 1110 13 1.2% 806 - -
11-Feb-19 773 9 1.2% 909 3 0.3% 1100 -10 -0.9% 794 - -
Notes: * Ex-works (the same as FOB mill)
Prices released on Wednesdays following the 2nd and 4th Mondays of the month at 9:00 AM to Price
Assessment Providers. If a price is not indicated, fewer than ten (10) price inputs were received at that time.
The first price release was for April 10, 2006 for data go to steelbenchmarker.com/files/history2.pdf.
For product specifications refer to last page, or go to steelbenchmarker.com/specifications.
USA

10
--------Rebar--------- --------------------------------Steel Scrap**--------------------------------
#1 Heavy Melting Shredded Scrap #1 Busheling
Dlr Pct Dlr Pct Dlr Pct
Price Chng Chng Price Chng Chng Price Chng Chng
25-Sep-17 276 -4 -1.5% 300 -5 -1.6% 379 -5 -1.3%
09-Oct-17 250 -26 -9.3% 271 -29 -9.8% 348 -31 -8.1%
23-Oct-17 255 5 2.0% 275 4 1.6% 345 -3 -1.0%
13-Nov-17 255 0 0.0% 275 0 0.0% 345 0 0.0%
27-Nov-17 260 5 2.0% 280 5 1.8% 340 -5 -1.4%
11-Dec-17 290 30 11.5% 320 40 14.3% 370 30 8.8%
25-Dec-17 290 0 0.0% 330 10 3.1% 371 1 0.3%
08-Jan-18 310 20 6.9% 345 15 4.4% 385 14 3.8%
22-Jan-18 310 0 0.0% 345 0 0.0% 385 0 0.0%
12-Feb-18 315 5 1.6% 345 0 0.0% 385 0 0.0%
26-Feb-18 315 0 0.0% 345 0 0.0% 385 0 0.0%
12-Mar-18 340 25 7.9% 365 20 5.9% 380 -5 -1.3%
26-Mar-18 340 0 0.0% 365 0 0.0% 380 0 0.0%
09-Apr-18 355 15 4.4% 385 20 5.5% 395 15 3.9%
23-Apr-18 350 -5 -1.4% 380 -5 -1.3% 395 0 0.0%
14-May-18 350 0 0.0% 370 -10 -2.6% 395 0 0.0%
28-May-18 350 0 0.0% 370 0 0.0% 395 0 0.0%
11-Jun-18 350 0 0.0% 375 5 1.4% 405 10 2.5%
25-Jun-18 350 0 0.0% 375 0 0.0% 405 0 0.0%
09-Jul-18 350 0 0.0% 375 0 0.0% 415 10 2.4%
23-Jul-18 350 0 0.0% 375 0 0.0% 415 0 0.0%
13-Aug-18 325 -25 -7.1% 350 -25 -6.7% 405 -10 -2.4%
27-Aug-18 325 0 0.0% 350 0 0.0% 405 0 0.0%
10-Sep-18 305 -20 -6.2% 330 -20 -5.7% 385 -20 -4.9%
24-Sep-18 305 0 0.0% 330 0 0.0% 385 0 0.0%
08-Oct-18 315 10 3.3% 340 10 3.0% 405 20 5.2%
22-Oct-18 315 0 0.0% 340 0 0.0% 405 0 0.0%
12-Nov-18 335 20 6.3% 360 20 5.9% 405 0 0.0%
26-Nov-18 335 0 0.0% 360 0 0.0% 405 0 0.0%
10-Dec-18 331 -4 -1.2% 357 -3 -0.8% 403 -2 -0.5%
24-Dec-18 325 -6 -1.8% 352 -5 -1.4% 400 -3 -0.7%
14-Jan-19 303 -22 -6.8% 328 -24 -6.8% 375 -25 -6.3%
28-Jan-19 299 -4 -1.3% 324 -4 -1.2% 366 -9 -2.4%
11-Feb-19 302 3 1.0% 327 3 0.9% 358 -8 -2.2%
Notes: ** Steel scrap delivered to steel plant
#1 heavy melting – demolition scrap that is at least ¼” thick. This grade does not include
the heavy “p & s” (plate and structural ) category that includes the very thick scrap items.
Shredded – largely old cars and some appliances – for all but the West Coast (CA, OR & WA).
#1 busheling – new sheet steel scrap.
Prices released on Wednesdays following the 2nd and 4th Mondays of the month at 9:00 AM to Price
Assessment Providers. If a price is not indicated, fewer than ten (10) price inputs were received at that time.
The first price release was for Feb.12, 2007 for data go to steelbenchmarker.com/files/history2.pdf.
For product specifications refer to last page, or go to steelbenchmarker.com/specifications.
delivered to steel plant
Dollars per Gross Ton
USA

11
Dollars per Metric Tonne Dollars per Metric Tonne
--------------------------------Steel Scrap**-------------------------------- ---------HRB-------- ---------CRC--------- ---------Plate--------- --------Rebar---------
Dlr Pct Dlr Pct Dlr Pct Dlr Pct
Price Chng Chng Price Chng Chng Price Chng Chng Price Chng Chng
25-Sep-17 517 -34 -6.2% 591 -33 -5.3% 514 -22 -4.1% 505 -31 -5.8%
09-Oct-17 533 16 3.1% 594 3 0.5% 525 11 2.1% 511 6 1.2%
23-Oct-17 533 0 0.0% 604 10 1.7% 531 6 1.1% 507 -4 -0.8%
13-Nov-17 528 -5 -0.9% 603 -1 -0.2% 525 -6 -1.1% 516 9 1.8%
27-Nov-17 533 5 0.9% 617 14 2.3% 531 6 1.1% 553 37 7.2%
11-Dec-17 556 23 4.3% 636 19 3.1% 551 20 3.8% 604 51 9.2%
25-Dec-17 558 2 0.4% 641 5 0.8% 551 0 0.0% 587 -17 -2.8%
08-Jan-18 549 -9 -1.6% 644 3 0.5% 545 -6 -1.1% 531 -56 -9.5%
22-Jan-18 540 -9 -1.6% 630 -14 -2.2% 538 -7 -1.3% 530 -1 -0.2%
12-Feb-18 549 9 1.7% 636 6 1.0% 549 11 2.0% 538 8 1.5%
26-Feb-18 556 7 1.3% 638 2 0.3% 559 10 1.8% 551 13 2.4%
12-Mar-18 538 -18 -3.2% 630 -8 -1.3% 557 -2 -0.4% 530 -21 -3.8%
26-Mar-18 510 -28 -5.2% 609 -21 -3.3% 549 -8 -1.4% 484 -46 -8.7%
09-Apr-18 524 14 2.7% 611 2 0.3% 553 4 0.7% 501 17 3.5%
23-Apr-18 542 18 3.4% 614 3 0.5% 567 14 2.5% 519 18 3.6%
14-May-18 559 17 3.1% 621 7 1.1% 586 19 3.4% 544 25 4.8%
28-May-18 555 -4 -0.7% 617 -4 -0.6% 581 -5 -0.9% 525 -19 -3.5%
11-Jun-18 566 11 2.0% 625 8 1.3% 587 6 1.0% 538 13 2.5%
25-Jun-18 559 -7 -1.2% 620 -5 -0.8% 578 -9 -1.5% 537 -1 -0.2%
09-Jul-18 535 -24 -4.3% 601 -19 -3.1% 553 -25 -4.3% 511 -26 -4.8%
23-Jul-18 530 -5 -0.9% 591 -10 -1.7% 543 -10 -1.8% 515 4 0.8%
13-Aug-18 531 1 0.2% 593 2 0.3% 546 3 0.6% 537 22 4.3%
27-Aug-18 542 11 2.1% 607 14 2.4% 556 10 1.8% 555 18 3.4%
10-Sep-18 540 -2 -0.4% 608 1 0.2% 556 0 0.0% 559 4 0.7%
24-Sep-18 534 -6 -1.1% 609 1 0.2% 553 -3 -0.5% 561 2 0.4%
08-Oct-18 519 -15 -2.8% 596 -13 -2.1% 545 -8 -1.4% 545 -16 -2.9%
22-Oct-18 515 -4 -0.8% 594 -2 -0.3% 532 -13 -2.4% 558 13 2.4%
12-Nov-18 479 -36 -7.0% 564 -30 -5.1% 510 -22 -4.1% 542 -16 -2.9%
26-Nov-18 450 -29 -6.1% 535 -29 -5.1% 469 -41 -8.0% 489 -53 -9.8%
10-Dec-18 458 8 1.8% 536 1 0.2% 471 2 0.4% 489 0 0.0%
24-Dec-18 461 3 0.7% 532 -4 -0.7% 472 1 0.2% 485 -4 -0.8%
14-Jan-19 461 0 0.0% 532 0 0.0% 476 4 0.8% 477 -8 -1.6%
28-Jan-19 467 6 1.3% 536 4 0.8% 483 7 1.5% 480 3 0.6%
11-Feb-19 474 7 1.5% 539 3 0.6% 490 7 1.4% 489 9 1.9%
Notes: SteelHome's non-steelbenchmarker derived average price for each product is the determinant of
the Chinese ex-works benchmark price. It is published for comparative purposes.
Prices released on Wednesdays following the 2nd and 4th Mondays of the month at 9:00 AM to Price
Assessment Providers. If a price is not indicated, fewer than ten (10) price inputs were received at that time.
The first price release was for April 10, 2006 for data go to steelbenchmarker.com/files/history2.pdf.
For product specifications refer to last page, or go to steelbenchmarker.com/specifications.
ChinaEx-works

12
Dollars per Metric Tonne Euros per Metric Tonne
--------Rebar--------- ---------HRB-------- ---------CRC--------- ---------Plate--------- --------Rebar---------
Dlr Pct Dlr Pct Dlr Pct Dlr Pct
Price Chng Chng Price Chng Chng Price Chng Chng Price Chng Chng
25-Sep-17 641 -4 -0.6% na - - na - - na - -
09-Oct-17 635 -6 -0.9% na - - na - - na - -
23-Oct-17 634 -1 -0.2% na - - na - - na - -
13-Nov-17 626 -8 -1.3% na - - na - - na - -
27-Nov-17 632 6 1.0% na - - na - - na - -
11-Dec-17 628 -4 -0.6% na - - na - - na - -
25-Dec-17 634 6 1.0% na - - na - - na - -
08-Jan-18 648 14 2.2% na - - na - - na - -
22-Jan-18 667 19 2.9% na - - na - - na - -
12-Feb-18 688 21 3.1% na - - na - - na - -
26-Feb-18 702 14 2.0% na - - na - - na - -
12-Mar-18 701 -1 -0.2% na - - na - - na - -
26-Mar-18 701 0 0.0% na - - na - - na - -
09-Apr-18 694 -7 -1.0% na - - na - - na - -
23-Apr-18 680 -14 -2.0% na - - na - - na - -
14-May-18 671 -9 -1.3% na - - na - - na - -
28-May-18 657 -14 -2.1% na - - na - - na - -
11-Jun-18 644 -13 -2.0% na - - na - - na - -
25-Jun-18 649 5 0.8% na - - na - - na - -
09-Jul-18 634 -15 -2.3% na - - na - - na - -
23-Jul-18 637 3 0.5% na - - na - - na - -
13-Aug-18 649 12 1.9% na - - na - - na - -
27-Aug-18 654 5 0.8% na - - na - - na - -
10-Sep-18 636 -18 -2.8% na - - na - - na - -
24-Sep-18 644 8 1.3% na - - na - - na - -
08-Oct-18 622 -22 -3.4% na - - na - - na - -
22-Oct-18 620 -2 -0.3% na - - na - - na - -
12-Nov-18 610 -10 -1.6% na - - na - - na - -
26-Nov-18 601 -9 -1.5% na - - na - - na - -
10-Dec-18 574 -27 -4.6% na - - na - - na - -
24-Dec-18 575 1 0.2% na - - na - - na - -
14-Jan-19 573 -2 -0.3% na - - na - - na - -
28-Jan-19 548 -25 -4.4% na - - na - - na - -
11-Feb-19 561 13 2.4% na - - na - - na - -
Notes:
Prices released on Wednesdays following the 2nd and 4th Mondays of the month at 9:00 AM to Price
Assessment Providers. If a price is not indicated, fewer than ten (10) price inputs were received at that time.
The first price release was for May 8, 2006 for data go to steelbenchmarker.com/files/history2.pdf.
For product specifications refer to last page, or go to steelbenchmarker.com/specifications.
Ex-works
Western Europe

13
Euros per Metric Tonne Dollars per Metric Tonne
--------Rebar--------- ---------HRB-------- ---------CRC--------- ---------Plate--------- --------Rebar---------
Euro Euro Pct Euro Pct Euro Pct Euro Pct
($/Euro) Price Chng Chng Price Chng Chng Price Chng Chng Price Chng Chng
25-Sep-17 1.185 541 e 3 0.6% na - - na - - na - -
09-Oct-17 1.176 540 e -1 -0.2% na - - na - - na - -
23-Oct-17 1.176 539 e -1 -0.2% na - - na - - na - -
13-Nov-17 1.168 536 e -3 -0.6% na - - na - - na - -
27-Nov-17 1.190 531 e -5 -0.9% na - - na - - na - -
11-Dec-17 1.178 533 e 2 0.4% na - - na - - na - -
25-Dec-17 1.187 534 e 1 0.2% na - - na - - na - -
08-Jan-18 1.193 543 9 1.7% na - - na - - na - -
22-Jan-18 1.226 544 1 0.2% na - - na - - na - -
12-Feb-18 1.235 557 13 2.4% na - - na - - na - -
26-Feb-18 1.231 570 13 2.4% na - - na - - na - -
12-Mar-18 1.238 566 -4 -0.7% na - - na - - na - -
26-Mar-18 1.239 566 0 -0.1% na - - na - - na - -
09-Apr-18 1.236 561 -4 -0.8% na - - na - - na - -
23-Apr-18 1.223 556 -5 -1.0% na - - na - - na - -
14-May-18 1.190 564 8 1.4% na - - na - - na - -
28-May-18 1.157 568 4 0.7% na - - na - - na - -
11-Jun-18 1.179 546 -22 -3.8% na - - na - - na - -
25-Jun-18 1.167 556 10 1.8% na - - na - - na - -
09-Jul-18 1.172 541 -15 -2.7% na - - na - - na - -
23-Jul-18 1.171 544 3 0.6% na - - na - - na - -
13-Aug-18 1.143 568 24 4.4% na - - na - - na - -
27-Aug-18 1.172 558 -10 -1.7% na - - na - - na - -
10-Sep-18 1.159 549 -9 -1.7% na - - na - - na - -
24-Sep-18 1.179 546 -2 -0.4% na - - na - - na - -
08-Oct-18 1.150 541 e -5 -1.0% na - - na - - na - -
22-Oct-18 1.148 540 -1 -0.1% na - - na - - na - -
12-Nov-18 1.128 541 1 0.1% na - - na - - na - -
26-Nov-18 1.134 530 -11 -2.0% na - - na - - na - -
10-Dec-18 1.138 504 -26 -4.9% na - - na - - na - -
24-Dec-18 1.138 505 1 0.2% na - - na - - na - -
14-Jan-19 1.147 499 -5 -1% na - - na - - na - -
28-Jan-19 1.143 479 -20 -4% na - - na - - na - -
11-Feb-19 1.133 495 16 3% na - - na - - na - -
Notes:
Prices released on Wednesdays following the 2nd and 4th Mondays of the month at 9:00 AM to Price
Assessment Providers. If a price is not indicated, fewer than ten (10) price inputs were received at that time.
The first price release was for May 8, 2006 for data go to steelbenchmarker.com/files/history2.pdf.
For product specifications refer to last page, or go to steelbenchmarker.com/specifications.
Western EuropeEx-works

14
Dollars per Metric Tonne
--------Rebar--------- ---------HRB-------- ---------CRC--------- ---------Plate--------- --------Rebar---------
Dlr Pct Dlr Pct Dlr Pct Dlr Pct
Price Chng Chng Price Chng Chng Price Chng Chng Price Chng Chng
25-Sep-17 577 16 2.9% 643 1 0.2% na - - na - -
09-Oct-17 574 -3 -0.5% 634 -9 -1.4% na - - na - -
23-Oct-17 570 -4 -0.7% 634 0 0.0% na - - na - -
13-Nov-17 561 -9 -1.6% 621 -13 -2.1% na - - na - -
27-Nov-17 566 5 0.9% 621 0 0.0% na - - na - -
11-Dec-17 564 -2 -0.4% 627 6 1.0% na - - na - -
25-Dec-17 578 14 2.5% na - - na - - na - -
08-Jan-18 578 0 0.0% 628 - - na - - na - -
22-Jan-18 586 8 1.4% 633 5 0.8% na - - na - -
12-Feb-18 595 9 1.5% 657 24 3.8% na - - na - -
26-Feb-18 617 22 3.7% 704 47 7.2% na - - na - -
12-Mar-18 630 13 2.1% 705 1 0.1% na - - na - -
26-Mar-18 637 7 1.1% 679 -26 -3.7% na - - na - -
09-Apr-18 617 -20 -3.1% 684 5 0.7% na - - na - -
23-Apr-18 617 0 0.0% 672 -12 -1.8% na - - na - -
14-May-18 612 -5 -0.8% 671 -1 -0.1% na - - na - -
28-May-18 602 -10 -1.6% 668 -3 -0.4% na - - na - -
11-Jun-18 599 -3 -0.5% na - - na - - na - -
25-Jun-18 601 2 0.3% 681 - - na - - na - -
09-Jul-18 593 -8 -1.3% na - - na - - na - -
23-Jul-18 593 0 0.0% na - - na - - na - -
13-Aug-18 588 -5 -0.8% 676 - - na - - na - -
27-Aug-18 594 6 1.1% na - - na - - na - -
10-Sep-18 588 -6 -1.1% 662 - - na - - na - -
24-Sep-18 586 -2 -0.3% 661 -1 -0.2% na - - na - -
08-Oct-18 579 -7 -1.2% na - - na - - na - -
22-Oct-18 577 -2 -0.3% na - - na - - na - -
12-Nov-18 550 -27 -4.7% na - - na - - na - -
26-Nov-18 533 -17 -3.1% na - - na - - na - -
10-Dec-18 512 -21 -3.9% na - - na - - na - -
24-Dec-18 488 -24 -4.7% na - - na - - na - -
14-Jan-19 503 15 3.1% na - - na - - na - -
28-Jan-19 498 -5 -1.0% na - - na - - na - -
11-Feb-19 515 17 3.4% na - - na - - na - -
Notes:
Prices released on Wednesdays following the 2nd and 4th Mondays of the month at 9:00 AM to Price
Assessment Providers. If a price is not indicated, fewer than ten (10) price inputs were received at that time.
The first price release was for April 10, 2006 for data go to steelbenchmarker.com/files/history2.pdf.
For product specifications refer to last page, or go to steelbenchmarker.com/specifications.
FOB the Port of Export
World Export Price

15
Spot Market New Booking Prices for Near-Term Delivery
Commodity-grade product to mid-sized buyers
(Dollars per Metric Tonne, 500 to 2,000 tonnes transaction size)
USA Market
East of the Mississippi
Western Europe Market
Germany/France
FOB mill Ex-works
Hot-rolled band * Hot-rolled band *
(0.2" thick x 48-60" wide) (5mm thick x 1200-1500mm wide)
Cold-rolled coil * Cold-rolled coil *
(0.03" x 48-60" wide) (0.7mm x 1200-1500mm wide)
Rebar #5 * Rebar #5 *
(5/8" in diameter) (16mm in diameter)
Standard plate * Standard plate *
(1" x 96" x 240") (24mm x 2400mm x 6000mm)
Steel scrap **
#1 Heavy melting
Shredded - all but West Coast
#1 Busheling
Chinese Market
Home Market
World Export Market
Atlantic and Pacific Basin
Ex-works FOB port of export
Hot-rolled band * Hot-rolled band ***
(5mm thick x 1200-1500mm wide) (5mm thick x 1200-1500mm wide)
Cold-rolled coil * Cold-rolled coil ***
(0.7mm x 1200-1500mm wide) (0.7mm x 1200-1500mm wide)
Rebar #5 * Rebar #5 ***
(16mm in diameter) (16mm in diameter)
Standard plate * Standard plate ***
(24mm x 2400mm x 6000mm) (24mm x 2400mm x 6000mm)
Note: Near-term delivery is normally two to six weeks.
Hot-rolled band is the first product off the hot strip mill with: (1) a thickness of about 0.20 inch
(but no less than 0.10 inch or more than 0.50 inch); (2) a coil size of 10 to 20 tons;
(3) a width of 48 to 60 inches; and (4) a carbon component of 0.08% to 0.13%.
SteelHome's average price for each product is the determinant of the Chinese ex-works benchmark price.
It is published for comparative purposes.
* Ex-works (the same as FOB mill).
** Steel scrap delivered to steel plant on a near-term basis, normally from two days to a month.
#1 heavy melting – demolition scrap that is at least ¼” thick and surface dimension no larger than
60 by 24 inches. This grade does not includethe heavy “p & s” (plate and structural ) category that
includes the very thick scrap items.
Shredded – largely old cars and some appliances – for all but the West Coast (California, Oregon and Washington).
Shredded scrap is homogeneous iron and steel scrap magnetically separated, no. 1, no. 2 steel, miscellaneous
bailing and sheet scrap with an average weight from 50 to 70 pounds per square foot.
#1 busheling – new sheet steel scrap.
*** FOB port of export