Embed Size (px)
Citation preview

Price forecast Oil, gas & chemicals September 30, 2020

This page has been intentionally left blank.
2

11
Forecast commentary ............................................................ 2
The oil and gas sector in the wake of COVID-19: perspectives from Latin America ..........................................8
Canadian domestic price forecast ........................................10
International price forecast ................................................... 12
Global trends ................................................................. ..........13
Canadian domestic price tables ............................................15
International price tables ....................................................... 18
Price philosophy ...................................................................... 20

2
Price forecast | Forecast commentary
Oil prices rallied over the summer months as consumer demand began to rebound amid continued supply cuts, resulting in global storage-level reductions from their highs in the second quarter.
Forecast commentary Uncertainty of a second wave looms over oil prices In Q3, many regions were reducing lockdown restrictions and attempting to restart economies. This led to steady oil-price recovery over the summer months thanks to rebounding demand. With virus resurgence looming for the fall, the economic recovery is difficult to predict. You can read about Deloitte’s view on economic recovery in our recently published September Economic Outlook. Predicting the future has always been difficult, but the current disruption to the energy sector has made it even harder. Scenario analysis has never been more important to help companies adapt and make decisions about investment.
Globally, the oil and gas industry is facing two concurrent crises: COVID-19 and the oil-price collapse. For Canada, however, the industry has the additional challenges of market access and stakeholder resistance. Deloitte recently
released a scenario analysis of how the Canadian oil and gas industry may evolve over the next 10 to 15 years. Valuation scenario planning provides possible future scenarios and describes the implications for strategic and operational choices in an environment of increased uncertainty, and identifies short- and long-term decisions to help companies rethink how to compete and thrive in these environments. Within this study, Deloitte focuses on the pace of the erosion of oil and gas demand as well as the competitiveness of the Canadian sector among international players. The publication details the ways in which rapid erosion of demand will require agility from Canadian producers, whereas slower erosion of demand will allow more time for companies to determine development initiatives. For more information, read Deloitte’s Navigating uncertainty: Scenarios for Canadian oil and gas leaders.
As mentioned, oil prices rallied over the summer months as consumer demand began to rebound amid continued supply cuts, resulting in global storage-level reductions from their highs in the second quarter. North American crude oil prices showed promising growth over the past three months, with WTI reaching over US$42/bbl in August 2020. This is a US$25/bbl increase from April pandemic prices. In an effort to stabilize prices, the OPEC+ meeting in August resulted in extended production cuts until the end of 2020, but reduced these cuts from 9.7 MMbbl/d to 7.7 MMbbl/d for the remainder of the year. The International Energy Agency’s (IEA) August forecast suggests slightly slower demand recovery than its previous forecasts, primarily due to the struggling aviation sector, supporting the continued need for crude oil supply cuts. The U.S. Energy Information Administration (EIA) predicts a balance in global supply and demand will be reached by Q2 2021, but as nations continue to combat the pandemic, demand forecasts remain
volatile and the risk of oversupply continues to loom over the industry. A lingering concern in Q3 2020 during the stabilized oil-price environment has been the recurrence of significant oversupply as producers begin bringing their curtailed production back on-stream in response to more favourable pricing. Sustaining rising production levels will rely on near-term market demand growth. However, fears about virus resurgence have pulled WTI prices below US$40/bbl and halted the steady growth that had been encouraging producers to restart wells.
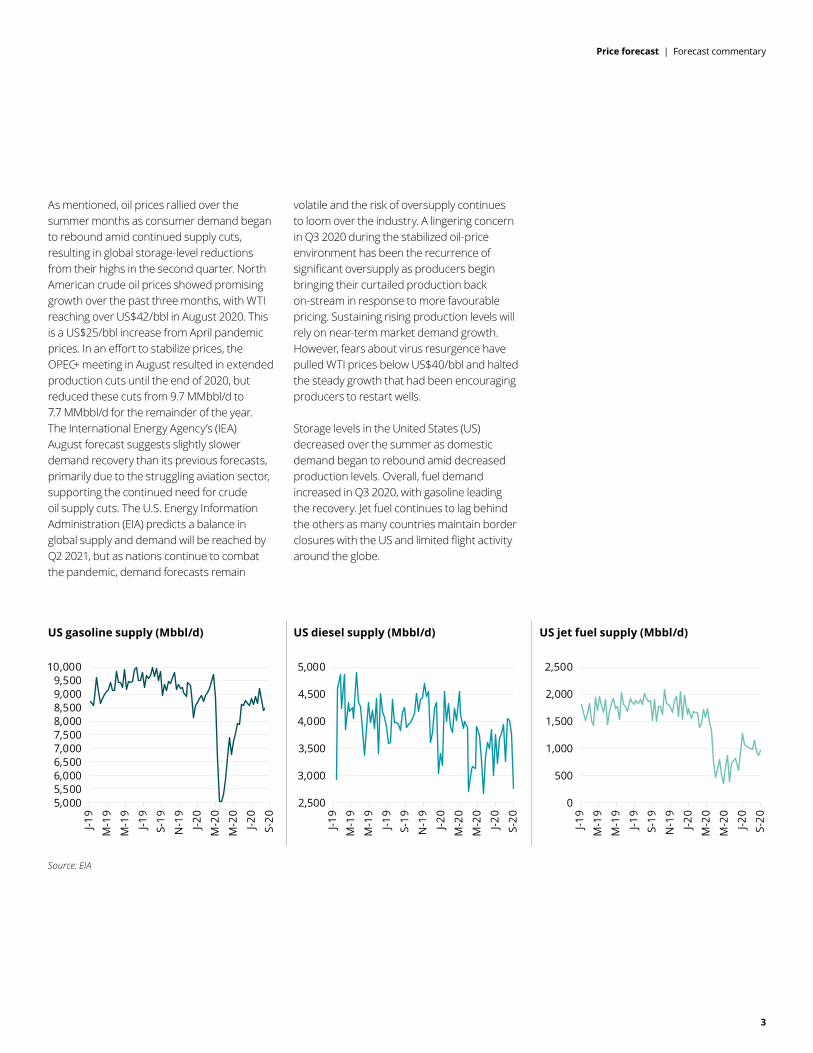
Storage levels in the United States (US) decreased over the summer as domestic demand began to rebound amid decreased production levels. Overall, fuel demand increased in Q3 2020, with gasoline leading the recovery. Jet fuel continues to lag behind the others as many countries maintain border closures with the US and limited flight activity around the globe.
US gasoline supply (Mbbl/d) US diesel supply (Mbbl/d) US jet fuel supply (Mbbl/d)
Source: EIA
3
Price forecast | Forecast commentary
5,0005,5006,0006,5007,0007,5008,0008,5009,0009,500
10,000
J-19
M-1
9
M-1
9
J-19
S-19
N-1
9
J-20
M-2
0
M-2
0
J-20
S-20
2,500
3,000
3,500
4,000
4,500
5,000
J-19
M-1
9
M-1
9
J-19
S-19
N-1
9
J-20
M-2
0
M-2
0
J-20
S-20
0
500
1,000
1,500
2,000
2,500
J-19
M-1
9
M-1
9
J-19
S-19
N-1
9
J-20
M-2
0
M-2
0
J-20
S-20
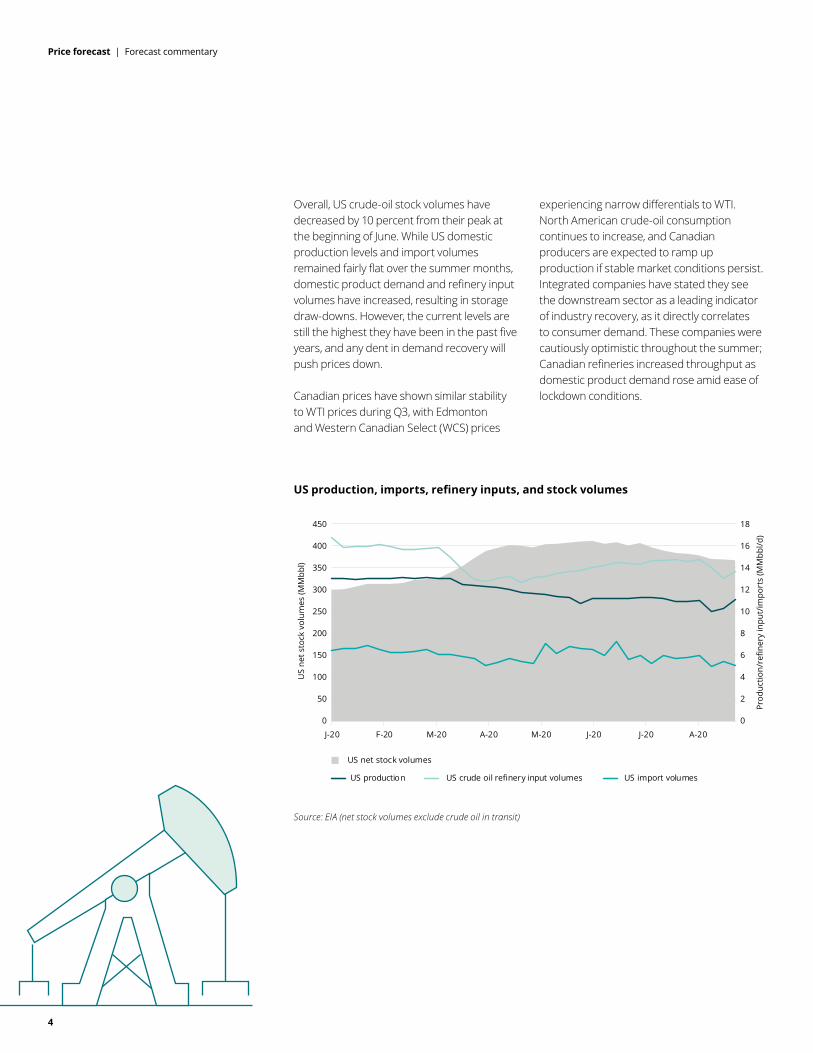
Overall, US crude-oil stock volumes have decreased by 10 percent from their peak at the beginning of June. While US domestic production levels and import volumes remained fairly flat over the summer months, domestic product demand and refinery input volumes have increased, resulting in storage draw-downs. However, the current levels are still the highest they have been in the past five years, and any dent in demand recovery will push prices down.
Canadian prices have shown similar stability to WTI prices during Q3, with Edmonton and Western Canadian Select (WCS) prices
experiencing narrow differentials to WTI. North American crude-oil consumption continues to increase, and Canadian producers are expected to ramp up production if stable market conditions persist. Integrated companies have stated they see the downstream sector as a leading indicator of industry recovery, as it directly correlates to consumer demand. These companies were cautiously optimistic throughout the summer; Canadian refineries increased throughput as domestic product demand rose amid ease of lockdown conditions.
US production, imports, refinery inputs, and stock volumes
Source: EIA (net stock volumes exclude crude oil in transit)
4
Price forecast | Forecast commentary
US
net s
tock
vol
umes
(MM
bbl)
0
50
100
150
200
250
300
350
450
400
0
2
4
6
8
10
12
14
18
16
Pro
duct
ion/
refin
ery
inpu
t/im
port
s (M
Mbb
l/d)
US net stock volumes
US production US crude oil refinery input volumes US import volumes
J-20 F-20 M-20 A-20 M-20 J-20 J-20 A-20
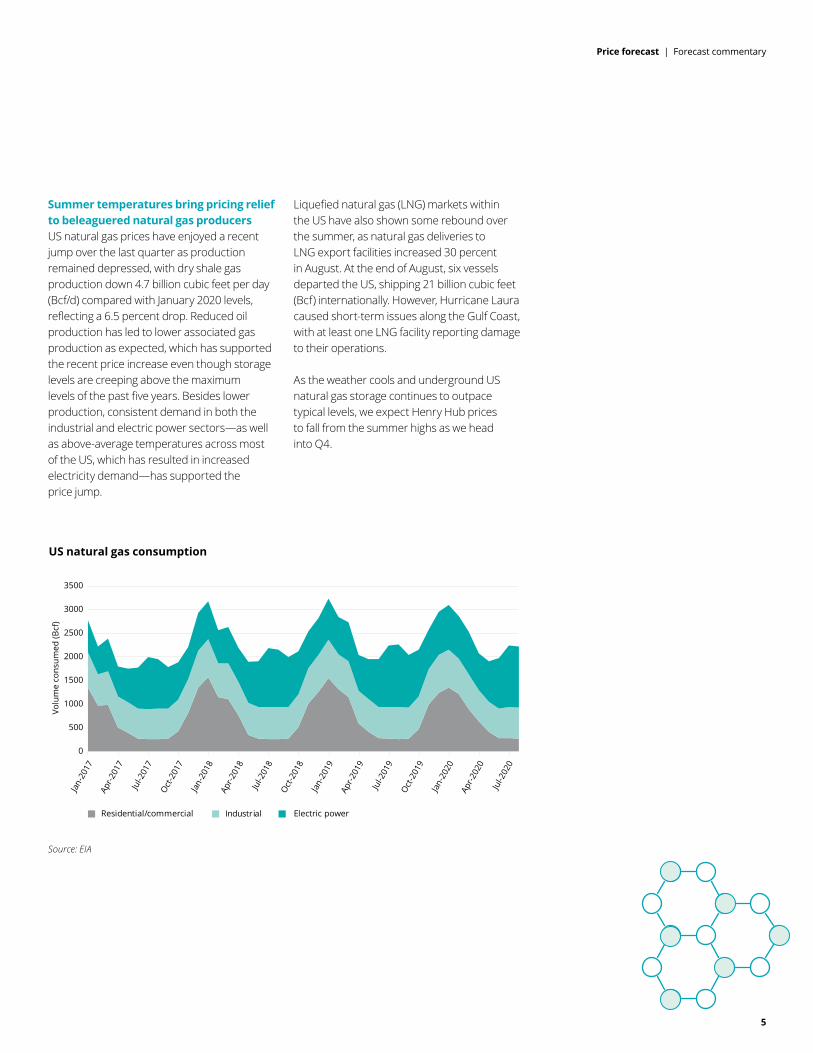
Summer temperatures bring pricing relief to beleaguered natural gas producers US natural gas prices have enjoyed a recent jump over the last quarter as production remained depressed, with dry shale gas production down 4.7 billion cubic feet per day (Bcf/d) compared with January 2020 levels, reflecting a 6.5 percent drop. Reduced oil production has led to lower associated gas production as expected, which has supported the recent price increase even though storage levels are creeping above the maximum levels of the past five years. Besides lower production, consistent demand in both the industrial and electric power sectors—as well as above-average temperatures across most of the US, which has resulted in increased electricity demand—has supported the price jump.
Liquefied natural gas (LNG) markets within the US have also shown some rebound over the summer, as natural gas deliveries to LNG export facilities increased 30 percent in August. At the end of August, six vessels departed the US, shipping 21 billion cubic feet (Bcf) internationally. However, Hurricane Laura caused short-term issues along the Gulf Coast, with at least one LNG facility reporting damage to their operations.
As the weather cools and underground US natural gas storage continues to outpace typical levels, we expect Henry Hub prices to fall from the summer highs as we head into Q4.
US natural gas consumption
Source: EIA
5
Price forecast | Forecast commentaryVo
lum
e co
nsum
ed (B
cf)
0
500
1500
2000
2500
3500
Jan-
2017
3000
1000
Apr-2
017
Jul-2
017
Oct
-201
7
Jan-
2018
Apr-2
018
Jul-2
018
Oct
-201
8
Jan-
2019
Apr-2
019
Jul-2
019
Jan-
2020
Apr-2
020
Jul-2
020
Oct
-201
9
Residential/commercial Electric powerIndustrial
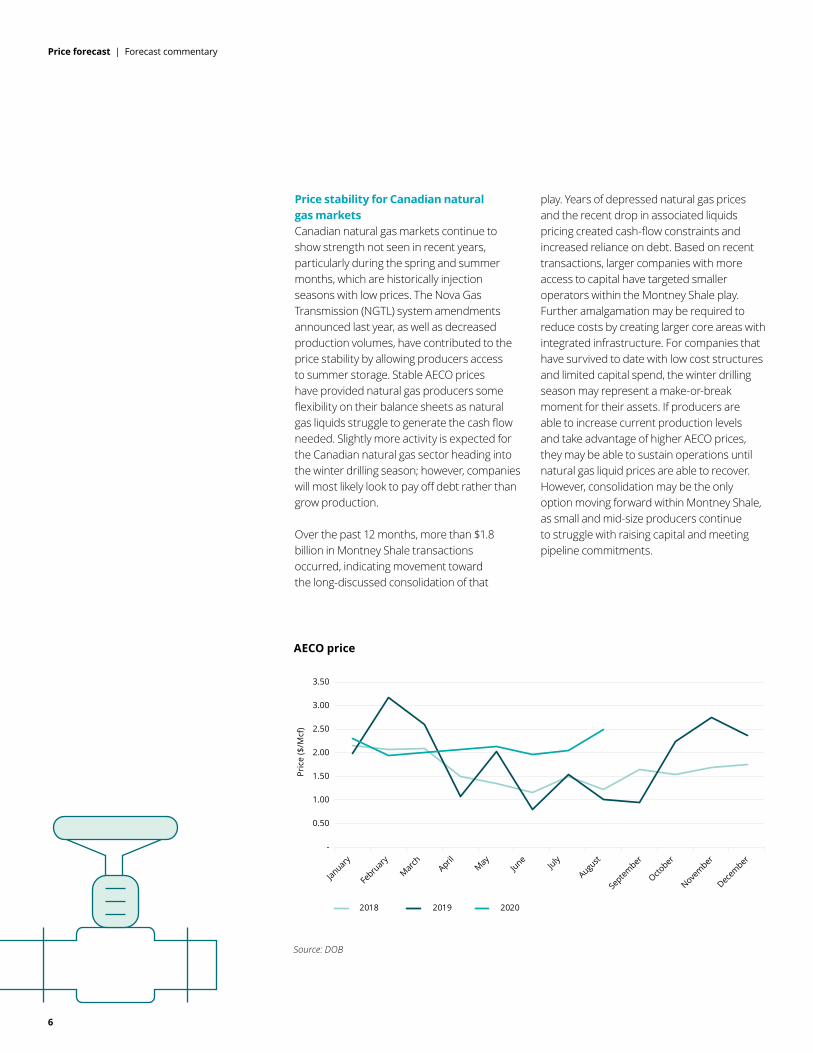
Price stability for Canadian natural gas markets Canadian natural gas markets continue to show strength not seen in recent years, particularly during the spring and summer months, which are historically injection seasons with low prices. The Nova Gas Transmission (NGTL) system amendments announced last year, as well as decreased production volumes, have contributed to the price stability by allowing producers access to summer storage. Stable AECO prices have provided natural gas producers some flexibility on their balance sheets as natural gas liquids struggle to generate the cash flow needed. Slightly more activity is expected for the Canadian natural gas sector heading into the winter drilling season; however, companies will most likely look to pay off debt rather than grow production.
Over the past 12 months, more than $1.8 billion in Montney Shale transactions occurred, indicating movement toward the long-discussed consolidation of that
play. Years of depressed natural gas prices and the recent drop in associated liquids pricing created cash-flow constraints and increased reliance on debt. Based on recent transactions, larger companies with more access to capital have targeted smaller operators within the Montney Shale play. Further amalgamation may be required to reduce costs by creating larger core areas with integrated infrastructure. For companies that have survived to date with low cost structures and limited capital spend, the winter drilling season may represent a make-or-break moment for their assets. If producers are able to increase current production levels and take advantage of higher AECO prices, they may be able to sustain operations until natural gas liquid prices are able to recover. However, consolidation may be the only option moving forward within Montney Shale, as small and mid-size producers continue to struggle with raising capital and meeting pipeline commitments.
AECO price
Source: DOB
6
Price forecast | Forecast commentary
Pric
e ($
/Mcf
)
-
0.50
1.50
2.00
2.50
3.50
3.00
1.00
Januar
y
Febru
ary
March
AprilMay
JuneJuly
August
Septem
ber
October
November
Decem
ber
2018 2019 2020
7
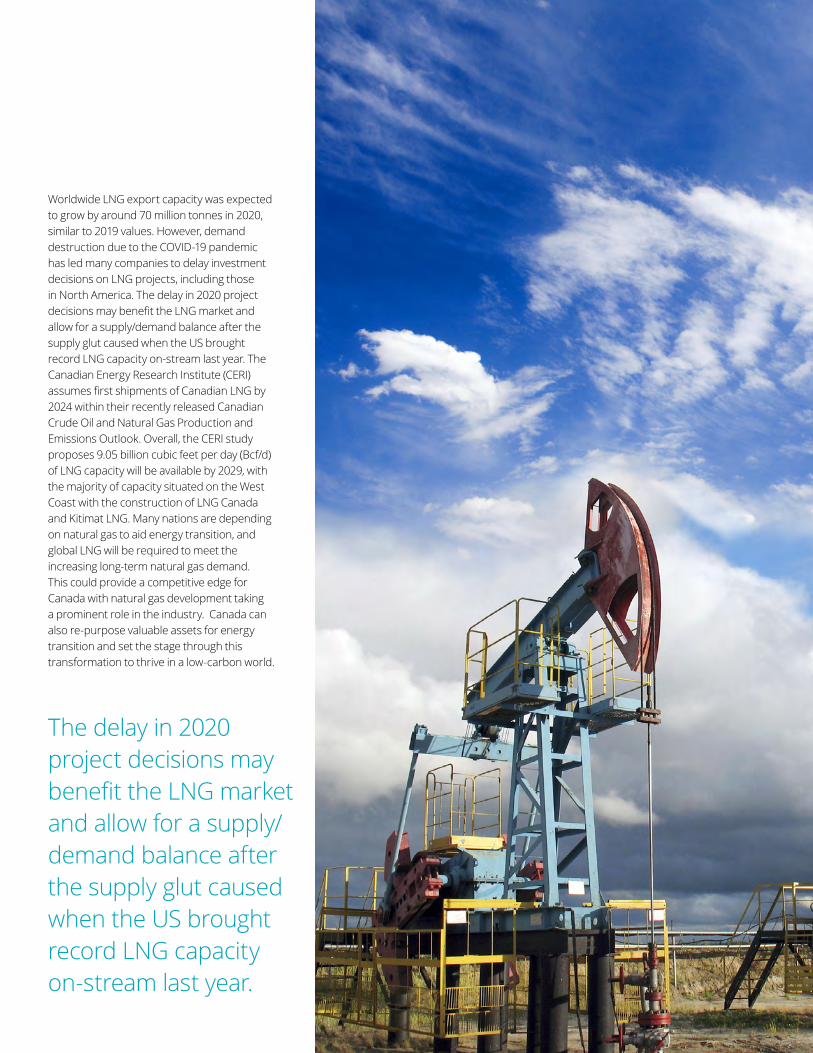
The delay in 2020 project decisions may benefit the LNG market and allow for a supply/demand balance after the supply glut caused when the US broughtrecord LNG capacity on-stream last year.
Worldwide LNG export capacity was expected to grow by around 70 million tonnes in 2020, similar to 2019 values. However, demand destruction due to the COVID-19 pandemic has led many companies to delay investment decisions on LNG projects, including those in North America. The delay in 2020 project decisions may benefit the LNG market and allow for a supply/demand balance after the supply glut caused when the US brought record LNG capacity on-stream last year. The Canadian Energy Research Institute (CERI) assumes first shipments of Canadian LNG by 2024 within their recently released Canadian Crude Oil and Natural Gas Production and Emissions Outlook. Overall, the CERI study proposes 9.05 billion cubic feet per day (Bcf/d) of LNG capacity will be available by 2029, with the majority of capacity situated on the West Coast with the construction of LNG Canada and Kitimat LNG. Many nations are depending on natural gas to aid energy transition, and global LNG will be required to meet the increasing long-term natural gas demand. This could provide a competitive edge for Canada with natural gas development taking a prominent role in the industry. Canada can also re-purpose valuable assets for energy transition and set the stage through this transformation to thrive in a low-carbon world.
8
Price forecast | The oil and gas sector in the wake of COVID-19: Perspectives from Latin America
The oil and gas sector in the wake of COVID-19: Perspectives from Latin America In the wake of COVID-19, with nations around the world locking down to protect their citizens, decreased consumer activity meant that the oil and gas sector was especially hard hit. This spotlight focuses on Latin America, looking at some of the challenges faced in Argentina, Mexico, Colombia, and Peru, as well as the opportunities for growth as economies resume working and production and operations ramp up.
Challenging conditions for investment As a result of lockdowns, Latin American nations experienced, as did other nations around the world, decreased economic activity and falling commodity prices, significantly impacting oil and gas revenues. Governments are facing rising national deficits exacerbated by the decrease in resource revenues. For Pemex, Mexico’s national oil company, the impact of the pandemic has been significant: from April to June 2020, revenues decreased by almost 52 percent, as compared to the same period in 2019,1 and oil production plunged to around 1.5 million barrels a day (MMbbl/d) in July .2
1 Pemex, Reporte de resultados no dictaminados, https://www.pemex.com/ri/finanzas/Paginas/resultados.aspx, September 17, 2020. 2 Gobierno de México, Produccion por operador https://sih.hidrocarburos.gob.mx/, September 17, 2020.
In response to these impacts, governments may look at other options to increase revenues, such as selling off parts of their ownership stakes in the national oil companies or creating incentives to attract
private investment. However, several of these nations also have high-risk profiles due to challenging regulatory regimes and bureaucracy, and this contributes to challenges accessing capital and enticing foreign investment. This will have an impact on future production and industry growth in the region: in Colombia, for example, oil and gas reserves remain stagnant, with limited reserve life remaining for existing development. Some efforts have been made to fill the production gap by fracking unconventional resources, with pilot investments recently approved, but environmental concerns still exist.
Similar to Canada, Latin America also faces challenges getting oil and gas resources to market. Investment in infrastructure is especially needed. Oil and gas fields in Peru can be difficult to access due to a lack of roads, rivers that are not easily navigated, and fields located in jungle regions that are protected due to environmental concerns. As well, there can be difficulties pushing relevant infrastructure projects due to corruption concerns, such as the construction of a gas pipeline in south Peru.3 In Mexico, infrastructure projects intended to expand the nation’s storage capacity of gasoline and diesel have collapsed, and the companies involved are looking to shed their infrastructure investments.
3 TeleSur, “Peru: Ollanta Humala accused of corruption linked to Odebrecht,” September 1, 2020.
9
Price forecast | The oil and gas sector in the wake of COVID-19: Perspectives from Latin America`
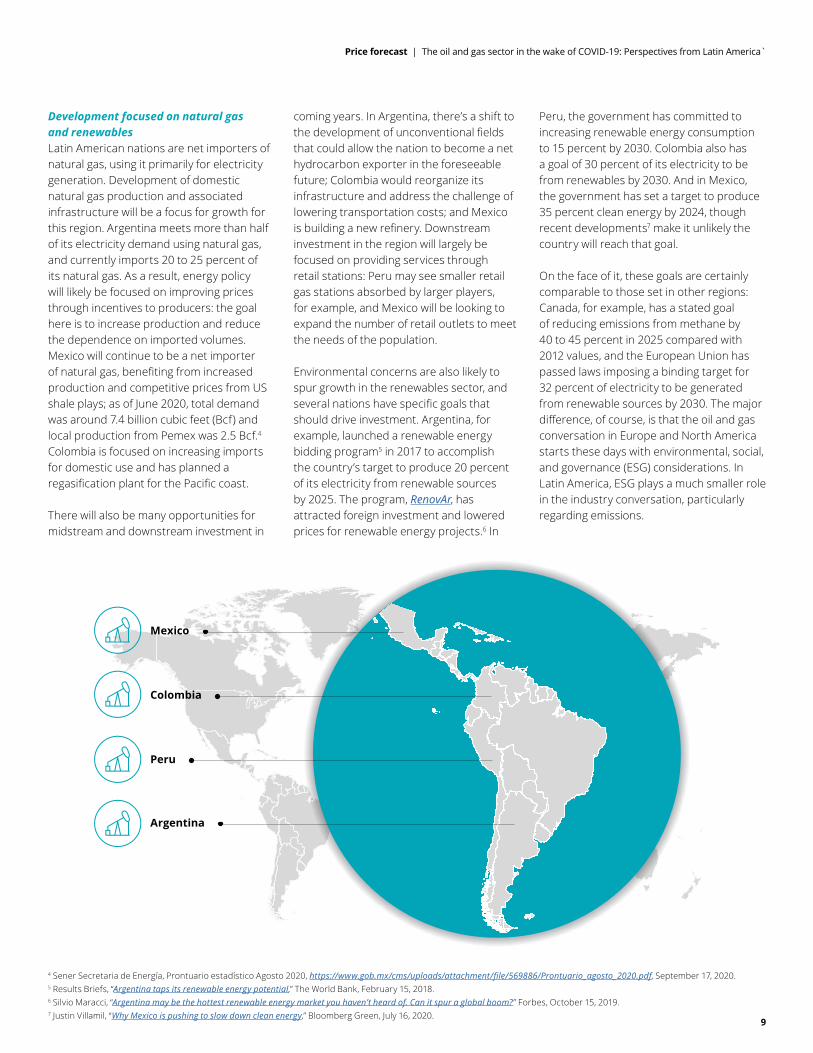
Mexico
Peru
Colombia
Argentina
Development focused on natural gas and renewables Latin American nations are net importers of natural gas, using it primarily for electricity generation. Development of domestic natural gas production and associated infrastructure will be a focus for growth for this region. Argentina meets more than half of its electricity demand using natural gas, and currently imports 20 to 25 percent of its natural gas. As a result, energy policy will likely be focused on improving prices through incentives to producers: the goal here is to increase production and reduce the dependence on imported volumes. Mexico will continue to be a net importer of natural gas, benefiting from increased production and competitive prices from US shale plays; as of June 2020, total demand was around 7.4 billion cubic feet (Bcf) and local production from Pemex was 2.5 Bcf.4 Colombia is focused on increasing imports for domestic use and has planned a regasification plant for the Pacific coast.
4 Sener Secretaria de Energía, Prontuario estadístico Agosto 2020, https://www.gob.mx/cms/uploads/attachment/file/569886/Prontuario_agosto_2020.pdf, September 17, 2020.
There will also be many opportunities for midstream and downstream investment in
coming years. In Argentina, there’s a shift to the development of unconventional fields that could allow the nation to become a net hydrocarbon exporter in the foreseeable future; Colombia would reorganize its infrastructure and address the challenge of lowering transportation costs; and Mexico is building a new refinery. Downstream investment in the region will largely be focused on providing services through retail stations: Peru may see smaller retail gas stations absorbed by larger players, for example, and Mexico will be looking to expand the number of retail outlets to meet the needs of the population.
Environmental concerns are also likely to spur growth in the renewables sector, and several nations have specific goals that should drive investment. Argentina, for example, launched a renewable energy bidding program5 in 2017 to accomplish the country’s target to produce 20 percent of its electricity from renewable sources by 2025. The program, RenovAr, has attracted foreign investment and lowered prices for renewable energy projects.6 In
Peru, the government has committed to increasing renewable energy consumption to 15 percent by 2030. Colombia also has a goal of 30 percent of its electricity to be from renewables by 2030. And in Mexico, the government has set a target to produce 35 percent clean energy by 2024, though recent developments7 make it unlikely the country will reach that goal.
5 Results Briefs, “Argentina taps its renewable energy potential,” The World Bank, February 15, 2018. 6 Silvio Maracci, “Argentina may be the hottest renewable energy market you haven’t heard of. Can it spur a global boom?” Forbes, October 15, 2019. 7 Justin Villamil, “Why Mexico is pushing to slow down clean energy,” Bloomberg Green, July 16, 2020.
On the face of it, these goals are certainly comparable to those set in other regions: Canada, for example, has a stated goal of reducing emissions from methane by 40 to 45 percent in 2025 compared with 2012 values, and the European Union has passed laws imposing a binding target for 32 percent of electricity to be generated from renewable sources by 2030. The major difference, of course, is that the oil and gas conversation in Europe and North America starts these days with environmental, social, and governance (ESG) considerations. In Latin America, ESG plays a much smaller role in the industry conversation, particularly regarding emissions.
10
Price forecast | Canadian domestic price forecast
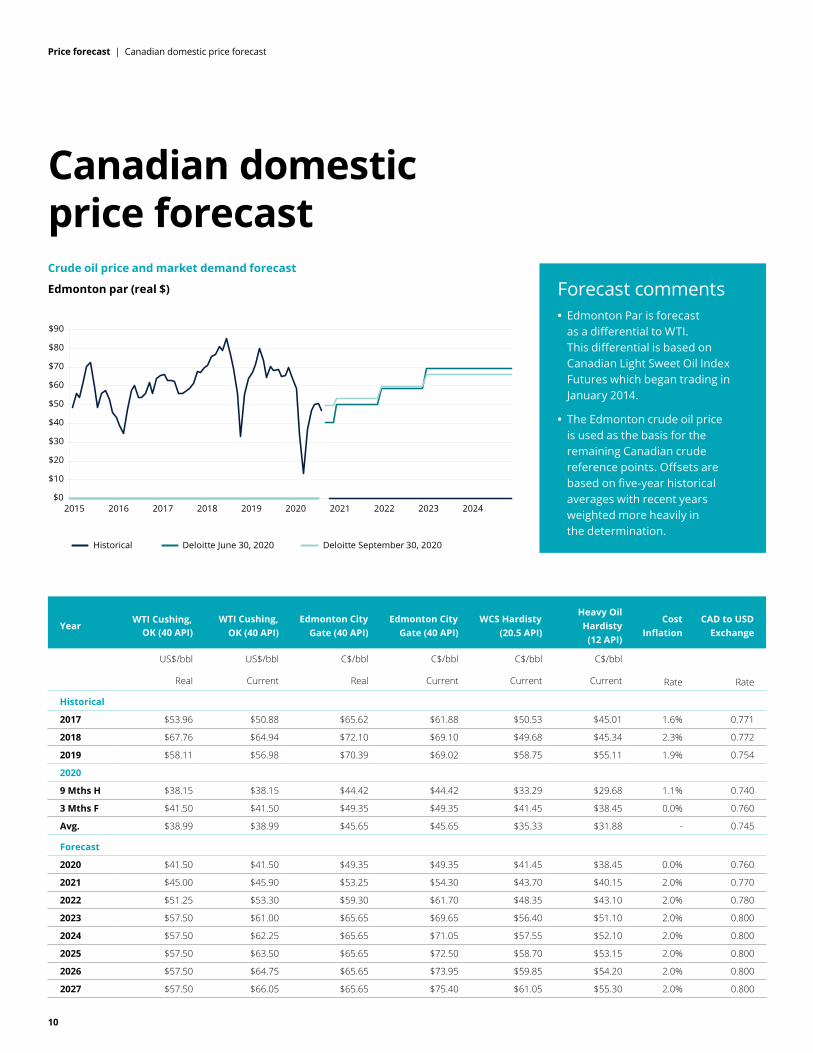
Canadian domestic price forecast Crude oil price and market demand forecast
Edmonton par (real $) Forecast comments • Edmonton Par is forecast
as a differential to WTI. This differential is based on Canadian Light Sweet Oil Index Futures which began trading in January 2014.
• The Edmonton crude oil price is used as the basis for the remaining Canadian crude reference points. Offsets are based on five-year historical averages with recent years weighted more heavily in the determination.
Year WTI Cushing,
OK (40 API) WTI Cushing,
OK (40 API) Edmonton City
Gate (40 API) Edmonton City
Gate (40 API) WCS Hardisty
(20.5 API)
Heavy Oil Hardisty
(12 API)
Cost Inflation
CAD to USD Exchange
US$/bbl
Real
US$/bbl
Current
C$/bbl
Real
C$/bbl
Current
C$/bbl
Current
C$/bbl
Current Rate Rate
Historical
2017 $53.96 $50.88 $65.62 $61.88 $50.53 $45.01 1.6% 0.771
2018 $67.76 $64.94 $72.10 $69.10 $49.68 $45.34 2.3% 0.772
2019 $58.11 $56.98 $70.39 $69.02 $58.75 $55.11 1.9% 0.754
2020
9 Mths H $38.15 $38.15 $44.42 $44.42 $33.29 $29.68 1.1% 0.740
3 Mths F $41.50 $41.50 $49.35 $49.35 $41.45 $38.45 0.0% 0.760
Avg. $38.99 $38.99 $45.65 $45.65 $35.33 $31.88 - 0.745
Forecast
2020 $41.50 $41.50 $49.35 $49.35 $41.45 $38.45 0.0% 0.760
2021 $45.00 $45.90 $53.25 $54.30 $43.70 $40.15 2.0% 0.770
2022 $51.25 $53.30 $59.30 $61.70 $48.35 $43.10 2.0% 0.780
2023 $57.50 $61.00 $65.65 $69.65 $56.40 $51.10 2.0% 0.800
2024 $57.50 $62.25 $65.65 $71.05 $57.55 $52.10 2.0% 0.800
2025 $57.50 $63.50 $65.65 $72.50 $58.70 $53.15 2.0% 0.800
2026 $57.50 $64.75 $65.65 $73.95 $59.85 $54.20 2.0% 0.800
2027 $57.50 $66.05 $65.65 $75.40 $61.05 $55.30 2.0% 0.800
$0
$10
$20
$30
$40
$50
$60
$70
$80
$90
2015 2016 2017 2018 2019 2020 2021 2022 2023 2024
Historical Deloitte June 30, 2020 Deloitte September 30, 2020
11
Price forecast | Canadian domestic price forecast
•
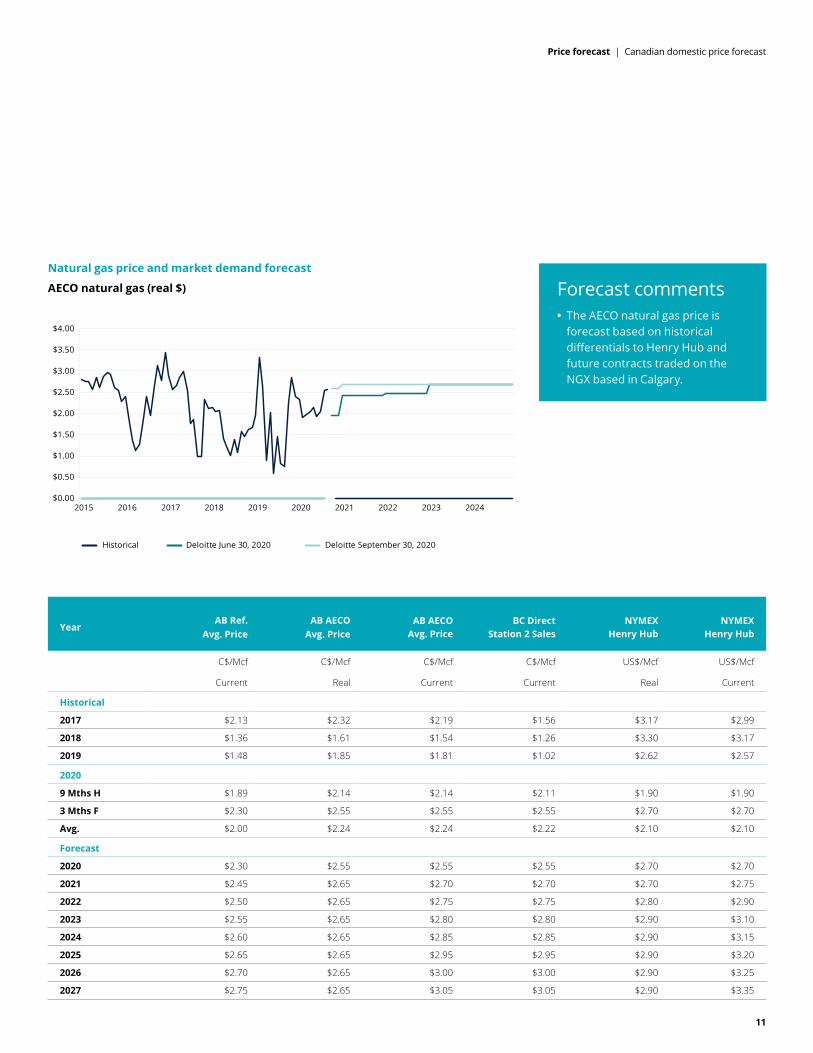
Natural gas price and market demand forecast
AECO natural gas (real $) Forecast comments The AECO natural gas price is forecast based on historical differentials to Henry Hub and future contracts traded on the NGX based in Calgary.
Year AB Ref.
Avg. Price AB AECO
Avg. Price AB AECO
Avg. Price BC Direct
Station 2 Sales NYMEX
Henry Hub NYMEX
Henry Hub
C$/Mcf
Current
C$/Mcf
Real
C$/Mcf
Current
C$/Mcf
Current
US$/Mcf
Real
US$/Mcf
Current
Historical
2017 $2.13 $2.32 $2.19 $1.56 $3.17 $2.99
2018 $1.36 $1.61 $1.54 $1.26 $3.30 $3.17
2019 $1.48 $1.85 $1.81 $1.02 $2.62 $2.57
2020
9 Mths H $1.89 $2.14 $2.14 $2.11 $1.90 $1.90
3 Mths F $2.30 $2.55 $2.55 $2.55 $2.70 $2.70
Avg. $2.00 $2.24 $2.24 $2.22 $2.10 $2.10
Forecast
2020 $2.30 $2.55 $2.55 $2.55 $2.70 $2.70
2021 $2.45 $2.65 $2.70 $2.70 $2.70 $2.75
2022 $2.50 $2.65 $2.75 $2.75 $2.80 $2.90
2023 $2.55 $2.65 $2.80 $2.80 $2.90 $3.10
2024 $2.60 $2.65 $2.85 $2.85 $2.90 $3.15
2025 $2.65 $2.65 $2.95 $2.95 $2.90 $3.20
2026 $2.70 $2.65 $3.00 $3.00 $2.90 $3.25
2027 $2.75 $2.65 $3.05 $3.05 $2.90 $3.35
2015 2016 2017 2018 2019 2020 2021 2022 2023 2024
Historical Deloitte June 30, 2020 Deloitte September 30, 2020
$0.00
$0.50
$1.00
$1.50
$2.00
$2.50
$3.00
$3.50
$4.00
12
Price forecast | International price forecast
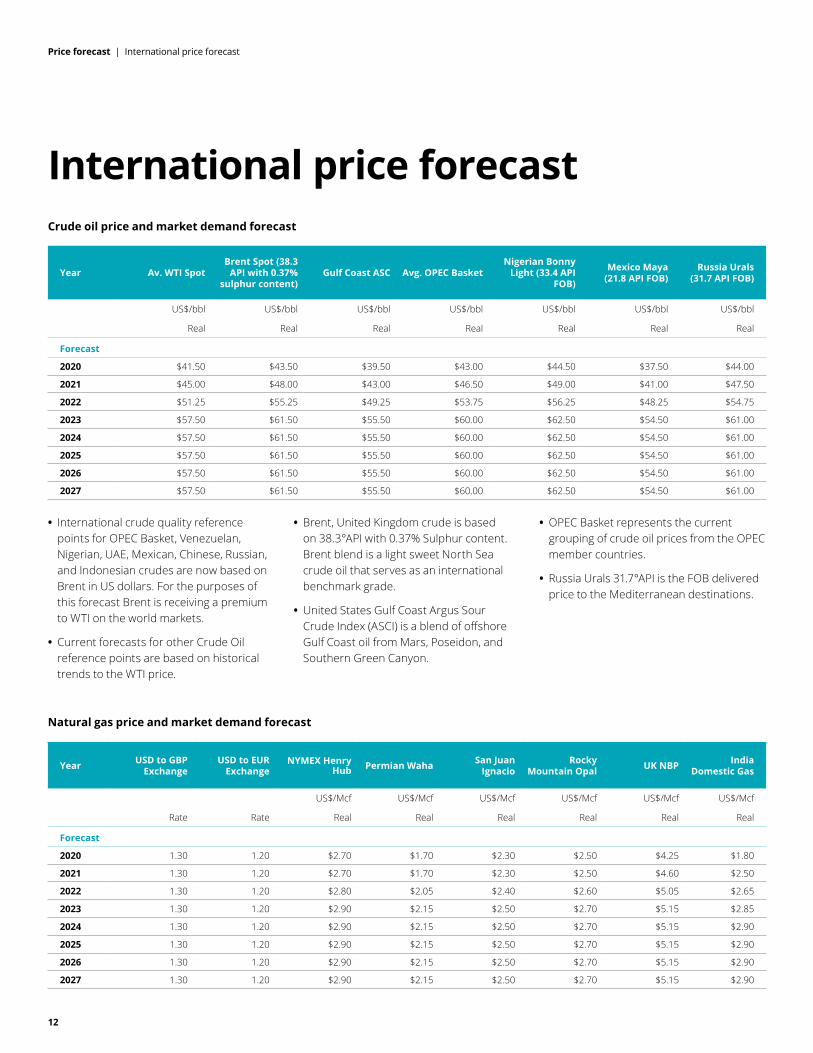
International price forecast Crude oil price and market demand forecast
Year Av. WTI Spot Brent Spot (38.3
API with 0.37% sulphur content)
Gulf Coast ASC Avg. OPEC Basket Nigerian Bonny
Light (33.4 API FOB)
Mexico Maya (21.8 API FOB)
Russia Urals (31.7 API FOB)
US$/bbl
Real
US$/bbl
Real
US$/bbl
Real
US$/bbl
Real
US$/bbl
Real
US$/bbl
Real
US$/bbl
Real
Forecast
2020 $41.50 $43.50 $39.50 $43.00 $44.50 $37.50 $44.00
2021 $45.00 $48.00 $43.00 $46.50 $49.00 $41.00 $47.50
2022 $51.25 $55.25 $49.25 $53.75 $56.25 $48.25 $54.75
2023 $57.50 $61.50 $55.50 $60.00 $62.50 $54.50 $61.00
2024 $57.50 $61.50 $55.50 $60.00 $62.50 $54.50 $61.00
2025 $57.50 $61.50 $55.50 $60.00 $62.50 $54.50 $61.00
2026 $57.50 $61.50 $55.50 $60.00 $62.50 $54.50 $61.00
2027 $57.50 $61.50 $55.50 $60.00 $62.50 $54.50 $61.00
• International crude quality reference points for OPEC Basket, Venezuelan, Nigerian, UAE, Mexican, Chinese, Russian, and Indonesian crudes are now based on Brent in US dollars. For the purposes of this forecast Brent is receiving a premium to WTI on the world markets.
• Current forecasts for other Crude Oil reference points are based on historical trends to the WTI price.
• Brent, United Kingdom crude is based on 38.3°API with 0.37% Sulphur content. Brent blend is a light sweet North Sea crude oil that serves as an international benchmark grade.
• United States Gulf Coast Argus Sour Crude Index (ASCI) is a blend of offshore Gulf Coast oil from Mars, Poseidon, and Southern Green Canyon.
• OPEC Basket represents the current grouping of crude oil prices from the OPEC member countries.
• Russia Urals 31.7°API is the FOB delivered price to the Mediterranean destinations.
Natural gas price and market demand forecast
Year USD to GBP Exchange
USD to EUR Exchange
NYMEX Henry Hub Permian Waha San Juan
Ignacio Rocky
Mountain Opal UK NBP India Domestic Gas
Rate Rate
US$/Mcf
Real
US$/Mcf
Real
US$/Mcf
Real
US$/Mcf
Real
US$/Mcf
Real
US$/Mcf
Real
Forecast
2020 1.30 1.20 $2.70 $1.70 $2.30 $2.50 $4.25 $1.80
2021 1.30 1.20 $2.70 $1.70 $2.30 $2.50 $4.60 $2.50
2022 1.30 1.20 $2.80 $2.05 $2.40 $2.60 $5.05 $2.65
2023 1.30 1.20 $2.90 $2.15 $2.50 $2.70 $5.15 $2.85
2024 1.30 1.20 $2.90 $2.15 $2.50 $2.70 $5.15 $2.90
2025 1.30 1.20 $2.90 $2.15 $2.50 $2.70 $5.15 $2.90
2026 1.30 1.20 $2.90 $2.15 $2.50 $2.70 $5.15 $2.90
2027 1.30 1.20 $2.90 $2.15 $2.50 $2.70 $5.15 $2.90
13
Price Forecast | Global trends
Global trends
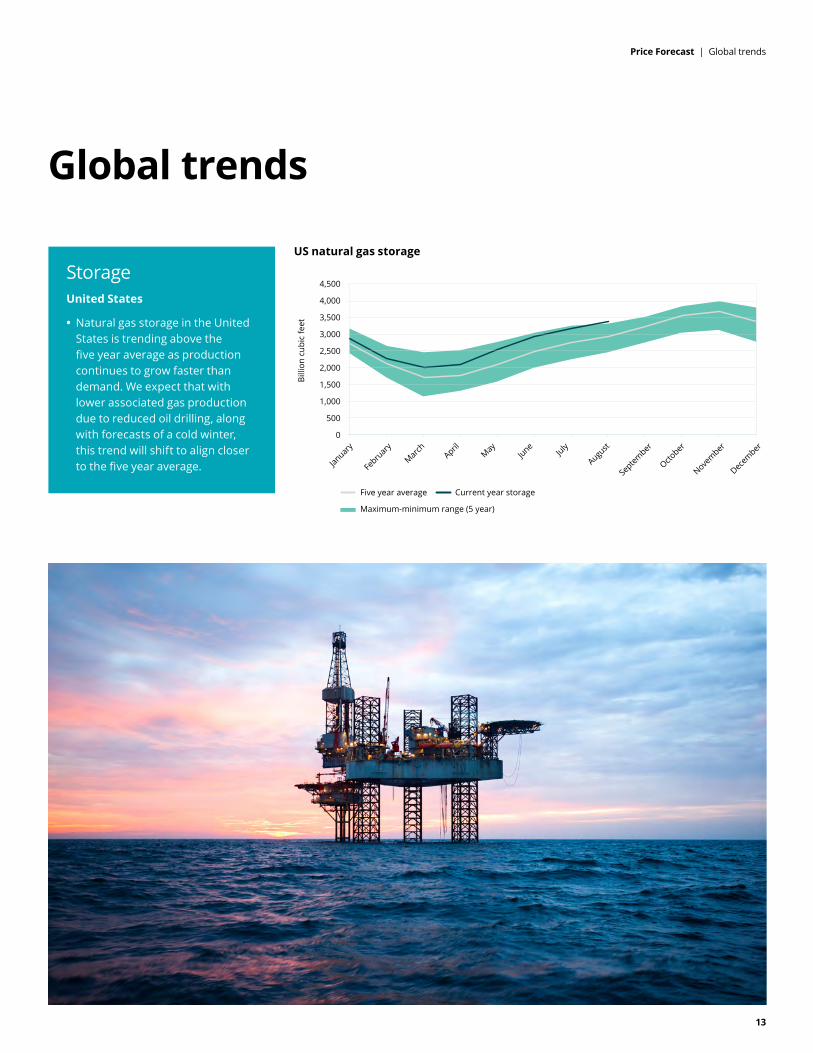
Storage United States
Natural gas storage in the United States is trending above the five year average as production continues to grow faster than demand. We expect that with lower associated gas production due to reduced oil drilling, along with forecasts of a cold winter, this trend will shift to align closer to the five year average.
US natural gas storage
0
500
1,000
1,500
2,000
2,500
3,000
3,500
4,000
4,500
Billi
on c
ubic
feet
Maximum-minimum range (5 year)
Five year average Current year storage
Januar
y
Febru
ary
March
AprilMay
JuneJuly
August
Septem
ber
October
November
Decem
ber
•
14
•
•
•
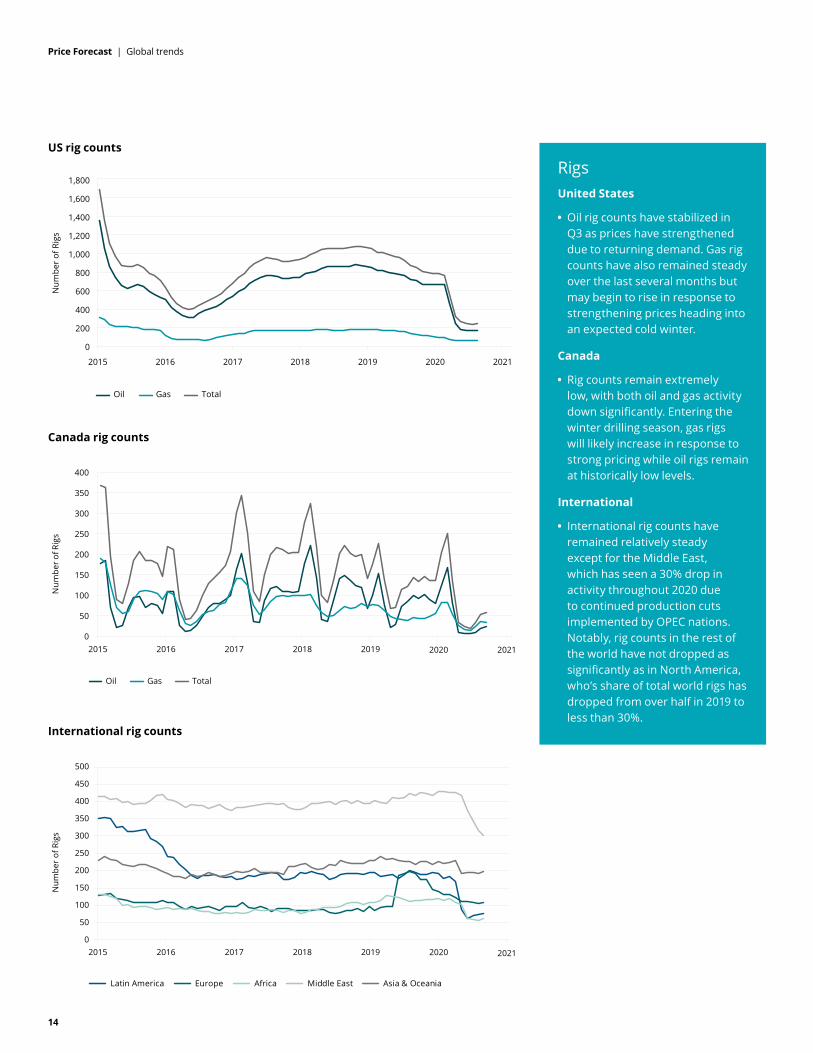
US rig counts
Canada rig counts
International rig counts
Rigs United States
Oil rig counts have stabilized in Q3 as prices have strengthened due to returning demand. Gas rig counts have also remained steady over the last several months but may begin to rise in response to strengthening prices heading into an expected cold winter.
Canada
Rig counts remain extremely low, with both oil and gas activity down significantly. Entering the winter drilling season, gas rigs will likely increase in response to strong pricing while oil rigs remain at historically low levels.
International
International rig counts have remained relatively steady except for the Middle East, which has seen a 30% drop in activity throughout 2020 due to continued production cuts implemented by OPEC nations. Notably, rig counts in the rest of the world have not dropped as significantly as in North America, who’s share of total world rigs has dropped from over half in 2019 to less than 30%.
Price Forecast | Global trends
0
400
800
1,200
1,600
1,800
2015 2016 2017 2018 2019 2021
Num
ber
of R
igs
Oil Gas Total
200
600
1,000
1,400
2020
0
50
100
150
200
250
300
400
2015 2016 2017 2018 2019
Num
ber o
f Rig
s
Oil Gas Total
350
2020 2021
0
50
100
150
200
250
300
350
400
450
500
2015 2016 2017 2018 2019
Num
ber
of R
igs
Latin America Europe Africa Middle East Asia & Oceania
2020 2021

15
Price Forecast | Canadian domestic price tables
Canadian domestic price tables Year Price
Inflation Cost
Inflation CAD to USD
Exchange
Crude Oil Pricing
WTI at Cushing
Oklahoma
WTI at Cushing
Oklahoma
Edmonton City Gate
Edmonton City Gate
WCS 20.5 Deg. API
Hardisty
Rate Rate Rate
US$/bbl
Real
US$/bbl
Current
C$/bbl
Real
C$/bbl
Current
C$/bbl
Current
Historical
2010 1.8% 1.8% 0.971 $94.66 $79.40 $92.76 $77.80 $67.22
2011 2.9% 2.9% 1.012 $111.14 $94.88 $111.90 $95.54 $77.12
2012 1.5% 1.5% 1.001 $107.02 $94.11 $98.44 $86.57 $73.10
2013 0.9% 0.9% 0.972 $109.64 $97.91 $104.55 $93.36 $74.97
2014 1.9% 1.9% 0.906 $103.46 $93.26 $104.27 $94.00 $81.06
2015 1.1% 1.1% 0.783 $52.98 $48.69 $62.02 $57.00 $44.80
2016 1.4% 1.4% 0.755 $46.43 $43.15 $56.18 $52.22 $38.90
2017 1.6% 1.6% 0.771 $53.96 $50.88 $65.62 $61.88 $50.53
2018 2.3% 2.3% 0.772 $67.76 $64.94 $72.10 $69.10 $49.68
2019 1.9% 1.9% 0.754 $58.11 $56.98 $70.39 $69.02 $58.75
2020
9 Mths H 1.1% 1.1% 0.740 $38.15 $38.15 $44.42 $44.42 $33.29
3 Mths F 0.0% 0.0% 0.760 $41.50 $41.50 $49.35 $49.35 $41.45
Avg. N/A N/A 0.745 $38.99 $38.99 $45.65 $45.65 $35.33
Forecast
2020 0.0% 0.0% 0.760 $41.50 $41.50 $49.35 $49.35 $41.45
2021 2.0% 2.0% 0.770 $45.00 $45.90 $53.25 $54.30 $43.70
2022 2.0% 2.0% 0.780 $51.25 $53.30 $59.30 $61.70 $48.35
2023 2.0% 2.0% 0.800 $57.50 $61.00 $65.65 $69.65 $56.40
2024 2.0% 2.0% 0.800 $57.50 $62.25 $65.65 $71.05 $57.55
2025 2.0% 2.0% 0.800 $57.50 $63.50 $65.65 $72.50 $58.70
2026 2.0% 2.0% 0.800 $57.50 $64.75 $65.65 $73.95 $59.85
2027 2.0% 2.0% 0.800 $57.50 $66.05 $65.65 $75.40 $61.05
2028 2.0% 2.0% 0.800 $57.50 $67.35 $65.65 $76.90 $62.25
2029 2.0% 2.0% 0.800 $57.50 $68.70 $65.65 $78.45 $63.50
2030 2.0% 2.0% 0.800 $57.50 $70.10 $65.65 $80.05 $64.80
2031 2.0% 2.0% 0.800 $57.50 $71.50 $65.65 $81.65 $66.10
2032 2.0% 2.0% 0.800 $57.50 $72.90 $65.65 $83.25 $67.40
2033 2.0% 2.0% 0.800 $57.50 $74.40 $65.65 $84.95 $68.75
2034 2.0% 2.0% 0.800 $57.50 $75.85 $65.65 $86.60 $70.15
2035 2.0% 2.0% 0.800 $57.50 $77.40 $65.65 $88.35 $71.55
2036 2.0% 2.0% 0.800 $57.50 $78.95 $65.65 $90.10 $72.95
2037 2.0% 2.0% 0.800 $57.50 $80.50 $65.65 $91.95 $74.40
2038 2.0% 2.0% 0.800 $57.50 $82.10 $65.65 $93.75 $75.90
2039 2.0% 2.0% 0.800 $57.50 $83.75 $65.65 $95.65 $77.45
2039+ 2.0% 2.0% 0.800 0.0% 2.0% 0.0% 2.0% 2.0%
Notes: • Data sources include: EIA, DOB, NRC, Flint Hills Resources, Alberta Government
• All prices are in Canadian dollars except WTI and NYMEX gas which are in US dollars
• Edmonton city gate prices based on historical light oil par prices posted by the government of Alberta and Net Energy differential futures (40 Deg. API < 0.5% Sulphur)
• Natural Gas Liquid prices are forecasted at Edmonton therefore an additional transportation cost must be included to plant gate sales point
• 1 Mcf is equivalent to 1 mmbtu
• Real prices listed in 2020 dollars with no escalation considered
• Alberta gas prices, except AECO, include an average cost of service to the plant gate
• NGL prices have been switched from a mix reference to a spec reference
Disclaimer - No representation or warranty of any kind (whether expressed or implied) is given by Deloitte LLP as to the accuracy, completeness, currency or fitness for any purpose of this document. As such, this document does not constitute the giving of investment advice, nor a part of any advice on investment decisions. Accordingly, regardless of the form of action, whether in contract, tort or otherwise, and to the extent permitted by applicable law, Deloitte LLP accepts no liability of any kind and disclaims all responsibility for the consequences of any person acting or refraining from acting in reliance on this this price forecast in whole or in part. This price forecast is not for dissemination in the United States or for distribution to United States wire services.
16
Price Forecast | Canadian domestic price tables
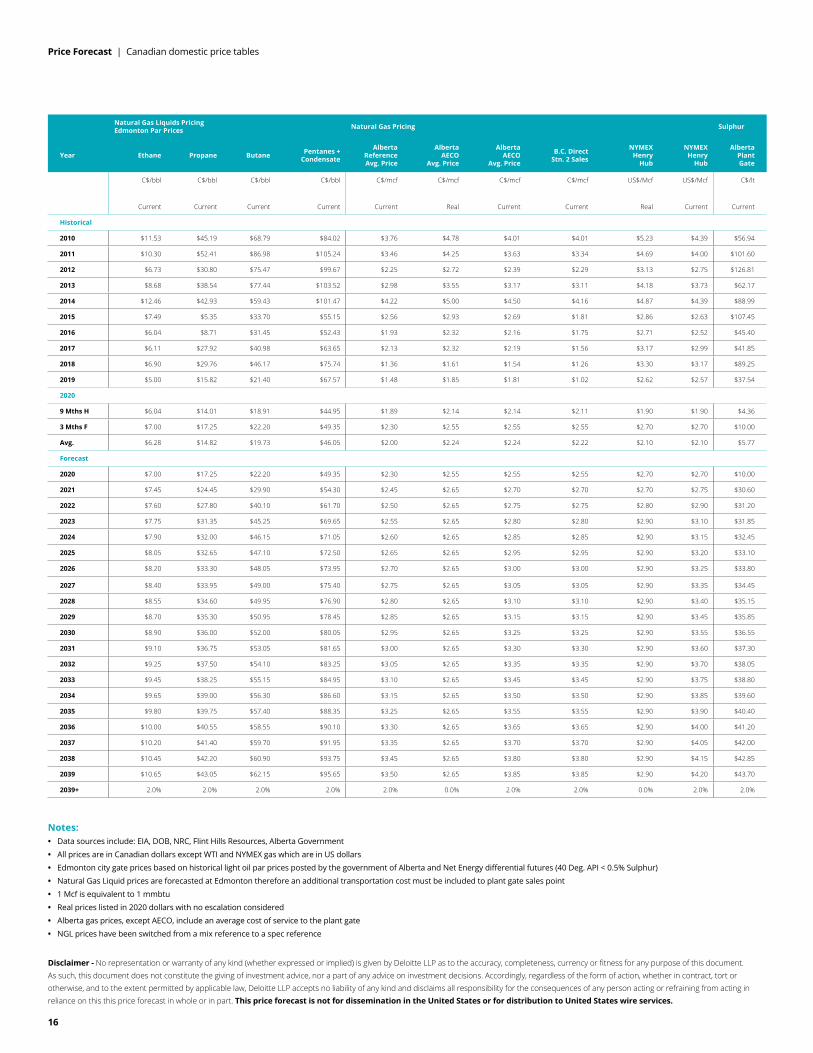
Year
Natural Gas Liquids Pricing Edmonton Par Prices Natural Gas Pricing Sulphur
Ethane Propane Butane Pentanes + Condensate
Alberta Reference Avg. Price
Alberta AECO
Avg. Price
Alberta AECO
Avg. Price
B.C. Direct Stn. 2 Sales
NYMEX Henry
Hub
NYMEX Henry
Hub
Alberta Plant Gate
C$/bbl
Current
C$/bbl
Current
C$/bbl
Current
C$/bbl
Current
C$/mcf
Current
C$/mcf
Real
C$/mcf
Current
C$/mcf
Current
US$/Mcf
Real
US$/Mcf
Current
C$/lt
Current
Historical
2010 $11.53 $45.19 $68.79 $84.02 $3.76 $4.78 $4.01 $4.01 $5.23 $4.39 $56.94
2011 $10.30 $52.41 $86.98 $105.24 $3.46 $4.25 $3.63 $3.34 $4.69 $4.00 $101.60
2012 $6.73 $30.80 $75.47 $99.67 $2.25 $2.72 $2.39 $2.29 $3.13 $2.75 $126.81
2013 $8.68 $38.54 $77.44 $103.52 $2.98 $3.55 $3.17 $3.11 $4.18 $3.73 $62.17
2014 $12.46 $42.93 $59.43 $101.47 $4.22 $5.00 $4.50 $4.16 $4.87 $4.39 $88.99
2015 $7.49 $5.35 $33.70 $55.15 $2.56 $2.93 $2.69 $1.81 $2.86 $2.63 $107.45
2016 $6.04 $8.71 $31.45 $52.43 $1.93 $2.32 $2.16 $1.75 $2.71 $2.52 $45.40
2017 $6.11 $27.92 $40.98 $63.65 $2.13 $2.32 $2.19 $1.56 $3.17 $2.99 $41.85
2018 $6.90 $29.76 $46.17 $75.74 $1.36 $1.61 $1.54 $1.26 $3.30 $3.17 $89.25
2019 $5.00 $15.82 $21.40 $67.57 $1.48 $1.85 $1.81 $1.02 $2.62 $2.57 $37.54
2020
9 Mths H $6.04 $14.01 $18.91 $44.95 $1.89 $2.14 $2.14 $2.11 $1.90 $1.90 $4.36
3 Mths F $7.00 $17.25 $22.20 $49.35 $2.30 $2.55 $2.55 $2.55 $2.70 $2.70 $10.00
Avg. $6.28 $14.82 $19.73 $46.05 $2.00 $2.24 $2.24 $2.22 $2.10 $2.10 $5.77
Forecast
2020 $7.00 $17.25 $22.20 $49.35 $2.30 $2.55 $2.55 $2.55 $2.70 $2.70 $10.00
2021 $7.45 $24.45 $29.90 $54.30 $2.45 $2.65 $2.70 $2.70 $2.70 $2.75 $30.60
2022 $7.60 $27.80 $40.10 $61.70 $2.50 $2.65 $2.75 $2.75 $2.80 $2.90 $31.20
2023 $7.75 $31.35 $45.25 $69.65 $2.55 $2.65 $2.80 $2.80 $2.90 $3.10 $31.85
2024 $7.90 $32.00 $46.15 $71.05 $2.60 $2.65 $2.85 $2.85 $2.90 $3.15 $32.45
2025 $8.05 $32.65 $47.10 $72.50 $2.65 $2.65 $2.95 $2.95 $2.90 $3.20 $33.10
2026 $8.20 $33.30 $48.05 $73.95 $2.70 $2.65 $3.00 $3.00 $2.90 $3.25 $33.80
2027 $8.40 $33.95 $49.00 $75.40 $2.75 $2.65 $3.05 $3.05 $2.90 $3.35 $34.45
2028 $8.55 $34.60 $49.95 $76.90 $2.80 $2.65 $3.10 $3.10 $2.90 $3.40 $35.15
2029 $8.70 $35.30 $50.95 $78.45 $2.85 $2.65 $3.15 $3.15 $2.90 $3.45 $35.85
2030 $8.90 $36.00 $52.00 $80.05 $2.95 $2.65 $3.25 $3.25 $2.90 $3.55 $36.55
2031 $9.10 $36.75 $53.05 $81.65 $3.00 $2.65 $3.30 $3.30 $2.90 $3.60 $37.30
2032 $9.25 $37.50 $54.10 $83.25 $3.05 $2.65 $3.35 $3.35 $2.90 $3.70 $38.05
2033 $9.45 $38.25 $55.15 $84.95 $3.10 $2.65 $3.45 $3.45 $2.90 $3.75 $38.80
2034 $9.65 $39.00 $56.30 $86.60 $3.15 $2.65 $3.50 $3.50 $2.90 $3.85 $39.60
2035 $9.80 $39.75 $57.40 $88.35 $3.25 $2.65 $3.55 $3.55 $2.90 $3.90 $40.40
2036 $10.00 $40.55 $58.55 $90.10 $3.30 $2.65 $3.65 $3.65 $2.90 $4.00 $41.20
2037 $10.20 $41.40 $59.70 $91.95 $3.35 $2.65 $3.70 $3.70 $2.90 $4.05 $42.00
2038 $10.45 $42.20 $60.90 $93.75 $3.45 $2.65 $3.80 $3.80 $2.90 $4.15 $42.85
2039 $10.65 $43.05 $62.15 $95.65 $3.50 $2.65 $3.85 $3.85 $2.90 $4.20 $43.70
2039+ 2.0% 2.0% 2.0% 2.0% 2.0% 0.0% 2.0% 2.0% 0.0% 2.0% 2.0%
Notes: • Data sources include: EIA, DOB, NRC, Flint Hills Resources, Alberta Government
• All prices are in Canadian dollars except WTI and NYMEX gas which are in US dollars
• Edmonton city gate prices based on historical light oil par prices posted by the government of Alberta and Net Energy differential futures (40 Deg. API < 0.5% Sulphur)
• Natural Gas Liquid prices are forecasted at Edmonton therefore an additional transportation cost must be included to plant gate sales point
• 1 Mcf is equivalent to 1 mmbtu
• Real prices listed in 2020 dollars with no escalation considered
• Alberta gas prices, except AECO, include an average cost of service to the plant gate
• NGL prices have been switched from a mix reference to a spec reference
Disclaimer - No representation or warranty of any kind (whether expressed or implied) is given by Deloitte LLP as to the accuracy, completeness, currency or fitness for any purpose of this document. As such, this document does not constitute the giving of investment advice, nor a part of any advice on investment decisions. Accordingly, regardless of the form of action, whether in contract, tort or otherwise, and to the extent permitted by applicable law, Deloitte LLP accepts no liability of any kind and disclaims all responsibility for the consequences of any person acting or refraining from acting in reliance on this this price forecast in whole or in part. This price forecast is not for dissemination in the United States or for distribution to United States wire services.
17
Price Forecast | Canadian domestic price tables
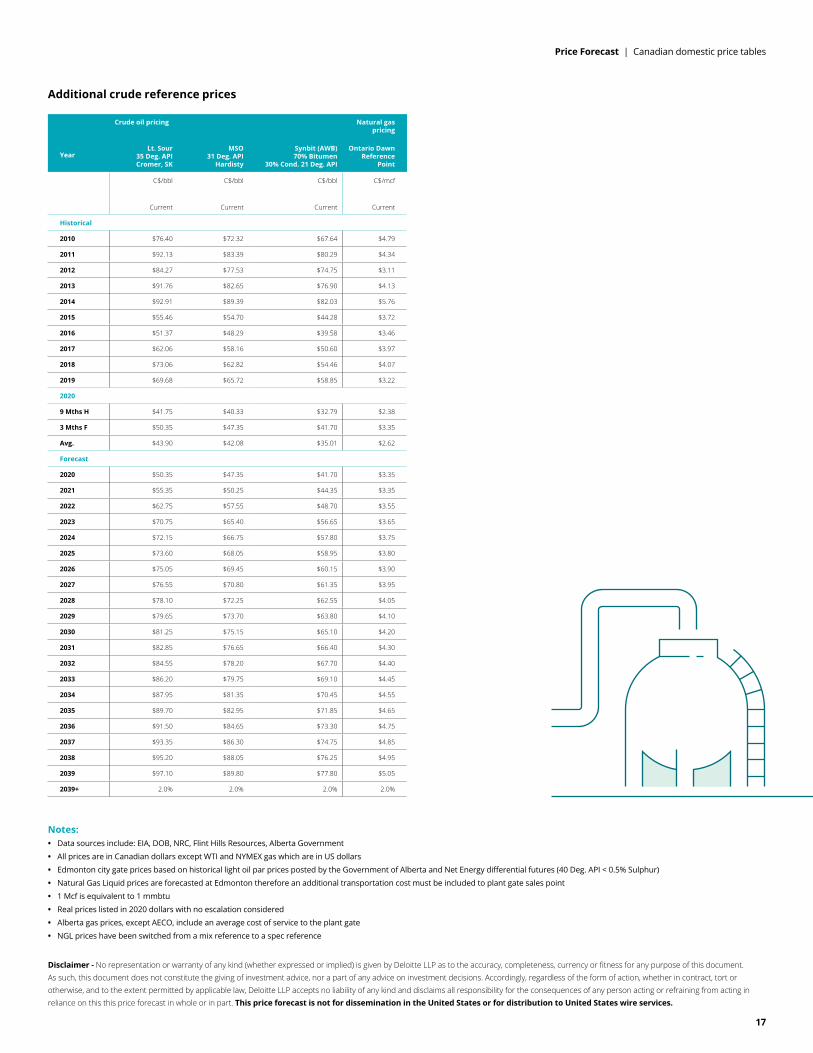
Additional crude reference prices
Year
Crude oil pricing Natural gas pricing
Lt. Sour 35 Deg. API Cromer, SK
MSO 31 Deg. API
Hardisty
Synbit (AWB) 70% Bitumen
30% Cond. 21 Deg. API
Ontario Dawn Reference
Point
C$/bbl
Current
C$/bbl
Current
C$/bbl
Current
C$/mcf
Current
Historical
2010 $76.40 $72.32 $67.64 $4.79
2011 $92.13 $83.39 $80.29 $4.34
2012 $84.27 $77.53 $74.75 $3.11
2013 $91.76 $82.65 $76.90 $4.13
2014 $92.91 $89.39 $82.03 $5.76
2015 $55.46 $54.70 $44.28 $3.72
2016 $51.37 $48.29 $39.58 $3.46
2017 $62.06 $58.16 $50.60 $3.97
2018 $73.06 $62.82 $54.46 $4.07
2019 $69.68 $65.72 $58.85 $3.22
2020
9 Mths H $41.75 $40.33 $32.79 $2.38
3 Mths F $50.35 $47.35 $41.70 $3.35
Avg. $43.90 $42.08 $35.01 $2.62
Forecast
2020 $50.35 $47.35 $41.70 $3.35
2021 $55.35 $50.25 $44.35 $3.35
2022 $62.75 $57.55 $48.70 $3.55
2023 $70.75 $65.40 $56.65 $3.65
2024 $72.15 $66.75 $57.80 $3.75
2025 $73.60 $68.05 $58.95 $3.80
2026 $75.05 $69.45 $60.15 $3.90
2027 $76.55 $70.80 $61.35 $3.95
2028 $78.10 $72.25 $62.55 $4.05
2029 $79.65 $73.70 $63.80 $4.10
2030 $81.25 $75.15 $65.10 $4.20
2031 $82.85 $76.65 $66.40 $4.30
2032 $84.55 $78.20 $67.70 $4.40
2033 $86.20 $79.75 $69.10 $4.45
2034 $87.95 $81.35 $70.45 $4.55
2035 $89.70 $82.95 $71.85 $4.65
2036 $91.50 $84.65 $73.30 $4.75
2037 $93.35 $86.30 $74.75 $4.85
2038 $95.20 $88.05 $76.25 $4.95
2039 $97.10 $89.80 $77.80 $5.05
2039+ 2.0% 2.0% 2.0% 2.0%
Notes: • Data sources include: EIA, DOB, NRC, Flint Hills Resources, Alberta Government
• All prices are in Canadian dollars except WTI and NYMEX gas which are in US dollars
• Edmonton city gate prices based on historical light oil par prices posted by the Government of Alberta and Net Energy differential futures (40 Deg. API < 0.5% Sulphur)
• Natural Gas Liquid prices are forecasted at Edmonton therefore an additional transportation cost must be included to plant gate sales point
• 1 Mcf is equivalent to 1 mmbtu
• Real prices listed in 2020 dollars with no escalation considered
• Alberta gas prices, except AECO, include an average cost of service to the plant gate
• NGL prices have been switched from a mix reference to a spec reference
Disclaimer - No representation or warranty of any kind (whether expressed or implied) is given by Deloitte LLP as to the accuracy, completeness, currency or fitness for any purpose of this document. As such, this document does not constitute the giving of investment advice, nor a part of any advice on investment decisions. Accordingly, regardless of the form of action, whether in contract, tort or otherwise, and to the extent permitted by applicable law, Deloitte LLP accepts no liability of any kind and disclaims all responsibility for the consequences of any person acting or refraining from acting in reliance on this this price forecast in whole or in part. This price forecast is not for dissemination in the United States or for distribution to United States wire services.
18
Price Forecast | International price tables
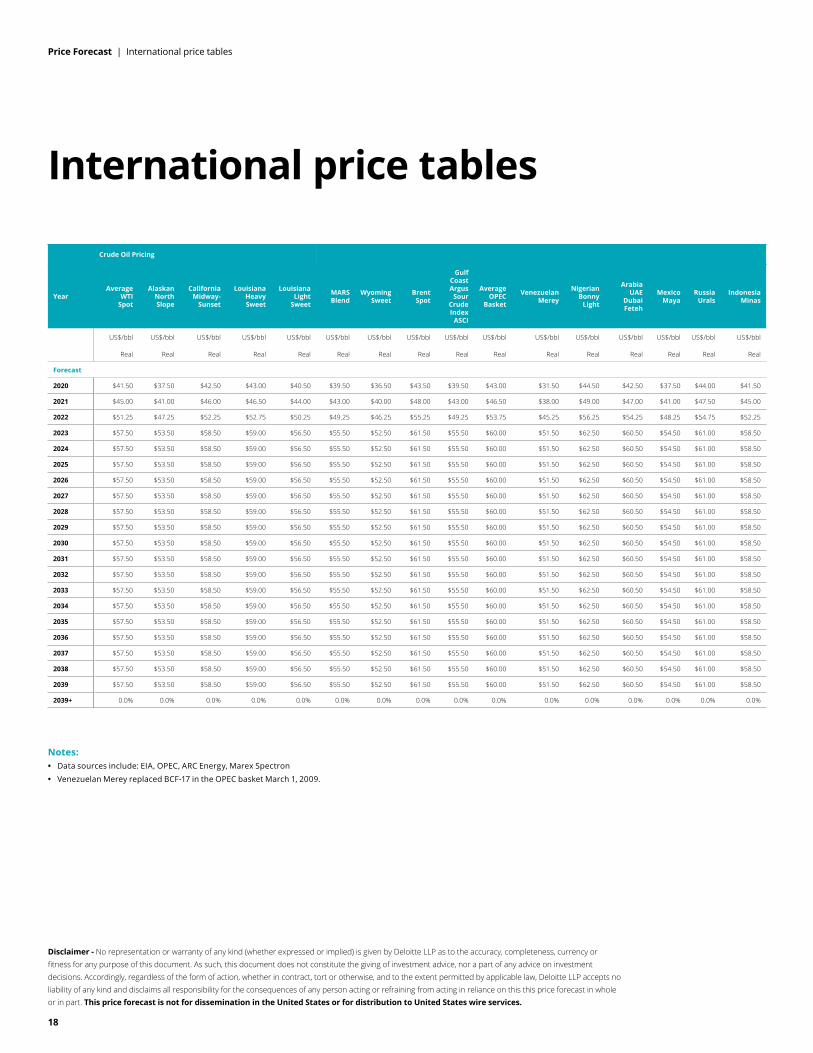
International price tables
Year
Crude Oil Pricing
Average WTI
Spot
Alaskan North Slope
California Midway-
Sunset
Louisiana Heavy Sweet
Louisiana Light
Sweet
MARS Blend
Wyoming Sweet
Brent Spot
Gulf Coast Argus
Sour Crude Index
ASCI
Average OPEC
Basket
Venezuelan Merey
Nigerian Bonny
Light
Arabia UAE
Dubai Feteh
Mexico Maya
Russia Urals
Indonesia Minas
US$/bbl
Real
US$/bbl
Real
US$/bbl
Real
US$/bbl
Real
US$/bbl
Real
US$/bbl
Real
US$/bbl
Real
US$/bbl
Real
US$/bbl
Real
US$/bbl
Real
US$/bbl
Real
US$/bbl
Real
US$/bbl
Real
US$/bbl
Real
US$/bbl
Real
US$/bbl
Real
Forecast
2020 $41.50 $37.50 $42.50 $43.00 $40.50 $39.50 $36.50 $43.50 $39.50 $43.00 $31.50 $44.50 $42.50 $37.50 $44.00 $41.50
2021 $45.00 $41.00 $46.00 $46.50 $44.00 $43.00 $40.00 $48.00 $43.00 $46.50 $38.00 $49.00 $47.00 $41.00 $47.50 $45.00
2022 $51.25 $47.25 $52.25 $52.75 $50.25 $49.25 $46.25 $55.25 $49.25 $53.75 $45.25 $56.25 $54.25 $48.25 $54.75 $52.25
2023 $57.50 $53.50 $58.50 $59.00 $56.50 $55.50 $52.50 $61.50 $55.50 $60.00 $51.50 $62.50 $60.50 $54.50 $61.00 $58.50
2024 $57.50 $53.50 $58.50 $59.00 $56.50 $55.50 $52.50 $61.50 $55.50 $60.00 $51.50 $62.50 $60.50 $54.50 $61.00 $58.50
2025 $57.50 $53.50 $58.50 $59.00 $56.50 $55.50 $52.50 $61.50 $55.50 $60.00 $51.50 $62.50 $60.50 $54.50 $61.00 $58.50
2026 $57.50 $53.50 $58.50 $59.00 $56.50 $55.50 $52.50 $61.50 $55.50 $60.00 $51.50 $62.50 $60.50 $54.50 $61.00 $58.50
2027 $57.50 $53.50 $58.50 $59.00 $56.50 $55.50 $52.50 $61.50 $55.50 $60.00 $51.50 $62.50 $60.50 $54.50 $61.00 $58.50
2028 $57.50 $53.50 $58.50 $59.00 $56.50 $55.50 $52.50 $61.50 $55.50 $60.00 $51.50 $62.50 $60.50 $54.50 $61.00 $58.50
2029 $57.50 $53.50 $58.50 $59.00 $56.50 $55.50 $52.50 $61.50 $55.50 $60.00 $51.50 $62.50 $60.50 $54.50 $61.00 $58.50
2030 $57.50 $53.50 $58.50 $59.00 $56.50 $55.50 $52.50 $61.50 $55.50 $60.00 $51.50 $62.50 $60.50 $54.50 $61.00 $58.50
2031 $57.50 $53.50 $58.50 $59.00 $56.50 $55.50 $52.50 $61.50 $55.50 $60.00 $51.50 $62.50 $60.50 $54.50 $61.00 $58.50
2032 $57.50 $53.50 $58.50 $59.00 $56.50 $55.50 $52.50 $61.50 $55.50 $60.00 $51.50 $62.50 $60.50 $54.50 $61.00 $58.50
2033 $57.50 $53.50 $58.50 $59.00 $56.50 $55.50 $52.50 $61.50 $55.50 $60.00 $51.50 $62.50 $60.50 $54.50 $61.00 $58.50
2034 $57.50 $53.50 $58.50 $59.00 $56.50 $55.50 $52.50 $61.50 $55.50 $60.00 $51.50 $62.50 $60.50 $54.50 $61.00 $58.50
2035 $57.50 $53.50 $58.50 $59.00 $56.50 $55.50 $52.50 $61.50 $55.50 $60.00 $51.50 $62.50 $60.50 $54.50 $61.00 $58.50
2036 $57.50 $53.50 $58.50 $59.00 $56.50 $55.50 $52.50 $61.50 $55.50 $60.00 $51.50 $62.50 $60.50 $54.50 $61.00 $58.50
2037 $57.50 $53.50 $58.50 $59.00 $56.50 $55.50 $52.50 $61.50 $55.50 $60.00 $51.50 $62.50 $60.50 $54.50 $61.00 $58.50
2038 $57.50 $53.50 $58.50 $59.00 $56.50 $55.50 $52.50 $61.50 $55.50 $60.00 $51.50 $62.50 $60.50 $54.50 $61.00 $58.50
2039 $57.50 $53.50 $58.50 $59.00 $56.50 $55.50 $52.50 $61.50 $55.50 $60.00 $51.50 $62.50 $60.50 $54.50 $61.00 $58.50
2039+ 0.0% 0.0% 0.0% 0.0% 0.0% 0.0% 0.0% 0.0% 0.0% 0.0% 0.0% 0.0% 0.0% 0.0% 0.0% 0.0%
Notes: • Data sources include: EIA, OPEC, ARC Energy, Marex Spectron
• Venezuelan Merey replaced BCF-17 in the OPEC basket March 1, 2009.
Disclaimer - No representation or warranty of any kind (whether expressed or implied) is given by Deloitte LLP as to the accuracy, completeness, currency or fitness for any purpose of this document. As such, this document does not constitute the giving of investment advice, nor a part of any advice on investment decisions. Accordingly, regardless of the form of action, whether in contract, tort or otherwise, and to the extent permitted by applicable law, Deloitte LLP accepts no liability of any kind and disclaims all responsibility for the consequences of any person acting or refraining from acting in reliance on this this price forecast in whole or in part. This price forecast is not for dissemination in the United States or for distribution to United States wire services.

19
Price Forecast | International price tables
Year USD to GBP
USD to EUR
Natural Gas pricing Ethanol
NYMEX Henry Hub Permian Waha San Juan Ignacio Rocky Mtn. Opal UK NBP
India Domestic Gas US CBOT Ethanol
Exchange rate
Exchange rate
US$/Mcf
Real
US$/Mcf
Real
US$/Mcf
Real
US$/Mcf
Real
US$/Mcf
Real
US$/Mcf
Real
US$/gal
Real
Forecast
2020 1.300 1.200 $2.70 $1.70 $2.30 $2.50 $4.25 $1.80 $1.30
2021 1.300 1.200 $2.70 $1.70 $2.30 $2.50 $4.60 $2.50 $1.30
2022 1.300 1.200 $2.80 $2.05 $2.40 $2.60 $5.05 $2.65 $1.30
2023 1.300 1.200 $2.90 $2.15 $2.50 $2.70 $5.15 $2.85 $1.30
2024 1.300 1.200 $2.90 $2.15 $2.50 $2.70 $5.15 $2.90 $1.30
2025 1.300 1.200 $2.90 $2.15 $2.50 $2.70 $5.15 $2.90 $1.30
2026 1.300 1.200 $2.90 $2.15 $2.50 $2.70 $5.15 $2.90 $1.30
2027 1.300 1.200 $2.90 $2.15 $2.50 $2.70 $5.15 $2.90 $1.30
2028 1.300 1.200 $2.90 $2.15 $2.50 $2.70 $5.15 $2.90 $1.30
2029 1.300 1.200 $2.90 $2.15 $2.50 $2.70 $5.15 $2.90 $1.30
2030 1.300 1.200 $2.90 $2.15 $2.50 $2.70 $5.15 $2.90 $1.30
2031 1.300 1.200 $2.90 $2.15 $2.50 $2.70 $5.15 $2.90 $1.30
2032 1.300 1.200 $2.90 $2.15 $2.50 $2.70 $5.15 $2.90 $1.30
2033 1.300 1.200 $2.90 $2.15 $2.50 $2.70 $5.15 $2.90 $1.30
2034 1.300 1.200 $2.90 $2.15 $2.50 $2.70 $5.15 $2.90 $1.30
2035 1.300 1.200 $2.90 $2.15 $2.50 $2.70 $5.15 $2.90 $1.30
2036 1.300 1.200 $2.90 $2.15 $2.50 $2.70 $5.15 $2.90 $1.30
2037 1.300 1.200 $2.90 $2.15 $2.50 $2.70 $5.15 $2.90 $1.30
2038 1.300 1.200 $2.90 $2.15 $2.50 $2.70 $5.15 $2.90 $1.30
2039 1.300 1.200 $2.90 $2.15 $2.50 $2.70 $5.15 $2.90 $1.30
2039+ 1.250 1.130 0.0% 0.0% 0.0% 0.0% 0.0% 0.0% 0.0%
Notes: • Data sources include: EIA, OPEC, ARC Energy, Marex Spectron
• Venezuelan Merey replaced BCF-17 in the OPEC basket March 1, 2009.
Disclaimer - No representation or warranty of any kind (whether expressed or implied) is given by Deloitte LLP as to the accuracy, completeness, currency or fitness for any purpose of this document. As such, this document does not constitute the giving of investment advice, nor a part of any advice on investment decisions. Accordingly, regardless of the form of action, whether in contract, tort or otherwise, and to the extent permitted by applicable law, Deloitte LLP accepts no liability of any kind and disclaims all responsibility for the consequences of any person acting or refraining from acting in reliance on this this price forecast in whole or in part. This price forecast is not for dissemination in the United States or for distribution to United States wire services.
20
Price Forecast | Pricing philosophy
Pricing philosophy
Price forecasting takes into account many variables that can influence future prices. Our experience tells us that we must continually review the forecasting tools we use to predict where oil and gas prices are heading. However, one constant influence on oil and gas pricing is the geo-political landscape. This impact is most accurately reflected in the financial industry’s futures market for commodities, a main influence when Deloitte creates its price forecast. In other words, Deloitte looks to both the futures and the past when we create our forecasts.
This pricing philosophy challenges conventional thinking. The traditional view is based on the mean-reversion view of commodities presented by economists. Following this model, industry forecasts from 2000 to 2006 reflected a drop in prices over the long term from the current prices of the day – even though the futures market indicated otherwise. While the mean-reversion approach definitely has some merit, history has tended to reflect that the futures market is a more accurate barometer.
Client focus
At Deloitte, we believe it is part of our role to help our clients in both the oil and gas sector and the investment community make better long-term business decisions by providing them with the most accurate and realistic information. We understand that sound analysis of changing trends can influence decisions on mergers, acquisitions, divestitures and investments. One way we
ensure our price forecasts are as accurate as possible, given the continuing impact of near-term volatility, is to review our pricing assumptions on a quarterly basis.
Our process
In preparing the price forecast, Deloitte considers the current monthly trends, the actual price and trends for the year-to-date and the prior year actual prices. The base forecast for both oil and gas is based on New York Mercantile Exchange (NYMEX) futures in US dollars.
Crude oil and natural gas forecasts are based on yearly variable factors, weighted to a higher percent for the current data and then reflect a higher percent to prior year historical data for the later years. Gas prices have been determined independently from oil prices, but still reflect the current competitive nature of the two fuels and historical oil-to-gas ratios for the latter years of the gas forecast.
Deloitte prepares our price and market forecasts based on information we collect from numerous government agencies, industry publications, oil refineries, natural gas marketers and industry trends. Inflation forecasts and exchange rates are also an integral part of the forecast.
These forecasts are Deloitte’s best estimate of how the future will look, and while they are considered reasonable, changing market conditions or additional information may require alteration from the indicated effective date.

21
Price Forecast | Glossary
Glossary
Some of the words, phrases and acronyms we use frequently when talking about pricing are listed below:
AECO Alberta Energy Company - historical name of a virtual trading hub on the NGX system
ANS Alaska North Slope
ASCI Argus Sour Crude Oil
AWB Access Western Blend - Canadian condensate/bitumen mix
BR Bow River Crude Oil
CAPP Canadian Association of Petroleum Producers
CBOT Chicago Board Of Trade
CGA Canadian Gas Association
CME Chicago Mercantile Exchange
DCQ Daily Contract Quantity
DOB Daily Oil Bulletin
EIA Energy Information Administration
FERC US Federal Energy Regulatory Commission
FOB Free on Board (shipper term)
IEA International Energy Administration
LLB Lloydminster Blend Crude Oil
LNG Liquefied Natural Gas
MESC Middle East Sour Crude
MSO Mixed Sour Crude Oil
MSW Canadian Light Sweet
NEB Canadian National Energy Board
NGX Natural Gas Exchange
NIT Nova Inventory Transfer
NRC Natural Resources Canada
NYMEX New York Mercantile Exchange
OECD Organization of Economic Cooperation and Development
OPEC Organization of Petroleum Exporting Countries
PADD Petroleum Administration Defense District
USGC US Gulf Coast
USWC US West Coast
WCS Western Canada Select Crude Oil
WTI West Texas Intermediate
WTS West Texas Sour

This page has been intentionally left blank.
22
23
Contacts
Andrew Botterill 403-648-3239 [email protected]
Lesley Mitchell 403-648-3215 [email protected]
Sarah Clowes 587-293-3201 [email protected]
Jonathan Listoe 403-648-3254 [email protected]
Deloitte Bankers Court 700, 850 - 2 Street SW Calgary AB T2P 0R8 Canada
Tel: 403-267-1700 Fax: 587-774-5398

www.deloitte.ca/priceforecast
No representation or warranty of any kind (whether expressed or implied) is given by Deloitte LLP as to the accuracy, completeness, currency or fitness for any purpose of this document. As such, this document does not constitute the giving of investment advice, nor a part of any advice on investment decisions. Accordingly, regardless of the form of action, whether in contract, tort or otherwise, and to the extent permitted by applicable law, Deloitte LLP accepts no liability of any kind and disclaims all responsibility for the consequences of any person acting or refraining from acting in reliance on this price forecast in whole or in part.
This price forecast is not for dissemination in the United States or for distribution to United States wire services.
About Deloitte Deloitte provides audit and assurance, consulting, financial advisory, risk advisory, tax, and related services to public and private clients spanning multiple industries. Deloitte serves four out of five Fortune Global 500® companies through a globally connected network of member firms in more than 150 countries and territories bringing world-class capabilities, insights, and service to address clients’ most complex business challenges. Deloitte LLP, an Ontario limited liability partnership, is the Canadian member firm of Deloitte Touche Tohmatsu Limited. Deloitte refers to one or more of Deloitte Touche Tohmatsu Limited, a UK private company limited by guarantee, and its network of member firms, each of which is a legally separate and independent entity. Please see www.deloitte.com/about for a detailed description of the legal structure of Deloitte Touche Tohmatsu Limited and its member firms.
Our global Purpose is making an impact that matters. At Deloitte Canada, that translates into building a better future by accelerating and expanding access to knowledge. We believe we can achieve this Purpose by living our shared values to lead the way, serve with integrity, take care of each other, foster inclusion, and collaborate for measurable impact.
To learn more about how Deloitte’s approximately 312,000 professionals, over 12,000 of whom are part of the Canadian firm, please connect with us on LinkedIn, Twitter, Instagram, or Facebook.
© Deloitte LLP and affiliated entities. 20-3222591H


![[ CHEMICALS AND PLASTICS ]...growth—Canada’s chemical sector alone is forecast to increase by 27 percent by 2020, a higher rate than in the U.S. and Western Europe. 4 Chemicals](https://img.dokumen.tips/doc/110x75/5f094c0e7e708231d4262747/-chemicals-and-plastics-growthacanadaas-chemical-sector-alone-is-forecast.jpg)