Embed Size (px)
Citation preview

The Role of Network Embeddedness in Film Success
Grant Packard, Anocha Aribarg, Jehoshua Eliashberg, and Natasha Z. Foutz*
July 2015
*Grant Packard is Assistant Professor of Marketing at the Laurier School of Business & Economics, Wilfrid Laurier University (email: [email protected], phone: 519.884.0710 x 4030), Anocha Aribarg is Associate Professor at the Ross School of Business, University of Michigan (email: [email protected], phone: 734.763.0599), Jehoshua Eliashberg is Sebastian S. Kresge Professor of Marketing and Professor of Operations and Information Management at the Wharton School of Business, University of Pennsylvania (email: [email protected], phone: 215.898.5246), and Natasha Z. Foutz (corresponding author) is Associate Professor of Commerce at the McIntire School of Commerce, University of Virginia (email: [email protected], phone: 434.924.0873). The authors contributed equally and are listed in random order. The authors would like to thank Nicole Coviello and participants at the 2013 Empirical and Theoretical Symposium at Western University – Ivey for their valuable feedback; and the McIntire School of Commerce and Batten Institute at the University of Virginia for financial support of this research.
1

The Role of Network Embeddedness in Film Success
ABSTRACT
In the early stage of film development when producers assemble a development team, it
is important to understand the means by which different team members may contribute to the
film’s box office. Building upon theories from marketing and sociology, we propose that these
contributions arise from team members’ positions, or embeddedness, in a social network weaved
through past film collaborations. These collaborations provide the members with the
opportunities to draw knowledge and skills from the network for new film projects. Our
conceptual framework accentuates two aspects of network embeddedness: positional
embeddedness (PE) – how well a person is tied to well-connected others, and junctional
embeddedness (JE) – the extent to which a person bridges sub-communities in the industry. We
examine how the importance of PE and JE varies by functional role (cast versus crew), and is
moderated by the film’s studio affiliation.
Analyzing more than 15,000 industry professionals over nearly two decades of film
collaborations, this research reveals crucial and divergent relationships: while high PE is more
valuable for the cast, high JE is critical for the crew. This role distinction also depends on a
film’s studio affiliation. Managerially, these findings provide guidance to film executives and
producers in revenue maximization through strategic team assembly, and to talents in career
management.
Keywords: entertainment marketing; motion pictures; new product development; collaboration networks; network embeddedness; functional roles.
2
1. INTRODUCTION
The movie industry is a prime example of Risky Business. U.S. film studios are estimated
to have spent an average of over $40 million to produce and market a single film in 2014, yet
these films averaged only $15 million in North American box office. With budgets approaching
$200 million to market a film internationally, global box office similarly fails to deliver positive
returns for the average global release (McClintock 2014; Motion Picture Association of America
2014; Nash Information Services 2015). To improve returns on investment, film executives and
producers are keenly interested in understanding and managing key factors in the early stages of
film development before making such enormous investments. Given the cost associated with,
and the critical contribution of, a film’s core team – the principal on-camera cast (e.g. lead actors
and actresses) and off-camera crew (e.g. director, cinematographer, and production designer) – to
a film’s success, it is vital to identify and assemble a high potential core team of collaborators.
Past research has focused on box office success as driven by product features, such as genre, and
post-development factors such as consumer responses to storyline, advertising, distribution,
critics, and word-of-mouth (Eliashberg, Elberse, and Leenders 2006). We extend this literature
by emphasizing the crucial value of the core development team to box office success.
Movie development is characterized by fluid construction and dissolution of development
teams on a project-by-project basis (Guimera, Spiro, and Amaral 2005; Uzzi and Spiro 2005).
For example, when Leonardo DeCaprio and Tom Hanks collaborated in Catch Me If You Can, a
link between them is established. As they also work with other people on different film projects,
more links are generated to form an elaborate collaboration network – a structure consisting of
connections among individuals through their prior collaborations in the industry. In light of this
3

networked structure and guided by prior research examining industrial social networks (e.g.
Ahuja, Galletta, and Carley 2003; Cattani and Ferriani 2008), we take a perspective of
interconnected, as opposed to isolated, individuals in the film industry. In particular, we examine
two key properties of each person’s embeddedness in the collaboration network: positional
embeddedness (PE) – the extent to which the person has collaborated with well-connected others
in the network; and junctional embeddedness (JE) – the degree to which the person’s prior
collaborations bridge different network sub-communities (Zukin and DiMaggio 1990).
Intuitively, relations with well-connected others (PE) may increase one’s reputation and image,
while connections across sub-communities in the network (JE) may represent enhanced access to
unique or diverse technical and artistic skills that can benefit future projects (Grewal, Lilien, and
Mallapragada 2006; Cattani and Ferriani 2008).
Taking the perspective of film producers who are in direct charge of team assembly, we
theorize that PE and JE hold differential importance across functional roles in a team, which we
classify as the core front-of-scene cast and behind-the-scene crew. For example, a cast member
with high PE may have a strong reputation in the industry, helping a movie signal its quality and
generate publicity. This network position should be less critical to the crew, whose value arises
more from their unique and diverse technical experience. Considering the different
responsibilities and skills required across these different functional roles, PE is potentially more
valuable to the cast and JE more crucial to the crew.
Furthermore, films affiliated with a major (e.g. Universal), as opposed to an independent
(i.e. indie, e.g. Yari Film Group) studio may take advantage of their superior brand recognition in
influencing the films’ distribution and publicity (Eliashberg, Elberse, and Leenders 2006).
Hence, we propose a film’s studio affiliation as a potential moderator of the relationship between
4
box office and team members’ network embeddedness. Specifically, given indie studios’
typically low marketing budgets and lack of brand recognition among exhibitors, promoters, and
consumers, it is likely that high PE among all members will add extra benefits to indie films.
In summary, we construct a conceptual framework to address a number of important
unanswered questions of theoretical and managerial significance. Do cast’s and crew’s positions
in the film industry’s network impact their contribution to box office? Does the nature of this
contribution depend on functional roles? Should a major versus indie studio assemble its team
differently? These inquiries will not only identify key driving forces underlying the relationship
between box office and team members’ network embeddedness, but also offer potential answers
to one of the most challenging questions facing the film industry – How does a studio assemble a
multi-functional team that maximizes a film’s box office potential?
To address these questions, we analyze the box office revenues of 2,110 movies released
over a six-year period, leveraging nearly two decades of collaborative histories involving more
than 15,000 film industry professionals. Building upon the marketing, management, and
sociology literatures, we derive role-level metrics of network embeddedness (PE and JE) for core
team members. We then link these metrics to box office while controlling for variations in film
quality, talent popularity, and studio resources. The results show that while PE is more valuable
for the cast, JE is more critical for the crew. Although past research has focused on the cast’s
contribution to box office (e.g. Elberse 2007; Luo, Han, and Park 2010), our research highlights
the importance and distinct value of the crew. Hence producers may wish to consider assembling
a more balanced team involving a crew with diverse experiences rather than a team driven solely
by a star cast. Finally, we find that indie, but not major, studios can accrue additional benefits by
engaging a crew that is well-connected to prominent (high PE) industry collaborators.
5

The remainder of the paper is organized as follows. We first construct the conceptual
framework. We then describe the two metrics of network embeddedness and our modeling
approach. The subsequent section delineates the data, empirical analysis, and managerial
implications. We conclude by summarizing the contributions and limitations of this research, as
well as suggesting avenues for future research.
2. CONCEPTUAL FRAMEWORK
2.1 Film Industrial Network and Functional Roles
Prior research focuses on the impact of product characteristics and consumer responses
on box office (e.g. Eliashberg, Elberse, and Leenders 2006). By focusing on the film
development team, we expand this literature and aim to provide some
answers to one of the most challenging questions facing the motion picture
industry – core team composition. Relevant to this inquiry, the literature on new product
development (NPD) suggests that NPD team members’ functional diversity (Sethi, Smith, and
Park 2001) or specific cognitive skills (Madhavan and Grover 1998) impact team performance.
Moreover, when NPD teams are constructed and dissolved fluidly on a project-by-project basis,
team members benefit from their prior collaborations in a variety of ways, such as gaining
information, reputation, knowledge, skills, and/or support that can be applied to future projects
(Delmestri, Montanari, and Usai 2005; Cattani and Ferriani 2008). That is, team members’
structural positions in a collaborative network can critically impact new product success.
Of central interest to us are more nuanced aspects of these relationships, which have been
advocated as important directions for future research (e.g. Ahuja, Galletta, and Carley 2003;
Grewal, Lilien, and Mallapragada 2006). Particularly, creative relationships should be examined
6

at the team level beyond a single member or functional role (e.g. director in Delmestri,
Montanari, and Usai 2005). Our cross-functional role approach may address a vital yet
unanswered question – how should a film producer assemble a revenue-maximizing movie team?
To accomplish this, we employ social network analysis. This approach examines the
interdependence of persons in a structured environment (i.e. network) to identify opportunities
for, or constraints on, resources and actions (Wasserman and Faust 1994). Most relevant to our
work is prior research on collaborative networks that involve groups of individuals working
together to achieve a common goal. In such networks, individuals are related to one another
through a collaborative activity (e.g. a film project); and activities are related to one another
through common collaborators (Faust 1997; see Appendix A for a demonstrative example).
Beyond the sheer number of a person’s ties (i.e. volume of past experience), the potential impact
of an individual’s embeddedness in a collaboration network should be informed by the nature of
“with whom” one collaborates and the functional role they play in these collaborations.
According to Baker and Faulkner (1993), a “role” can be considered a resource used to
pursue interests, enact positions, and claim, bargain for, or gain group membership. It grants
access to unique social, cultural, and material capital to be exploited for group interests. We
examine a group of individuals widely regarded as the “core” of a film team by the literature
(e.g. Cattani and Ferriani 2008) and based on our conversations with studio executives and
producers who recruit team members. The core members are commonly classified into two broad
roles: the principal cast (lead actor, lead actress, supporting actor, supporting actress1) and crew
(director, cinematographer, and production designer). The actors and actresses interpret the
1 We use the highest listed cast members in the film credit database on Oscars.org, reflecting the importance, not the alphabetic order, of the cast in a film. This list is also consistent with the one on imdb.com, arguably the best known movie database.
7

dramatic characters on-camera under the guidance of the director. The director controls and
collaborates with other crew members on the film's creative and technical aspects. The
cinematographer, also known as the director of photography, is responsible for artistic and
technical decisions related to the film’s visual image. Finally, the production designer identifies
and acquires the locations, settings, and styles that help visually tell the movie’s story.
While the movie marketing literature has documented the revenue impact of a star cast
member, often including it as a control variable operationalized as a power ranking or Oscars
dummy (e.g. Ainslie, Drèze, and Zufryden 2005; Basuroy, Chatterjee, and Ravid 2003; Elberse
and Eliashberg 2003), it has not examined the impact of the crew or differential contributions
across roles. Hence, it cannot speak to one of the most critical decisions facing the industry – the
composition of a film’s core team. It also views cast members as isolated individuals instead of
ones embedded in an elaborate social network. Our research intends to fill these gaps.
2.2 Impact of PE and JE by Functional Role and Studio as a Moderator
Positional embeddedness (PE) indicates the extent to which a person is associated with
well-connected others in the network (i.e. others who possess high PE). Such connections may
engender several benefits to a film, such as enhanced publicity opportunities. How likely these
benefits are accrued depends in part on the person’s functional role. Consider, a film’s box office
is partly influenced by the attention that its actors and actresses can attract from the media and
general public. By definition, those who enjoy high PE (e.g. George Clooney and Gwyneth
Paltrow) should be associated with other powerful, well-connected individuals in the industry
(e.g. directors Steven Soderbergh and Robert Zemecki). These associations may lead to
enhanced visibility and broader media coverage, stronger audience appeal, and more effective
8

promotional campaigns for the film. Producers are known to value prominent stars as they
generate greater media attention, especially around the releases of their movies (Albert 1998).
Consumers also remember and respond more favorably to advertising that features well-known
actors, leading to demonstrable economic benefits to the product (Agrawal and Kamakura 1995;
Erdogan 1999). Furthermore, high PE actors and actresses may signal a movie’s quality to
financers and exhibitors, mitigate negative critics’ reviews (Basuroy, Chatterjee, and Ravid
2003; Eliashberg and Shugan 1997), and enhance a movie’s brand equity through their marquee
appeal (Desai and Basuroy 2005; Luo, Han , and Park 2010).
In contrast, high PE may be less important for the crew due to their relatively low profile
in behind-the-scenes work. For example, while cinematographer Roger Deakins and production
designer Therese DePrez are both winners of multiple technical awards in the industry and
possess high JE (as shown in Table 3 later), they are less likely to enhance a film’s financing or
marketability to the same extent as a high PE cast. In summary, we predict that the cast’s PE will
have a more positive effect on box office than the crew’s PE.
High JE professionals bridge weakly linked clusters or sub-components of a network
(Burt 2000; 2002). Those with higher JE may benefit from the greater diversity in information
and resources that they can draw from the collaboration network. They are expected to have
greater access to unique and valuable knowledge, skills, and resources that may emerge outside
the core of a network (e.g. Cattani and Ferriani 2008; Cross and Cummings 2004). Furthermore,
those with high JE have been exposed to a broader array of concepts, developmental processes,
and collaborative styles (Arranz and Fdez de Arroyabe 2012). A crew with more diverse
experiences may also offer greater novelty and breadth in their abilities to apply unconventional
ideas, leading to competitive advantages (Cattani and Ferriani 2008). Thus, we suggest that high
9

JE should enable a crew to identify and apply movie-making innovations that occur both in the
core and the more avant-garde indie or foreign film regions of the industry network. For
instance, director Quentin Tarantino is known for borrowing techniques from foreign and indie
films (Armstrong 2013), such as the Japanese animation styles used in Kill Bill. In contrast, high
JE is less likely to enhance the cast’s reputation or value. While being connected with both the
core and more peripheral communities may enhance a cast member’s artistry, such a position
does not necessarily elevate his/her media profile or marquee appeal. In summary, we predict
that the crew’s JE has a more positive effect on box office than the cast’s JE.
We further expect that a film’s studio affiliation may moderate this relationship between
box office and the cast’s or crew’s network embeddedness. Film studios enjoy varied degrees of
brand recognition and production, marketing, and distribution resources. Studios are commonly
classified into majors (including mini-majors in our empirical analysis) versus independents (i.e.
“indies”; Vogel 2004). Majors release a large number of films each year and command
approximately 90% of North American box office revenues. The “Big Six” majors include the
20th Century Fox, Buena Vista/Disney, Sony Columbia, Paramount, Universal, and Warner
Brothers. They also have subsidiaries concentrating on art house or niche films, such as Fox
Searchlight. Besides the Big Six, well-known mini-majors include studios such as Lionsgate and
MGM/UA, which are larger than indies and attempt to compete directly with the Big Six
(Variety 2012).
Indies sometimes get their projects picked up by majors after progress toward film
completion has been made (Vogel 2004). They also manage distribution themselves, especially
in local and regional markets that are not well covered by majors and mini-majors. As a result,
brand recognition is critical for indies when competing for desirable release dates and
10
negotiations for wider distribution. When a studio lacks a strong brand, investors, exhibitors, and
consumers resort to the cast and crew’s professional brands to assess the film’s quality and
success potential (Bettman, Luce, and Payne 1998). Hence, a cast and crew with strong PE may
be particularly important to indie films that are in greater need for brand recognition. We thus
propose that higher PE among the cast and crew will add extra benefits to indie films. In
contrast, because the behind-the-scene advantages offered by high JE team members do not
contribute to brand recognition, we do not expect that the benefits of JE will interact with studio
affiliation.
2.3 Summary of Predictions
To summarize, team members’ abilities to contribute knowledge and skills to new film
projects depend on their embeddedness in the industrial network and their functional roles. We
predict that (i) high PE is more valuable to the cast; (ii) high JE is more critical for the crew; and
(iii) high PE among both the cast and crew will offer incremental benefits to indie studios.
3. MEASURES AND MODELING
In our empirical analysis, the collaborative network consists of each film’s core team
members: the top four cast and the top three crew (director, cinematographer, and production
designer). A tie is formed between any dyad of individuals regardless of functional roles, i and i’,
if they have collaborated on at least one film in the ten years prior to the focal film’s release year.
We then use PEim to denote positional embeddedness and JEim junctional embeddedness of
individual i working on movie m. For a movie released in year t, the network used to compute
11

PEim and JEim is constructed from the collaborations on movies released between year (t-1) and
year (t-10).
We capture positional embeddedness (PE) by using a measure of eigenvector centrality
(Bonacich 1987), which captures how well a person is tied to well-connected others in a social
network. PE captures not only the number of a person’s direct ties2, but weighs these ties
according to their importance in the larger ecosystem of the global network (Jackson 2008, p.
40). In this sense, a tie to a person connected to many others is worth more than a tie to a person
who is not as well-connected. Following Bonacich’s (1987) formulation of eigenvector
centrality, we estimate PEim as proportional to the total PE of individual i’s past collaborators i'
on prior movies m',∑
i ' m '
PEi ' m' over the 10 years prior to the release of movie m:
(1) λ PEim
=∑i '
m'
PEi 'm' ,
where is a proportionality factor between 0 and 1 to ensure a non-zero solution to Equation 1.
The equation is ultimately self-referential in that im’s PE depends on the PE of i’s past
collaborators i’m’, whose PE depends on the PE of their collaborators; and so on throughout the
entire network. The value, and PEim , for each individual i in movie m are derived by solving a
simultaneous linear equation system in the standard eigenvector-eigenvalue formulation:
(2) λ PE=ePE .
2 The number of a person’s direct ties can be described as his or her unweighted degree centrality. While degree is a commonly used social network measure, when applied to collaborative networks with teams that are similar in size, it approximates a simple count of prior collaborations; that is, how many movies that erson has worked on. When included together with PE in preliminary models, degree centrality was not significant, despite being significant in the absence of PE. A fourth commonly used measure of network embeddedness is closeness centrality. To our knowledge, there is no theoretical support or prior examination of this variable in a context similar to the present research. Our preliminary analysis found it non-significant in relation to box office.
12

Here, PE is a column vector of dimension [n × 1] that consists of eigenvector centralities of all
individuals in the network, where n is the total number of individuals in the network, and e is a
[n × n] symmetric adjacency matrix capturing all prior collaborations of all n individuals in the
network. The diagonal elements of e are zero and each off-diagonal element in e is a binary
indicator3 (1 or 0) of whether each person i in movie m has collaborated with another person i'in
any movies released in the decade before m. In the language of matrix algebra, is the largest
eigenvalue associated with the adjacency matrix e, and PE is its corresponding eigenvector4.
For JE, we adapt betweenness centrality from network theory (Freeman 1979) to
accommodate our team-level analysis, operationalizing i’s JE as
(3) JEim
= ∑jm'≠km' :im∉( jm ' , km' )
Pi ( j m' k m' )/ P( j m' k m' )( n−gm)(n−g m−1)/2
.
Here P i( j m' k m' )denotes the number of shortest paths between collaborators j and k on an earlier
movie m’ that run through i, P( j m' k m' ) the total number of shortest paths between j and k; gm the
number of team members on movie m, and n the total number of individuals in the network. We
extend the Freeman (1979) equation to our team context by normalizing this proportion by the
total number of pairs of individuals in the network (excluding im and all others working on movie
m) in the denominator of Equation 3. The intuition behind this JE measure is that information
and resources accrued to a given movie team are likely to travel through the social ties
3 We later discuss weighting of this indicator to account for repeated collaborations and temporal discounting of past collaborations.4 Readers interested in the standard eigenvector-eigenvalue formulation in matrix algebra may refer to Krishnan (1984) or Abadir and Magnus (2005) for a more detailed, step-by-step derivation. Appendix B also offers a brief, general example of this derivation.
13
established by the team members via prior collaborations. The extent of one’s exclusivity over
such social paths in the network connotes his/her JE (see Appendix A for an illustration).
We use the igraph package of the R statistical language to calculate PE and JE5. When
inputting the observed ties to the package, we further account for (a) the number of prior
collaborations in a dyad, since one may expect a stronger bond between two individuals from
repeated collaborations (frequency); and (b) temporal discounting of the collaborations that took
place farther in the past (recency)6. While (a) is relatively common in examining social and
economic networks (Brandes 2001; Jackson 2008), (b) is less so. For (b), we use the discount
function, e−β (t−1), where t is the year lapse (e.g. t = 1 means the collaboration occurred last year)
and β a discount parameter. In our context, β should be fairly small such that the network effects
do not dissipate rapidly over the 10-year window. We also perform a grid search with different
values of β and find that, indeed, large discount rates weaken the effects of JE, but not PE, on
box office. This is consistent with the argument that tie values below 1 will statistically over-
punish paths through only negligibly weaker ties (Granovetter 1973; Opsahl, Agneessens, and
Skvoretz 2010). We use β = 0.05 in our analysis, which results in a discount factor of 0.64 for
collaborations that occurred 10 years prior.
To assess PE’s and JE’s impact on box office, we link the PE and JE values to the
logarithm of movie m’s cumulative box office in inflation-adjusted U.S. dollars, Rm , as:
(4) Rm=α+zm' θ+P Em
' τ1+J Em' τ2+P Em
' I m τ3+J Em' I m τ 4+εm ,
5 Other network analysis software packages available to facilitate the calculation of the network statistics include the CENTPOW module for Stata, Gephi, Pajek, UCINET, and SocNetV.6 The key results also sustain when simple binary (1 = collaborated; 0 = not), instead of weighted collaborations, are analyzed.
14

where α is an intercept if movie m is affiliated with an indie studio; and zm includes control
variables commonly used in the movie literature (e.g. Sawhney and Eliashberg 1996; Ainslie,
Drèze, and Zufryden 2005) such as sequel and genre, MPAA rating, Oscars, critics’ and
consumers’ ratings. PEm (JEm) consists of the average PE (JE) of movie m’s cast and crew after
the frequency and recency weighted PEim (JEim ) is calculated for each individual i as discussed
earlier. Hence τ1 and τ 2 capture the main effects of PE and JE, respectively, on box office. This
approach both addresses our research questions directly and reduces potential multi-collinearity
in individual PE and JE. The grouping of the cast versus crew is further validated by factor
analysis which shows that the PEs (and JEs) of the director, cinematographer, and production
designer load on one dimension, while those of the actors and actresses load on a second
dimension. The scalar dummy I m = 1 if movie m is affiliated with an indie studio, and thus τ 3
and τ 4 examine whether the relationship between box office and network embeddedness varies
across majors/mini-majors versus indie studios.
Despite accounting for critics’ ratings, consumer ratings, and Oscar nominations above,
we may not have adequately captured the heterogeneity in movie quality. A movie with higher
quality and financial potential has a greater chance of attracting a cast and crew of higher caliber,
leading to higher box office revenue. Failing to properly control for quality heterogeneity can
lead to omitted variable bias or potential endogeneity between the movie’s box office and the
network embeddedness of its team members. To address this potential endogeneity, prior work
suggests exploiting the panel data structure and incorporating movie-level fixed effects (Elberse
2007; Gopinath, Chintagunta, and Venkataraman 2013). However, only one observation of the
cumulative revenue exists for each movie. PE and JE also vary by movie, not by time or
15

geographic area. As a result, using more disaggregate data such as weekly or regional revenues is
not plausible. Another possible approach is to use instruments for network embeddedness.
However, it is challenging to identify adequately strong instruments for PE and JE—variables
that are highly correlated with PE and JE but not with box office revenue7. Prior research
suggests that using weak instruments not highly correlated with the endogenous variable can lead
to larger inconsistencies in the estimates of the endogenous variable than a model that properly
controls for the potential source of endogeneity (Bound, Jaeger, and Baker 1995; Rossi 2014).
We therefore include multiple control variables in the model to best capture quality
heterogeneity across movies.
First, we follow prior research that suggests the decay rate of weekly revenues from the
first to second week of release as an indicator of film quality (e.g. Krider and Weinberg 1998).
We include in the vectorzm in Equation (4) a quality decay variable calculated as the difference
between the logarithm of a movie’s first- and second-week revenues. Second, each movie project
is affiliated with a particular studio (Vogel 2004). These studios vary drastically in their abilities
to finance and market films, with major and mini-major studios enjoying far greater resources
than indie studios (Scott 2005; Waterman 2005). Greater resources increase the majors’ abilities
to produce higher quality movies and promote them more effectively to the public. Given that the
indie studios we observe (N = 223) produce a much smaller number of movies (73% only
produced one or two movies), we include studio fixed effects for the major and mini-major
studios (N = 10) to capture heterogeneity in movie quality and financial support.
7 For example, potential instruments for PE are family or social connections with well-established individuals in the industry. These connections may lead to movie collaborations with higher PE individuals. However, these connections also likely affect an individual’s ability to generate strong box office revenues. Familial connections, unlike PE, also do not vary over time. As for JE, potential instruments include individuals’ career diversity (e.g. work in different fields of entertainment, such as music, Broadway, etc.). However, this variable can also have a direct impact on a movie’s box office.
16

Finally, production budget may be included to further control for heterogeneity in movie
quality and financial support. Budget was not available, however, for a large percentage (72%)
of the indie films in the data. If analysis is limited to only movies with budgets, there is
insufficient variation in PE and JE to identify their contributions8. Considering that a substantial
part of a movie’s budget is driven by the salaries of the core cast and crew (Forbes 2014), we
include popularity of the cast and crew, as measured by the cast’s and crew’s temporally
discounted average cumulative box office over the prior decade, as another set of control
variables. We use the temporal discount function e−β (t −1) to be consistent with the discounted PE
and JE measures. As team members who generated higher revenues in the past tend to command
higher salaries, the popularity measures help further capture heterogeneity in movie quality and
financial support, thereby alleviating the endogeneity issue. Moreover, since high PE and JE
members may also be popular, these quality measures also ensure that the network effects are not
confounded with cast or crew popularity9.
4. EMPIRICAL ANALYSIS
4.1 Data
We examine the box office revenues of 2,110 movies released in the U.S. over a six-year
period (1999 to 2004 inclusive) that earned at least $1,000. As new movies are developed and
new collaborations established, the network dynamically evolves. Thus, we use a lagged rolling-
window approach to define a collaborative network for each of the six release years under
investigation. For example, for each movie released in 2004, we use the movies released during
8 We estimated the proposed model (Equation 4) using only those movies with budgets and indeed could not uncover the effects of network embeddedness.9 We thank the Associate Editor for this suggestion.
17

the prior decade (1994-2003 inclusive) to construct the collaborative network and compute PE
and JE for the cast and crew involved in those 2004 releases. Excluding the focal movie’s release
year from the network alleviates potential simultaneity between box office and network the
statistics. Table 1 provides the descriptive statistics of the variables used in our analysis.
4.2 Network Analysis
While this research takes the perspective of the producers who assess the cast and crew’s
potential contributions when assembling the core movie teams, and thus producers’ PE and JE
are not key predictors in the model, producers’ ties to the cast and crew are also part of the
network. We believe that it is important to include producers’ ties as the cast’s and crew’s
relationships with producers play a crucial role in determining the cast’s and crew’s network
positions, and hence their PE and JE. Also, for the 5.8% of 16,891 persons in the data that took
on more than one role on a particular team, we assign their network embeddedness to each role
performed.
Table 2 displays the summary statistics of the six networks analyzed. Each network
involves nearly 3,000 movies and over 9,000 individuals, forming a “giant component” that
connects over 85% of all potential collaborators in the industry. Unsurprisingly, further
inspection of the data indicates that Hollywood is at the core of this component, while non-U.S.
productions and a few isolated U.S. film teams operate outside this dominant “invisible college
(see Appendix C for a sample visualization of the 1994-2003 network used for 2004 releases).
Table 1: Descriptive Statistics
All movies Major studio movies Indie movies(n = 2110) (n = 1229) (n = 881)
Mean S.D. Mean S.D. Mean S.D.
18
Box office ($MM) 20.444 41.688 32.904 49.000 3.062 17.183Sequel 0.104 0.305 0.146 0.353 0.045 0.208Foreign movie 0.201 0.401 0.087 0.282 0.360 0.480Action 0.063 0.243 0.090 0.286 0.026 0.160Adventure 0.011 0.106 0.013 0.113 0.009 0.095Animated 0.035 0.184 0.048 0.214 0.017 0.129Biography/Documentary 0.069 0.253 0.023 0.151 0.105 0.306Black comedy 0.010 0.099 0.009 0.094 0.011 0.106Comedy 0.225 0.418 0.256 0.437 0.182 0.386Crime 0.009 0.097 0.005 0.070 0.016 0.125Drama 0.380 0.486 0.327 0.469 0.454 0.498Fantasy 0.008 0.089 0.011 0.102 0.005 0.067Horror 0.030 0.170 0.033 0.180 0.025 0.156Musical 0.009 0.092 0.006 0.075 0.012 0.111Suspense/Thriller/Mystery 0.050 0.218 0.068 0.251 0.025 0.156Romantic comedy 0.054 0.226 0.072 0.258 0.030 0.169Science fiction 0.020 0.141 0.028 0.166 0.009 0.095Western 0.006 0.075 0.007 0.085 0.003 0.058G-rated 0.027 0.161 0.035 0.184 0.015 0.121PG13-rated 0.080 0.271 0.107 0.309 0.042 0.201PG-rated 0.243 0.429 0.359 0.480 0.082 0.274R-rated 0.475 0.499 0.496 0.500 0.446 0.497NC17-rated 0.002 0.049 0.002 0.049 0.002 0.048Consumer rating 6.305 1.149 6.199 1.155 6.453 1.125Critics rating 5.786 1.310 5.617 1.373 6.020 1.178Oscar nominated 0.043 0.202 0.066 0.248 0.010 0.101PE of cast 0.066 0.076 0.092 0.083 0.031 0.043PE of crew 0.057 0.077 0.083 0.088 0.022 0.037JE of cast 0.028 0.034 0.039 0.036 0.013 0.023JE of crew 0.024 0.029 0.034 0.030 0.011 0.020Popularity of cast 18.376 18.619 25.506 18.496 8.429 13.542Popularity of crew 14.351 20.505 22.024 22.986 3.646 8.567Note: a movie is coded as 1 if it belongs to one of the genre categories (such as Drama) or MPAA ratings (such as R for restricted) listed in the data collected from Oscars.org. The average consumers’ rating and average critics’ rating for each film are from imdb.com and rottentomatoes.com, respectively, both on a 0-10 point scale where 10 = best rated. For Oscar nominations, a movie is coded as 1 if it was nominated for one of the six major award categories: best picture, director, actor, actress, supporting actor, and supporting actress.We also observe that an individual wishing to reach a potential collaborator through the
latter’s prior collaborators would on average need to engage only about four others. That is, the
mean “path length” is 4, varying between 3.99 to 4.24 across the six networks. Moreover, we
report the clustering coefficient (Watts and Strogatz 1998) as an indicator of the density of the
ties, or the proportion of the cases where “a collaborator of my collaborator was also my
19

collaborator.” This coefficient is 21% in our data, higher than what would be observed in
randomly generated networks of the same size.
The above combination of short path lengths and high clustering coefficients confirms
that the film industry can be characterized as a “small-world” network (Watts and Strogatz
1998). That is, an enormous network (e.g. 9,286-11,857 individuals per network in our case) can
be quickly traversed through ties among a small number of individuals (e.g. 4 in our data). Such
networks tend to be highly conducive to social transmission of information, resources, or
influence.
Table 2 summarizes the properties of the six ten-year networks. The giant component
statistic describes the proportion of the individuals who have connections in the largest
connected cluster in the network; the average degree indicates the average number of past
collaborators; the average path length captures the number of steps between any two individuals
in the network; and the clustering coefficient suggests the tendency of individuals to cluster
together such that “the collaborator of a collaborator is also my collaborator.”
20

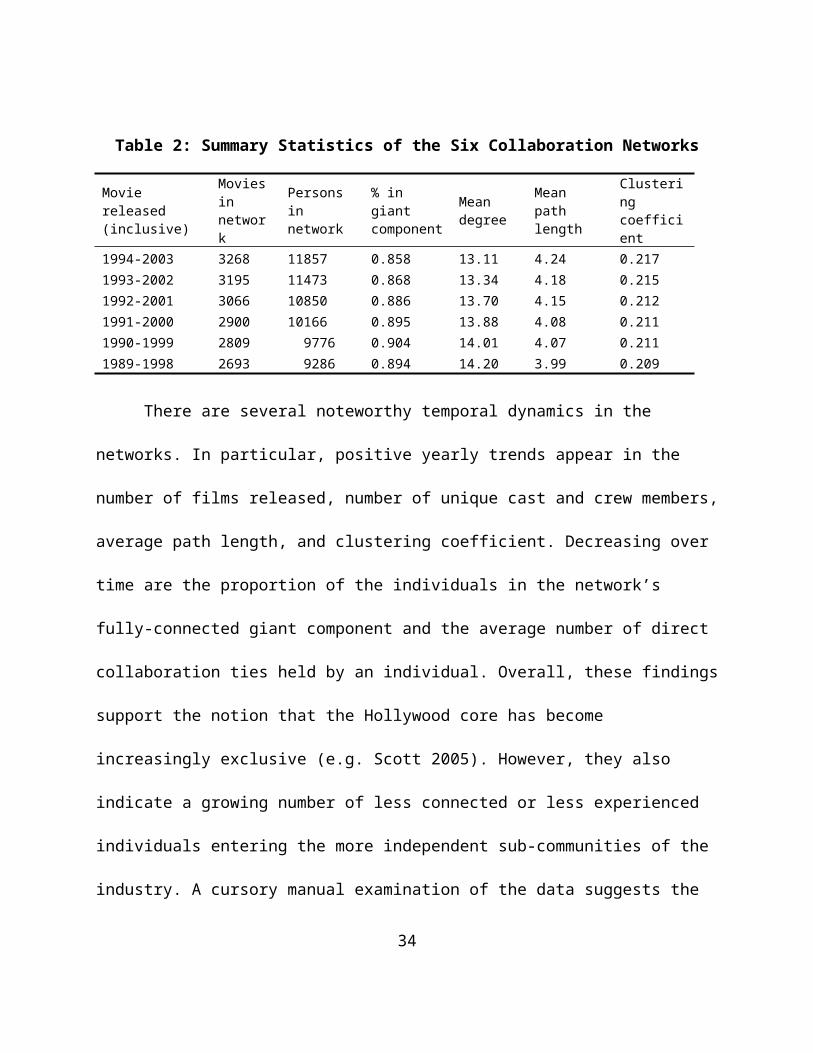
Table 2: Summary Statistics of the Six Collaboration Networks
Movie released (inclusive)
Movies in network
Persons in network
% in giant component
Mean degree
Mean path length
Clustering coefficient
1994-2003 3268 11857 0.858 13.11 4.24 0.2171993-2002 3195 11473 0.868 13.34 4.18 0.2151992-2001 3066 10850 0.886 13.70 4.15 0.2121991-2000 2900 10166 0.895 13.88 4.08 0.2111990-1999 2809 9776 0.904 14.01 4.07 0.2111989-1998 2693 9286 0.894 14.20 3.99 0.209
There are several noteworthy temporal dynamics in the networks. In particular, positive
yearly trends appear in the number of films released, number of unique cast and crew members,
average path length, and clustering coefficient. Decreasing over time are the proportion of the
individuals in the network’s fully-connected giant component and the average number of direct
collaboration ties held by an individual. Overall, these findings support the notion that the
Hollywood core has become increasingly exclusive (e.g. Scott 2005). However, they also
indicate a growing number of less connected or less experienced individuals entering the more
independent sub-communities of the industry. A cursory manual examination of the data
suggests the rise of foreign productions, such as India’s “Bollywood”, as a driver of this change.
To offer more concrete examples of PE and JE at the individual level, we list the 25 cast
with the highest PE and 25 crew with the highest JE in the 2004 releases with the 1994-2003
network (Table 3)10. For example, while actors such as Nicolas Cage and Samuel L. Jackson
Table 3: Top 25 Cast by PE and Top 25 Crew by JE in 2004 Releases
Top 25 Cast by PE Top 25 Crew by JE
10 The values of PE and JE by year for all 16,891 individuals across the six collaboration networks are available at http://www.grantpackard.com/filmnetwork.
21

Rank Person PE JE1 DANNY DEVITO .406 .6102 GENE HACKMAN .231 .1963 KEVIN SPACEY .216 .3594 SAMUEL L JACKSON .182 .6595 BEN STILLER .174 .1386 NICOLAS CAGE .159 .4317 ROBERT DE NIRO .154 .3578 JOHN TRAVOLTA .151 .2899 JULIANNE MOORE .150 .50710 MERYL STREEP .149 .20111 BRUCE WILLIS .148 .42912 GEORGE CLOONEY .147 .16513 MORGAN FREEMAN .140 .23414 JULIA ROBERTS .122 .16115 JIM CARREY .121 .17516 GWYNETH PALTROW .120 .34117 LAURA LINNEY .118 .06818 ROBIN WILLIAMS .116 .45919 BILL PAXTON .115 .08420 DREW BARRYMORE .115 .26421 BILLY BOB THORNTON .114 .23722 TIM ROBBINS .113 .20223 JAMES GARNER .112 .04824 EDDIE MURPHY .106 .25525 KEVIN BACON .106 .384
Rank Person JE PE1 EDUARDO SERRA .763 .0342 GIORGOS ARVANITIS .761 .0093 THIERRY ARBOGAST .741 .0414 CHRISTOPHER DOYLE .687 .0195 ELLIOT DAVIS .564 .1106 BENOIT DELHOMME .529 .0117 XAVIER PEREZ
GROBET.398 .006
8 ANDREW DUNN .379 .0899 ROBERT RICHARDSON .371 .09310 DANTE E SPINOTTI .354 .11611 GILES NUTTGENS .343 .01212 THERESE DEPREZ .335 .06313 DAVID WASCO .334 .10214 PAUL J PETERS .320 .05915 DENIS LENOIR .306 .02016 MARYSE ALBERTI .297 .03117 ASHLEY ROWE .293 .02118 ELLEN KURAS .290 .04719 WILLIAM CHANG .289 .00120 ADAM BIDDLE .279 .06921 DICK POPE .268 .03322 JANE ANN STEWART .266 .01623 BOB ZIEMBICKI .263 .06824 KEVIN THOMPSON .255 .04825 DECLAN QUINN .255 .052
may not spring to mind as among the top 10 on-camera talents of 2004, they held some of the
highest PE (and JE) at that time. This is likely due to their exceptional productivity as actors,
often in supporting roles, and their collaborations with both diverse (JE) and well-connected (PE)
others. For example, Nicolas Cage was credited for 29 movies over the entire observation period,
including a diverse range of Hollywood blockbusters (e.g. National Treasure), small-budget,
artistic independent projects (e.g. Leaving Las Vegas), B-movies (e.g. Kiss of Death), and
foreign productions (e.g. Tempo di uccidere, Zandalee).
Turning to the list of top crew by JE, we spotlight cinematographer Christopher Doyle,
whose incredibly diverse experience is expected to propel his creative and technical contribution
to a movie’s success. Doyle’s variety of experiences across the industry’s sub-communities is
evident in his work on movies appealing to English, Cantonese, Mandarin, and French language 22

markets, including major studio films (e.g. the 1998 Hollywood re-make of Psycho and 2006’s
Lady in the Water with director M. Night Shyamalan), a number of notable Chinese-language
films, unusual genre films such as the Japanese-German co-production of “pink-film”
Underwater Love, and several North American indie films (e.g. Paranoid Park, Passion Play).
4.3 Model Comparison
To demonstrate the contributions of the core cast’s and crew’s network embeddedness to
box office, we estimate a series of models. Building upon the commonly used models in the
movie literature that account for product characteristics (e.g. Sawhney and Eliashberg 1996;
Ainslie, Drèze, and Zufryden 2005), Model 1 (baseline) includes the studio fixed effects and
other quality measures described earlier, such as critics’ and audience’s ratings, Oscar
nominations, and the revenue decay. Model 2 integrates the cast’s and crew’s popularity effects
without their network embeddedness. Models 3 and 4 add the main effects and interaction effects
of network embeddedness, respectively.
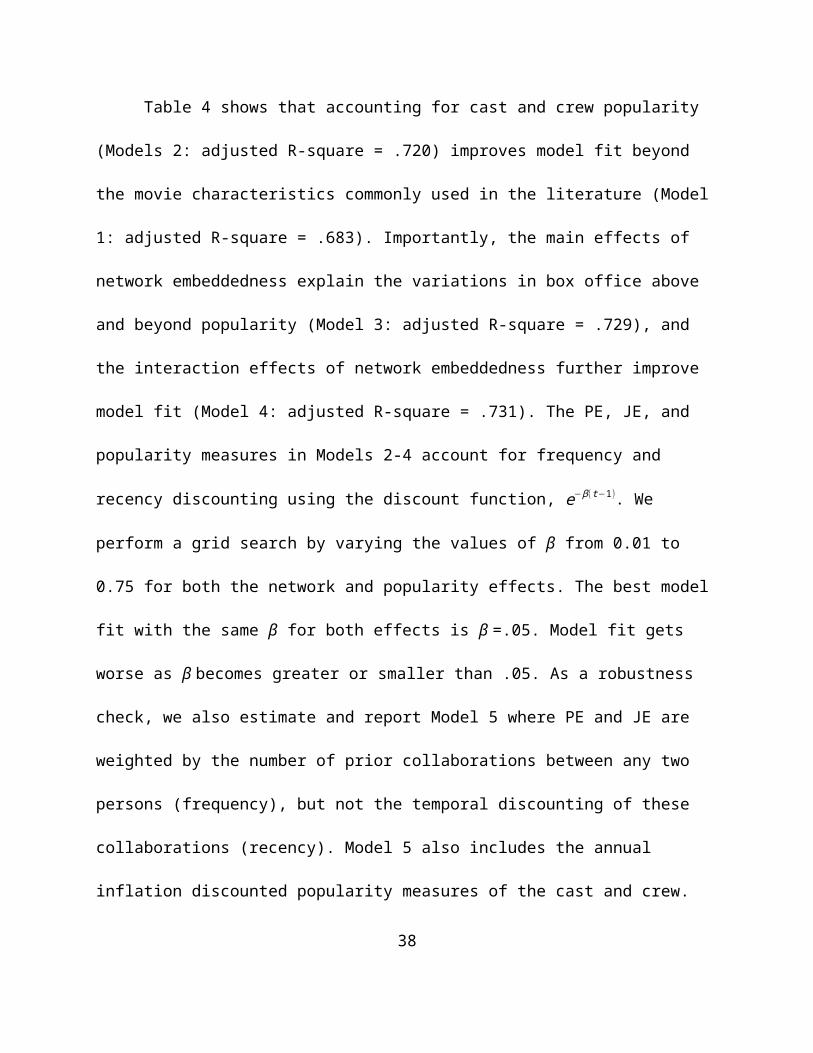
Table 4 shows that accounting for cast and crew popularity (Models 2: adjusted R-square
= .720) improves model fit beyond the movie characteristics commonly used in the literature
(Model 1: adjusted R-square = .683). Importantly, the main effects of network embeddedness
explain the variations in box office above and beyond popularity (Model 3: adjusted R-square
= .729), and the interaction effects of network embeddedness further improve model fit (Model
4: adjusted R-square = .731). The PE, JE, and popularity measures in Models 2-4 account for
frequency and recency discounting using the discount function, e−β (t−1). We perform a grid
search by varying the values of β from 0.01 to 0.75 for both the network and popularity effects.
The best model fit with the same β for both effects is β =.05. Model fit gets worse as β becomes
23

greater or smaller than .05. As a robustness check, we also estimate and report Model 5 where
PE and JE are weighted by the number of prior collaborations between any two persons
(frequency), but not the temporal discounting of these collaborations (recency). Model 5 also
includes the annual inflation discounted popularity measures of the cast and crew. Overall, we
see that the same pattern of results holds. However, Model 4 (.731) fits slightly better than
Model 5 (.729)11.
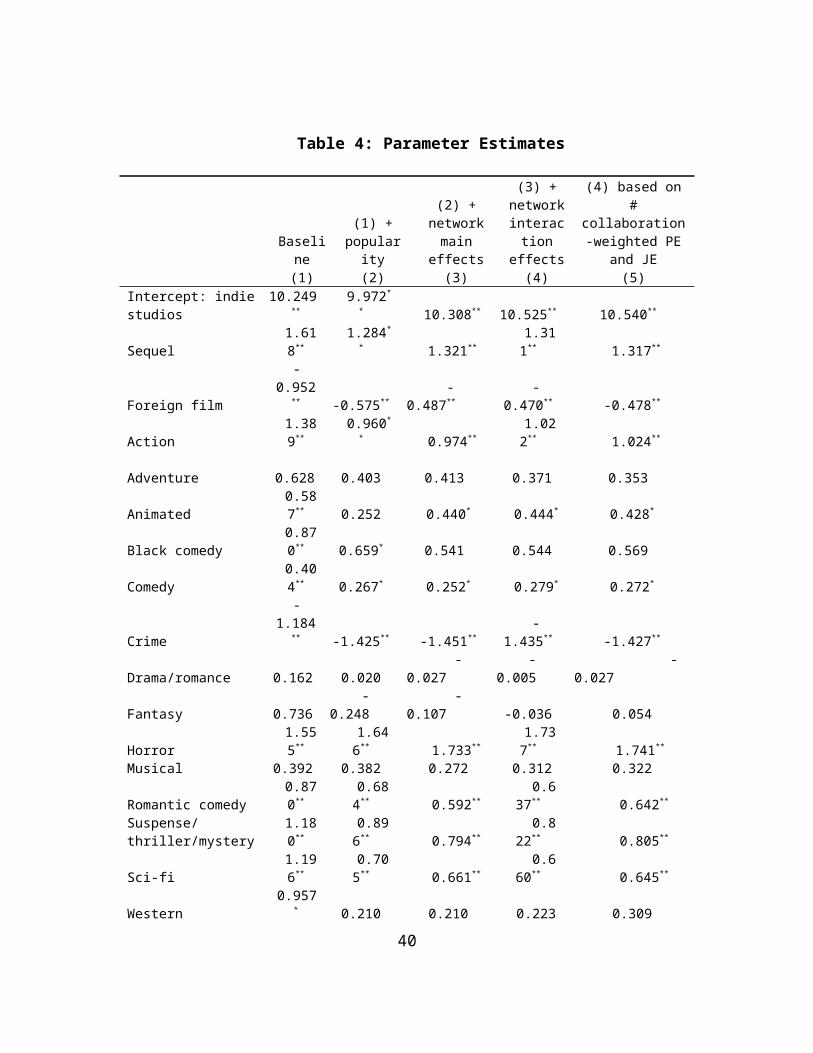
4.4 Parameter Estimates
Effects of movie characteristics. Parameters of movie characteristics make intuitive
sense across all models: sequels, MPAA rated, Oscar nominated, and those receiving favorable
consumers’ and critics’ reviews accrue higher revenues. In contrast, foreign films, crime genre
films, and those with faster revenue decay generate lower revenues. All of the studio fixed
effects except for that of United Artists, are significant and positive, confirming our expectation
that movies released by larger studios accumulate higher box office. We omit reporting the
studio fixed effects for simplicity of exposition. Popularity of the cast and crew significantly
affects movie box office (Model 2).
Table 4: Parameter Estimates
Baseline(1) +
popularity
(2) + network main
effects
(3) + network interaction effects
(4) based on # collaboration-
weighted PE and JE
11 Although not reported in Table 4, two additional models were estimated: Model 1 plus the main effects of PE and JE, and Model 1 plus the main and interaction effects of PE and JE. Comparing these two models with Models 3 and 4 shows that when popularity effects are considered, unsurprisingly, the effects of PE remain significant, although they become smaller in size.
24

(1) (2) (3) (4) (5)Intercept: indie studios 10.249** 9.972** 10.308** 10.525** 10.540**
Sequel 1.618** 1.284** 1.321** 1.311** 1.317**
Foreign film -0.952** -0.575** -0.487** -0.470** -0.478**
Action 1.389** 0.960** 0.974** 1.022** 1.024**
Adventure 0.628 0.403 0.413 0.371 0.353Animated 0.587** 0.252 0.440* 0.444* 0.428*
Black comedy 0.870** 0.659* 0.541 0.544 0.569Comedy 0.404** 0.267* 0.252* 0.279* 0.272*
Crime -1.184** -1.425** -1.451** -1.435** -1.427**
Drama/romance 0.162 0.020 -0.027 -0.005 -0.027Fantasy 0.736 -0.248 -0.107 -0.036 0.054Horror 1.555** 1.646** 1.733** 1.737** 1.741**
Musical 0.392 0.382 0.272 0.312 0.322Romantic comedy 0.870** 0.684** 0.592** 0.637** 0.642**
Suspense/thriller/mystery 1.180** 0.896** 0.794** 0.822** 0.805**
Sci-fi 1.196** 0.705** 0.661** 0.660** 0.645**
Western 0.957* 0.210 0.210 0.223 0.309G-rated 1.765** 1.566** 1.680** 1.613** 1.620**
PG13-rated 1.639** 1.448** 1.495** 1.325** 1.386**
PG-rated 1.767** 1.447** 1.381** 1.429** 1.339**
R-rated 0.613** 0.569** 0.551** 0.473** 0.461**
NC17-rated 0.894 0.850 0.811 0.724 0.644Consumer rating 0.129** 0.107** 0.086* 0.092* 0.103**
Critics rating 0.113** 0.146** 0.159** 0.156** 0.147**
Oscar nomination 1.470** 1.171** 1.072** 1.068** 1.135**
Quality decay -0.285** -0.281** -0.275** -0.273** -0.277**
Studio fixed effects Y Y Y Y YPE: cast 0.287** 0.265** 0.157**
PE: crew 0.076 0.040 -0.016JE: cast -0.073 -0.059 0.000JE: crew 0.186** 0.169** 0.225**
PE: cast x indie 0.216 0.055PE: crew x indie 0.441** 0.813**
JE: cast x indie -0.111 -0.033JE: crew x indie -0.010 -0.165Popularity: cast 0.024** 0.019** 0.018** 0.015**
Popularity: crew 0.023** 0.019** 0.019** 0.014**
Adjusted R-square 0.683 0.720 0.729 0.731 0.729Notes:1 Both PE and JE are standardized so that their corresponding parameters are comparable.2 Significance at 0.05 is denoted by ** and at 0.10 by *.3 The baseline genre is biography/documentary. The baseline MPAA rating is unrated.
25
Effects of PE. To assess the relationship between network embeddedness and box office,
we start with Model 3. Note that since PE and JE are standardized in the analysis, we can directly
compare the magnitude of their effects within and across functional roles. Model 3 reveals that
the PE effect for the cast is positive (τ1 , cast = .287) and significant at 0.05, after controlling for
the cast and crew’s popularities, indicating that higher PE for the cast is associated with elevated
revenues. However, the PE effect for the crew is not significant. The positive PE effect persists
in Model 4 where interaction effects between network embeddedness and the type of studio are
taken into account. These findings indicate that, again, PE of the cast, but not of the crew,
contributes to revenues. Echoing our earlier discussions, we attribute this result to cross-
functional differences such that ties to well-connected others provide the cast with heightened
image and reputation, which in turn may enhance media attention and marquee appeal. However,
such capabilities are significantly less important for the crew.
Effects of JE. Model 3 shows that the effect of the crew’s JE (τ 2 , crew = .186) is positive
and significant at 0.05, while the cast’s JE is non-significant. These results persist even when the
interaction effects are accounted for in Model 4. These findings reveal that the crew’s, but not
the cast’s, JE contributes to box office success. As reasoned earlier, a crew occupying a position
that bridges sub-communities of the network may draw greater technical knowledge, creativity,
and methods from more varied sources, potentially boosting product quality to a higher level.
Moderation by studio affiliation. As predicted, we observe a significant and positive
interaction between the crew’s PE and studio affiliation (e.g., τ 3, crew = .441 in Model 4). This
result indicates that the crew’s PE provides a much needed extra signal of a film’s quality for
indie films that lack brand recognition enjoyed by major studio films. However, we did not find
26

the predicted interaction of PE for an indie film’s cast, suggesting that the cast’s connections to
well-connected others (PE) are important regardless of the studio’s overall marketing resources.
In other words, PE of an indie film’s cast does not add extra benefit beyond its main effect
contribution to box office. Lastly, as expected, we did not find interaction effects of the studio
affiliation and JE of the cast or crew.
In summary, this analysis reveals that a film achieves greater box office if developed by a
high PE cast who has collaborated with well-connected others and a high JE crew who bridges
diverse sub-communities in the industry. While the movie literature has focused on the effects of
product- and consumer- related factors on box office, we demonstrate the important
contributions of the movie’s core development team, whereby each team member draws
knowledge and skills through prior collaborations to support his or her role-driven contribution
to a film’s revenues. These previously undocumented findings represent important
considerations for critical managerial decisions on product team formation before millions of
dollars in development costs are incurred.
4.5 Managerial Implications
The proposed conceptual framework and methodology lead to important and practical
guidance to film studios and talents, and more broadly, for new product team assembly in other
industries. First, faced with a large and constant flux of talents, how do producers assess the
cost/benefit involved in hiring a new-comer (i.e., a person with limited network embeddedness)
versus an “old hand” (i.e., a person with high network embeddedness) in the industry? Our
approach offers a model-based evaluation of this and related tradeoffs by predicting the
cumulative box office revenues based on either scenario. In the same vein, when one talent
27
becomes unavailable and alternatives are considered, our approach can readily forecast the
potential box office gain or shortfall when considering alternative team members.
For a second example, when deciding among a roster of potential candidates for the cast
and crew, producers may utilize the proposed approach as an effective decision aid to assemble a
“dream team” that complements auditions, interviews and the recommendations of professional
talent agencies. With insider information on budget, salary cap, and negotiation stance, a
producer who has a revenue goal in mind may conduct a tradeoff analysis or optimization
exercise to derive a team with a minimum salary and maximum box office potential.
Related to the above, a third question is whether the producer faced with skyrocketing
salaries should resort to a “star strategy” focusing only on a star cast or a more “balanced”
strategy involving a more modest cast (lower PE) but high-value (higher JE) crew? Our research
suggests the potential of the latter strategy to help producers assemble an optimal movie team in
this cost environment.
In addition to offering managerial guidance to studio executives and producers, our
findings shed light on career management by the cast and crew themselves in a highly
competitive industry. Theoretically and empirically, this research reveals that an actor or actress
should focus on collaborating with well-connected others, while a crew member may be better-
off seeking diverse collaborations. Thus, when selecting which film projects might maximize
one’s own career trajectory, an industry professional should be cognizant of how his/her
potential team mates’ collaborative history could influence his/her own future success.
28

5. DISCUSSION
This research contributes to the literature on movie marketing, collaborative networks,
and new product development along several important dimensions. Theoretically, our conceptual
framework accentuates the importance of the development team to product success, moving
beyond the conventional focus on product or consumer traits in the movie marketing literature. It
takes a network perspective by proposing that team members’ contributions to a film arise from
their positions in the industrial network, and thus their opportunities and capabilities to draw
knowledge and skills accrued from past collaborative experiences. The conceptual framework
also reveals an important, potentially divergent relationship between box office and network
embeddedness of the cast versus the crew. In doing so, it expands the marketing and sociology
literatures’ focus on a single function and allows us to address a key managerial challenge of
team assembly. It further proposes and partially validates a moderator (studio affiliation) in the
relationship between box office and a team’s network embeddedness. While past research offers
evidence of the value of a star cast, this research reveals a more nuanced picture, suggesting a
crew that has worked in diverse “regions” of the industry can be as important as a well-
connected cast.
From a substantive perspective, the proposed methodological framework provides
producers and movie studios a new decision making tool in assembling an optimal movie team.
The conceptual framework and methodology may also be generalized to other entertainment,
media, and technology industries, or firms sharing characteristics similar to the movie industry,
such as relatively fluid formation and dissolution of product development teams and distinct
roles within each team.
29
Despite these contributions, this research has limitations and thus points to promising
avenues of future research. For example, future research may investigate the evolution of
network embeddedness within an individual and further address self-selection into teams. This is
a complex yet intriguing area of research as it involves dynamic and endogenous network
evolution, a challenging topic that is receiving growing research attention in the marketing and
statistics communities. Our research is also limited in scope by focusing on a team member’s
connections to others outside, instead of within, the team. This focus was driven by the existence
of research that has already examined past collaborations among team members in collaboration
networks (i.e. team cohesion; Mehra, Dixon, and Brass 2006; Sparrowe et al. 2001; Uzzi and
Spiro 2005).
Furthermore, while our modeling tactics alleviate endogeneity of the network measures,
additional control variables such as advertising spending were not available for analysis; other
potential sources of endogeneity may exist as well. Readers therefore should keep in mind that
our results may remain subject to some endogeneity bias. Nonetheless, we believe that this
research takes an important step towards quantifying team members’ contributions as they arise
from their network positions and across functional roles, shedding a critical light on film (and
more generally, new product) team formation in the early stages of product development.
30

REFERENCES
Abadir, K. M. and J. R. Magnus (2005). Matrix Algebra. Cambridge: Cambridge University Press, pages 158-174.
Ahuja, M. K., D. F. Galletta, and K. M. Carley (2003), “Individual Centrality and Performance in Virtual R & D Groups: An Empirical Study,” Management Science, 49 (1), 21-38.
Agrawal, J. and W. A. Kamakura (1995), “The Economic Worth of Celebrity Endorsers: An Event Study Analysis,” Journal of Marketing, 59 (3), 56-62.
Ainslie, A., X. Drèze, and F. Zufryden (2005), “Modeling Movie Lifecycles and Market Share,” Marketing Science, 24 (3), 508-517.
Albert, S. (1998), “Movie Stars and the Distribution of Financially Successful Films in the Motion Picture Industry,” Journal of Cultural Economics, 22, 249-270.
Armstrong, J. A. (2013), “In Focus: Quentin Tarantino. A 20 Year Retrospective Look Back at Quentin Tarantino’s Reservoir Dogs,” (accessed June 27, 2013), [available at http://www.filmoa.com/magazine/ reservoir-dogs-a-film-that-changed-the-landscape].
Arranz, N. and J. C. Fdez De Arroyabe (2012),”Effect of Formal Contracts, Relational Norms and Trust on Performance of Joint Research and Development Projects,” British Journal of Management, 23 (4), 575-588.
Baker, W. E. and R. R. Faulkner (1993), “The Social Organization of Conspiracy: Illegal Networks in the Heavy Electrical Equipment Industry,” American Sociological Review, 58 (6), 837-860.
Basuroy, S., S. Chatterjee, and S. Abraham Ravid (2003), “How Critical Are Critical Reviews? The Box Office Effects of Movie Critics, Star Power and Budgets,” Journal of Marketing, 67 (4), 103-117.
Bettman, J. R., M. F. Luce, and J. W. Payne (1998), “Constructive Consumer Choice Processes,” Journal of Consumer Research, 25 (3), 187-217.
Bonacich, P. (1987), “Power and Centrality: A Family of Measures,” American Journal of Sociology, 92, 1170-1182.
Bound, J., D. A. Jaeger, and R. M. Baker (1995), “Problems With Instrumental Variables Estimation When the Correlation Between the Instruments and the Endogenous Explanatory Variable is Weak,” Journal of the American Statistical Association, 90 (430), 443-450.
31

Brandes, U. (2001), “A Faster Algorithm for Betweenness Centrality,” Journal of Mathematical Sociology, 25, 163-177.
Burt, R. S. (2000), “The Network Structure of Social Capital,” Research in Organizational Behavior, R. I. Sutton and B. M. Staw, eds. Greenwich, CT: JAI Press.
-------- (2002), “The Social Capital of Structural Holes,” in The New Economic Sociology, Mauro F. Guillen, Randall Collins, Paula England, and Marshall Meyer, eds. New York, NY: Russell Sage.
Cattani, G. and S. Ferriani (2008), “A Core/Periphery Perspective on Individual Creative Performance: Social Networks and Cinematic Achievements in the Hollywood Movie Industry,” Organization Science, 19 (6), 824-844.
Cross, R. and J. N. Cummings (2004), “Ties and Network Correlates of Individual Performance in Knowledge-Intensive Work,” Academy of Management Journal, 47, 928-937.
Delmestri, G., F. Montanari, and A. Usai (2005), “Reputation and Strength of Ties in Predicting Commercial Success and Artistic Merit of Independents in the Italian Feature Movie Industry,” Journal of Management Studies, 42 (5), 975-1002.
Desai, K. K. and S. Basuroy (2005), “Interactive Influence of Genre Familiarity, Star Power, and Critics’ Reviews in the Cultural Goods Industry: The Case of Motion Pictures,” Psychology & Marketing, 22 (3), 203-223.
Elberse, A. (2007), “The Power of Stars: Do Star Actors Drive the Success of Movies?” Journal of Marketing, 71 (October), 102-120.
-------- and J. Eliashberg (2003), “Demand and Supply Dynamics for Sequentially Released Products in International Markets: The Case of Motion Pictures,” Marketing Science, 22 (3), 329-354.
Eliashberg, J., A. Elberse, and M.A.A.M. Leenders (2006), “The Motion Picture Industry: Critical Issues in Practice, Current Research, and New Research Directions,” Marketing Science, 25 (6), 638-661.
-------- and S. M. Shugan (1997), “Film Critics: Influencers or Predictors?” Journal of Marketing, 61 (April), 68-78.
Erdogan, B. Z. (1999), “Celebrity Endorsement: A Literature Review,” Journal of Marketing Management, 15 (4), 291-314.
Faust, K. (1997), “Centrality in Affiliation Networks,” Social Networks, 19 (2), 157-191.
Forbes (2014), “Hollywood's Highest Paid Actors 2014,”
32

http://www.forbes.com/pictures/mfl45ekhem/the-highest-paid-actors/
Freeman, L. C. (1979), “Centrality in Social Networks: Conceptual Clarification,” Social Networks, 1 (3), 215-39.
Gopinath, S., P. K. Chintagunta, and S. Venkataraman (2013), “Blogs, Advertising, and Local-Market Movie Box Office Performance,” Management Science, 59 (12), 2635-2654.
Granovetter, N. (1973). “The strength of weak ties,” American Journal of Sociology, 78, 1360-1380.
Grewal, R., G. L. Lilien, and G. Mallapragada (2006), “Location, Location, Location: How Network Embeddedness Affects Project Success in Open Source Systems,” Management Science, 52 (7), 1043-1056.
Guimera, R., B. Uzzi, J. Spiro, and L. A. N. Amaral (2005), “Team Assembly Mechanisms Determine Collaboration Network Structure and Team Performance,” Science, 308 (5722), 697-702.
Jackson, M. O. (2008). Social and Economic Networks. Princeton, NJ: Princeton University Press.
Krider, R. E. and C. B. Weinberg (1998), “Competitive Dynamics and the Introduction of New Products: The Motion Picture Timing Game,” Journal of Marketing Research, 35 (February), 1-15.
Krishnan, N. (1984), “Matrix Algebra: An Introduction,” Quantitative Applications in the Social Sciences Series #38, Thousand Oaks, CA: Sage, pages 79-87.
Luo, L., J. (X.) Chen, J. Han, and C. W. Park (2010), “Dilution and Enhancement ofCelebrity Brands through Sequential Movie Releases,” Journal of Marketing Research, 47 (6), 1114-1128.
Madhavan, R. and R. Grover (1998), “From Embedded Knowledge to Embodied Knowledge: New Product Development as Knowledge Management,” Journal of Marketing, 62 (4), 1-12.
McClintock, P. (2014), “$200 Million and Risking: Hollywood Struggles With Soaring Marketing Costs,” The Hollywood Reporter, http://www.hollywoodreporter.com/news/200-million-rising-hollywood-struggles-721818
Mehra, A., A. L. Dixon, and D. J. Brass (2006), “The Social Network Ties of Group Leaders: Implications for Group Performance and Leader Reputation,” Organization Science, 17 (1), 64-79.
33
Motion Picture Association of America (2014), “Theatrical Market Statistics 2014,” http://www.mpaa.org/wp-content/uploads/2015/03/MPAA-Theatrical-Market-Statistics-2014.pdf.
Nash Information Services (2015), “Movie Budgets,” http://www.the-numbers.com/movie/budgets/all.
Opsahl, T. F. Agneessens, and J. Skvoretz (2010), “Node Centrality in Weighted Networks: Generalizing Degree and Shortest Paths,” Social Networks, 32 (2), 245-251.
Rossi, P. (2014), “Even the Rich Can Make Themselves Poor: a Critical Examination of the Use of IV Methods in Marketing" (2014), Marketing Science, 33 (5), 655-672.
Sawhney, M. S. and J. Eliashberg (1996), “A Parsimonious Model for Forecasting Gross Box-Office Revenues of Motion Pictures,” Marketing Science, 15 (Spring), 113-131.
Scott, A. J. (2005). On Hollywood: The place, the industry. Princeton, NJ: Princeton University Press.
Sethi, R., D. C. Smith, and C. W. Park (2001), “Cross-Functional Product Development Teams, Creativity, and the Innovativeness of New Consumer Products,” Journal of Marketing Research, 38 (Feb), 73-85.
Sparrowe, R. T., R. C. Liden, S. J. Wayne, and M. L. Kraimer (2001), “Social Networks and the Performance of Individuals and Groups,” Academy of Management Journal, 44 (2), 316-325.
Uzzi, B. and J. Spiro (2005), “Collaboration and Creativity: The Small World Problem,” American Journal of Sociology, 111 (2), 447-504.
Variety (2012). Slanguage Dictionary. Reed Elsevier Inc. http://variety.com/static-pages/slanguage-dictionary/#m.
Vogel, H. L. (2004). Entertainment Industry Economics: A Guide for Financial Analysis. 6th Ed. Cambridge University Press: Cambridge, UK.
Wasserman, S. and K. Faust (1994). Social Network Analysis: Methods and Applications. New York: Cambridge University Press.
Waterman, D. (2005). Hollywood’s road to riches. Cambridge, MA: Harvard University Press.
Watts, D. J. and S. H. Strogatz (1998), “Collective Dynamics of ‘Small-World’ Networks,” Nature, 393 (June), 440-442.
34

Zukin, S. and P. J. DiMaggio (1990). Structures and Capital: The Social Organization of the Economy. Cambridge University Press, New York.
35

APPENDIX
Appendix A. Illustrative Collaboration Network and Calculation of Network Statistics
As is typical in the analysis of large social networks, the complexity of the data we observe makes it cumbersome to demonstrate how our statistics of network embeddedness are derived from the actual data. For brevity, we offer an illustrative example of a collaboration network focusing on two hypothetical movies released in 2004 (Movies A and B) by extracting a collaboration history for these movies and their NPD team members from four hypothetical movie released in the lagged 10-year network over 1994-2003 (Movies C-F). Figure A1 presents the hypothetical data observed and PE and JE that would result from this data set. Figure A2 presents visualizations of the two- and one- mode networks generated from the data. The “two-mode” visualization connects people (circles) to the movie teams on which they collaborated (squares). The one-mode projection on persons (circles) presents ties between persons who have worked together on at least one movie. The one-mode projection on movies (squares) connects movies that share at least one team member.
Junctional Embeddedness (JE). To calculate JE in Equation 3 for persons on the Movie A team, we first find the proportion of the shortest paths between all pairs of persons (i.e. dyads) who are not members of the Movie A team that pass through Movie A’s team members. The shortest paths are those that require the fewest steps between any dyad independent of Movie A’s team members. For example, the two shortest paths between Persons 4 and 7 are “4-2-1-7” and “4-2-8-7” (with path length = 3). Movie A’s team member, Smith (Person 1), lies on the shortest path for three dyads (the paths connecting Persons 4 to 7, 5 to 7, and 6 to 7). For each of these three dyads, Smith is on 50% of the shortest paths (the rest go through Nayar (Person 8)), providing the numerator in Equation 3 for Smith. Calculation of Smith’s denominator in this equation requires the number of persons in the network (n = 9) and Movie A’s team size (g = 3). It is hence (9-3)*(9-3-1)/2=15. Following Equation 3, Smith’s JE is 3*(.5/15) = .03. As can be observed in the one-mode projection for persons in Figure A2, Wong (Person 2) holds an even stronger junctional position in the network than Smith as Wong lies on shortest paths for nearly all collaborations bridging the two sides of this network. In contrast, all other persons lie on the “outside edges” of the network, and do not bridge other collaborators.
Positional Embeddedness (PE). Since a simultaneous linear equation system is used to produce the standard eigenvalue and eigenvector calculations underlying PE in Equation 2, it is not feasible to manually demonstrate the development of this measure. However, intuition for this measure can be gained by comparing the individual statistics for PE presented in Figure A1 against the one-mode (person) visualization in Figure A2. For instance, Wong (Person 2) holds the maximal positional embeddedness in this network (PE = 1) due to both the number of collaborations he holds (ties = 7) and the “connectedness” of his ties (e.g. Persons 1 and 6 also possess high PE). In contrast, the person with the lowest PE, Li (Person 4), has several ties (ties = 4), but has collaborated with poorly-connected others. In most physics-based network visualizations, nodes with high PE (or other eigenvector-based centrality measures) will appear deep in the network’s core, as can be observed for Wong (Person 2) in Figure A2.
36

Figure A.1: Illustrative Data of A Collaboration Network
Raw Data 2004 Individual-level EmbeddednessPerson Name Movie Year Person Name JE PE1 Smith A 2004 1 Smith 0.03 0.702 Wong A 2004 2 Wong 0.43 1.003 Fleur A 2004 3 Fleur 0.00 0.424 Li B 2004 4 Li 0.00 0.305 James B 2004 5 James 0.00 0.506 Ortega B 2004 6 Ortega 0.00 0.591 Smith C 20027 Page C 2002 2004 Team-level Embeddeddness8 Nayar C 2002 Movie JE PE1 Smith D 1999 A 0.15 0.712 Wong D 1999 B 0.00 0.469 Gold D 19998 Nayar D 19992 Wong E 19974 Li E 19976 Ortega E 19972 Wong F 19954 Li F 19955 James F 1995
Figure A.2
37
Appendix B. Calculating Eigenvalues and Eigenvectors
Let e be an n x n matrix. And is an eigenvalue of e if there exists a non-zero vector v such that
ev = v.In this case, vector v (or PE in our context) is called an eigenvector of e corresponding to . We can rewrite the condition ev = v as follows:
(e − I)v = 0,where I is the n x n identity matrix. For a non-zero vector v to satisfy this equation, e − I must not be invertible. That is, the determinant of e − I must equal 0. Call p() = det (e −I) the characteristic polynomial p of e. The eigenvalues of e are the roots of the characteristic polynomial of e.
For example,
Let e = [ 2 −4−1 −1 ]
.
Then p() = det [2−λ −4−1 −1−λ ]
= (2−) (−1−) − (−4) (−1) 2 − − 6 = ( − 3) ( + 2)
Thus, 1 = 3 and 2 = −2 are the eigenvalues of e.To find the eigenvectors corresponding to these eigenvalues, solve the system of linear
equations given by(e − I)v = 0.
For example, to solve for the eigenvectors corresponding to 1 = 3, let v = [v 1
v 2] . Then (e − 3I)v = 0 gives us
[2−3 −4−1 −1−3 ][v 1
v 2]=[00 ]
, from which we obtain the duplicate equations
−v1 − 4v2 = 0−v1 − 4v2 = 0.
38

If we let v2 = t, then v1 = −4t. All eigenvectors corresponding to 1 = 3 are
multiples of[−4
1 ] and thus the eigenspace corresponding to 1 = 3 is given
by the span of [−41 ]
.Appendix C. Visualization of the 1994-2003 Network
The graph visualization below shows the 1994-2003 network used to evaluate the impact of network embeddedness on the revenues of 2004 movie releases. The image is a one-mode graph projection of movies (n = 3,268; see Appendix A for alternative mode examples). Here, movies are represented as black dots, with grey lines linking movies shared by common collaborators. The visualization is physics-based (OpenOrd using Gephi); that is, the distance between any two movies depends on the number of collaboration ties among the core team members on those two movies. Labels describe selected examples of major visible clusters in the network. Movies for which no core team members have worked on a movie project with others in the network appear as isolated dots.
39
40