Embed Size (px)
Citation preview

Prevention and early diagnosis of tyPe 2 diaBetes
tHe nHs HealtH CHeCK PrograMMe
LET’S GET IT RIGHT

FoREwaRd 3
SummaRy 4
nHS HEaLTH cHEck pRoGRammE 6
appEndIX: naTIonaL and REGIonaL STaTISTIcS
National data 12 Northern and Yorkshire 17 Midlands 18
Eastern 19
London 20
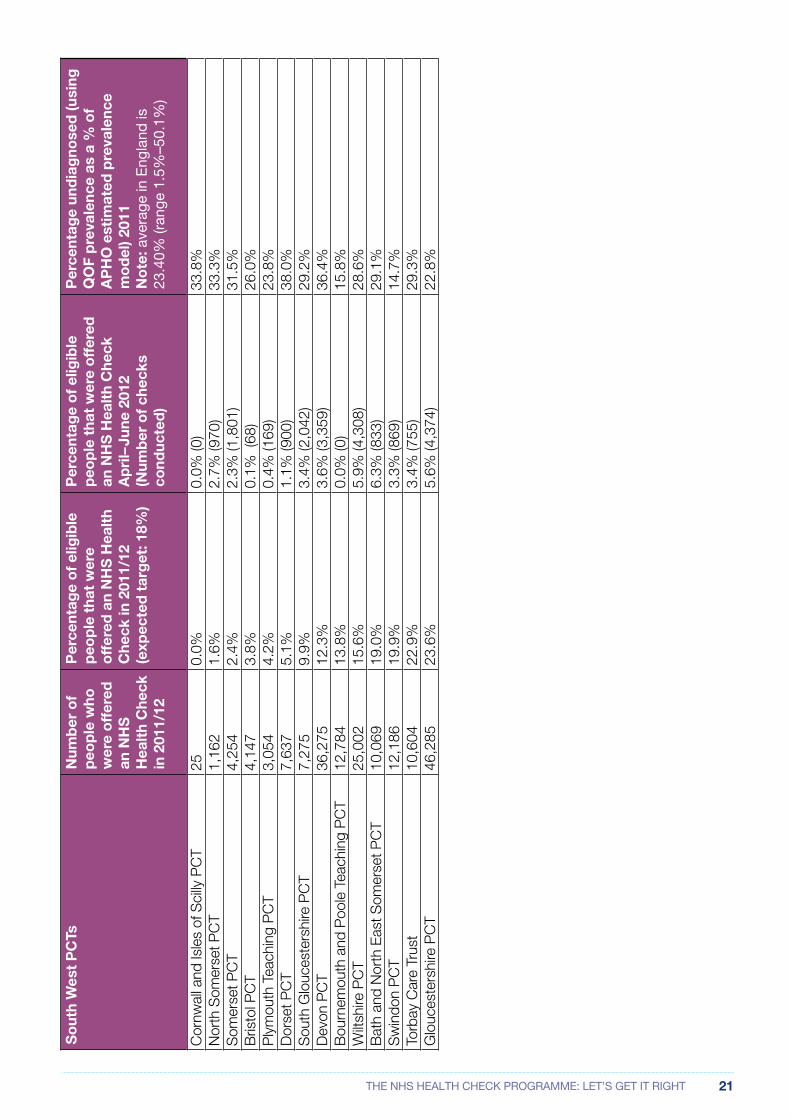
South West 21
South East 22
North West 23
Contents

3THE NHS HEALTH CHECK PROGRAMME: LET’S GET IT RIGHT
foreWordDiabetes is the number one health threat in the UK. Currently 3.7 million people are living with the condition, with a further seven million at high risk of developing Type 2 diabetes. It’s a condition that costs the NHS over £10 billion a year, yet 80 per cent of these costs are spent on complications that are, with good care, avoidable. The number of people with Type 2 diabetes in the UK is rising rapidly and is set to reach five million by 2025. Half of the people with Type 2 diabetes already have serious complications when they are diagnosed.
It is imperative that we take action now to stem the rising tide of Type 2 diabetes and the massive human and economic costs associated with this serious long-term condition. A key aspect of tackling the rise in Type 2 diabetes and its devastating and costly complications is to bridge the gap between anticipated prevalence and those diagnosed. Currently about 850,000 people with Type 2 diabetes remain undiagnosed and the gap between actual and expected rates is closing only very slowly.
The NHS Health Check programme, launched four years ago by the Department of Health in England, has huge potential to detect people with Type 2 diabetes and to identify those at high risk, who can then be given support and lifestyle interventions to reduce their risk and prevent onset of the condition. Diabetes UK is disappointed that, so far, this potential has not been realised. Implementation of the programme has been poor and patchy at best. A number of PCTs failed to offer a single person an NHS Health Check last year and the intensive lifestyle interventions, that are essential to the effectiveness of the programme in preventing Type 2 diabetes, are not being comprehensively commissioned. There is considerable variation in the way that PCTs have delivered the programme, and, despite a strong policy focus in the Department of Health, the overall implementation of the programme has been poor.
In April next year the responsibility for commissioning the NHS Health Check programme will shift to local authorities as part of their new public health duties. Diabetes UK is concerned about the impact of this transfer on the future sustainability of the programme and the potential for further variation in its implementation at a local level.
It will be more important than ever in the new environment to ensure the effective implementation of the NHS Health Check programme, and the follow up action, to diagnose and prevent Type 2 diabetes in those found to be at high risk. We want to see a national implementation team for the NHS Health Check programme established within Public Health England and assurance that local authorities will be fully funded to commission the NHS Health Check programme in its entirety.
Barbara young Chief Executive, Diabetes UK
September 2012

4 THE NHS HEALTH CHECK PROGRAMME: LET’S GET IT RIGHT
sUMMaryThe nHS Health check programme can improve diabetes health outcomes by:
• Identifying people with Type 2 diabetes who can then be treated to improve clinical outcomes.
• Reducing future complications through earlier diagnosis and management of the condition.
• Identifying people with pre-diabetes who can then be supported to avoid developing the condition.
• Reducing the rate of increase of diabetes over time, by identifying those at increased risk who would benefit from lifestyle interventions to reduce their risk of developing Type 2 diabetes.
However in 2011–2012:
• Only 36 PCTs set the recommended target of offering an NHS Health Check to 18 per cent of their eligible population.
• 42 PCTs had lower targets in place.
• Seven PCTs offered an NHS Health Check to less than 1 per cent of their eligible population and three PCTs did not offer a single person an NHS Health Check in 2011–12.
• Over half (58 per cent) of the PCTs in England offered Health Checks to less than 18 per cent of their eligible population in 2011–12.
• Only three quarters (77 per cent) of the NHS Health Checks expected to be offered in 2011–12 have been offered.
• Only half (51.6 per cent) of the NHS Health Checks offered have been taken up.
diabetes uk is concerned that:
• Less than 40 per cent of those who could benefit from an NHS Health Check received one in 2011–12.
• This compares poorly with cervical cancer screening which achieves 78 per cent uptake and breast cancer screening (77 per cent).
If the nHS Health check programme had been implemented effectively in 2011–12:
• 9,500 more people could have been diagnosed with Type 2 diabetes and started to manage their condition to help prevent further complications.
• Many more cases of Type 2 diabetes could have been prevented through referral to interventions to reduce risk, producing a gross saving for the NHS.
There is a wide variation in the way the nHS Health check programme is delivered and the performance achieved:
• In 2011–12, some PCTs offered an NHS Health Check to over 25 per cent of the eligible population, but others have offered less than 2 per cent.
• There are concerns that the intensive lifestyle interventions recommended by NICE for people at high risk of Type 2 diabetes are not being commissioned comprehensively and opportunities to prevent thousands of cases of Type 2 diabetes are being missed.
See the appendix for local PCT data.

5THE NHS HEALTH CHECK PROGRAMME: LET’S GET IT RIGHT
The Government must ensure the nHS Health check programme is fully and effectively implemented:
• The Department of Health should require Public Health England to establish a national implementation team for the NHS Health Check programme.
• The Government’s forthcoming cardiovascular disease outcome strategy must ensure the effective implementation of the NHS Health Check programme and the follow-up action to diagnose and prevent Type 2 diabetes in those found to be high risk.
• The Department of Health and Public Health England should ensure that the implementation of the NHS Health Check programme does not decline during the transition from NHS to local government.
• Local authorities should be fully funded from 2013 to commission the NHS Health Check programme and follow up interventions.
• Local authorities should ensure delivery of the NHS Health Check programme.
• Local authorities should ensure that effective mechanisms exist to refer those found to have diabetes to appropriate healthcare and to refer those at high risk to effective lifestyle change programmes.
• The Department of Health and Public Health England should raise awareness of the benefits of an NHS Health Check and people’s rights to a free Check.
• An NHS Health Check should be equally accessible to everyone who is eligible. There should be targeted action to reduce geographical variation and effective action to ensure those in high risk groups receive an NHS Health Check.
• NICE Public Health Guidance on Preventing Type 2 Diabetes: Risk Identification and Interventions for Individuals at High Risk should be fully implemented.
• Those commissioning the NHS Health Check programme should collaborate with local and national community risk assessment programmes and awareness raising campaigns to increase reach, in particular across those groups the NHS traditionally fails to reach, eg through Diabetes UK roadshows.
• There should be effective signposting to organisations providing information and advice to support people to adopt healthier lifestyles and reduce their risk of Type 2 diabetes (and other conditions).

6 THE NHS HEALTH CHECK PROGRAMME: LET’S GET IT RIGHT
nHs HealtH CHeCK PrograMMe
wHy an nHS HEaLTH cHEck IS ImpoRTanT FoR THE pREvEnTIon and EaRLy dIaGnoSIS oF TypE 2 dIaBETES
diabetes is increasing at a rapid rate
Health experts agree that the UK is facing a huge increase in the number of people with diabetes. Since 1996 the number of people diagnosed with diabetes has increased from 1.4 million to 2.9 million. By 2025 it is estimated that five million people will have diabetes. Most of these cases will be Type 2 diabetes because of our ageing population and rapidly rising numbers of overweight and obese people.
The figures are alarming and confirm that diabetes is one of the biggest health challenges facing the UK today. The prevalence of diabetes is nearly four times higher than the prevalence of all cancers combined and is still rising.
pREvaLEncE TREndS – EnGLand (2006–2010)
Diabetes
Cancer cells
Coronary Heart Disease
Stroke and transient ischaemic attack
Linear (Cancer cells)
UnadjustedPrevalence %
2006–07 2007–08 2008–09 2009–10
6
5
4
3
2
1
0
If we are to curb this growing health crisis and see a reduction in the number of people dying from diabetes and its complications, we need to increase awareness of the risks, identify those at risk and support major changes in lifestyle for these people. About 850,000 people with Type 2 diabetes remain undiagnosed and may present with advanced retinopathy, neuropathy or arterial disease. By the time they are diagnosed 50 per cent of people with Type 2 diabetes show signs of complications1. Diabetes causes 24,000 excess deaths per year2.
One in seven people are at high risk of developing Type 2 diabetes3. On average, currently only 75 per cent of the expected cases of diabetes are detected in PCTs in England and the gap between actual and expected rates is closing at a very slow rate4.
Before people develop Type 2 diabetes they almost always have pre-diabetes5. Around 15 per cent of the population have pre-diabetes and the evidence for prevention in this group is unequivocal6.
1 Diabetes UK. (2009). State of Diabetes Care
2 The NHS Information Centre. (2011). The National Diabetes Audit 2007–8 Mortality Analysis
3 UK National Screening Committee, University of Leicester. (March 2008). The Handbook for Vascular Assessment, Risk Reduction and Risk Management
4 APHO and QOF data .(2011).
5 Pre-diabetes refers to Impaired Glucose Tolerance (IGT), Impaired Fasting Glycaemia (IFG) or Impaired Glucose Regulation (IGR)
6 Gillies CL et al. (2007). Pharmacological and Lifestyle Interventions to Prevent or Delay Type 2 Diabetes in People with Impaired Glucose Tolerance: Systematic Review and Meta-Analysis. BMJ; 334-299

7THE NHS HEALTH CHECK PROGRAMME: LET’S GET IT RIGHT
who is at risk?
Around three people are diagnosed with diabetes every 10 minutes in the UK7. Obesity, being overweight, physical inactivity, poor diet, high blood pressure, high levels of fats in the blood (dyslipidaemia) and higher than normal levels of blood glucose levels (Impaired Glucose Regulation/pre-diabetes) all increase the risk of Type 2 diabetes. The more risk factors a person has, the higher the chances of developing Type 2 diabetes.
The most deprived people in the UK are two-and-a-half times more likely than average to have Type 2 diabetes at any given age8.
Type 2 diabetes is up to six times more common in people of South Asian descent and up to three times more common among people of African and African-Caribbean origin9.
Diagnosed diabetes is almost four times as prevalent in Bangladeshi men, and almost three times as prevalent in Pakistani and Indian men compared with men in the general population. Among women, diabetes is more than five times as likely among Pakistani women, at least three times as likely in Bangladeshi and Black Caribbean women, and two-and-a-half times as likely in Indian women, compared with women in the general population10.
nHS Health checks can identify those at risk and facilitate early diagnosis
NICE guidance11 supports the NHS Health Check programme as a principal means of screening to identify people with, and at risk of, Type 2 diabetes.
It is estimated that up to 19,000 cases of diabetes could be detected early each year in England through the NHS Health Check programme, producing a gross saving of £1m a year over four years12. In addition, up to 9,700 cases of Type 2 diabetes could be prevented each year through non-diabetic hyperglycaemia (pre-diabetes13) detection producing a gross saving of £40m a year over four years14.
Overall NHS Health Checks could produce a gross saving of £132m a year over 10 years (averted strokes, averted MIs, Type 2 diabetes prevented and detected early, CHD detected early)15.
wHaT IS an nHS HEaLTH cHEck?An NHS Health Check is a face-to-face risk assessment conducted by a fully trained practitioner. It aims to identify a person’s level of risk, allowing people to reduce the risks of Type 2 diabetes (and other conditions). It is expected that about half those attending will go on to have a blood glucose test after having been identified as high risk for Type 2 diabetes. NICE guidance recommends a two-stage process for early diagnosis of people with, or at risk of, diabetes: risk assessment followed by testing if people are high risk. This should be integrated into the NHS Health Check programme, and commissioners should make arrangements for the local NHS Health Check programme to be commissioned16. In addition, these
7 Diabetes UK (April 2012). Diabetes in the UK 2011/12: Key Statistics on Diabetes
8 Diabetes UK (April 2012). Diabetes in the UK 2011/12: Key Statistics on Diabetes
9 Diabetes UK (April 2012). Diabetes in the UK 2011/12: Key Statistics on Diabetes
10 Diabetes UK (April 2012). Diabetes in the UK 2011/12: Key Statistics on Diabetes
11 NICE Public Health Guidance 38 (July 2012). Preventing Type 2 Diabetes: Risk Identification and Interventions for Individuals at High Risk
12 NHS Diabetes and Kidney Care. (16 November 2011). The NHS Health Check programme Evidence base www.healthcheck.nhs.uk/_PresentationsandFeedback.aspx
13 Pre-diabetes refers to Impaired Glucose Tolerance (IGT), Impaired Fasting Glycaemia (IFG) or Impaired Glucose Regulation (IGR)
14 NHS Diabetes and Kidney Care. (16 November 2011). The NHS Health Check programme Evidence base www.healthcheck.nhs.uk/_PresentationsandFeedback.aspx
15 NHS Diabetes and Kidney Care. (16 November 2011). The NHS Health Check programme Evidence base www.healthcheck.nhs.uk/_PresentationsandFeedback.aspx
16 NICE Public Health Guidance 38. (July 2012). Preventing Type 2 Diabetes: Risk Identification and Interventions for Individuals at High Risk

8 THE NHS HEALTH CHECK PROGRAMME: LET’S GET IT RIGHT
guidelines state that there should be a focus on engaging adults from South Asian, Chinese, African-Caribbean and Black African populations ensuring they have access to an NHS Health Check17.
The NHS Health Check programme started being implemented in England from April 2009. Fifteen million people aged 40–74 years are eligible to be offered a check every five years. It is expected that up to three million people a year will be offered an NHS Health Check and 2.2 million will this take up (75 per cent take up rate)18. The programme also aims to reduce health inequalities (including socio-economic, ethnic and gender inequalities) that result from Type 2 diabetes (and other conditions).
An NHS Health Check can be delivered in a number of settings including GP surgeries and community pharmacies19. A Department of Health guide sets out what every person should receive as the national offer of an NHS Health Check20 and states that people being offered one should be informed about the programme and what the Check entails.
Targeting priority groups
The risk factors for Type 2 diabetes are increasing in all social groups21 and it is important to make sure that all those eligible for an NHS Health Check are able to access them. Some of those most at risk of Type 2 diabetes may not access the Check in traditional NHS settings and would benefit from a more targeted approach and for Checks to be provided in a variety of community based settings.
NICE guidance22 says that people should be encouraged to have a risk assessment and recommends that Black and Minority Ethnic (BAME) adults over 25 years, people with severe mental illness and others at risk should be given tailored information about the benefits of risk assessments and where to access them. The Guidance also says that risk assessments should be provided where people at risk are to be found (for instance in long stay institutions).
who should commission and deliver nHS Health checks?
The NHS Health Check programme has had good cross-party political support and NHS Health Check is listed in the national performance measures in the NHS Operating Framework for England 2012–13. PCTs are expected to report the percentage of people eligible for the NHS Health Check programme who are offered an NHS Health Check and the number of people eligible for the programme who have received an NHS Health Check as set out in Department of Health guidance23. The same indicator is included in the public health outcomes framework24 which will be used to assess the performance of PCTs and local authorities (after 2013) in promoting public health. This data has been collected and reported by the Department of Health for the first time in 2011–12.
Responsibility for commissioning NHS Health Checks is to be transferred to local authorities from April 201325. NHS Health Checks will be one of a number of public health functions that local authorities will be mandated to commission. They will not, however, be mandated to commission the follow up action
17 NICE Public Health Guidance 38. (July 2012). Preventing Type 2 Diabetes: Risk Identification and Interventions for Individuals at High Risk
18 www.healthcheck.nhs.uk/Default.aspx
19 www.healthcheck.nhs.uk/Default.aspx
20 Department of Health. (April 2009). Putting Prevention First. NHS Health Check: Vascular Risk Assessment and Management. Best Practice Guidance
21 National Obesity Observatory. (October 2010). Adult Obesity and Socioeconomic Status
22 NICE Public Health Guidance 38. (July 2012). Preventing Type 2 Diabetes: Risk Identification and Interventions for Individuals at High Risk
23 Department of Health. (22 December 2011). Technical Guidance for the 2012/13 Operating Framework
24 Department of Health. (January 2012). Improving Outcomes and Supporting Transparency. A Public Health Outcomes Framework for England 2012–2016 www.dh.gov.uk/en/Publicationsandstatistics/Publications/PublicationsPolicyAndGuidance/DH_132358
25 Department of Health. (December 2011). Public Health in Local Government: Commissioning Responsibilities. Gateway reference: 16747

9THE NHS HEALTH CHECK PROGRAMME: LET’S GET IT RIGHT
such as tests to diagnose diabetes or the intensive lifestyle interventions for those at high risk which are essential to the clinical and cost effectiveness of the NHS Health Check programme.
paTcHy and pooR ImpLEmEnTaTIon oF THE nHS HEaLTH cHEck pRoGRammE
Despite widespread political support for the NHS Health Check programme, and a strong policy focus in the Department of Health, implementation so far has been patchy and, in many places, poor. A survey26 last year found that, in the third year of the phased implementation (2011–12), only 36 PCTs had actually set the Department of Health suggested target of offering 18 per cent of the eligible population an NHS Health Check. Only three quarters (77 per cent) of NHS Health Checks expected to be offered in 2011–12 were offered and only half (51.6 per cent) of NHS Health Checks offered have been taken up27. Diabetes UK is concerned that this means less than 40 per cent of those who could benefit from an NHS Health Check received one in 2011–12. This is low compared with the uptake of breast cancer screening (77 per cent) and cervical cancer screening (78 per cent)28.
There is also a wide variation across England in the rate of implementation. A ‘postcode lottery’ effect has been described due to the freedom that PCTs have in the funding and design of their local NHS Health Check programme29. In 2011–12, some PCTs offered an NHS Health Check to over 25 per cent of the eligible population, but others have offered less than 2 per cent (range 0 per cent to 91 per cent)30. They were expected to set a target to offer 18 per cent in the year. Some PCTs failed to offer a single person an NHS Heath Check in 2011–12. See the appendix for local PCT data.
In addition, Diabetes UK has concerns that the intensive lifestyle interventions recommended by NICE for people at high risk of Type 2 diabetes, and which are essential to achieve the aspirations of the NHS Heath Check programme in preventing cases of Type 2 diabetes, are not being commissioned comprehensively.
Reaching out to target groups
Half of the PCTs who responded to the Heart UK survey31 were providing NHS Health Checks in GP surgeries only, with 5 per cent providing it in pharmacy settings only. The remaining PCTs provided it in a number of more innovative locations, (including workplaces, pubs, public parks, walk-in centres, town centres, town halls, traveller sites, football grounds, public libraries, prisons, youth hostels, village halls, mental health centres and supermarkets).
In total, 15 PCTs responded to say that their NHS Health Checks were provided in more than just GP surgeries or pharmacies. Twenty-seven PCTs also stated that they had plans to commission NHS Health Checks from other providers. The majority of those PCTs commissioning NHS Health Checks outside of the traditional GP surgery or pharmacy setting were located in the South of the country32.
26 Heart UK. (December 2011). Cholesterol and a Healthier Nation: Shared Responsibility for Better Public Health www.heartuk.org.uk
27 Department of Health NHS Health Check. (2 June 2012). Number of eligible people that have been offered and received NHS Health Check www.dh.gov.uk/en/Publicationsandstatistics/Statistics/Performancedataandstatistics/Integratedperfomancemeasuresmonitoring/DH_129481
28 Breast Screening Programme England. (2009–10). www.ic.nhs.uk/statistics-and-data-collections/screening/breast-screening/breast-screening-programme-england-2009-10 Cervical Screening Programme England. (2010-11). www.cancerscreening.nhs.uk/cervical/statistics.html
29 Graley et al. (2011). Postcode Lotteries in Public Health – The NHS Health Check programme in North West London. BMC Public Health 11:738
30 Department of Health NHS Health Check. (28 June 2012). Number of eligible people that have been offered and received NHS Health Check www.dh.gov.uk/en/Publicationsandstatistics/Statistics/Performancedataandstatistics/Integratedperfomancemeasuresmonitoring/DH_129481
31 Heart UK. (December 2011). www.heartuk.org.uk
32 Heart UK. (December 2011). www.heartuk.org.uk

10 THE NHS HEALTH CHECK PROGRAMME: LET’S GET IT RIGHT
Evaluation
Current performance indicators only measure process, not outcome, measures which should be used to judge the success of the programme33. A national evaluation of the NHS Health Check programme has been commissioned by the Department of Health. This will examine the impact of the programme on prevalence of cardiovascular conditions, social inequalities in health and longer-term outcomes. It will be essential that the number of those receiving an NHS Health Check is increased to near the planned levels, and that the recommended interventions for those assessed at high risk of Type 2 diabetes (and other conditions) are comprehensively commissioned, in order that the programme can be properly evaluated. Failure to do this would threaten the entire programme.
How dIaBETES uk IS woRkInG To RaISE awaREnESS and pRomoTE HEaLTHy LIFESTyLES
In 2007, Diabetes UK’s Measure Up advertising and integrated awareness campaign resulted in a 29 per cent increase in awareness of the risks of diabetes amongst those at high risk of developing the condition34.
The success of the campaign led to the mobilisation of Diabetes UK’s Healthy Lifestyle Roadshows, which provide important information about how leading a healthier lifestyle can reduce your risk of developing Type 2 diabetes, as well as providing general information about the condition. Risk assessments are conducted as part of the Healthy Lifestyle Roadshows using the only validated risk assessment (Diabetes UK and Leicester University Trust Risk Score).
In 2011:
• There were 52 Diabetes UK roadshows
• Around 10,000 risk assessments were conducted
• Over 5,000 people were assessed at moderate to high risk and were referred to their GP
• 69 per cent of those who were advised to see their GP following their risk assessment have been to see or intend to see their GP.
Recall of the risk factors for Type 2 diabetes and of how to reduce risk was high two months after visiting the roadshow.
Diabetes UK provides an online risk assessment tool www.diabetes.org.uk/riskscore which has reach over 183,000 people.
Diabetes UK has embarked on a programme of awareness-raising within Black, Asian and Minority Ethnic communities by recruiting 'Community Champions' – volunteers who are trained to deliver healthy lifestyle and diabetes awareness messages, through information stands and talks at community centres, places of worship and at festivals and events. Community Champions receive training on key aspects of diabetes, its prevention and how to live with diabetes and avoid complications. The scheme has been highly successful in London, where over 100 champions have been trained. It is now being rolled out in four more major towns across England. Some champions have been trained to undertake the Diabetes UK risk assessments, and others have become 'Dual Champions' in partnership with the British Heart Foundation.
33 Dalton A, et al. (November 2011). Prevalence of Cardiovascular Disease Risk Amongst the Population Eligible for the NHS Health Check programme. European Journal of Cardiovascular Prevention and Rehabilitation
34 Diabetes UK. (2007). Measure Up campaign evaluation

11THE NHS HEALTH CHECK PROGRAMME: LET’S GET IT RIGHT
wHaT nEEdS To HappEn
THe NHS Health Check programme has the potential to make a huge impact on the prevention and diagnosis of Type 2 diabetes. It is essential that the programme is fully implemented and sustained:
• The Department of Health should require Public Health England to establish a national implementation team for the NHS Health Check programme.
• The Government’s forthcoming cardio-vascular strategy must ensure the effective implementation of the NHS Health Check programme and the follow-up action to diagnose and prevent Type 2 diabetes in those found to be high risk.
• The Department of Health and Public Health England should ensure that the implementation of the NHS Health Check programme does not decline during the transition from NHS to local government.
• Local authorities should be fully funded from 2013 to commission the NHS Health Check programme and follow up interventions.
• Local authorities should ensure delivery of the NHS Health Check programme.
• Local authorities should ensure that effective mechanisms exist to refer those found to have diabetes to appropriate healthcare and to refer those at high risk to effective lifestyle change programmes.
• The Department of Health and Public Health England should raise awareness of the benefits of an NHS Health Check and people’s rights to a free Check.
• An NHS Health Check should be equally accessible to everyone who is eligible. There should be targeted action to reduce geographical variation and effective action to ensure those in high risk groups receive an NHS Health Check.
• NICE Public Health Guidance on Preventing Type 2 Diabetes: Risk Identification and Interventions for Individuals at High Risk should be fully implemented.
• Those commissioning the NHS Health Check programme should collaborate with local and national community risk assessment programmes and awareness raising campaigns to increase reach, in particular across those groups the NHS traditionally fails to reach, eg through Diabetes UK roadshows.
• There should be effective signposting to organisations providing information and advice to support people to adopt healthier lifestyles and reduce their risk of Type 2 diabetes (and other conditions).

12 THE NHS HEALTH CHECK PROGRAMME: LET’S GET IT RIGHT
pc
Tn
umbe
r of
peo
ple
who
wer
e of
fere
d
an n
HS
Hea
lth
che
ck in
201
1/12
per
cent
age
of
elig
ible
peo
ple
offe
red
an n
HS
H
ealth
che
ck in
20
11/1
2 (e
xpec
ted
ta
rget
: 18%
)
per
cent
age
of
elig
ible
peo
ple
o
ffer
ed a
n n
HS
H
ealth
che
ck
ap
ril –
Jun
e 20
12
(num
ber
of c
heck
s co
nduc
ted
)
per
cent
age
undi
agno
sed
(u
sing
Qo
F pr
eval
ence
as
a %
of a
pH
o e
stim
ated
pr
eval
ence
mod
el) 2
011
not
e: a
vera
ge in
Eng
land
is
23.4
0% (r
ange
1.5
% -
50.
1%)
Milt
on K
eyne
s P
CT
00.
0%0.
0% (0
)26
.0%
She
ffiel
d P
CT
00.
0%0.
0% (0
)21
.6%
Wes
tern
Che
shire
PC
T0
0.0%
0.0%
(0)
22.7
%E
ast R
idin
g of
Yor
kshi
re P
CT
50.
0%0.
0% (0
)31
.1%
Cor
nwal
l and
Isle
s of
Sci
lly P
CT
250.
0%0.
0% (0
)33
.8%
Cum
bria
Tea
chin
g P
CT
904
0.5%
1.0%
(1,6
74)
32.8
%S
urre
y P
CT
3,38
31.
0%0.
1% (4
71)
28.4
%B
erks
hire
Eas
t PC
T1,
316
1.2%
0.2%
(67)
18.2
%Is
le o
f Wig
ht N
HS
PC
T73
61.
6%6.
4% (1
,384
)35
.7%
Bra
dfor
d an
d A
ireda
le T
each
ing
PC
T2,
158
1.6%
0.0%
(0)
20.1
%N
orth
Som
erse
t PC
T1,
162
1.6%
2.7%
(970
)33
.3%
Kirk
lees
PC
T1,
982
2.0%
0.3%
(323
)28
.8%
Bar
net P
CT
2,28
82.
0%0.
0% (6
)27
.8%
Nor
th L
inco
lnsh
ire P
CT
1,15
52.
1%2.
3% (6
61)
18.7
%H
arro
w P
CT
1,65
42.
2%2.
1% (1
,454
)20
.7%
Som
erse
t PC
T4,
254
2.4%
2.3%
(1,8
01)
31.5
%W
alth
am F
ores
t PC
T1,
991
2.8%
1.0%
(412
)10
.6%
Her
efor
dshi
re P
CT
2,15
23.
5%6.
1% (1
,300
)32
.7%
Red
brid
ge P
CT
2,60
03.
7%2.
9% (1
,547
)20
.8%
Bur
y P
CT
2,02
03.
7%1.
5% (4
55)
26.7
%B
risto
l PC
T4,
147
3.8%
0.1%
(68
)26
.0%
Ply
mou
th T
each
ing
PC
T3,
054
4.2%
0.4%
(169
)23
.8%
Cov
entr
y Te
achi
ng P
CT
3,68
64.
2%0.
7% (1
36)
22.7
%W
orce
ster
shire
PC
T8,
301
4.4%
1.6%
(1,4
98)
25.9
%W
arw
icks
hire
PC
T7,
434
4.5%
0.7%
(1,0
85)
30.4
%W
arrin
gton
PC
T2,
943
4.5%
0.7%
(197
)16
.5%
Enfi
eld
PC
T4,
079
4.9%
3.0%
(1,1
61)
25.5
%N
orth
ampt
onsh
ire T
each
ing
PC
T11
,179
5.0%
0.0%
(0)
23.5
%D
orse
t PC
T7,
637
5.1%
1.1%
(900
)38
.0%
Wes
t Ken
t PC
T11
,687
5.2%
1.0%
(1,7
55)
27.6
%
aP
Pe
nd
iX: n
atio
na
l a
nd
re
gio
na
l s
ta
tis
tiC
s

13THE NHS HEALTH CHECK PROGRAMME: LET’S GET IT RIGHT
pc
Tn
umbe
r of
peo
ple
who
wer
e of
fere
d
an n
HS
Hea
lth
che
ck in
201
1/12
per
cent
age
of
elig
ible
peo
ple
offe
red
an n
HS
H
ealth
che
ck in
20
11/1
2 (e
xpec
ted
ta
rget
: 18%
)
per
cent
age
of
elig
ible
peo
ple
o
ffer
ed a
n n
HS
H
ealth
che
ck
ap
ril –
Jun
e 20
12
(num
ber
of c
heck
s co
nduc
ted
)
per
cent
age
undi
agno
sed
(u
sing
Qo
F pr
eval
ence
as
a %
of a
pH
o e
stim
ated
pr
eval
ence
mod
el) 2
011
not
e: a
vera
ge in
Eng
land
is
23.4
0% (r
ange
1.5
% -
50.
1%)
Bla
ckpo
ol P
CT
2,79
35.
9%5.
3% (1
,300
)23
.0%
Leic
este
rshi
re C
ount
y an
d R
utla
nd P
CT
15,6
756.
1%3.
6% (3
,989
)28
.0%
Cal
derd
ale
PC
T3,
235
6.5%
4.3%
(1,3
35)
27.6
%H
ouns
low
PC
T3,
693
6.7%
3.7%
(1,5
84)
19.8
%S
outh
Sta
fford
shire
PC
T13
,338
7.2%
3.0%
(3,2
21)
26.2
%N
ottin
gham
shire
Cou
nty
Teac
hing
PC
T15
,102
7.6%
4.4%
(3,4
32)
28.8
%O
ldha
m P
CT
4,98
07.
7%2.
4% (8
30)
24.7
%W
est S
usse
x P
CT
20,6
557.
8%2.
6% (3
,220
)28
.8%
Eas
t Sus
sex
Dow
ns a
nd W
eald
PC
T9,
609
8.2%
1.8%
(1,1
80)
35.7
%S
hrop
shire
Cou
nty
PC
T7,
720
8.4%
4.4%
(1,6
65)
33.1
%E
aste
rn a
nd C
oast
al K
ent P
CT
20,6
618.
6%5.
8% (4
,705
)22
.1%
Nor
th L
anca
shire
Tea
chin
g P
CT
9,83
28.
9%3.
2% (3
,503
)26
.9%
Nor
th Y
orks
hire
and
Yor
k P
CT
22,1
929.
3%4.
2% (5
,611
)35
.6%
Sou
thw
ark
PC
T7,
464
9.4%
7.5%
(1,0
85)
29.6
%N
ottin
gham
City
PC
T6,
844
9.5%
4.7%
(1,1
64)
22.1
%C
entr
al a
nd E
aste
rn C
hesh
ire P
CT
18,7
189.
5%3.
7% (2
,761
)22
.3%
New
cast
le P
CT
7,28
89.
7%3.
3% (8
10)
30.6
%K
ings
ton
PC
T5,
176
9.7%
2.9%
(1,2
25)
22.2
%B
olto
n P
CT
9,91
29.
7%0.
7% (4
17)
13.2
%S
outh
Glo
uces
ters
hire
PC
T7,
275
9.9%
3.4%
(2,0
42)
29.2
%Ta
mes
ide
and
Glo
ssop
PC
T7,
633
9.9%
5.5%
(1,6
43)
26.6
%H
ertfo
rdsh
ire P
CT
34,5
6010
.5%
5.0%
(8,1
13)
–S
utto
n an
d M
erto
n P
CT
12,4
9411
.2%
4.8%
(2,5
15)
25.5
%D
erby
shire
Cou
nty
PC
T26
,802
11.5
%2.
7% (3
,971
)22
.9%
Nor
th T
ynes
ide
PC
T7,
904
11.6
%4.
5% (9
54)
15.2
%H
astin
gs a
nd R
othe
r PC
T7,
490
12.1
%1.
3% (3
44)
35.9
%B
erks
hire
Wes
t PC
T14
,945
12.3
%2.
8% (1
,768
)29
.7%
Dev
on P
CT
36,2
7512
.3%
3.6%
(3,3
59)
36.4
%M
id E
ssex
PC
T14
,498
12.7
%1.
4% (1
,438
)26
.8%
Eas
t Lan
cash
ire T
each
ing
PC
T18
,148
13.1
%4.
5% (3
,393
)27
.8%

14 THE NHS HEALTH CHECK PROGRAMME: LET’S GET IT RIGHT
pc
Tn
umbe
r of
peo
ple
who
wer
e of
fere
d
an n
HS
Hea
lth
che
ck in
201
1/12
per
cent
age
of
elig
ible
peo
ple
offe
red
an n
HS
H
ealth
che
ck in
20
11/1
2 (e
xpec
ted
ta
rget
: 18%
)
per
cent
age
of
elig
ible
peo
ple
o
ffer
ed a
n n
HS
H
ealth
che
ck
ap
ril –
Jun
e 20
12
(num
ber
of c
heck
s co
nduc
ted
)
per
cent
age
undi
agno
sed
(u
sing
Qo
F pr
eval
ence
as
a %
of a
pH
o e
stim
ated
pr
eval
ence
mod
el) 2
011
not
e: a
vera
ge in
Eng
land
is
23.4
0% (r
ange
1.5
% -
50.
1%)
New
ham
PC
T9,
821
13.3
%2.
7% (8
04)
2.9%
San
dwel
l PC
T10
,860
13.5
%4.
6% (1
,084
)18
.3%
Oxf
ords
hire
PC
T25
,018
13.6
%4.
8% (3
,602
)18
.3%
Nor
thum
berla
nd C
are
Trus
t15
,396
13.7
%4.
4% (
1,44
5)18
.4%
Bou
rnem
outh
and
Poo
le T
each
ing
PC
T12
,784
13.8
%0.
0% (0
)15
.8%
Buc
king
ham
shire
PC
T25
,125
13.9
%4.
7% (4
,739
)35
.6%
Don
cast
er P
CT
7,63
414
.0%
3.1%
(1,4
58)
14.7
%H
ull T
each
ing
PC
T11
,677
14.1
%2.
0% (8
55)
20.3
%D
arlin
gton
PC
T5,
268
14.1
%4.
4% (1
,118
)16
.0%
Rot
herh
am P
CT
10,9
3614
.1%
4.8%
(1,7
85)
26.3
%S
outh
ampt
on C
ity P
CT
8,51
114
.6%
3.3%
(1,2
76)
18.3
%Li
ncol
nshi
re T
each
ing
PC
T32
,897
14.8
%3.
0% (4
,241
)20
.0%
Sal
ford
PC
T9,
457
14.9
%5.
2% (6
00)
16.1
%C
entr
al L
anca
shire
PC
T19
,410
15.3
%7.
3% (2
,735
)24
.0%
Cou
nty
Dur
ham
PC
T 28
,492
15.5
%4.
4% (5
,767
)18
.1%
Wilt
shire
PC
T25
,002
15.6
%5.
9% (4
,308
)28
.6%
Brig
hton
and
Hov
e C
ity P
CT
11,0
4615
.9%
4.9%
(1,1
82)
32.6
%H
aver
ing
PC
T11
,354
16.4
%2.
4% (9
89)
23.5
%W
est E
ssex
PC
T13
,829
16.5
%1.
1% (4
67)
23.9
%W
olve
rham
pton
City
PC
T12
,833
16.5
%5.
5% (1
,327
)23
.5%
Nor
folk
PC
T39
,550
16.6
%3.
6% (3
,909
)32
.6%
Ash
ton,
Lei
gh a
nd W
igan
PC
T16
,983
16.7
%5.
1% (3
,682
)17
.5%
Ham
mer
smith
and
Ful
ham
PC
T6,
710
16.8
%1.
9% (7
38)
29.5
%Le
ices
ter C
ity P
CT
13,3
9517
.3%
4.2%
(3,2
93)
17.8
%Le
eds
PC
T35
,800
17.3
%5.
0% (6
,592
)29
.4%
Hilli
ngdo
n P
CT
12,4
7017
.4%
1.0%
(733
)20
.8%
Pet
erbo
roug
h P
CT
8,42
017
.5%
2.7%
(816
)21
.2%
Sun
derla
nd T
each
ing
PC
T18
,400
18.0
%4.
9% (2
,294
)25
.8%
Gat
eshe
ad P
CT
13,4
9418
.0%
3.0%
(1,6
71)
18.4
%S
outh
Tyn
esid
e P
CT
10,0
7718
.0%
4.5%
(1,4
54)
20.4
%

15THE NHS HEALTH CHECK PROGRAMME: LET’S GET IT RIGHT
pc
Tn
umbe
r of
peo
ple
who
wer
e of
fere
d
an n
HS
Hea
lth
che
ck in
201
1/12
per
cent
age
of
elig
ible
peo
ple
offe
red
an n
HS
H
ealth
che
ck in
20
11/1
2 (e
xpec
ted
ta
rget
: 18%
)
per
cent
age
of
elig
ible
peo
ple
o
ffer
ed a
n n
HS
H
ealth
che
ck
ap
ril –
Jun
e 20
12
(num
ber
of c
heck
s co
nduc
ted
)
per
cent
age
undi
agno
sed
(u
sing
Qo
F pr
eval
ence
as
a %
of a
pH
o e
stim
ated
pr
eval
ence
mod
el) 2
011
not
e: a
vera
ge in
Eng
land
is
23.4
0% (r
ange
1.5
% -
50.
1%)
Traf
ford
PC
T12
,600
18.0
%4.
1% (1
,283
)18
.2%
Sto
ckpo
rt P
CT
19,6
2518
.0%
4.4%
(3,6
40)
23.4
%K
now
sley
PC
T8,
028
18.1
%6.
1% (6
30)
15.3
%N
orth
Eas
t Lin
coln
shire
Car
e Tr
ust P
lus
8,91
918
.4%
7.6%
(1,7
97)
21.7
%C
royd
on P
CT
18,0
5518
.5%
5.0%
(765
)25
.2%
Gre
at Y
arm
outh
and
Wav
eney
PC
T12
,812
18.5
%5.
0% (1
,547
)27
.7%
Dud
ley
PC
T16
,705
18.6
%9.
9% (2
,513
)26
.3%
Ham
pshi
re P
CT
76,3
5118
.6%
5.4%
(11,
302)
26.2
%S
outh
Birm
ingh
am P
CT
19,6
1518
.7%
4.0%
(2,5
84)
20.5
%N
orth
Sta
fford
shire
PC
T12
,237
19.0
%4.
4% (1
,773
)17
.0%
Bat
h an
d N
orth
Eas
t Som
erse
t PC
T10
,069
19.0
%6.
3% (8
33)
29.1
%D
erby
City
PC
T15
,005
19.1
%4.
8% (1
,548
)3.
2%W
alsa
ll Te
achi
ng P
CT
16,6
3319
.1%
7.6%
(1,7
84)
10.3
%W
irral
PC
T21
,844
19.9
%8.
5% (4
,146
)20
.9%
Sw
indo
n P
CT
12,1
8619
.9%
3.3%
(869
)14
.7%
Sou
th W
est E
ssex
PC
T22
,034
20.0
%2.
0% (1
,234
)18
.8%
Luto
n P
CT
9,63
620
.2%
3.9%
(751
)18
.2%
Sol
ihul
l PC
T12
,954
20.6
%5.
0% (8
93)
23.8
%B
arns
ley
PC
T12
,780
20.8
%3.
9% (1
,575
)14
.6%
Suf
folk
PC
T39
,101
20.8
%6.
8% (7
,068
)31
.8%
Sef
ton
PC
T18
,350
21.0
%6.
6% (2
,139
)28
.7%
Cam
den
PC
T13
,781
21.2
%7.
6% (1
,340
)42
.2%
Por
tsm
outh
City
Tea
chin
g P
CT
10,5
4021
.3%
6.1%
(841
)21
.1%
Bro
mle
y P
CT
20,9
9521
.3%
3.2%
(1,9
31)
26.5
%H
eart
of B
irmin
gham
Tea
chin
g P
CT
12,1
5221
.3%
2.9%
(837
)12
.4%
Med
way
PC
T16
,906
21.4
%9.
3% (1
,495
)1.
5%Is
lingt
on P
CT
10,7
4721
.5%
4.9%
(1,5
86)
20.5
%R
ichm
ond
and
Twic
kenh
am P
CT
13,0
4921
.7%
5.6%
(1,2
96)
42.9
%C
ambr
idge
shire
PC
T40
,402
22.8
%4.
9% (4
,457
)25
.1%
Sou
th E
ast E
ssex
PC
T23
,235
22.8
%5.
6% (2
,699
)24
.3%
Torb
ay C
are
Trus
t10
,604
22.9
%3.
4% (7
55)
29.3
%

16 THE NHS HEALTH CHECK PROGRAMME: LET’S GET IT RIGHT
pc
Tn
umbe
r of
peo
ple
who
wer
e of
fere
d
an n
HS
Hea
lth
che
ck in
201
1/12
per
cent
age
of
elig
ible
peo
ple
offe
red
an n
HS
H
ealth
che
ck in
20
11/1
2 (e
xpec
ted
ta
rget
: 18%
)
per
cent
age
of
elig
ible
peo
ple
o
ffer
ed a
n n
HS
H
ealth
che
ck
ap
ril –
Jun
e 20
12
(num
ber
of c
heck
s co
nduc
ted
)
per
cent
age
undi
agno
sed
(u
sing
Qo
F pr
eval
ence
as
a %
of a
pH
o e
stim
ated
pr
eval
ence
mod
el) 2
011
not
e: a
vera
ge in
Eng
land
is
23.4
0% (r
ange
1.5
% -
50.
1%)
Birm
ingh
am E
ast a
nd N
orth
PC
T28
,479
23.0
%6.
2% (3
,498
)21
.9%
Bed
ford
shire
PC
T28
,501
23.0
%4.
6% (2
,665
)19
.8%
Mid
dles
brou
gh P
CT
6,53
823
.2%
3.0%
(795
)26
.4%
Glo
uces
ters
hire
PC
T46
,285
23.6
%5.
6% (4
,374
)22
.8%
City
and
Hac
kney
Tea
chin
g P
CT
13,5
6024
.4%
4.8%
(1,5
61)
18.9
%H
alto
n an
d S
t Hel
ens
PC
T22
,796
24.9
%2.
9% (1
,527
)8.
3%W
akefi
eld
Dis
tric
t PC
T26
,992
25.7
%7.
1% (2
,474
)18
.4%
Man
ches
ter P
CT
23,3
7326
.0%
6.3%
(1,7
21)
15.3
%R
edca
r and
Cle
vela
nd P
CT
7,39
426
.2%
2.2%
(738
)29
.3%
Har
inge
y Te
achi
ng P
CT
17,4
9326
.6%
10.4
% (2
,389
)16
.7%
Wan
dsw
orth
PC
T21
,949
26.8
%6.
7% (2
,124
)14
.2%
H
eyw
ood,
Mid
dlet
on a
nd R
ochd
ale
PC
T14
,828
27.1
%6.
9% (2
,326
)23
.0%
Lew
isha
m P
CT
19,6
7527
.1%
6.6%
(1,4
75)
12.4
%E
alin
g P
CT
19,2
7927
.5%
5.2%
(2,5
10)
10.8
%K
ensi
ngto
n an
d C
hels
ea P
CT
14,3
8528
.5%
0.0%
(214
)50
.1%
Bas
setla
w P
CT
10,8
3928
.8%
6.0%
(1,3
06)
28.6
%La
mbe
th P
CT
26,3
2728
.8%
7.2%
(1,3
20)
15.5
%B
arki
ng a
nd D
agen
ham
PC
T11
,977
29.0
%5.
9% (8
86)
11.4
%S
tock
ton-
On-
Tees
Tea
chin
g P
CT
12,2
6429
.5%
3.7%
(1,3
98)
31.1
%S
toke
on
Tren
t PC
T25
,254
29.7
%6.
6% (2
,086
)7.
8%To
wer
Ham
lets
PC
T13
,844
30.1
%5.
3% (2
,157
)13
.2%
Telfo
rd a
nd W
reki
n P
CT
14,8
7031
.9%
8.3%
(1,5
92)
20.2
%W
estm
inst
er P
CT
20,9
6233
.9%
5.8%
(2,1
17)
44.6
%N
orth
Eas
t Ess
ex P
CT
33,6
4734
.3%
3.3%
(2,3
54)
28.9
%G
reen
wic
h Te
achi
ng P
CT
25,4
0434
.5%
5.8%
(1,2
83)
22.2
%B
exle
y C
are
Trus
t23
,760
34.8
%6.
8% (1
,751
)17
.9%
Bre
nt T
each
ing
PC
T30
,026
36.1
%7.
7% (3
,111
)11
.3%
Bla
ckbu
rn w
ith D
arw
en T
each
ing
Car
e Tr
ust P
lus
14,1
9438
.4%
4.4%
(815
)9.
6%H
artle
pool
PC
T6,
908
39.5
%1.
6% (4
09)
30.4
%Li
verp
ool P
CT
82,5
9191
.1%
15.4
% (4
,960
)20
.4%

17THE NHS HEALTH CHECK PROGRAMME: LET’S GET IT RIGHT
no
rthe
rn a
nd y
ork
shir
e p
cTs
num
ber
of
peo
ple
who
w
ere
off
ered
an
nH
S
Hea
lth
che
ck in
20
11/1
2
per
cent
age
of
elig
ible
p
eop
le t
hat
wer
e o
ffer
ed a
n n
HS
Hea
lth
che
ck in
201
1/12
(e
xpec
ted
tar
get
: 18%
)
per
cent
age
of
elig
ible
p
eop
le t
hat
wer
e o
ffer
ed
an n
HS
Hea
lth
che
ck
ap
ril–
June
201
2 (n
umb
er o
f ch
ecks
co
nduc
ted
)
per
cent
age
und
iag
nose
d (u
sing
Q
oF
pre
vale
nce
as a
% o
f a
pH
o e
stim
ated
pre
vale
nce
mo
del
) 201
1 n
ote
: ave
rage
in E
ngla
nd is
23
.40%
(ran
ge 1
.5%
- 5
0.1%
)S
heffi
eld
PC
T0
0.0%
0.0%
(0)
21.6
%E
ast R
idin
g of
Yor
kshi
re P
CT
50.
0%0.
0% (0
)31
.1%
Bra
dfor
d an
d A
ireda
le T
each
ing
PC
T2,
158
1.6%
0.0%
(0)
20.1
%K
irkle
es P
CT
1,98
22.
0%0.
3% (3
23)
28.8
%N
orth
Lin
coln
shire
PC
T1,
155
2.1%
2.3%
(661
)18
.7%
Cal
derd
ale
PC
T3,
235
6.5%
4.3%
(1,3
35)
27.6
%N
orth
Yor
kshi
re a
nd Y
ork
PC
T22
,192
9.3%
4.2%
(5,6
11)
35.6
%N
ewca
stle
PC
T7,
288
9.7%
3.3%
(810
)30
.6%
Nor
th T
ynes
ide
PC
T7,
904
11.6
%4.
5% (9
54)
15.2
%N
orth
umbe
rland
Car
e Tr
ust
15,3
9613
.7%
4.4%
(1,
445)
18.4
%D
onca
ster
PC
T7,
634
14.0
%3.
1% (1
,458
)14
.7%
Hul
l Tea
chin
g P
CT
11,6
7714
.1%
2.0%
(855
)20
.3%
Dar
lingt
on P
CT
5,26
814
.1%
4.4%
(1,1
18)
16.0
%R
othe
rham
PC
T10
,936
14.1
%4.
8% (1
,785
)26
.3%
Cou
nty
Dur
ham
PC
T 28
,492
15.5
%4.
4% (5
,767
)18
.1%
Leed
s P
CT
35,8
0017
.3%
5.0%
(6,5
92)
29.4
%S
unde
rland
Tea
chin
g P
CT
18,4
0018
.0%
4.9%
(2,2
94)
25.8
%G
ates
head
PC
T13
,494
18.0
%3.
0% (1
,671
)18
.4%
Sou
th T
ynes
ide
PC
T10
,077
18.0
%4.
5% (1
,454
)20
.4%
Nor
th E
ast L
inco
lnsh
ire C
are
Trus
t Plu
s8,
919
18.4
%7.
6% (1
,797
)21
.7%
Bar
nsle
y P
CT
12,7
8020
.8%
3.9%
(1,5
75)
14.6
%M
iddl
esbr
ough
PC
T6,
538
23.2
%3.
0% (7
95)
26.4
%W
akefi
eld
Dis
tric
t PC
T26
,992
25.7
%7.
1% (2
,474
)18
.4%
Red
car a
nd C
leve
land
PC
T7,
394
26.2
%2.
2% (7
38)
29.3
%S
tock
ton-
On-
Tees
Tea
chin
g P
CT
12,2
6429
.5%
3.7%
(1,3
98)
31.1
%H
artle
pool
PC
T6,
908
39.5
%1.
6% (4
09)
30.4
%

18 THE NHS HEALTH CHECK PROGRAMME: LET’S GET IT RIGHT
mid
land
s p
cTs
num
ber
of
peo
ple
who
w
ere
off
ered
an
nH
S
Hea
lth
che
ck
in 2
011/
12
per
cent
age
of
elig
ible
p
eop
le t
hat
wer
e o
ffer
ed a
n n
HS
Hea
lth
che
ck in
201
1/12
(e
xpec
ted
tar
get
: 18%
)
per
cent
age
of
elig
ible
p
eop
le t
hat
wer
e o
ffer
ed
an n
HS
Hea
lth
che
ck
ap
ril–
June
201
2 (n
umb
er o
f ch
ecks
co
nduc
ted
)
per
cent
age
und
iag
nose
d (u
sing
Q
oF
pre
vale
nce
as a
% o
f a
pH
o e
stim
ated
pre
vale
nce
mo
del
) 201
1 n
ote
: ave
rage
in E
ngla
nd is
23
.40%
(ran
ge 1
.5%
– 5
0.1%
)H
eref
ords
hire
PC
T2,
152
3.5%
6.1%
(1,3
00)
32.7
%C
oven
try
Teac
hing
PC
T3,
686
4.2%
0.7%
(136
)22
.7%
Wor
cest
ersh
ire P
CT
8,30
14.
4%1.
6% (1
,498
)25
.9%
War
wic
kshi
re P
CT
7,43
44.
5%0.
7% (1
,085
)30
.4%
Nor
tham
pton
shire
Tea
chin
g P
CT
11,1
795.
0%0.
0% (0
)23
.5%
Leic
este
rshi
re C
ount
y an
d R
utla
nd P
CT
15,6
756.
1%3.
6% (3
,989
)28
.0%
Sou
th S
taffo
rdsh
ire P
CT
13,3
387.
2%3.
0% (3
,221
)26
.2%
Not
tingh
amsh
ire C
ount
y Te
achi
ng P
CT
15,1
027.
6%4.
4% (3
,432
)28
.8%
Shr
opsh
ire C
ount
y P
CT
7,72
08.
4%4.
4% (1
,665
)33
.1%
Not
tingh
am C
ity P
CT
6,84
49.
5%4.
7% (1
,164
)22
.1%
Der
bysh
ire C
ount
y P
CT
26,8
0211
.5%
2.7%
(3,9
71)
22.9
%S
andw
ell P
CT
10,8
6013
.5%
4.6%
(1,0
84)
18.3
%Li
ncol
nshi
re T
each
ing
PC
T32
,897
14.8
%3.
0% (4
,241
)20
.0%
Wol
verh
ampt
on C
ity P
CT
12,8
3316
.5%
5.5%
(1,3
27)
23.5
%Le
ices
ter C
ity P
CT
13,3
9517
.3%
4.2%
(3,2
93)
17.8
%D
udle
y P
CT
16,7
0518
.6%
9.9%
(2,5
13)
26.3
%S
outh
Birm
ingh
am P
CT
19,6
1518
.7%
4.0%
(2,5
84)
20.5
%N
orth
Sta
fford
shire
PC
T12
,237
19.0
%4.
4% (1
,773
)17
.0%
Der
by C
ity P
CT
15,0
0519
.1%
4.8%
(1,5
48)
3.2%
Wal
sall
Teac
hing
PC
T16
,633
19.1
%7.
6% (1
,784
)10
.3%
Sol
ihul
l PC
T12
,954
20.6
%5.
0% (8
93)
23.8
%H
eart
of B
irmin
gham
Tea
chin
g P
CT
12,1
5221
.3%
2.9%
(837
)12
.4%
Birm
ingh
am E
ast a
nd N
orth
PC
T28
,479
23.0
%6.
2% (3
,498
)21
.9%
Bas
setla
w P
CT
10,8
3928
.8%
6.0%
(1,3
06)
28.6
%S
toke
on
Tren
t PC
T25
,254
29.7
%6.
6% (2
,086
)7.
8%Te
lford
and
Wre
kin
PC
T14
,870
31.9
%8.
3% (1
,592
)20
.2%

19THE NHS HEALTH CHECK PROGRAMME: LET’S GET IT RIGHT
Eas
tern
pc
Tsn
umb
er o
f p
eop
le w
ho
wer
e o
ffer
ed
an n
HS
H
ealt
h c
heck
in
201
1/12
per
cent
age
of
elig
ible
p
eop
le t
hat
wer
e o
ffer
ed a
n n
HS
Hea
lth
che
ck in
201
1/12
(e
xpec
ted
tar
get
: 18%
)
per
cent
age
of
elig
ible
p
eop
le t
hat
wer
e o
ffer
ed
an n
HS
Hea
lth
che
ck
ap
ril–
June
201
2 (n
umb
er o
f ch
ecks
co
nduc
ted
)
per
cent
age
und
iag
nose
d (u
sing
Q
oF
pre
vale
nce
as a
% o
f a
pH
o e
stim
ated
pre
vale
nce
mo
del
) 201
1 n
ote
: ave
rage
in E
ngla
nd is
23
.40%
(ran
ge 1
.5%
- 5
0.1%
)
Her
tford
shire
PC
T 34
,560
10.5
%5.
0% (8
,113
)–
Mid
Ess
ex P
CT
14,4
9812
.7%
1.4%
(1,4
38)
26.8
%W
est E
ssex
PC
T13
,829
16.5
%1.
1% (4
67)
23.9
%N
orfo
lk P
CT
39,5
5016
.6%
3.6%
(3,9
09)
32.6
%P
eter
boro
ugh
PC
T8,
420
17.5
%2.
7% (8
16)
21.2
%G
reat
Yar
mou
th a
nd W
aven
ey P
CT
12,8
1218
.5%
5.0%
(1,5
47)
27.7
%S
outh
Wes
t Ess
ex P
CT
22,0
3420
.0%
2.0%
(1,2
34)
18.8
%Lu
ton
PC
T9,
636
20.2
%3.
9% (7
51)
18.2
%S
uffo
lk P
CT
39,1
0120
.8%
6.8%
(7,0
68)
31.8
%C
ambr
idge
shire
PC
T40
,402
22.8
%4.
9% (4
,457
)25
.1%
Sou
th E
ast E
ssex
PC
T23
,235
22.8
%5.
6% (2
,699
)24
.3%
Bed
ford
shire
PC
T28
,501
23.0
%4.
6% (2
,665
)19
.8%
Nor
th E
ast E
ssex
PC
T33
,647
34.3
%3.
3% (2
,354
)28
.9%

20 THE NHS HEALTH CHECK PROGRAMME: LET’S GET IT RIGHT
Lond
on
pc
Tsn
umb
er o
f p
eop
le w
ho
wer
e o
ffer
ed
an n
HS
H
ealt
h c
heck
in
201
1/12
per
cent
age
of
elig
ible
p
eop
le t
hat
wer
e o
ffer
ed a
n n
HS
Hea
lth
che
ck in
201
1/12
(e
xpec
ted
tar
get
: 18%
)
per
cent
age
of
elig
ible
p
eop
le t
hat
wer
e o
ffer
ed
an n
HS
Hea
lth
che
ck
ap
ril–
June
201
2 (n
umb
er o
f ch
ecks
co
nduc
ted
)
per
cent
age
und
iag
nose
d (u
sing
Q
oF
pre
vale
nce
as a
% o
f a
pH
o e
stim
ated
pre
vale
nce
mo
del
) 201
1 n
ote
: ave
rage
in E
ngla
nd is
23
.40%
(ran
ge 1
.5%
- 5
0.1%
)B
arne
t PC
T2,
288
2.0%
0.0%
(6)
27.8
%H
arro
w P
CT
1,65
42.
2%2.
1% (1
,454
)20
.7%
Wal
tham
For
est P
CT
1,99
12.
8%1.
0% (4
12)
10.6
%R
edbr
idge
PC
T2,
600
3.7%
2.9%
(1,5
47)
20.8
%E
nfiel
d P
CT
4,07
94.
9%3.
0% (1
,161
)25
.5%
Hou
nslo
w P
CT
3,69
36.
7%3.
7% (1
,584
)19
.8%
Sou
thw
ark
PC
T7,
464
9.4%
7.5%
(1,0
85)
29.6
%K
ings
ton
PC
T5,
176
9.7%
2.9%
(1,2
25)
22.2
%S
utto
n an
d M
erto
n P
CT
12,4
9411
.2%
4.8%
(2,5
15)
25.5
%N
ewha
m P
CT
9,82
113
.3%
2.7%
(804
)2.
9%H
aver
ing
PC
T11
,354
16.4
%2.
4% (9
89)
23.5
%H
amm
ersm
ith a
nd F
ulha
m P
CT
6,71
016
.8%
1.9%
(738
)29
.5%
Hilli
ngdo
n P
CT
12,4
7017
.4%
1.0%
(733
)20
.8%
Cro
ydon
PC
T18
,055
18.5
%5.
0% (7
65)
25.2
%C
amde
n P
CT
13,7
8121
.2%
7.6%
(1,3
40)
42.2
%B
rom
ley
PC
T20
,995
21.3
%3.
2% (1
,931
)26
.5%
Islin
gton
PC
T10
,747
21.5
%4.
9% (1
,586
)20
.5%
Ric
hmon
d an
d Tw
icke
nham
PC
T13
,049
21.7
%5.
6% (1
,296
)42
.9%
City
and
Hac
kney
Tea
chin
g P
CT
13,5
6024
.4%
4.8%
(1,5
61)
18.9
%H
arin
gey
Teac
hing
PC
T17
,493
26.6
%10
.4%
(2,3
89)
16.7
%W
ands
wor
th P
CT
21,9
4926
.8%
6.7%
(2,1
24)
14.2
%Le
wis
ham
PC
T19
,675
27.1
%6.
6% (1
,475
)12
.4%
Eal
ing
PC
T19
,279
27.5
%5.
2% (2
,510
)10
.8%
Ken
sing
ton
and
Che
lsea
PC
T14
,385
28.5
%0.
0% (2
14)
50.1
%La
mbe
th P
CT
26,3
2728
.8%
7.2%
(1,3
20)
15.5
%B
arki
ng a
nd D
agen
ham
PC
T11
,977
29.0
%5.
9% (8
86)
11.4
%To
wer
Ham
lets
PC
T13
,844
30.1
%5.
3% (2
,157
)13
.2%
Wes
tmin
ster
PC
T20
,962
33.9
%5.
8% (2
,117
)44
.6%
Gre
enw
ich
Teac
hing
PC
T25
,404
34.5
%5.
8% (1
,283
)22
.2%
Bex
ley
Car
e Tr
ust
23,7
6034
.8%
6.8%
(1,7
51)
17.9
%B
rent
Tea
chin
g P
CT
30,0
2636
.1%
7.7%
(3,1
11)
11.3
%
21THE NHS HEALTH CHECK PROGRAMME: LET’S GET IT RIGHT
Lond
on
pc
Tsn
umb
er o
f p
eop
le w
ho
wer
e o
ffer
ed
an n
HS
H
ealt
h c
heck
in
201
1/12
per
cent
age
of
elig
ible
p
eop
le t
hat
wer
e o
ffer
ed a
n n
HS
Hea
lth
che
ck in
201
1/12
(e
xpec
ted
tar
get
: 18%
)
per
cent
age
of
elig
ible
p
eop
le t
hat
wer
e o
ffer
ed
an n
HS
Hea
lth
che
ck
ap
ril–
June
201
2 (n
umb
er o
f ch
ecks
co
nduc
ted
)
per
cent
age
und
iag
nose
d (u
sing
Q
oF
pre
vale
nce
as a
% o
f a
pH
o e
stim
ated
pre
vale
nce
mo
del
) 201
1 n
ote
: ave
rage
in E
ngla
nd is
23
.40%
(ran
ge 1
.5%
- 5
0.1%
)B
arne
t PC
T2,
288
2.0%
0.0%
(6)
27.8
%H
arro
w P
CT
1,65
42.
2%2.
1% (1
,454
)20
.7%
Wal
tham
For
est P
CT
1,99
12.
8%1.
0% (4
12)
10.6
%R
edbr
idge
PC
T2,
600
3.7%
2.9%
(1,5
47)
20.8
%E
nfiel
d P
CT
4,07
94.
9%3.
0% (1
,161
)25
.5%
Hou
nslo
w P
CT
3,69
36.
7%3.
7% (1
,584
)19
.8%
Sou
thw
ark
PC
T7,
464
9.4%
7.5%
(1,0
85)
29.6
%K
ings
ton
PC
T5,
176
9.7%
2.9%
(1,2
25)
22.2
%S
utto
n an
d M
erto
n P
CT
12,4
9411
.2%
4.8%
(2,5
15)
25.5
%N
ewha
m P
CT
9,82
113
.3%
2.7%
(804
)2.
9%H
aver
ing
PC
T11
,354
16.4
%2.
4% (9
89)
23.5
%H
amm
ersm
ith a
nd F
ulha
m P
CT
6,71
016
.8%
1.9%
(738
)29
.5%
Hilli
ngdo
n P
CT
12,4
7017
.4%
1.0%
(733
)20
.8%
Cro
ydon
PC
T18
,055
18.5
%5.
0% (7
65)
25.2
%C
amde
n P
CT
13,7
8121
.2%
7.6%
(1,3
40)
42.2
%B
rom
ley
PC
T20
,995
21.3
%3.
2% (1
,931
)26
.5%
Islin
gton
PC
T10
,747
21.5
%4.
9% (1
,586
)20
.5%
Ric
hmon
d an
d Tw
icke
nham
PC
T13
,049
21.7
%5.
6% (1
,296
)42
.9%
City
and
Hac
kney
Tea
chin
g P
CT
13,5
6024
.4%
4.8%
(1,5
61)
18.9
%H
arin
gey
Teac
hing
PC
T17
,493
26.6
%10
.4%
(2,3
89)
16.7
%W
ands
wor
th P
CT
21,9
4926
.8%
6.7%
(2,1
24)
14.2
%Le
wis
ham
PC
T19
,675
27.1
%6.
6% (1
,475
)12
.4%
Eal
ing
PC
T19
,279
27.5
%5.
2% (2
,510
)10
.8%
Ken
sing
ton
and
Che
lsea
PC
T14
,385
28.5
%0.
0% (2
14)
50.1
%La
mbe
th P
CT
26,3
2728
.8%
7.2%
(1,3
20)
15.5
%B
arki
ng a
nd D
agen
ham
PC
T11
,977
29.0
%5.
9% (8
86)
11.4
%To
wer
Ham
lets
PC
T13
,844
30.1
%5.
3% (2
,157
)13
.2%
Wes
tmin
ster
PC
T20
,962
33.9
%5.
8% (2
,117
)44
.6%
Gre
enw
ich
Teac
hing
PC
T25
,404
34.5
%5.
8% (1
,283
)22
.2%
Bex
ley
Car
e Tr
ust
23,7
6034
.8%
6.8%
(1,7
51)
17.9
%B
rent
Tea
chin
g P
CT
30,0
2636
.1%
7.7%
(3,1
11)
11.3
%
So
uth
wes
t p
cTs
num
ber
of
peo
ple
who
w
ere
off
ered
an
nH
S
Hea
lth
che
ck
in 2
011/
12
per
cent
age
of
elig
ible
p
eop
le t
hat
wer
e o
ffer
ed a
n n
HS
Hea
lth
che
ck in
201
1/12
(e
xpec
ted
tar
get
: 18%
)
per
cent
age
of
elig
ible
p
eop
le t
hat
wer
e o
ffer
ed
an n
HS
Hea
lth
che
ck
ap
ril–
June
201
2 (n
umb
er o
f ch
ecks
co
nduc
ted
)
per
cent
age
und
iag
nose
d (u
sing
Q
oF
pre
vale
nce
as a
% o
f a
pH
o e
stim
ated
pre
vale
nce
mo
del
) 201
1 n
ote
: ave
rage
in E
ngla
nd is
23
.40%
(ran
ge 1
.5%
–50.
1%)
Cor
nwal
l and
Isle
s of
Sci
lly P
CT
250.
0%0.
0% (0
)33
.8%
Nor
th S
omer
set P
CT
1,16
21.
6%2.
7% (9
70)
33.3
%S
omer
set P
CT
4,25
42.
4%2.
3% (1
,801
)31
.5%
Bris
tol P
CT
4,14
73.
8%0.
1% (
68)
26.0
%P
lym
outh
Tea
chin
g P
CT
3,05
44.
2%0.
4% (1
69)
23.8
%D
orse
t PC
T7,
637
5.1%
1.1%
(900
)38
.0%
Sou
th G
louc
este
rshi
re P
CT
7,27
59.
9%3.
4% (2
,042
)29
.2%
Dev
on P
CT
36,2
7512
.3%
3.6%
(3,3
59)
36.4
%B
ourn
emou
th a
nd P
oole
Tea
chin
g P
CT
12,7
8413
.8%
0.0%
(0)
15.8
%W
iltsh
ire P
CT
25,0
0215
.6%
5.9%
(4,3
08)
28.6
%B
ath
and
Nor
th E
ast S
omer
set P
CT
10,0
6919
.0%
6.3%
(833
)29
.1%
Sw
indo
n P
CT
12,1
8619
.9%
3.3%
(869
)14
.7%
Torb
ay C
are
Trus
t10
,604
22.9
%3.
4% (7
55)
29.3
%G
louc
este
rshi
re P
CT
46,2
8523
.6%
5.6%
(4,3
74)
22.8
%

22 THE NHS HEALTH CHECK PROGRAMME: LET’S GET IT RIGHT
So
uth
Eas
t p
cTs
num
ber
of
peo
ple
who
w
ere
off
ered
an
nH
S
Hea
lth
che
ck
in 2
011/
12
per
cent
age
of
elig
ible
p
eop
le t
hat
wer
e o
ffer
ed a
n n
HS
Hea
lth
che
ck in
201
1/12
(e
xpec
ted
tar
get
: 18%
)
per
cent
age
of
elig
ible
p
eop
le t
hat
wer
e o
ffer
ed
an n
HS
Hea
lth
che
ck
ap
ril–
June
201
2 (n
umb
er o
f ch
ecks
co
nduc
ted
)
per
cent
age
und
iag
nose
d (u
sing
Q
oF
pre
vale
nce
as a
% o
f a
pH
o e
stim
ated
pre
vale
nce
mo
del
) 201
1 n
ote
: ave
rage
in E
ngla
nd is
23
.40%
(ran
ge 1
.5%
- 5
0.1%
)M
ilton
Key
nes
PC
T0
0.0%
0.0%
(0)
26.0
%S
urre
y P
CT
3,38
31.
0%0.
1% (4
71)
28.4
%B
erks
hire
Eas
t PC
T1,
316
1.2%
0.2%
(67)
18.2
%Is
le o
f Wig
ht N
HS
PC
T73
61.
6%6.
4% (1
,384
)35
.7%
Wes
t Ken
t PC
T11
,687
5.2%
1.0%
(1,7
55)
27.6
%W
est S
usse
x P
CT
20,6
557.
8%2.
6% (3
,220
)28
.8%
Eas
t Sus
sex
Dow
ns a
nd W
eald
PC
T9,
609
8.2%
1.8%
(1,1
80)
35.7
%E
aste
rn a
nd C
oast
al K
ent P
CT
20,6
618.
6%5.
8% (4
,705
)22
.1%
Has
tings
and
Rot
her P
CT
7,49
012
.1%
1.3%
(344
)35
.9%
Ber
kshi
re W
est P
CT
14,9
4512
.3%
2.8%
(1,7
68)
29.7
%O
xfor
dshi
re P
CT
25,0
1813
.6%
4.8%
(3,6
02)
18.3
%B
ucki
ngha
msh
ire P
CT
25,1
2513
.9%
4.7%
(4,7
39)
35.6
%S
outh
ampt
on C
ity P
CT
8,51
114
.6%
3.3%
(1,2
76)
18.3
%B
right
on a
nd H
ove
City
PC
T11
,046
15.9
%4.
9% (1
,182
)32
.6%
Ham
pshi
re P
CT
76,3
5118
.6%
5.4%
(11,
302)
26.2
%P
orts
mou
th C
ity T
each
ing
PC
T10
,540
21.3
%6.
1% (8
41)
21.1
%M
edw
ay P
CT
16,9
0621
.4%
9.3%
(1,4
95)
1.5%

23THE NHS HEALTH CHECK PROGRAMME: LET’S GET IT RIGHT
no
rth
wes
t p
cTs
num
ber
of
peo
ple
who
w
ere
off
ered
an
nH
S H
ealt
h c
heck
in
2011
/12
per
cent
age
of
elig
ible
p
eop
le t
hat
wer
e o
ffer
ed a
n n
HS
Hea
lth
che
ck in
201
1/12
(e
xpec
ted
tar
get
: 18%
)
per
cent
age
of
elig
ible
p
eop
le t
hat
wer
e o
ffer
ed
an n
HS
Hea
lth
che
ck
ap
ril–
June
201
2 (n
umb
er o
f ch
ecks
co
nduc
ted
)
per
cent
age
und
iag
nose
d (u
sing
Q
oF
pre
vale
nce
as a
% o
f a
pH
o e
stim
ated
pre
vale
nce
mo
del
) 201
1 n
ote
: ave
rage
in E
ngla
nd is
23
.40%
(ran
ge 1
.5%
- 5
0.1%
)W
este
rn C
hesh
ire P
CT
00.
0%0.
0% (0
)22
.7%
Cum
bria
Tea
chin
g P
CT
904
0.5%
1.0%
(1,6
74)
32.8
%B
ury
PC
T2,
020
3.7%
1.5%
(455
)26
.7%
War
ringt
on P
CT
2,94
34.
5%0.
7% (1
97)
16.5
%B
lack
pool
PC
T2,
793
5.9%
5.3%
(1,3
00)
23.0
%O
ldha
m P
CT
4,98
07.
7%2.
4% (8
30)
24.7
%N
orth
Lan
cash
ire T
each
ing
PC
T9,
832
8.9%
3.2%
(3,5
03)
26.9
%C
entr
al a
nd E
aste
rn C
hesh
ire P
CT
18,7
189.
5%3.
7% (2
,761
)22
.3%
Bol
ton
PC
T9,
912
9.7%
0.7%
(417
)13
.2%
Tam
esid
e an
d G
loss
op P
CT
7,63
39.
9%5.
5% (1
,643
)26
.6%
Eas
t Lan
cash
ire T
each
ing
PC
T18
,148
13.1
%4.
5% (3
,393
)27
.8%
Sal
ford
PC
T9,
457
14.9
%5.
2% (6
00)
16.1
%C
entr
al L
anca
shire
PC
T19
,410
15.3
%7.
3% (2
,735
)24
.0%
Ash
ton,
Lei
gh a
nd W
igan
PC
T16
,983
16.7
%5.
1% (3
,682
)17
.5%
Traf
ford
PC
T12
,600
18.0
%4.
1% (1
,283
)18
.2%
Sto
ckpo
rt P
CT
19,6
2518
.0%
4.4%
(3,6
40)
23.4
%K
now
sley
PC
T8,
028
18.1
%6.
1% (6
30)
15.3
%W
irral
PC
T21
,844
19.9
%8.
5% (4
,146
)20
.9%
Sef
ton
PC
T18
,350
21.0
%6.
6% (2
,139
)28
.7%
Hal
ton
and
St H
elen
s P
CT
22,7
9624
.9%
2.9%
(1,5
27)
8.3%
Man
ches
ter P
CT
23,3
7326
.0%
6.3%
(1,7
21)
15.3
%H
eyw
ood,
Mid
dlet
on a
nd R
ochd
ale
PC
T14
,828
27.1
%6.
9% (2
,326
)23
.0%
Bla
ckbu
rn w
ith D
arw
en T
each
ing
Car
e Tr
ust P
lus
14,1
9438
.4%
4.4%
(815
)9.
6%
Live
rpoo
l PC
T82
,591
91.1
%15
.4%
(4,9
60)
20.4
%

Macleod House, 10 Parkway, London NW1 7AATel 020 7424 1000 Email [email protected] Fax 020 7424 1001 web www.diabetes.org.uk A charity registered in England and Wales (215199) and in Scotland (SC039136). © Diabetes UK 2012
BeCoMe a MeMBer0845 123 2399
Join as a healthcare professional or a person
living with diabetes.
Join us and help to strengthen our voice.