Embed Size (px)
Citation preview

REVIEW Open Access
Prevalence and epidemiologicaldistribution of selected foodbornepathogens in human and differentenvironmental samples in Ethiopia: asystematic review and meta-analysisDinaol Belina1* , Yonas Hailu2,3, Tesfaye Gobena4, Tine Hald3 and Patrick Murigu Kamau Njage3
Abstract
Bacterial Foodborne Pathogens (FBP) are the commonest cause of foodborne illness or foodborne diseases (FBD)worldwide. They contaminate food at any stages in the entire food chain, from farm to dining-table. Among these,the Diarrheagenic Escherichia coli (DEC), Non typhoidal Salmonella (NTS), Shigella spp. and Campylobacter spp. areresponsible for a large proportion of illnesses, deaths; and, particularly, as causes of acute diarrheal diseases. Thoughexisting studies indicate the problem may be severe in developing countries like Ethiopia, the evidence iscommonly based on fragmented data from individual studies. A review of published and unpublished manuscriptswas conducted to obtain information on major FBP and identify the gaps in tracking their source attributions at thehuman, animal and environmental interface. A total of 1753 articles were initially retrieved after restricting the studyperiod to between January 2000 and July 2020. After the second screening, only 51 articles on the humans and 43on the environmental sample based studies were included in this review. In the absence of subgroups, overall aswell as human stool and environmental sample based pooled prevalence estimate of FBP were analyzed. Since,substantial heterogeneity is expected, we also performed a subgroup analyses for principal study variables toestimate pooled prevalence of FBP at different epidemiological settings in both sample sources. The overall randompooled prevalence estimate of FBP (Salmonella, pathogenic Escherichia coli (E. coli), Shigella and Campylobacter spp.)was 8%; 95% CI: 6.5–8.7, with statistically higher (P < 0.01) estimates in environmental samples (11%) than in humanstool (6%). The subgroup analysis depicted that Salmonella and pathogenic E. coli contributed to 5.7% (95% CI: 4.7–6.8) and 11.6% (95% CI: 8.8–15.1) respectively, of the overall pooled prevalence estimates of FBD in Ethiopia. Theresult of meta-regression showed, administrative regional state, geographic area of the study, source of sample andcategorized sample size all significantly contributed to the heterogeneity of Salmonella and pathogenic E. coliestimates. Besides, the multivariate meta- regression indicated the actual study year between 2011 and 2015 wassignificantly associated with the environmental sample-based prevalence estimates of these FBP. This systematicreview and meta-analysis depicted FBP are important in Ethiopia though majority of the studies were conductedseparately either in human, animal or environmental samples employing routine culture based diagnostic method.
© The Author(s). 2021 Open Access This article is licensed under a Creative Commons Attribution 4.0 International License,which permits use, sharing, adaptation, distribution and reproduction in any medium or format, as long as you giveappropriate credit to the original author(s) and the source, provide a link to the Creative Commons licence, and indicate ifchanges were made. The images or other third party material in this article are included in the article's Creative Commonslicence, unless indicated otherwise in a credit line to the material. If material is not included in the article's Creative Commonslicence and your intended use is not permitted by statutory regulation or exceeds the permitted use, you will need to obtainpermission directly from the copyright holder. To view a copy of this licence, visit http://creativecommons.org/licenses/by/4.0/.
* Correspondence: [email protected]; [email protected] of Veterinary Medicine, Haramaya University, P.O. Box 138, DireDawa, EthiopiaFull list of author information is available at the end of the article
One Health OutlookBelina et al. One Health Outlook (2021) 3:19 https://doi.org/10.1186/s42522-021-00048-5

Thus, further FBD study at the human, animal and environmental interface employing advanced diagnosticmethods is needed to investigate source attributions of FBD in one health approach.
Keywords: Bacteria, FBP, Meta-analysis, Source attribution, Ethiopia
IntroductionFoodborne pathogens (FBP) are biological agents like vi-ruses, bacteria and parasites that can cause a foodborneillness or foodborne diseases (FBD). Foodborne disease(also referred to as foodborne illness or food poisoning)is any illness that results from the consumption of foodcontaminated with pathogenic bacteria, viruses, or para-sites [1]. Foodborne illness or food poisoning is mostlyresulted from eating contaminated, spoiled, or toxic foodand basically, FBD can be due to foodborne infection,foodborne intoxication or foodborne intoxico-infection[2, 3].Foodborne pathogens (FBP) cause millions of cases of
sporadic illness and chronic complications, as well aslarge and challenging outbreaks in many countries andbetween countries [4]. The effect of these pathogens alsovaries from region to region as level of public awarenessabout food hygiene varies in different countries. Rane [5]and Paudyal et al. [6] explained, most of the FBP are in-troduced as exogenous contaminants during handling,processing and preparation rather than being present asendogenous contaminants. The problem is severe in de-veloping countries like Ethiopia due to limitations in se-curing optimal hygienic food handling practices [7, 8].Pathogenic bacteria contaminate food at any stages in
the entire food chain from farm to dining-table [9].Humans can acquire pathogens or their infectionsthrough consumption of a variety of contaminated foodsand water, or through contact with infected livestockand other animal feces. Infected human and environ-ment are also source of the infection [10, 11]. Salmon-ella, Listeria monocytogenes, Escherichia coli (E. coli),Campylobacter spp. [8, 12] and Shigella [7, 13] areamong the most common FBP reported from Ethiopia.Specifically, FBP like Diarrheagenic E. coli and NTS areconstantly being excreted into the environment inmassive quantities and they are responsible for a largeproportion of illnesses and deaths; more importantly, assources of acute diarrheal diseases in children [14].Food-producing animals are the major reservoirs formany FBP [4]. Direct and indirect contact with animals(livestock and other animal), and their feces carryingzoonotic pathogens or the farming environment are im-portant risk factors for FBD. Hence, the health of peopleis connected to the health of animals and the environ-ment [15].In developing countries like Ethiopia, the primary
sources of Salmonella infection in human are food
animals such as cattle, poultry and swine, mainly viacontamination of carcass with the gastrointestinal con-tent during slaughtering [16, 17]. Cattle are also themajor reservoirs of E. coli O157:H7 followed by sheepand goats. The pathogens are shed intermittently infeces of infected animals [18, 19]. Escherichia coli infec-tion is usually severe in the old age and under five chil-dren; especially shiga toxin-producing E. coli O157: H7causes the most severe condition in immune-compromised individuals and also in those healthypeople exposed to a very high dose [2, 10]. Ethiopia isparticularly vulnerable to the effect of zoonotic diseasesbecause the economy is largely dependent on agriculture[20, 21] and roughly 80% of households have direct con-tact with domestic animals, creating an opportunity forinfection and spread of disease [12, 22, 23]. A study con-ducted in Ethiopia reported high pathogenic E. coliprevalence up to 51.6% [24]. Tosisa [25] also reported, E.coli as one of the most common cause of acute infec-tious diarrhea in children. A recent meta-analysis of 30articles from Ethiopia also showed 18.1% pooled preva-lence estimates of E. coli in foods of animal origin [26].A study conducted in Ethiopia reported 8.72, 5.68 and
1.08% pooled prevalence estimates of Salmonella in diar-rheic children, adults and carriers, respectively. NontyphiSalmonella accounted for 57.9% of the reported isolates[27]. Enteric Salmonella infection prevalence of 5.5%[24] and 1.3% [28], were also reported from Debre Ber-han and Ambo, respectively in under five children(UFC). Eguale et al. [29] and Eguale et al. [17] also re-ported prevalence of 7.2, 4.7 and 4.4% Salmonella in hu-man patients, poultry and swine respectively.Even though bacterial FBP are important in Ethiopia;
implementation of pathogen prevention and controlintervention strategies are poor or challenging becausethere are no detailed surveillance and published data onthe incidence of FBP [8]. Again, there is little well docu-mented information regarding the current status, specif-ically on FBP pathotype detected, and the epidemiologyand their source attributions in Ethiopia. Besides, a fewsystematic review and meta-analysis have been con-ducted on FBP in Ethiopia, and those reviews are onlyfocused on FBP report in different food items, particu-larly in foods of animal origin, which did not considerthe source of bacterial contamination. Thus, it is timelyand pertinent to conduct a comprehensive scientific re-view on recent status of FBP in human, animal and otherenvironmental samples to support proper and focused
Belina et al. One Health Outlook (2021) 3:19 Page 2 of 30

scholarly effort. Therefore, to the level of our knowledge,this is the first systematic review and meta-analysis re-port that investigates FBP in both human and environ-mental samples in the case of Ethiopia. Hence, this studyaims at reviewing the reports available on major FBPand identifying the gaps in the source attributions ofFBP of high importance (Salmonella and E. coli) at thehuman, animal and environmental interface.
MethodologyInitially, a total of 2498 articles (2470 from PMC, BMCmedicine and direct Google and 28 from university re-positories) were searched for Salmonella, E. coli, Shigellaand Campylobacter spp. However, to optimize the man-agement of data, this study only focused on Salmonellaand E. coli. The data extracted on Shigella and Campylo-bacter spp. is only used in the determination of the over-all pooled prevalence estimates of FBP in Ethiopia(Table 4) and is not reported in this study. However, thedata is accessible by requesting from the authors. On theother hand, most of the studies included in this analysis(fulfilling the inclusion criteria) reported only E. coliprevalence in general and did not mention specificpathotypes. Thus, in this study, if a sample is positive forany of the six E. coli pathotypes, it was considered aspositive for pathogenic E. coli, and the E. coli mentionedrefers to the pathogenic E. coli.
Frame work of the studyFor this systematic review and meta-analysis on FBP, weidentified the analytical framework in which the publicliving in Ethiopia is considered as study population whileFBP attribution and its epidemiology were taken as aphenomenon of interests. The context was the health-care facilities and non-healthcare institutions involved infood establishments and veterinary institutes to wherepublic health researchers usually give attentions. The re-view was framed based on research questions: What isthe overall pooled prevalence of FBD, and which bacter-ial FBP are more important, in Ethiopia? Do the occur-rences of Salmonella and E. coli vary in theirepidemiological distribution, and what are their respect-ive associated sources?
Literature search strategy and pathogen prioritizationA comprehensive literature search was conducted elec-tronically to collect published articles, short communica-tions and study reports on FBP and its sourceattributions and epidemiology in Ethiopia. Published ar-ticles/or reports were searched from PMC and BMC(medicine) journal electronic data bases and alsothrough direct Google search. Additionally, graduatethesis and dissertations were collected from Universityrepositories like Addis Ababa and Haramaya
Universities, and manual search was also conducted forunpublished manuscripts. In the searching process weused free text and medical subject heading terms com-bined with FBD/FBP related keywords. In the first steps,we selected specific key words (for supplementary file,see Annex 1) to search potential articles to identifyingthe most important FBP in children in Ethiopia.By reviewing articles and reports searched by these
terms, Salmonella, E. coli, Shigella, campylobacter,Staphylococcus aureus and Listeria monocytogenes wereidentified as the most prevalent FBP, particularly thoseassociated with diarrhea in children in Ethiopia. Beside,we referred the work of Pieracci et al [12], who priori-tized zoonotic diseases in Ethiopia using a one healthapproach, and reported that Salmonella, Campylobacterand E. coli are among the top eight bacterial FBP. There-fore, based on our preliminary review results (FBD indiarrheic children in Ethiopia), we decided to conductthe review on selected bacterial FBP i.e. Salmonella, E.coli, Shigella and Campylobacter. In this regard, the sec-ond searching steps were conducted to retrieve litera-tures for the identified four FBP or their diseaseconditions from the above mentioned databases and uni-versity repositories using different specific search termscombined with the genus name of the bacterial pathogen(Table 1). Studies published after the year 2000 whoseabstracts were accessible as per the searching time wereretrieved. The search was performed twice with the sec-ond search on July 24, 2020 after phase one aimed atchecking for missed papers (if any).
Eligibility criteria and screening proceduresInclusion criteria: study areaOnly studies conducted in Ethiopia. Population: Studiesincluding metrics for sample size and which directlyand/or indirectly provided prevalence of FBD/FBP withor without age specific estimates were included. Studydesign: All observational and retrospective studies aswell as baseline investigations from prospective studieswith defined FBD/FBP in which the actual study periodwas limited to within the last 20 years. Sample type: onlystudies which reported FBP prevalence in stool samples(in human case) and environmental samples were in-cluded. Language: Only articles reported in English lan-guage were considered. Period and publicationcondition: Both published and unpublished articles inwhich the actual data collection, processing and labora-tory analysis were restricted to the period from January2000 to July 2020 were included.
Exclusion criteriaArticle citations with no abstracts and/or full texts, du-plicate studies, and studies in which number of positivecases and total sample sizes were not reported (if the
Belina et al. One Health Outlook (2021) 3:19 Page 3 of 30

prevalence was only reported as percentage) were ex-cluded. Studies in which, general FBD burden is re-ported (in which the pathogen is not specified), thediagnostic method (microbial detection technique) is notdescribed and FBP studies in wildlife, were also excludedfrom the meta-analysis.
Screening procedures and relevance of the studyRegarding relevance and quality of the studies, two inde-pendent reviewers (DB and YH) first identified both thedetails of the study variables or outcomes (Fig. 2) andthe search terms based on research questions under theframework. Search terms and screening methods weremodified with justification to include hand searchesthrough discussion with TG. Then the other authors THand PMK, commented on the overall framework and thedata synthesis approaches. Predefined guidelines for ac-curate and transparent health estimates reporting(GATHER) checklist was also used for screening. Inaddition, in order to minimize biases, we agreed to in-clude publication year together with actual study year aswell as to extend year of study to 20 years which in turnbroaden the number of included studies (i.e., data fromJanuary 2000 to July 2020 studies).Then two independent reviewers (DB and YH)
searched and screened out articles using titles and ab-stracts. De-duplication of the studies was performedusing endnote software which was also corrected bymanual method. Relevance of the studies was checkedand references were excluded up on the two reviewers’agreement. Also dissents raised at this first screeningstage were resolved by involvement of the other authors.Each complete article was screened separately by two re-viewers per reference for the inclusion and exclusion cri-teria developed prior to data extraction. Any conflict
raised at this second screening stage was also resolvedwith the third reviewer prior to data extraction. Relevantdata/information related to study characteristics wereassessed from the retrieved abstracts and full articles,and the studies that fail to fit the study criteria were re-moved. Thus, articles used in our study passed throughdifferent screening steps from identification to final art-icle inclusion. Of the 1753 manuscripts searched, only94 studies were found eligible for systematic review andmeta-analysis (Table 1; Fig. 1) though 120 studies screedfrom 2498 searched manuscripts were used for the over-all pooled prevalence estimates of FBD (Fig. 1).
Measurement of the outcome variables and theirdescriptionWe have two main outcomes, namely, the human stool,and environmental sample based outcome variables ofFBP, because some of the studies focused on FBP in hu-man stool in different age groups, and other studies wereconducted on different environmental samples. Some ofthe studies were also conducted before ten years andothers were relatively recent, and etc. So it is possiblethat these studies would yield different summary esti-mates. In fact, a thorough moderator analysis is more in-formative than a single estimate of summary effect sizewhen meta-analytic data being examined contains sub-stantial heterogeneity [30]. Moderators are often cat-egorical, either because of inherent factors or becausethe information provided in articles does not allow formore fine-grained coding [31].Similar to primary studies, moderator analyses have a
sample of participants (i.e., the studies included in ameta-analysis), one or multiple independent variables(i.e., moderating variables) and one dependent variable(i.e., effect sizes within each subgroup) [30]. According
Table 1 Search terms used to retrieve articles and number of articles searched for screening
Search terms developed and used FBP
Salmonella E. coli OthersourceBMC Pubmed BMC Pubmed
“Organism” and “Ethiopia” 165 166 236 191 6
“Organism” and “Ethiopia” and “Diarrhea” 73 28 79 12 3
“Organism” and “Ethiopia” and “children” and “Diarrhea” 48 14 51 6 1
“Organism” and “Ethiopia” and “under five children” and “Diarrhea” 40 6 39 2 4
“Prevalence” and “Organism” and “Ethiopia” and “Diarrhea” 53 19 55 4 1
“Isolation” and “Organism” and “Ethiopia” and “children” and “Diarrhea” 22 10 26 3 2
“Epidemiology” and “Organism” and “Ethiopia” and “children” 29 19 37 12 0
“Prevalence” and “Organism” and “Ethiopia” and “children” and “Diarrhea” 41 11 42 3 0
“Diarrheagenic E. coli” and “Ethiopia” 0 192 2
Total 471 273 565 425 19
N. B.: The word “organism” separately replaced by Salmonella and E. coliOther source = unpublished sources like university repositories and direct Google search
Belina et al. One Health Outlook (2021) 3:19 Page 4 of 30

to Hamza et al. [32], under the framework of subgroupanalysis, the total set of studies is split into two or moresubgroups based on the categories within a categoricalmoderator and the effect in one subgroup of studies iscompared with that in the rest of the subgroup(s) ofstudies. When the between-study variance (I2) is greaterthan zero (0%), the overall heterogeneity can beaccounted for by the true differences between studies.Thus, it makes sense to apply sub-group analyses ormeta-regressions to identify potential moderating factorsthat can explain the inconsistencies between effect sizesacross studies or factors that can influence or explainthe relationships [30, 33]. It is assumed that an I2 of 25,50, and 75% indicate low, medium, and large heterogen-eity, respectively [34, 35].Hence, in this study, the overall and separate subgroup
prevalence estimates of FBP with their epidemiologicaldistribution and the source attributions were calculatedfor both human stool and environmental sample basedoutcomes. Important variables including age group, sam-ple type, diagnostic techniques, study design or type, ac-tual study year (Fig. 2) were considered in order todetermine prevalence estimates of FBD and the epi-demiological risk factors. Of the nine administrative re-gional states (the 10th region, recently establishedregion, Sidama is considered in SNNP) and two citycouncils in Ethiopia, overall studies conducted in eight
regions (only study from Afar region is not screened)and the two city councils were included.Likewise, to test how the summary effects would
change with different types of studies or different char-acteristics of participants in the study, we need to obtainat least the minimum acceptable number of studies inorder to run subgroup analyses and meta-regression[33]. We also followed the principle that when the sizesof the included studies are moderate or large, thereshould be at least 6 to 10 studies for a continuous studylevel variable; and for a (categorical) subgroup variable,each subgroup should have a minimum of 4 studies [36].Of the 11 subgroup variables analysed in the present
study, majority of them encompass more than 10 stud-ies. Variables with less than 4 included studies were ei-ther excluded (e.g. molecular diagnostic technique) ormerged and named with new designation to be used forpooled estimate comparison. For instance, few studyareas were merged mainly based on their proximity ingeographic area plus number of studies, and then labeledas “other”. Likewise, the studies conducted in Dire Dawacity and Harari regional state were less than the mini-mum limits of subgroup analysis criteria and, hence, wemerged them as Dawa and Harari regional state. Regard-ing environmental samples, feces from any domestic ani-mal expect that of poultry was designated as “animalfeces” in the subgroup analysis.
Fig. 1 Flow chart of study selection for systematic review and meta-analysis of Salmonella and pathogenic E. coli in Ethiopia. Note: N = number ofmanuscripts used for overall pooled prevalence estimates of FBD; n = number of studies specific to Salmonella and pathogenic E. coli used in thecurrent FBP analysis
Belina et al. One Health Outlook (2021) 3:19 Page 5 of 30
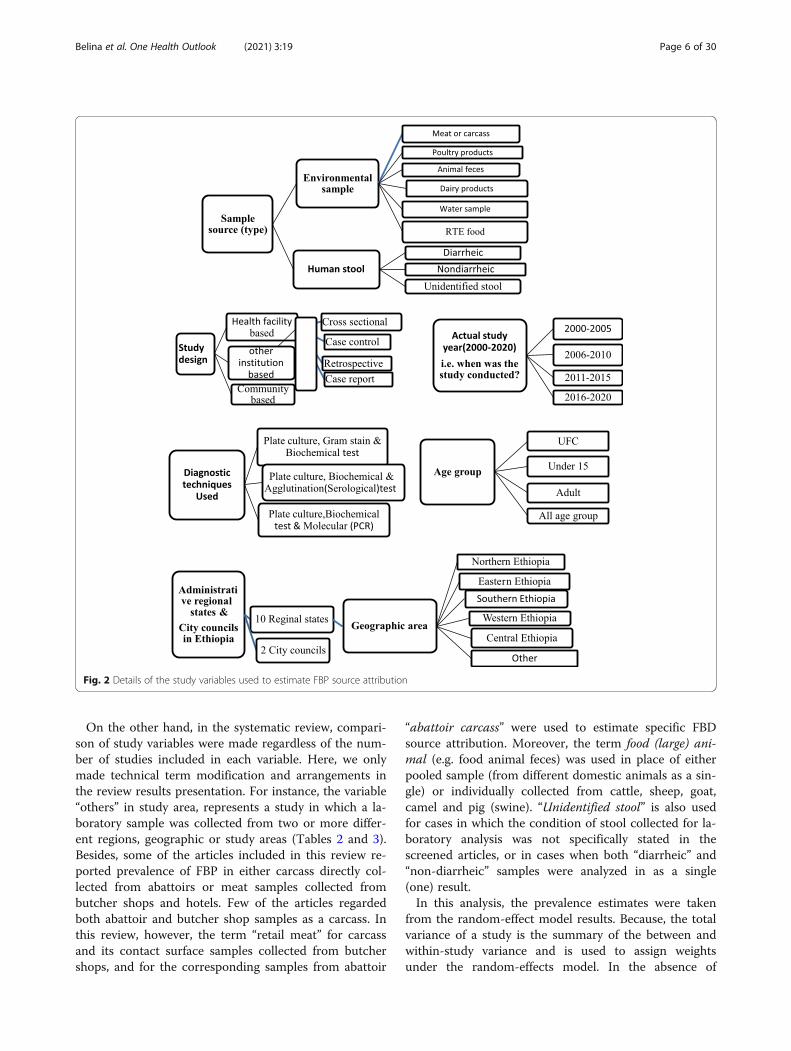
On the other hand, in the systematic review, compari-son of study variables were made regardless of the num-ber of studies included in each variable. Here, we onlymade technical term modification and arrangements inthe review results presentation. For instance, the variable“others” in study area, represents a study in which a la-boratory sample was collected from two or more differ-ent regions, geographic or study areas (Tables 2 and 3).Besides, some of the articles included in this review re-ported prevalence of FBP in either carcass directly col-lected from abattoirs or meat samples collected frombutcher shops and hotels. Few of the articles regardedboth abattoir and butcher shop samples as a carcass. Inthis review, however, the term “retail meat” for carcassand its contact surface samples collected from butchershops, and for the corresponding samples from abattoir
“abattoir carcass” were used to estimate specific FBDsource attribution. Moreover, the term food (large) ani-mal (e.g. food animal feces) was used in place of eitherpooled sample (from different domestic animals as a sin-gle) or individually collected from cattle, sheep, goat,camel and pig (swine). “Unidentified stool” is also usedfor cases in which the condition of stool collected for la-boratory analysis was not specifically stated in thescreened articles, or in cases when both “diarrheic” and“non-diarrheic” samples were analyzed in as a single(one) result.In this analysis, the prevalence estimates were taken
from the random-effect model results. Because, the totalvariance of a study is the summary of the between andwithin-study variance and is used to assign weightsunder the random-effects model. In the absence of
Fig. 2 Details of the study variables used to estimate FBP source attribution
Belina et al. One Health Outlook (2021) 3:19 Page 6 of 30

Table 2 Summary of eligible studies of FBD and variables used for prevalence estimates of pathogens in human stool samples inEthiopiaFBP Reference Year Of
StudyGeographicarea
Region District ortown
Studydesign
Agegroup
Stoolcondition
Diagnostictechnique
Samplesize
Nopositive
95%-CI %
Eschechiacoli
[37] 2014 Central Ethiopia other other HFB CS All age Diarrheic C, Gs and BT 70 0 0.00(0.04–10.27)
Eschechiacoli
[38] 2017 NorthwestEthiopia
Amhara Bahir Dar HFB CS UFC Diarrheic C, Gs and BT 344 35 10.17(7.39–13.84)
Eschechiacoli
[39] 2012 NorthwestEthiopia
Amhara Bahir Dar HFB CS UFC Diarrheic C, BT and Ag 422 204 48.34(43.60–53.11)
Eschechiacoli
[40] 2015 SouthernEthiopia
SNNP Hawassa HFBretro
All age Diarrheic C, Gs and BT 170 0 0.00(0.02–4.50)
Eschechiacoli
[41] 2017 Central Ethiopia A.A A.A HFB CS under15
Diarrheic C, Gs and BT 290 13 4.48(2.62–7.57)
Eschechiacoli
[41] 2017 Central Ethiopia A.A A.A HFB CS UFC Diarrheic C, Gs and BT 140 8 5.71(2.88–11.01)
Eschechiacoli
[42] 2015 Central Ethiopia A.A A.A HFB CS UFC Diarrheic C, Gs and BT 253 61 24.11(19.24–29.76)
Eschechiacoli
[43] 2007 NorthwestEthiopia
Amhara Gondar HFB CS All age Diarrheic C, BT and Ag 384 0 0.00(0.01–2.04)
Eschechiacoli
[44] 2016 SouthernEthiopia
SNNP Hawassa HFB CS Adult Diarrheic C, BT and Ag 102 2 1.96(0.49–7.50)
Eschechiacoli
[44] 2016 SouthernEthiopia
SNNP Hawassa HFB CS Adult Diarrheic C, BT and Ag 113 0 0.00(0.03–6.62)
Eschechiacoli
[45] 2013 Central Ethiopia A.A A.A HFB CS UFC Diarrheic C, Gs and BT 253 61 24.11(19.24–29.76)
Eschechiacoli
[46] 2015 Eastern Ethiopia Diredawa
Dire dawa HFB CS UFC Diarrheic C, Gs and BT 196 25 12.76(8.77–18.20)
Eschechiacoli
[24] 2016 Central Ethiopia Amhara D/ Berhan HFB CS UFC Diarrheic C, Gs and BT 163 47 28.83(22.40–36.25)
Eschechiacoli
[47] 2018 NorthwestEthiopia
Amhara Gondar IB CS Adult Nondiarrheic C, Gs and BT 257 5 1.95(0.81–4.59)
Eschechiacoli
[48] 2015 NorthwestEthiopia
Amhara D/Markos HFBretro
UFC Unidentified C, Gs and BT 50 1 2.00(1.95–17.02)
Eschechiacoli
[48] 2015 NorthwestEthiopia
Amhara D/Markos HFBretro
All age Unidentified C, Gs and BT 58 1 1.72(0.24–11.24)
Salmonella [29] 2014 Central Ethiopia A.A A.A HFB CS All age Diarrheic C, BT, Ag andMol
957 59 6.17(4.81–7.88)
Salmonella [49] 2016 Central Ethiopia A.A A.A HFB CS All age Diarrheic C, BT and Ag 99 7 7.07(3.41–14.10)
Salmonella [50] 2017 SouthernEthiopia
SNNP Hosanna HFB CS UFC Diarrheic C, Gs and BT 204 2 0.98(0.25–3.83)
Salmonella [38] 2017 NorthwestEthiopia
Amhara Bahir Dar HFB CS UFC Diarrheic C, Gs and BT 344 6 1.74(0.79–3.83)
Salmonella [51] 2012 NorthwestEthiopia
Amhara Bahir Dar HFB CS UFC Diarrheic C, BT and Ag 422 33 7.82(5.61–10.80)
Salmonella [52] 2017 SouthernEthiopia
SNNP A/Minch HFB CS UFC Diarrheic C, Gs and BT 167 21 12.57(8.34–18.52)
Salmonella [40] 2015 SouthernEthiopia
SNNP Hawassa HFBretro
All age Diarrheic C, Gs and BT 170 5 2.94(1.23–6.87)
Salmonella [53] 2002 Central Ethiopia A.A A.A HFB CS All age Diarrheic C, Gs and BT 205 22 10.73(7.17–15.76)
Salmonella [54] 2016 SoutheastEthiopia
Oromia Bale Robe HFB CS UFC Diarrheic C, Gs and BT 139 7 5.04(2.42–10.19)
Salmonella [54] 2016 SoutheastEthiopia
Oromia Goba HFB CS UFC Diarrheic C, Gs and BT 283 22 7.77(5.17–11.52)
Salmonella [55] 2001 SouthwestEthiopia
Oromia Jimma HFB CS Adult Diarrheic C, Gs and BT 152 11 7.24(4.05–12.59)
Salmonella [41] 2017 Central Ethiopia A.A A.A HFB CS UFC Diarrheic C, Gs and BT 140 4 2.86(1.08–7.36)
Salmonella [41] 2017 Central Ethiopia A.A A.A HFB CS under15
Diarrheic C, Gs and BT 290 7 2.41(1.16–4.98)
Belina et al. One Health Outlook (2021) 3:19 Page 7 of 30

Table 2 Summary of eligible studies of FBD and variables used for prevalence estimates of pathogens in human stool samples inEthiopia (Continued)FBP Reference Year Of
StudyGeographicarea
Region District ortown
Studydesign
Agegroup
Stoolcondition
Diagnostictechnique
Samplesize
Nopositive
95%-CI %
Salmonella [56] 2003 SouthwestEthiopia
Oromia Jimma HFB CS under15
Diarrheic C, Gs and BT 430 21 4.88(3.21–7.37)
Salmonella [57] 2012 SouthwestEthiopia
Oromia Jimma HFB CS UFC Diarrheic C, Gs and BT 179 12 6.70(3.85–11.43)
Salmonella [57] 2012 SouthwestEthiopia
Oromia Jimma HFB CS under15
Diarrheic C, Gs and BT 260 16 6.15(3.80–9.81)
Salmonella [58] 2014 NorthwestEthiopia
Amhara Gondar HFB CS All age Diarrheic C, Gs and BT 372 4 1.08(0.40–2.83)
Salmonella [29] 2014 Central Ethiopia A.A A.A HFB CS UFC Diarrheic C, BT, Ag andMol
160 10 6.25(3.40–11.23)
Salmonella [13] 2016 NorthwestEthiopia
Amhara Wegera CB CS UFc Diarrheic C, Gs and BT 112 1 0.89(0.13–6.06)
Salmonella [59] 2012 NorthernEthiopia
Tigray Mekele HFB CS under15
Diarrheic C, BT and Ag 260 19 7.31(4.71–11.17)
Salmonella [59] 2012 NorthernEthiopia
Tigray Mekele HFB CS UFC Diarrheic C, BT and Ag 115 14 12.17(7.34–19.51)
Salmonella [42] 2015 Central Ethiopia A.A A.A HFB CS UFC Diarrheic C, Gs and BT 253 10 3.95(2.14–7.19)
Salmonella [60] 2015 Central Ethiopia A.A A.A HFB CS under10
Diarrheic C, Gs and BT 22 0 0.00(0.13–26.81)
Salmonella [61] 2019 SouthernEthiopia
SNNP Hawassa HFB CS under15
Diarrheic C, Gs and BT 263 1 0.38(0.05–2.65)
Salmonella [43] 2007 NorthwestEthiopia
Amhara Gondar HFB CS All age Diarrheic C, Gs and BT 384 6 1.56(0.70–3.43)
Salmonella [44] 2016 SouthernEthiopia
SNNP Hawassa HFB CS Adult Diarrheic C, BT and Ag 102 7 6.86(3.31–13.70)
Salmonella [62] 2014 SouthwestEthiopia
Oromia Jimma HFB CS All age Diarrheic C, Gs and BT 176 19 10.80(6.99–16.30)
Salmonella [62] 2014 SouthwestEthiopia
Oromia Jimma HFB CS under10
Diarrheic C, Gs and BT 54 6 11.11(5.08–22.60)
Salmonella [45] 2013 Central Ethiopia A.A A.A HFB CS UFC Diarrheic C, Gs and BT 253 10 3.95(2.14–7.19)
Salmonella [46] 2015 Eastern Ethiopia Diredawa
Dire dawa HFB CS UFC Diarrheic C, Gs and BT 196 7 3.57(1.71–7.30)
Salmonella [63] 2017 Western Ethiopia Gambella Gambella IB CS UFC Diarrheic C, Gs and BT 134 4 2.99(1.12–7.68)
Salmonella [64] 2012 Central Ethiopia SNNP Butajira HFB CS under15
Diarrheic C, BT and Ag 174 22 12.64(8.47–18.46)
Salmonella [64] 2012 Central Ethiopia SNNP Butajira HFB CS Adult Diarrheic C, BT and Ag 208 18 8.65(5.52–13.32)
Salmonella [65] 2011 SouthernEthiopia
SNNP Hawassa HFB CS UFC Diarrheic C, BT and Ag 158 4 2.53(0.95–6.55)
Salmonella [66] 2007 Eastern Ethiopia Harari Harar HFB CS Adult Diarrheic C, Gs and BT 244 28 11.48(8.04–16.12)
Salmonella [67] 2016 Western Ethiopia Oromia Nekemt HFB CS All age Diarrheic C, Gs and BT 422 30 7.11(5.01–9.99)
Salmonella [68] 2017 Central Ethiopia Oromia Adama HFB CS All age Diarrheic C, BT and Ag 232 20 8.62(5.63–12.98)
Salmonella [28] 2014 Central Ethiopia Oromia Ambo HFB CS UFC Diarrheic C, BT and Ag 239 3 1.26(0.41–3.82)
Salmonella [69] 2012 NorthwestEthiopia
Amhara Bahir Dar HFB CS UFC Diarrheic C, BT and Ag 422 33 7.82(5.61–10.80)
Salmonella [24] 2016 Central Ethiopia Amhara D/ Berhan HFB CS UFC Diarrheic C, Gs and BT 163 5 3.07(1.28–7.16)
Salmonella [70] 2009 NorthwestEthiopia
Amhara Bahir Dar IB CS Adult Mixed C, Gs and BT 384 6 1.56(0.70–3.43)
Salmonella [71] 2006 SouthwestEthiopia
Oromia Jimma HFB CS under15
Mixed C, BT and Ag 400 10 2.50(1.35–4.58)
Salmonella [71] 2006 Central Ethiopia A.A A.A HFB CS under15
Mixed C, BT and Ag 825 55 6.67(5.15–8.58)
Salmonella [72] 2016 NorthwestEthiopia
Amhara D/Markos IB CS Adult Nondiarrheic C, Gs and BT 220 8 3.64(1.83–7.10)
Salmonella [73] 2013 Central Ethiopia A.A A.A IB CS Adult Nondiarrheic C, Gs and BT 172 6 3.49(1.58–7.55)
Belina et al. One Health Outlook (2021) 3:19 Page 8 of 30

subgroups, the estimate of between-study variance (τ2) iscomputed based on the dispersion of all studies from thegrand mean [34]. According to Borenstein [34], in therandom-effects subgroup analysis, R2 index (explainableproportion of the between-study variance) can beemployed in meta-regression to indicate the proportion oftrue heterogeneity across all studies that can be accountedfor by one or a set of moderators in order to quantify themagnitude of their impact on study effects. Basically theR2 value ranges between 0(0%) and 1(100%).
Data extractionFollowing the second screening stage, standardizeddata abstraction format was prepared in Microsoftexcel and important data related to study characteris-tics (Table 2) was extracted from included articles in-dependently by the first two authors. Informationsuch as: name of the first author, sample size, num-ber of positive samples, actual study year, year ofpublication, participant age group, sample type, diag-nostic techniques, study design employed, administra-tive regional state or city council, geographic area,
specific study area (district or town) and bacterialpathogen isolated, were all extracted and consideredin the analysis. Finally, the authors independentlymade cross-checks for the extracted information be-fore the actual process of data analysis.
Data analysis and interpretationData management was initially performed on the datafile stored in the abstraction format to prepare a commaseparated values (.csv) file for further analysis. For thesystematic review, prevalence of FBP and its 95% confi-dence interval (Tables 2 and 3) was calculated for eachincluded study, from the extracted sample size and thenumber of positive samples. This was because in someof the screened articles, the FBP was reported only withsample size and number of positive samples rather thandescribing the prevalence of FBP in percentage (%) withits CI.We also estimated the prevalence rates of FBD with
95% CIs by overall and subgroup analysis. In order todo this, the point prevalence rates were first trans-formed into logit transformed proportions and the
Table 2 Summary of eligible studies of FBD and variables used for prevalence estimates of pathogens in human stool samples inEthiopia (Continued)FBP Reference Year Of
StudyGeographicarea
Region District ortown
Studydesign
Agegroup
Stoolcondition
Diagnostictechnique
Samplesize
Nopositive
95%-CI %
Salmonella [74] 2018 SouthernEthiopia
SNNP Hawassa IB CS Adult Nondiarrheic C, Gs and BT 236 5 2.12(0.88–4.99)
Salmonella [55] 2001 SouthwestEthiopia
Oromia Jimma HFB CS Adult Nondiarrheic C, Gs and BT 220 0 0.00(0.01–3.51)
Salmonella [75] 2017 SouthernEthiopia
SNNP Wolkite IB CS Adult Nondiarrheic C, Gs and BT 170 8 4.71(2.37–9.13)
Salmonella [13] 2016 NorthwestEthiopia
Amhara Wegera CB CS UFC Nondiarrheic C, Gs and BT 113 1 0.88(0.12–6.01)
Salmonella [47] 2018 NorthwestEthiopia
Amhara Gondar IB CS Adult Nondiarrheic C, Gs and BT 257 3 1.17(0.38–3.56)
Salmonella [44] 2016 SouthernEthiopia
SNNP Hawassa HFB CS Adult Nondiarrheic C, BT and Ag 113 4 3.54(1.33–9.05)
Salmonella [76] 2015 SouthernEthiopia
SNNP A/ Minch IB CS Adult Nondiarrheic C, Gs and BT 345 24 6.96(4.71–10.17)
Salmonella [77] 2016 Eastern Ethiopia Harari Harar IB CS Adult Nondiarrheic C, Gs and BT 417 15 3.60(2.18–5.88)
Salmonella [63] 2017 Western Ethiopia Gambella Gambella IB CS UFC Nondiarrheic C, Gs and BT 134 2 1.49(0.37–5.77)
Salmonella [78] 2017 SouthernEthiopia
SNNP Sodo IB CS Adult Nondiarrheic C, BT and Ag 387 35 9.04(6.56–12.34)
Salmonella [79] 2017 Eastern Ethiopia Diredawa
Dire dawa CB CS Adult Nondiarrheic C, Gs and BT 218 13 5.96(3.49–10.00)
Salmonella [80] 2016 SouthwestEthiopia
oromia jimma IB CS Adult Nondiarrheic C, Gs and BT 50 9 18.00(9.64–31.11)
Salmonella [81] 2015 Central Ethiopia A.A A.A HFBretro
All age Unidentified C, Gs and BT 136 43 31.62(24.36–39.89)
Salmonella [48] 2015 NorthwestEthiopia
Amhara D/Markos HFBretro
UFC Unidentified C, Gs and BT 50 12 24.00(14.16–37.67)
Salmonella [48] 2015 NorthwestEthiopia
Amhara D/Markos HFBretro
All age Unidentified C, Gs and BT 58 24 41.38(29.51–54.34)
A.A Addis Ababa, C Culture (plate culture), Gs Gram stain, BT Biochemical test, Ag Antigen detection (agglutination), Mol Molecular like PCR, HFB CS Health facilitybased cross-sectional study, CB Cs-s Community based cross-sectional study, HFB retro Health facility based retrospective study, IB CS Institution based cross-sectional study, UFC under five children, SNNP Southern Nations, Nationalities, and Peoples
Belina et al. One Health Outlook (2021) 3:19 Page 9 of 30

transformed data were fitted for a random effectsmodel using DerSimonian-Laird weights [123]. Het-erogeneity among the reported prevalence wasassessed by computing p-values of Cochrane Q-test,τ2 and I2 statics. The prevalence was estimated as thetotal number of positive samples detected for FBP di-vided by the total number of sample processed in thelaboratory multiplied by 100. Meta-regression analysiswas carried out to evaluate a linear relationship be-tween the independent effect size for variables like:the reported bacterial pathogen, region, geographicarea, district or town, actual study year, year of publi-cation, sample type and categorized sample size in-cluded in the human and environmental sample basedFBD studies separately using R package “metafor”.Analysis was conducted using “meta” and “metafor”packages of R programming software [124] version4.0.3.The test for heterogeneity (Q), the estimate of
between-study variance (τ2), and the estimate for theproportion of the observed variability that reflects thebetween-study variance (I2) were used to test andquantify heterogeneity. Heterogeneity chi-square (Q-test) and its p-value serve as a test of significance toaddress the null hypothesis. The τ2 reflects theamount of true heterogeneity on an absolute scale [34],i.e., the total amount of systematic differences in effectsacross studies. The total variance of a study is the sum-mary of the between and within-study variance and isused to assign weights under the random-effectsmodel. The I2 is roughly the ratio of between-studyvariance to the observed variance and used to com-pare estimates of heterogeneity across meta-analyses.Its values range from 0 to 100%. I2 = 0%, it meansthat all of the heterogeneity is caused by samplingerror and there is nothing to explain; I2 = 100%, theoverall heterogeneity can be accounted for by the truedifferences between studies exclusively [35].
ResultsSystematic reviewA simple summary reports with the prevalence of Sal-monella and pathogenic E. coli in human stool and en-vironmental samples were performed using descriptivestatistics. In this regard, the current review showed,pathogenic E. coli and Salmonella have been detected inhuman stool at different level of occurrence in differentparts of Ethiopia, ranging from 0 to 48.34% (E. coli), and41.38% (Salmonella). In the present analysis, for the hu-man stool based study, studies from six regional statesand the two city councils were included but unfortu-nately studies conducted in Benishangul Gumuz, Somaliand Afar regional states were not screened and not in-cluded. Geographic area coverage of the study also
indicated, less attention is given to E. coli where about60% of the articles screened for the current systematicreview of FBP in the human case consisted of studiesthat have been conducted on Salmonella. Majority ofthe studies reported prevalence of FBP using routine cul-ture and biochemical tests and none of the study usedmolecular diagnostic techniques for detection of patho-genic E. coli in human stool. In both pathogens, theprevalence in healthcare facility based studies was higherthan in the community or non-healthcare facility institu-tion based studies (Table 2).Environmental samples used in the calculation of the
pooled prevalence estimates of FBD in the environmentwere: Animal sourced foods (ASF), water, RTE foods,and swab from food and human contact surfaces. Wefound that the two FBP were not equally studied and re-ported, where majority of the reviewed studies were con-ducted on E. coli than Salmonella reporting studies.There was a wide range in prevalence of E. coli, from aminimum of 0.35% to the maximum of 81.3% in carcassand retail meat contact surfaces, and in large animalfeces, respectively. The prevalence of Salmonella rangedfrom 0 to 57.5%, sequentially in drinking water andother RTE foods (Table 3).Variation in actual study year (actual data collection and
laboratory analysis period) of Salmonella and pathogenicE. coli in Ethiopia from the year 2000 to 2020 was ana-lysed (Table 3). Overall about 50% of the FBP studies in-cluded in this review were carried out during the periodfrom 2011 to 2015 during which the environmental sam-ple based FBP studies were the prevailing ones. Neverthe-less, during the period from 2000 to 2010 and 2016 to2020 the number of studies conducted on the FBP in hu-man (stool sample) is higher than studies conducted onenvironmental samples (Fig. 3). Furthermore, the currentreview indicates there was up to six years period delay inpublications from the actual study period, in such case itmay be difficult to estimate occurrence rate of FBD basedon year of publication of the articles.
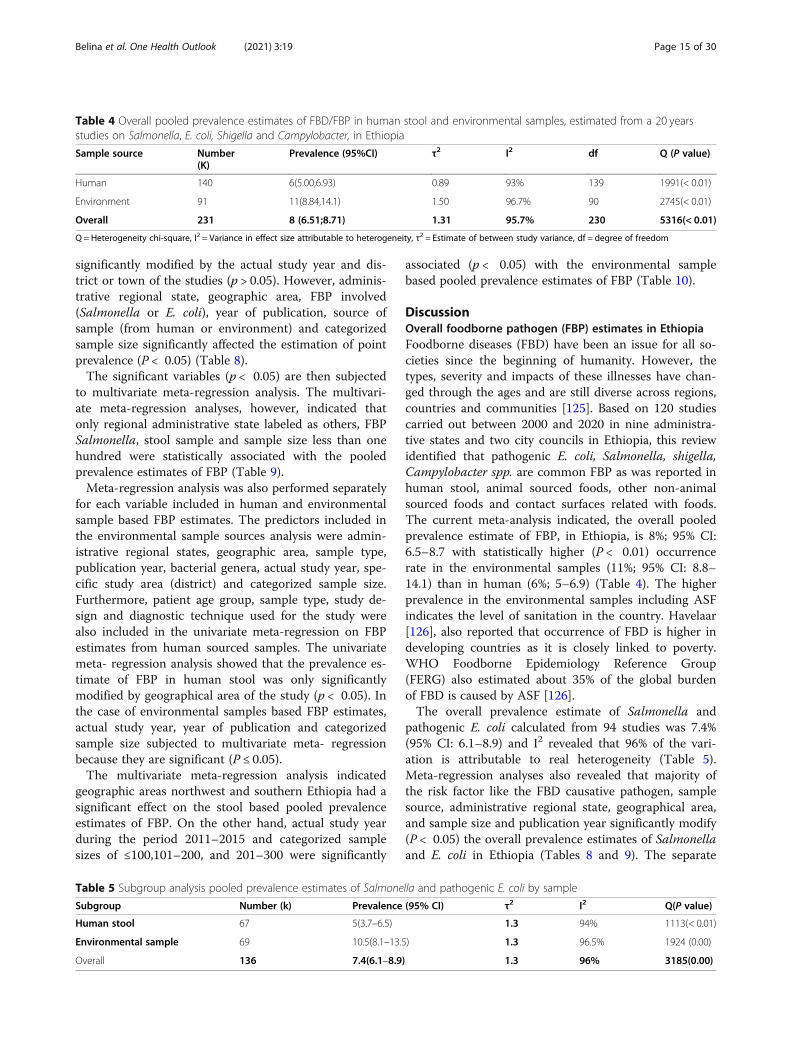
Meta-analysisA total of 34,747 study participants and 22,113 environ-mental samples from 120 manuscripts were analysed tocalculate the overall pooled prevalence of FBD/FBP fromreports of 20 years on four FBP: Salmonella, pathogenicE. coli, Shigella and Campylobacter spp., data inEthiopia. In the absence of subgroups, human and envir-onmental samples were analyzed separately and thenmerged to estimate overall pooled prevalence. The over-all pooled prevalence estimate of FBD from the randomeffect meta-analysis model was, 8% with 95% CI: 6.5–8.7.Accordingly, the pooled prevalence estimates of FBD isstatistically higher (P < 0.01) in the environmental sam-ples (11%; 95% CI: 8.8–14.1) than in human stool (6%;
Belina et al. One Health Outlook (2021) 3:19 Page 10 of 30

Table 3 Summary of eligible studies of FBP and variables used for prevalence estimates of pathogens in different environmentalsamples in Ethiopia
FBP Author Year ofstudy
Region Geographicarea
Studyarea
Sample type Samplesize
Nopositive
95%-CI %
E. coli [82] 2013 Central Eth Oromia Mojo Abattoir carcass 144 4 2.78(1.05–7.17)
E. coli [83] 2012 Central Eth AA A.A Abattoir carcass 192 11 5.73(3.20–10.05)
E. coli [84] 2016 Central Eth Others Other Abattoir carcass 219 36 16.44(12.10–21.95)
E. coli [85] 2015 Central Eth Others Other Abattoir carcass 635 82 12.91(10.52–15.75)
E. coli [86] 2014 Eastern Eth Somali Somali Abattoir carcass 93 3 3.23(1.04–9.53)
E. coli [87] 2014 Eastern Eth Somali Jigjiga Abattoir carcass 70 2 2.86(0.72–10.71)
E. coli [19] 2015 SouthernEth
SNNP Hawassa Abattoir carcass 150 4 2.67(1.00–6.89)
E. coli [37] 2014 Central Eth Others Other Abattoir carcassenvironmental
1247 6 0.48(0.22–1.07)
E. coli [82] 2013 Central Eth Oromia Mojo Abattoir carcassenvironmental
228 16 7.02(4.34–11.15)
E. coli [86] 2014 Eastern Eth Somali Somali Abattoir carcassenvironmental
142 3 2.11(0.68–6.34)
E. coli [19] 2015 SouthernEth
SNNP Hawassa Abattoir carcassenvironmental
240 7 2.92(1.40–5.99)
E. coli [37] 2014 Central Eth Others Other Carcass 865 3 0.35(0.11–1.07)
E. coli [88] 2010 NorthernEth
Tigray Mekelle Carcass 100 9 9.00(4.75–16.40)
E. coli [84] 2016 Central Eth Others Other Chicken viscera or meat 73 27 36.99(26.74–48.56)
E. coli [89] 2016 Central Eth Oromia Ambo Chicken viscera or meat 191 62 32.46(26.20–39.42)
E. coli [90] 2018 Central Eth Oromia Adami tulu Dairy farm environment 254 27 10.63(7.39–15.06)
E. coli [91] 2017 Central Eth Oromia Bishoftu Dairy products 135 31 22.96(16.64–30.80)
E. coli [92] 2011 NorthwestEth
Amhara Gondar Dairy products 107 16 14.95(9.37–23.02)
E. coli [93] 2011 Others Oromia Other Dairy products 53 24 45.28(32.52–58.70)
E. coli [94] 2018 NorthernEth
Amhara S/ wollo Fish and contact surfaces 410 6 1.46(0.66–3.22)
E. coli [37] 2014 Central Eth Others Other Food animal feces 370 7 1.89(0.90–3.91)
E. coli [95] 2013 NorthernEth
Amhara Kombolcha Food animal feces 201 74 36.82(30.43–43.70)
E. coli [96] 2017 NorthernEth
Amhara S/ wollo Food animal feces 123 100 81.30(73.43–87.25)
E. coli [19] 2015 SouthernEth
SNNP Hawassa Food animal feces 150 7 4.67(2.24–9.46)
E. coli [97] 2017 NorthernEth
Tigray Mekelle Hand contacting surfaces 300 8 2.67(1.34–5.24)
E. coli [98] 2018 Eastern Eth Oromia G/bordode Milk container and milkers 60 21 35.00(24.06–47.79)
E. coli [99] 2017 NorthwestEth
Amhara Gondar Other RTE food 72 15 20.83(12.97–31.73)
Belina et al. One Health Outlook (2021) 3:19 Page 11 of 30
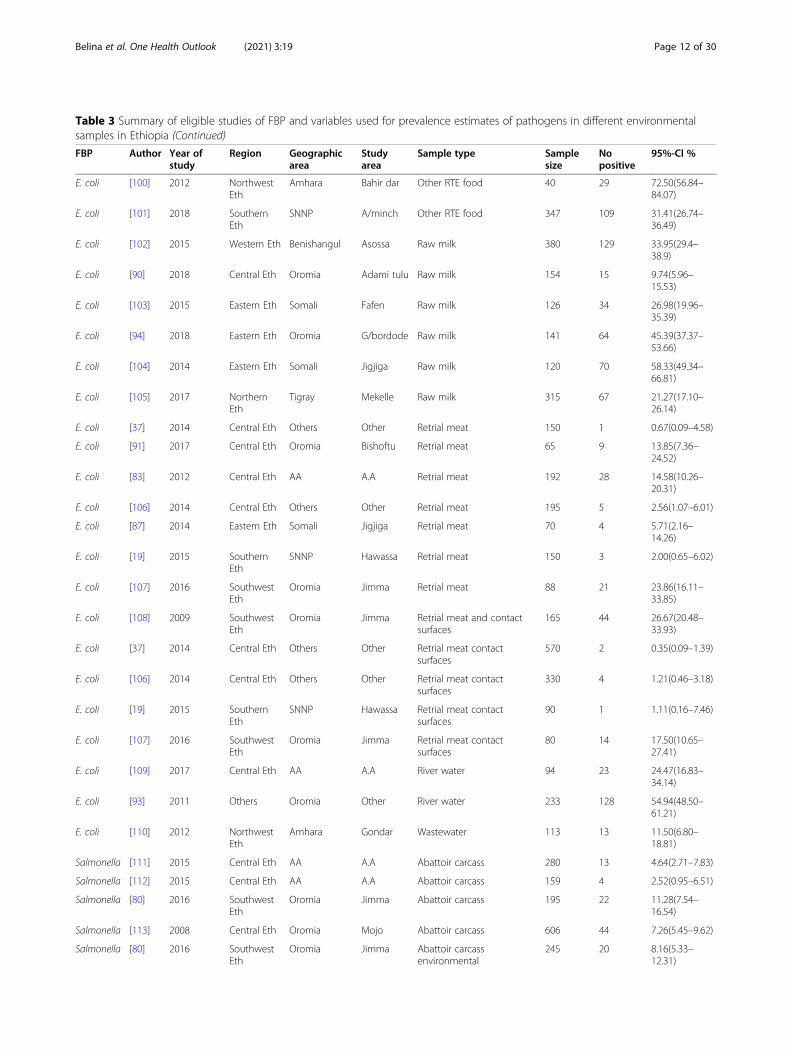
Table 3 Summary of eligible studies of FBP and variables used for prevalence estimates of pathogens in different environmentalsamples in Ethiopia (Continued)
FBP Author Year ofstudy
Region Geographicarea
Studyarea
Sample type Samplesize
Nopositive
95%-CI %
E. coli [100] 2012 NorthwestEth
Amhara Bahir dar Other RTE food 40 29 72.50(56.84–84.07)
E. coli [101] 2018 SouthernEth
SNNP A/minch Other RTE food 347 109 31.41(26.74–36.49)
E. coli [102] 2015 Western Eth Benishangul Asossa Raw milk 380 129 33.95(29.4–38.9)
E. coli [90] 2018 Central Eth Oromia Adami tulu Raw milk 154 15 9.74(5.96–15.53)
E. coli [103] 2015 Eastern Eth Somali Fafen Raw milk 126 34 26.98(19.96–35.39)
E. coli [94] 2018 Eastern Eth Oromia G/bordode Raw milk 141 64 45.39(37.37–53.66)
E. coli [104] 2014 Eastern Eth Somali Jigjiga Raw milk 120 70 58.33(49.34–66.81)
E. coli [105] 2017 NorthernEth
Tigray Mekelle Raw milk 315 67 21.27(17.10–26.14)
E. coli [37] 2014 Central Eth Others Other Retrial meat 150 1 0.67(0.09–4.58)
E. coli [91] 2017 Central Eth Oromia Bishoftu Retrial meat 65 9 13.85(7.36–24.52)
E. coli [83] 2012 Central Eth AA A.A Retrial meat 192 28 14.58(10.26–20.31)
E. coli [106] 2014 Central Eth Others Other Retrial meat 195 5 2.56(1.07–6.01)
E. coli [87] 2014 Eastern Eth Somali Jigjiga Retrial meat 70 4 5.71(2.16–14.26)
E. coli [19] 2015 SouthernEth
SNNP Hawassa Retrial meat 150 3 2.00(0.65–6.02)
E. coli [107] 2016 SouthwestEth
Oromia Jimma Retrial meat 88 21 23.86(16.11–33.85)
E. coli [108] 2009 SouthwestEth
Oromia Jimma Retrial meat and contactsurfaces
165 44 26.67(20.48–33.93)
E. coli [37] 2014 Central Eth Others Other Retrial meat contactsurfaces
570 2 0.35(0.09–1.39)
E. coli [106] 2014 Central Eth Others Other Retrial meat contactsurfaces
330 4 1.21(0.46–3.18)
E. coli [19] 2015 SouthernEth
SNNP Hawassa Retrial meat contactsurfaces
90 1 1.11(0.16–7.46)
E. coli [107] 2016 SouthwestEth
Oromia Jimma Retrial meat contactsurfaces
80 14 17.50(10.65–27.41)
E. coli [109] 2017 Central Eth AA A.A River water 94 23 24.47(16.83–34.14)
E. coli [93] 2011 Others Oromia Other River water 233 128 54.94(48.50–61.21)
E. coli [110] 2012 NorthwestEth
Amhara Gondar Wastewater 113 13 11.50(6.80–18.81)
Salmonella [111] 2015 Central Eth AA A.A Abattoir carcass 280 13 4.64(2.71–7.83)
Salmonella [112] 2015 Central Eth AA A.A Abattoir carcass 159 4 2.52(0.95–6.51)
Salmonella [80] 2016 SouthwestEth
Oromia Jimma Abattoir carcass 195 22 11.28(7.54–16.54)
Salmonella [113] 2008 Central Eth Oromia Mojo Abattoir carcass 606 44 7.26(5.45–9.62)
Salmonella [80] 2016 SouthwestEth
Oromia Jimma Abattoir carcassenvironmental
245 20 8.16(5.33–12.31)
Belina et al. One Health Outlook (2021) 3:19 Page 12 of 30

95% CI: 5–6.9) (Table 4). The calculated Cochran’s Qvalue (χ2 (45) =5316, p < 0.01) indicated the presence ofsignificant true heterogeneity between human and envir-onmental sample analysis of FBD in Ethiopia.
Subgroup meta-analysis of FBPIn the current meta-analysis, overall 36,002 samples (17,729 human stools and 18,273 environmental samples)were extracted from the 94 included Salmonella andpathogenic E. coli studies. Subgroup analyses were per-formed by splitting studies within categorical moderatorsinto subgroups such as sample sources (as human stooland environmental samples), bacterial pathogens tested(Salmonella and E. coli), administrative regional states of
the country, year of study and other variables consideredin our study designs (Fig. 2). However, as describedunder the methodology section and screening proce-dures, the data on Shigella and Campylobacter spp. areexcluded from the subgroup meta-analysis. Separatesubgroup analysis of Salmonella and E. coli indicated asignificantly higher prevalence estimate in environmentalsamples (10.5%; 95% CI: 8.1–13.5) than in human stool(5%; 95% CI: 3.7–6.5) (Table 5). In the presence of sub-groups, the estimate of the summary proportion for allstudies can be different than that in the absence of sub-groups [34]. This is because different estimates for τ2 areused in different cases. Borenstein et al. [34] also de-scribed, the random effects model is used to combine
Table 3 Summary of eligible studies of FBP and variables used for prevalence estimates of pathogens in different environmentalsamples in Ethiopia (Continued)
FBP Author Year ofstudy
Region Geographicarea
Studyarea
Sample type Samplesize
Nopositive
95%-CI %
Salmonella [113] 2008 Central Eth Oromia Mojo Abattoir carcassenvironmental
634 45 7.10(5.34–9.38)
Salmonella [114] 2015 NorthwestEth
Amhara Gondar Dairy products 165 3 1.59(0.51,4.80)
Salmonella [115] 2015 Central Eth AA A.A Dog feces 360 42 11.67(8.74–15.41)
Salmonella [116] 2015 Others Others Other Drinking water 222 0 0.00(0.01–3.48)
Salmonella [117] 2012 SouthwestEth
Oromia Jimma Drinking water 90 3 3.33(1.08–9.83)
Salmonella [118] 2013 Central Eth AA A.A Food animal feces 1203 30 2.49(1.75–3.54)
Salmonella [112] 2015 Central Eth AA A.A Food animal feces 567 23 4.06(2.71–6.03)
Salmonella [119] 2013 SouthwestEth
Oromia Jimma Hand contacting surface 100 10 10.00(5.47–17.60)
Salmonella [114] 2015 NorthwestEth
Amhara Gondar Meat or carcass 110 9 8.18 (4.31–14.98)
Salmonella [101] 2018 SouthernEth
SNNP A/minch Other RTE food 347 46 13.26(10.08–17.25)
Salmonella [100] 2012 NorthwestEth
Amhara Bahir dar Other RTE food 40 23 57.50(41.96–71.69)
Salmonella [120] 2015 SouthernEth
SNNP Other Poultry and contactsurfaces
270 45 16.67(12.68–21.60)
Salmonella [121] 2018 SouthwestEth
Oromia Jimma Poultry and contactsurfaces
415 11 2.65(1.47–4.72)
Salmonella [17] 2014 Central Eth AA A.A Poultry feces 549 26 4.74(3.24–6.86)
Salmonella [114] 2015 NorthwestEth
Amhara Gondar Poultry products 85 9 10.59 (5.60–19.11)
Salmonella [103] 2015 Eastern Eth Somali Fafen Raw milk 126 19 15.08(9.83–22.44)
Salmonella [104] 2014 Eastern Eth Somali Jigjiga Raw milk 120 4 3.33(1.26–8.54)
Salmonella [122] 2013 NorthwestEth
Amhara Gondar Retrial meat 90 32 35.56(26.38–45.93)
Salmonella [104] 2009 SouthwestEth
Oromia Jimma Retrial meat and contactsurfaces
165 2 1.21(0.30–4.71)
Salmonella [122] 2013 NorthwestEth
Amhara Gondar Retrial meat contactsurfaces
216 21 9.72(6.42–14.45)
Belina et al. One Health Outlook (2021) 3:19 Page 13 of 30

study effects within each subgroup and presence of sig-nificant variation between the effects across the sub-groups is tested by the fixed-effect model.The I2 revealed that 96% of the variation is attributable
to real heterogeneity (Table 5). Substantial variationbetween-study was, thus, evident and further subgroupanalyses and meta-regression were used to identifysources of heterogeneity. The pooled prevalence of E.coli was higher (p < 0.05) than that of the Salmonellaboth in the environmental (13%) and human stool (7%)samples. The results also depicted that pathogenic E. coliand Salmonella contributed for 11.6% (95% CI: 8.8–15.1) and 5.7% (95% CI: 4.7–6.8) respectively, for theoverall pooled prevalence estimates of FBD in Ethiopia(Figs. 4; 5).
Epidemiological factor related subgroup analysesTo determine Salmonella and pathogenic E. coliprevalence variations under different settings inEthiopia, separate subgroup analysis was conductedfor each principal study variable considered in thisreview (Fig. 2). Regarding administrative regionalstates or city council, the result of human stool sam-ples depicted that significantly the highest prevalence(8%, p < 0.01) was reported from Addis Ababa andfollowed by Dire Dawa and Harari regional state.The significantly highest prevalence of FBP (6.4%;95% CI: 4.1–8.9) was reported in UFC age groupswith the highest occurrence rate during the periodbetween 2011 and 2015. Regarding diagnostic tech-niques, majority of the FBP was diagnosed by rou-tine culture plate, biochemical and agglutinationtests (surface antigen detection) (Table 6).
The separate meta-analysis of various risk factors asso-ciated with occurrence of FBP indicates that statisticallythere are differences in occurrence of FBP among differ-ent environmental samples, in Ethiopia. The highestprevalence of Salmonella and pathogenic strain of E.coli, 36.1% (95% CI: 17.4–60.2), was reported in RTEfoods. The study also indicated these FBP are moreprevalent in Amhara regional state than in the other re-gions of Ethiopia. The environmental samples basedsubgroup analysis also indicated the Salmonella and E.coli pathogens are by far important in Northwest partsof Ethiopia than in the other study areas or districts in-cluded in this review. Salmonella and E. coli were alsofound important FBP in ASF with the prevalence esti-mates of 7.4% (95% CI: 4.5–11.8) and 3.8% (95% CI: 1.9–7.6) in meat (carcass) and its contact surfaces respect-ively. On the other hand, the occurrence of FBP attrib-uted to poultry products and its contact surfaces, andanimal feces was sequentially, 12.8% (CI: 5.6–26.4) and10.9% (CI: 5.1–22.0) (Table 7).
Meta-regressionWe observed that the heterogeneity between FBP in thehuman and environmental samples is high when studiesare evaluated overall (I2 = 96%; τ2 = 1.3 P = 0.00) (Table5). Hence, sample size was used both as a discrete vari-able and binned into categories in meta-regression ana-lysis to explore the main factors influencing prevalenceestimation and sources of heterogeneity. In line withthis, meta-regression analysis was performed on overallprevalence estimates of FBD as well as separately foreach variable included in the human and environmentalsample based FBD estimates. Meta-regression analyses,revealed that the overall prevalence estimates were not
Fig. 3 Proportion of reviewed Salmonella and pathogenic E. coli study reports by actual year of study
Belina et al. One Health Outlook (2021) 3:19 Page 14 of 30
significantly modified by the actual study year and dis-trict or town of the studies (p > 0.05). However, adminis-trative regional state, geographic area, FBP involved(Salmonella or E. coli), year of publication, source ofsample (from human or environment) and categorizedsample size significantly affected the estimation of pointprevalence (P < 0.05) (Table 8).The significant variables (p < 0.05) are then subjected
to multivariate meta-regression analysis. The multivari-ate meta-regression analyses, however, indicated thatonly regional administrative state labeled as others, FBPSalmonella, stool sample and sample size less than onehundred were statistically associated with the pooledprevalence estimates of FBP (Table 9).Meta-regression analysis was also performed separately
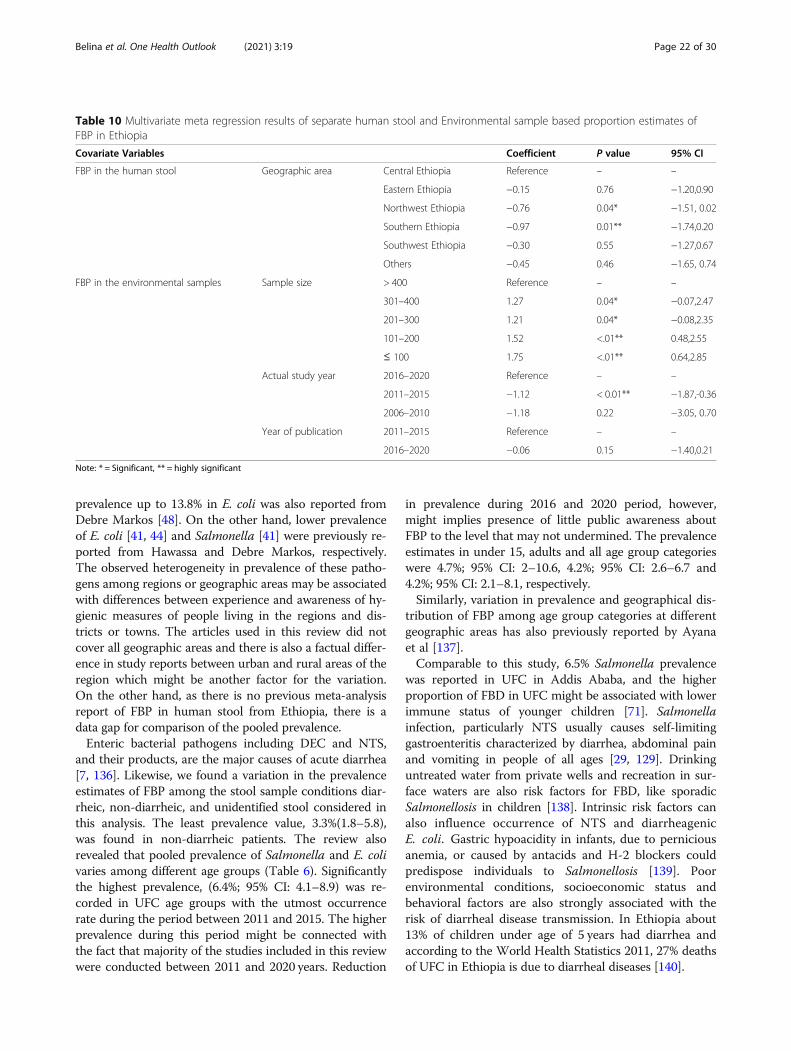
for each variable included in human and environmentalsample based FBP estimates. The predictors included inthe environmental sample sources analysis were admin-istrative regional states, geographic area, sample type,publication year, bacterial genera, actual study year, spe-cific study area (district) and categorized sample size.Furthermore, patient age group, sample type, study de-sign and diagnostic technique used for the study werealso included in the univariate meta-regression on FBPestimates from human sourced samples. The univariatemeta- regression analysis showed that the prevalence es-timate of FBP in human stool was only significantlymodified by geographical area of the study (p < 0.05). Inthe case of environmental samples based FBP estimates,actual study year, year of publication and categorizedsample size subjected to multivariate meta- regressionbecause they are significant (P ≤ 0.05).The multivariate meta-regression analysis indicated
geographic areas northwest and southern Ethiopia had asignificant effect on the stool based pooled prevalenceestimates of FBP. On the other hand, actual study yearduring the period 2011–2015 and categorized samplesizes of ≤100,101–200, and 201–300 were significantly
associated (p < 0.05) with the environmental samplebased pooled prevalence estimates of FBP (Table 10).
DiscussionOverall foodborne pathogen (FBP) estimates in EthiopiaFoodborne diseases (FBD) have been an issue for all so-cieties since the beginning of humanity. However, thetypes, severity and impacts of these illnesses have chan-ged through the ages and are still diverse across regions,countries and communities [125]. Based on 120 studiescarried out between 2000 and 2020 in nine administra-tive states and two city councils in Ethiopia, this reviewidentified that pathogenic E. coli, Salmonella, shigella,Campylobacter spp. are common FBP as was reported inhuman stool, animal sourced foods, other non-animalsourced foods and contact surfaces related with foods.The current meta-analysis indicated, the overall pooledprevalence estimate of FBP, in Ethiopia, is 8%; 95% CI:6.5–8.7 with statistically higher (P < 0.01) occurrencerate in the environmental samples (11%; 95% CI: 8.8–14.1) than in human (6%; 5–6.9) (Table 4). The higherprevalence in the environmental samples including ASFindicates the level of sanitation in the country. Havelaar[126], also reported that occurrence of FBD is higher indeveloping countries as it is closely linked to poverty.WHO Foodborne Epidemiology Reference Group(FERG) also estimated about 35% of the global burdenof FBD is caused by ASF [126].The overall prevalence estimate of Salmonella and
pathogenic E. coli calculated from 94 studies was 7.4%(95% CI: 6.1–8.9) and I2 revealed that 96% of the vari-ation is attributable to real heterogeneity (Table 5).Meta-regression analyses also revealed that majority ofthe risk factor like the FBD causative pathogen, samplesource, administrative regional state, geographical area,and sample size and publication year significantly modify(P < 0.05) the overall prevalence estimates of Salmonellaand E. coli in Ethiopia (Tables 8 and 9). The separate
Table 4 Overall pooled prevalence estimates of FBD/FBP in human stool and environmental samples, estimated from a 20 yearsstudies on Salmonella, E. coli, Shigella and Campylobacter, in Ethiopia
Sample source Number(K)
Prevalence (95%CI) τ2 I2 df Q (P value)
Human 140 6(5.00,6.93) 0.89 93% 139 1991(< 0.01)
Environment 91 11(8.84,14.1) 1.50 96.7% 90 2745(< 0.01)
Overall 231 8 (6.51;8.71) 1.31 95.7% 230 5316(< 0.01)
Q =Heterogeneity chi-square, I2 = Variance in effect size attributable to heterogeneity, τ2 = Estimate of between study variance, df = degree of freedom
Table 5 Subgroup analysis pooled prevalence estimates of Salmonella and pathogenic E. coli by sample
Subgroup Number (k) Prevalence (95% CI) τ2 I2 Q(P value)
Human stool 67 5(3.7–6.5) 1.3 94% 1113(< 0.01)
Environmental sample 69 10.5(8.1–13.5) 1.3 96.5% 1924 (0.00)
Overall 136 7.4(6.1–8.9) 1.3 96% 3185(0.00)
Belina et al. One Health Outlook (2021) 3:19 Page 15 of 30

subgroup meta-analysis of studies conducted, from theyear 2000 to 2020, also depicted that Salmonella and E.coli, sequentially accounted for 5.7% (95% CI: 4.7–6.8)and 11.6%; (8.8–15.1) of the overall pooled prevalence of
FBD in the country. The overall average prevalence of34.2% FBD previously reported in seven African coun-tries [6] is much higher than the current pooled preva-lence estimates. Prevalence differences may be due to
Fig. 4 Forest plot of pooled prevalence estimates of E. coli in human stool and environmental samples, in Ethiopia
Belina et al. One Health Outlook (2021) 3:19 Page 16 of 30

Fig. 5 Forest plot pooled prevalence estimates of Salmonella in human stool and environmental samples, in Ethiopia
Belina et al. One Health Outlook (2021) 3:19 Page 17 of 30

Table 6 Subgroup analysis of prevalence estimates of Salmonella and pathogenic E. coli strains in human stool and the associatedrisk factors in Ethiopia
Risk factors Subgroup Prevalence (95%CI) τ2 I2 Q (P value)
Age group Under five children (UFC) 6.4(4.1–8.9) 1.10 95.8% 665.4(< 0.01)
under 15 4.7(2–10.6) 1.10 81.7% 32.8(< 0.01)
Adult 4.2(2.6–6.7) 1.10 78.3% 87.4(< 0.01)
All age group 4.2(2.1–8.1) 1.10 92.7% 137.2(< 0.01)
Stool condition Diarrheic 5.6(3.9–7.5) 1.20 94.8% 840.1(< 0.01)
Unidentified 7(2.8–16.1) 1.20 96.0% 125.9(< 0.01)
Non-diarrheic 3.3 (1.8–5.8) 1.20 76.5% 63.7(< 0.01)
Administrative regional states or city council Amhara 4.2(2.4–7.1) 1.19 97.1% 592.6(< 0.01)
Oromia 5.5(2.5–9.2) 1.19 80.9% 52.5(< 0.01)
SNNP 3.8(2.1–6.7) 1.19 78.0% 68.3(< 0.01)
Addis Ababa 8.1(4.4–14.2) 1.19 93.7% 189.9(< 0.01)
Dire Dawa and Harari 6.6(2.6–15.9) 1.19 84.8% 26.3(< 0.01)
Others 3.4(1–11.1) 1.19 80.7% 15.5(< 0.01)
Geographic area Northwest Ethiopia 3.6(2–6.4) 1.22 97.3% 559.9(< 0.01)
Central Ethiopia 7.6(4.6–12.1) 1.22 92.8% 264.8(< 0.01)
Southern Ethiopia 3.4(1.6–5.5) 1.22 80.0% 70.1(< 0.01)
Eastern Ethiopia 6.6(2.5–16.2) 1.22 84.8% 26.3(< 0.01)
Southwest Ethiopia 5.7(2.4–12.9) 1.22 79.2% 28.8(< 0.01)
Others parts of Ethiopia 4.9(1.6–14.3) 1.22 76.4% 12.7(< 0.01)
Study area (town or district) Northwest eth areas 3.8(1.3–10.6) 1.05 87.8% 32.8(< 0.01)
Other 4.7(1.4–8.5) 1.05 82.8% 0.3(< 0.01)
Hawassa 2.1(0.9–4.5) 1.05 47.0% 15.1(< 0.06)
Addis Ababa 8.1(4.6–13.8) 1.05 93.7% 189.9(< 0.01)
Central Ethiopia areas 6.6(2.4–17.1) 1.05 95.4% 65.1(< 0.01)
East Ethiopia towns 6.6(2.7–15.2) 1.05 84.8% 26.3(< 0.01)
Gondar 1.1(0.4–3.2) 1.05 0.0% 3.9(< 0.43)
Bahir Dar 7.7(3.4–16.2) 1.05 98.6% 359.2(< 0.01)
Jimma 5.8(2.6–12.4) 1.05 79.2% 28.8(< 0.01)
South Ethiopia area town 7(3.3–14.3) 1.05 71.8% 21.3(< 0.01)
Publication year 2016–2020 4.8(3.3–6.5) 1.22 90.2% 450.2(< 0.01)
2011–2015 6.1(3.6–10.2) 1.22 97.2% 573.8(< 0.01)
2000–2010 3.9(1.4–10.5) 1.22 84.7% 26.2(< 0.01)
Actual study year 2011–2015 7.3(4.9–10.8) 1.07 95.6% 594.3(< 0.01)
2016–2020 4.2(2.8–6.1) 1.07 87.8% 236.9(< 0.01)
2006–2010 2.9(1.2–6.9) 1.07 90.3% 51.5(< 0.01)
2000–2005 5.1(1.7–14.2) 1.07 77.5% 13.4(< 0.01)
Study design HFB R-s 7.9(2.7–20.4) 1.15 91.8% 48.6(< 0.01)
HFB CS-s 5.6(3.9–7.5) 1.15 94.9% 880.1(< 0.01)
IB Cs-s 3.6(2–6.5) 1.15 80.6% 61.8(< 0.01)
CB Cs-s 2.2(0.5–9) 1.15 69.4% 6.50.04
Diagnostic technique C–Gs and Bt 4.7(3.3–6.3) 1.26 91.8% 575.6(< 0.01)
C– Bt and ser 5.9(3.4–9.9) 1.26 96.7% 510.4(< 0.01)
Molecular 6.3(0.7–39.7 – – –
Belina et al. One Health Outlook (2021) 3:19 Page 18 of 30

the differences in number of FBP included in the review forFBD prevalence estimate, in our case studies on four FBP.Moreover, Enteropathogenic bacteria like the genus
Salmonella and pathogenic E. coli (mainly enteropatho-genic E. coli (EPEC), enterohemorrhagic E. coli (EHEC)and enteroinvasive E. coli (EIEC) are widespread and im-portant causes of foodborne infections in human, par-ticularly in developing countries including Africancountries. This may be due to difficulties in securing op-timal hygienic food handling practices [7, 127]. Inaddition to this, most known human infectious diseasesand approximately three quarters of newly emerging in-fections come from animals [12, 23, 128]. Salmonella,specifically S. Typhimurium and S. Enteritidis, are thecommonest serotypes causing human infection, and arefrequently detected in farm animals as are other sero-types known to be human pathogens [129, 130]. Eggsand poultry products have been described as the mainvehicles for the transmission of human salmonellosis[131, 132]. To reduce this high FBD prevalence, a keychallenge is to adopt approaches that have been provensuccessful in high-income countries to low- and middle-income countries (LMIC) in an economically and cultur-ally acceptable way [126].On the other hand, the present systematic review indi-
cated that there has been a delay period up to six years be-tween the date of publications and the actual study period[28, 59, 77]. This may be a source of time-window bias inestimating occurrence rate of FBD at regional or nationallevel based on year of publication of the articles. Few sys-tematic review and meta-analysis have been conducted onFBP in Ethiopia and existing reports only assessed evi-dence of publication bias [26, 133] and did not report theactual study period as source of bias. Hence, research re-sults need to be published as soon as the study is finalized.This helps to minimize such bias and to disseminate up-to-date information to the stakeholders.
The FBP, Salmonella and pathogenic E. coli, in humanstoolThe pooled prevalence of Salmonella and E. coli was es-timated from 51 studies conducted, on an aetiological
isolation or detection, in stool samples collected from in-patient, outpatient and community based study designs.During the period between 2000 and 2020, the patho-gens had been occurring at a pooled prevalence of 5%;95% CI: 3.7–6.5(Table 5), though the prevalence vari-ation between Salmonella and E. coli and their com-bined occurrence rate variation in differentepidemiological risk factors, in Ethiopia is evidenced(Table 6). In line with this, the pooled prevalence ofpathogenic pathogenic E. coli in human stool is higher(7, 95% CI: 3.7–13.1) than that of the Salmonella (5%;95% CI: 4.0–6.2) (Figs. 4; 5). The variations of FBPprevalence in human, animal and environmental samplesmight be attributed to the level of infection in animal-human and or contamination of foods in the country.Because, Salmonella and E. coli, have a predilection lim-ited to the digestive tracts of both humans and animalshosts and their presence in other habitats such as water,environment, and food represents fecal contamination[134, 135]. In Ethiopia, several factors including under-nutrition (malnutrition), HIV-AIDS, the unhygienic liv-ing circumstances and the close relations betweenhumans and animals may substantially contribute to theoccurrence of salmonellosis [27, 29] and E. coli infection[39, 73, 83, 136]. Unequal number of reports used mightalso be a source of the variation between the pathogens,where higher number of studies conducted on Salmon-ella spp. is eligibly screened than studies on E. coli forthe present review.Of the nine administrative regional states (considering
Sidama region in SNNP) and two city councils inEthiopia, studies conducted in a six regional states andthe two city councils depicted that significantly the high-est prevalence was reported from Addis Ababa, andfollowed by combined estimates from Dire Dawa andHarari regional state. Studies conducted in Tigray andGambella regional states designated as “others” in sub-group analysis showed the least prevalence estimates ofSalmonella and E. coli. The analysis also showed vari-ation of FBP prevalence among geographic and specificstudy area or towns included. From this prospective, Sal-monella and E. coli were more important in central,
Table 6 Subgroup analysis of prevalence estimates of Salmonella and pathogenic E. coli strains in human stool and the associatedrisk factors in Ethiopia (Continued)
Risk factors Subgroup Prevalence (95%CI) τ2 I2 Q (P value)
Sample size ≤100 7.9(3–18.9) 1.32 69.4% 19.6(< 0.01)
101–200 5.1(3.2–7.9) 1.32 89.1% 229.8(< 0.01)
201–300 4.4(2.5–7.6) 1.32 92.7% 220.2(< 0.01)
301–400 2.8(1.2–6.3) 1.32 89.9% 69.6(< 0.01)
> 400 7.5(3.1–13) 1.32 98.5% 525.5(< 0.01)
UFC under five children, HFB CS Health facility based cross sectional study, CB CS community based cross sectional study, IB CS Institution based cross sectionalstudy, HFB ret. health facility based retrospective study, mixed = stool samples collected from both Diarrheic and Nondiarrheic participants, SNNP SouthernNations, Nationalities, and Peoples
Belina et al. One Health Outlook (2021) 3:19 Page 19 of 30

Table 7 Subgroup analysis of prevalence estimates of Salmonella and E. coli in environmental samples in Ethiopia
Risk factors Subgroup variables Prevalence(95% CI)
τ2 I2 Q (P value)
Administrative regional states or city council Oromia 13.6(8.6–20.7) 1.34 96.1% 539.1(< 0.01)
Somali 10(4.2–21.9) 1.34 95.9% 147.2(< 0.01)
SNNP 8.2(3.3–19.1) 1.34 96.2% 131.6(< 0.01)
Amhara 20(11.4–32.7) 1.34 96.5% 341.2(< 0.01)
Addis Ababa 6.2(2.8–13.2) 1.34 93.5% 107(< 0.01)
Others 5.1(2.7–9.5) 1.34 96.8% 369.3(< 0.01)
Geographic area Southwest Ethiopia 8.9(4.5–16.8) 1.10 91.3% 91.6(< 0.01)
Central Ethiopia 6.5(4.3–9.7) 1.10 95.0% 477.1(< 0.01)
Eastern Ethiopia 14.8(7.8–26.5) 1.10 95.3% 168.9(< 0.01)
Southern Ethiopia 8.3(3.7–17.8) 1.10 96.2% 131.6(< 0.01)
Northwest Ethiopia 18.3(10.2–30.8) 1.10 93.6% 140.6(< 0.01)
Northern Ethiopia 15.7(7.2–30.9) 1.10 98.1% 256.5(< 0.01)
Other 29.7(11.9–57) 1.10 92.9% 42.5(< 0.01)
Study area or town /district Jimma 8.9(4.5–16.9) 1.13 91.3% 91.6(< 0.01)
Jigjiga areas 10.2(4.7–20.9) 1.13 95.9% 147.2(< 0.01)
East shoa towns 9(4.4–17.5) 1.13 84.0% 43.7(< 0.01)
South eth areas 7.1(2.8–16.8) 1.13 97.0% 131.4(< 0.01)
Gondar 11.7(5.7–22.3) 1.13 87.6% 56.4(< 0.01)
Northwest Ethiopia area districts 41.2(21–64.9) 1.13 97.6% 165.6(< 0.01)
Addis Ababa 6.2(3–12.4) 1.13 93.5% 107(< 0.01)
Other 11(6.9–17) 1.13 97.0% 602.1(< 0.01)
years of publication 2016–2020 9.2(6.7–12.6) 1.45 96.6% 1432.3(< 0.01)
2011–2015 15.4(9.2–24.8) 1.45 96.6% 466.2(< 0.01)
2006–2010 7.8(1.4–33.9) 1.45 95.3% 21.4(< 0.01)
Actual study year 2016–2020 17.4(11.3–25.9) 1.39 95.5% 467(< 0.01)
2011–2015 8.1(5.7–11.4) 1.39 96.8% 1294(< 0.01)
2006–2010 7.8(2.8–19.8) 1.39 93.9% 65.9(< 0.01)
Sample size ≤ 100 22(14–32.8) 1.13 89.7% 146.3(< 0.01)
101–200 11.6(7.6–17.4) 1.13 95.9% 507.9(< 0.01)
201–300 9.8(5.5–17) 1.13 97.0% 369.2(< 0.01)
301–400 9.6(4.9–17.8) 1.13 96.7% 241.2(< 0.01)
>400 3(1.5–5.7) 1.13 94.6% 167(< 0.01)
Sample type Meat or carcass contact surfaces 3.8(1.9–7.6) 1.20 90.0% 90(< 0.01)
Meat or carcass 7.4(4.5–11.8) 1.20 91.9% 223.5(< 0.01)
Animal feces 10.9(5.1–22) 1.20 98.7% 460.4(< 0.01)
Raw milk 22.8(12–39.1) 1.20 94.8% 133.6(< 0.01)
RTE food 36.1(17.4–60.2) 1.20 95.2% 83(< 0.01)
Food and hand contacting surfaces 7.5(2.9–18) 1.20 94.5% 73.3(< 0.01)
Dairy products 15.3(5.6–35.8) 1.20 92.9% 42.5(< 0.01)
Drinking water 1.4(0.2–9.7) 1.20 68.5% 3.2(< 0.01)
River water 38.8(11.5–75.6) 1.20 95.7% 23.4(< 0.01)
Wastewater 11.5(1.3–56.0) – – 0(< 0.01)
Poultry products & contact surfaces 12.8(5.63–26.4) 1.20 96.5% 144.5(< 0.01)
Belina et al. One Health Outlook (2021) 3:19 Page 20 of 30

eastern and southwest Ethiopia with 7.6, 6.6 and 5.7%pooled prevalence, respectively. However, the meta-regression analysis depicted that the pooled prevalenceof the FBP is statistically varied (P < 0.05) with the re-sults of studies conducted in northwest and southern inEthiopia (Table 10). With regard to specific study area,the highest and the lowest prevalence were reportedfrom Bahir Dar and Gondar towns of Amhara regionalstate, respectively (Table 6).The current pooled prevalence estimate of Salmonella
and pathogenic E. coli in human stool, 5%, is comparablewith health facility based cross sectional study findingsreported by Eguale et al. [29] and Beyene and Tasew[57], who report a 6.2% Salmonella prevalence fromAddis Ababa and Jimma, respectively. Another previousstudy conducted in Addis Ababa, however, reportedhigher prevalence of diarrheagenic bacterial pathogensthan the current prevalence estimates [41]. Higher
Table 8 Meta-regression analysis of risk factor associated withpooled prevalence estimates of FBP in Ethiopia
Covariate Coefficient P value 95% CI
Region −0.11 < 0.01** −0.19– (−0.03)
Geographic area 0.16 0.01** 0.03–0.29
Publication Year 0.46 0.02* 0.06–0.86
Sample source 0.52 0.04* 0.04–1.01
Bacterial Pathogen 0.32 0.01** 0.07–0.57
Actual Study Year 0.09 0.55 −0.22–0.41
District town −0.01 0.56 −0.04 – 0.02
Sample size −0.23 < 0.01** −0.40–(−0.07)
Note: *= Significant, **= highly significant
Table 9 Multivariate meta-regression results of risk factor associated with pooled prevalence estimates of FBP, in Ethiopia
Covariate Coefficient P value 95% CI
Administrative regional states or city council Addis Ababa Reference – –
Amhara 0.27 0.77 −1.52–2.06
Dire Dawa and Harari −1.13 0.3 −3.28–1.02
Oromia 0.03 0.95 −0.84–0.89
SNNP 0.36 0.65 −1.18– 1.90
Somali −1.36 0.2 −3.43– 0.71
Tigray −1.25 0.33 −3.79–1.29
Others −1.37 <.01** −2.36–(−0.37)
Central Ethiopia Reference – –
Geographic area Eastern Ethiopia 1.20 0.19 −0.59– 3.00
Northern Ethiopia 0.97 0.39 −1.23–3.16
Northwest Ethiopia −0.60 0.51 −2.40 –1.19
Southern Ethiopia −0.86 0.26 −2.36–0.63
Southwest Ethiopia −0.22 0.67 −1.23–0.79
Others 0.99 0.08 −0.10–2.09
Bacterial genus E. coli Reference – –
Salmonella −0.76 <.01** −1.25–(− 0.26)
Sample source Environment Reference – –
Human (stool) −0.52 0.05* −1.05–(−0.01)
> 400 Reference – –
Sample size 301–400 0.40 0.37 −0.47–1.28
201–300 0.25 0.51 −0.50–0.99
101–200 0.48 0.19 −0.24–1.19
≤100 1.26 <.01** 0.45–2.07
Publication Year 2000–2010 Reference – –
2011–2015 0.43 0.46 −0.72–1.58
2016–2020 0.03 0.96 −0.08–1.13
Note: * = Significant, ** = highly significant
Belina et al. One Health Outlook (2021) 3:19 Page 21 of 30
prevalence up to 13.8% in E. coli was also reported fromDebre Markos [48]. On the other hand, lower prevalenceof E. coli [41, 44] and Salmonella [41] were previously re-ported from Hawassa and Debre Markos, respectively.The observed heterogeneity in prevalence of these patho-gens among regions or geographic areas may be associatedwith differences between experience and awareness of hy-gienic measures of people living in the regions and dis-tricts or towns. The articles used in this review did notcover all geographic areas and there is also a factual differ-ence in study reports between urban and rural areas of theregion which might be another factor for the variation.On the other hand, as there is no previous meta-analysisreport of FBP in human stool from Ethiopia, there is adata gap for comparison of the pooled prevalence.Enteric bacterial pathogens including DEC and NTS,
and their products, are the major causes of acute diarrhea[7, 136]. Likewise, we found a variation in the prevalenceestimates of FBP among the stool sample conditions diar-rheic, non-diarrheic, and unidentified stool considered inthis analysis. The least prevalence value, 3.3%(1.8–5.8),was found in non-diarrheic patients. The review alsorevealed that pooled prevalence of Salmonella and E. colivaries among different age groups (Table 6). Significantlythe highest prevalence, (6.4%; 95% CI: 4.1–8.9) was re-corded in UFC age groups with the utmost occurrencerate during the period between 2011 and 2015. The higherprevalence during this period might be connected withthe fact that majority of the studies included in this reviewwere conducted between 2011 and 2020 years. Reduction
in prevalence during 2016 and 2020 period, however,might implies presence of little public awareness aboutFBP to the level that may not undermined. The prevalenceestimates in under 15, adults and all age group categorieswere 4.7%; 95% CI: 2–10.6, 4.2%; 95% CI: 2.6–6.7 and4.2%; 95% CI: 2.1–8.1, respectively.Similarly, variation in prevalence and geographical dis-
tribution of FBP among age group categories at differentgeographic areas has also previously reported by Ayanaet al [137].Comparable to this study, 6.5% Salmonella prevalence
was reported in UFC in Addis Ababa, and the higherproportion of FBD in UFC might be associated with lowerimmune status of younger children [71]. Salmonellainfection, particularly NTS usually causes self-limitinggastroenteritis characterized by diarrhea, abdominal painand vomiting in people of all ages [29, 129]. Drinkinguntreated water from private wells and recreation in sur-face waters are also risk factors for FBD, like sporadicSalmonellosis in children [138]. Intrinsic risk factors canalso influence occurrence of NTS and diarrheagenicE. coli. Gastric hypoacidity in infants, due to perniciousanemia, or caused by antacids and H-2 blockers couldpredispose individuals to Salmonellosis [139]. Poorenvironmental conditions, socioeconomic status andbehavioral factors are also strongly associated with therisk of diarrheal disease transmission. In Ethiopia about13% of children under age of 5 years had diarrhea andaccording to the World Health Statistics 2011, 27% deathsof UFC in Ethiopia is due to diarrheal diseases [140].
Table 10 Multivariate meta regression results of separate human stool and Environmental sample based proportion estimates ofFBP in Ethiopia
Covariate Variables Coefficient P value 95% CI
FBP in the human stool Geographic area Central Ethiopia Reference – –
Eastern Ethiopia −0.15 0.76 −1.20,0.90
Northwest Ethiopia −0.76 0.04* −1.51, 0.02
Southern Ethiopia −0.97 0.01** −1.74,0.20
Southwest Ethiopia −0.30 0.55 −1.27,0.67
Others −0.45 0.46 −1.65, 0.74
FBP in the environmental samples Sample size > 400 Reference – –
301–400 1.27 0.04* −0.07,2.47
201–300 1.21 0.04* −0.08,2.35
101–200 1.52 <.01** 0.48,2.55
≤ 100 1.75 <.01** 0.64,2.85
Actual study year 2016–2020 Reference – –
2011–2015 −1.12 < 0.01** −1.87,-0.36
2006–2010 −1.18 0.22 −3.05, 0.70
Year of publication 2011–2015 Reference – –
2016–2020 −0.06 0.15 −1.40,0.21
Note: * = Significant, ** = highly significant
Belina et al. One Health Outlook (2021) 3:19 Page 22 of 30

Apart from Ethiopia, Harb et al. [132] also mentionedthat prevalence of FBP like Salmonella is usually higherin children under the age of five and rates of contamin-ation vary between countries due to a number of factorsincluding the source and type of sample. Another studyalso reported that diarrheal diseases are one of the mostimportant causes of illness in young children in develop-ing countries. It contributes about 24–30 and 25%deaths, in infant and among children aged between 1and 4 years [141]. The difference in Salmonella preva-lence among humans is dynamic in nature, and it is notsurprising to capture variations between countries. Suchvariations might be attributed to several factors impact-ing NTS levels in food and water, which play a majorrole in human exposure to infection [131, 132]. In thisstudy, the highest prevalence was found in studies inwhich smaller sample was used whereas the least preva-lence was reported in studies that analysis a sample sizebetween 300 and 400. However, observed significant es-timate in sample size ≤100 categories may not exactlyshow true effect size because a small studies can producefalse-positive results, or small sample size may over-estimate the magnitude of an association [142].Overall, higher pooled prevalence of Salmonella and
pathogenic E. coli was recorded in studies employinghealth facility based design than in the community ornon-health facility institution based study types (Table6). Higher FBP prevalence could be because of the factthat sick people admitted to healthcare facilities mayhave been exposed to at least one pathogen which isprobably associated with the development of clinicalsigns and symptoms, for which the patient is admitted.Majority of the study reports used in this review areconducted using routine culture and biochemical, agglu-tination tests. None of the studies employed moleculardiagnostic techniques for detection of pathogenic E. coliin human stool (Table 2). Besides, the routine cultureand biochemical test based pathogen detection, in 5.9%;95% CI: 3.4–9.9 of the studies, anti-sera (agglutination)tests were also used. In 4.7%; 95% CI: 3.3–6.3 studies;however, Salmonella and pathogenic E. coli were de-tected only with culture and biochemical tests.The methods and laboratory protocols used for isola-
tion and identification of the pathogens were variableacross studies. Molecular diagnostic technique was notconsidered for comparison of the diagnostic techniqueestimates because it is employed only in three studies(Table 6). However, molecular methods like genotypicidentification remain the most popular and most reliabletechniques recommended for differentiating diarrhea-genic strains from nonpathogenic members of the stoolflora [143]. It avoids all inconvenience of phenotypic as-says, like variation in enzymatic activity when bacteriaare cultured in different media, emergence of
biochemical mutants and presence of strain of differentspecies that are very closely related and possess the samephenotype but different genotype [144]. The molecularcharacteristics of organisms provide markers for investi-gation of outbreaks, attribution studies, and assessmentof potential virulence or epidemic potential [143].The usual use of routine culture and biochemical tests
in disease diagnosis, however, implies little attention isgiven to FBD detection which may be partially due tolimited access to advanced laboratory facility in thecountry. Moreover, limited access to advanced facilitieshinders the validity and depth characterization of patho-gens. Available studies also suggested that, in Ethiopia,little is known about public health effect of bacterialpathogens like E. coli as FBP due to lack of a well-documented system and an integrated surveillance [145].A comprehensive investigation approach is thereforeneeded as input towards the achievement of evidencebased prevention and mitigation strategies.
The FBP, Salmonella and pathogenic E. coli, in theenvironment samplesThe result of 43 studies screened for the current meta-analysis also identified E. coli and Salmonella as a com-monly reported FBP in different environmental samplesin Ethiopia. The systematic review indicated the highestprevalence of E. coli was 81.3% (73.43–87.25) reportedin a study by Hussen [96] from northern Ethiopiawhereas its correspondence for Salmonella was 57.5%(41.96–71.69) investigated in northwest areas of Ethiopia[100]. The lowest prevalence was reported as 0.35% forE. coli in carcass from Central Ethiopia [37] and 0% forSalmonella [116]. In contrary to the case of FBPs in hu-man, there were a higher number of eligible studies onE. coli from environmental samples which also coveredwider geographic areas than studies on Salmonella spp.(Table 3). Likewise, variation of bacterial FBP in differentfood items and other environmental samples was re-ported in previous studies [8, 146].In agreement with the prevalence in human stool, the
highest pooled prevalence of E. coli and Salmonella werereported in sample size ≤100. Therefore, the variation insample size and sample type analyzed by different re-searchers might also attributed to variation in prevalenceof FBP. Unlike the human cases, the highest prevalenceof Salmonella and E. coli was reported during the 2016–2020 which may be connected to the growing number ofhigher education and research institutes in Ethiopia thathas been improving the capacity of pathogen detectionthat minimizes, for instance, false negative cases. On theother hand, the higher prevalence estimates in samplesize ≤100 might be due to effects of uncertainty. Largersample sizes give more reliable results with greater pre-cision and power masking the effects of uncertainty
Belina et al. One Health Outlook (2021) 3:19 Page 23 of 30
[142]. Likewise, the number of environmental samplebased studies included in this reviews from the studyperiod 2016–2020 are less than that included from thestudy periods between 2011 and 2015.Overall the environmental sample based pooled preva-
lence of Salmonella and E. coli was 10.5% (8.1–13.5)with I2 = 96% and Q(p) = 1924(0.00) (Table 5) and theactual study year, publication year and categorized sam-ple size significantly influences (P < 0.05) the prevalenceestimates (Table 10). The current pooled prevalence infood is partially comparable with reports of differentstudies [26, 133, 147]. A pooled prevalence value of E.coli, 15%, was recently reported by Assefa and Bihon[26] in ASF, from Ethiopia. A 9 and 10% pooled preva-lence of Salmonella in ASF and poultry meat was alsorespectively, reported in previous studies [133, 147]. Thecurrent pooled prevalence of Salmonella and pathogenicE. coli in the environmental sample, 10.5% (Table 5), ishowever, higher than the pooled prevalence of E. coli re-ported in meat and meat products [133].Among the sample type analyzed, the highest preva-
lence (p < 0.01) was found in RTE foods (i.e. differentstreet vended foods such as bonbolino, sambusa, fuol,cooked potato, RTE vegetables, White lupin (Lupinusalbus) and etc. which are eaten in the street in Ethiopia).The results also reported the presence of Salmonellaand E. coli in 7.4% (95% CI: 4.5–11.8) and 3.8% (95% CI:1.9–7.6) of meat (carcass) and its contact surfaces, re-spectively. On the other hand, the occurrence of FBP at-tributed to poultry products and its contact surfaces,and animal feces was sequentially, 12.8% (CI: 5.6–26.4)and 10.9% (CI: 5.1–22.0) (Table 7). Other availablestudy, on averaged reported a higher prevalence of E.coli, 37.6% in raw foods, and 31.6% in RTE foods. Itscorresponding prevalence for Salmonella in seven Afri-can countries, namely Benin, Botswana, Ghana, Kenya,Nigeria, Sudan and Uganda, was 19.9 and 21.7% [6].Relative contribution of ASF to FBD burden differswidely between subregions, and between countrieswithin the same subregion [126]. Carcasses from appar-ently healthy animals are generally assumed to be free ofbacterial pathogens but contamination occurs in slaugh-terhouses. Nevertheless, the occurrence of E. coli andSalmonella spp in ASF in Ethiopia is high due to manyreasons like illegal slaughtering of animals in open fieldsand unhygienic slaughter practices in the abattoirs [148,149]. As justified by Tadesse and Gebremedhin [148],the skills of personnel involved in gut evisceration,carcass examination, carcass handling, and the hygienicstandards of the slaughterhouses may also result in dif-fering prevalence of the FBP between different studies.Besides, contamination of meat with Salmonella spp. inslaughterhouses in Ethiopia is also significantly associ-ated with slaughtered animal species. Salmonella spp.
prevalence was 3.86, 4.53, 8.34 and 10.76% in goat car-casses, beef carcasses, minced beef and milk respectively[148]. A previous study also reported higher prevalenceof Salmonella 7.1, 8.4 and 9%, in slaughtered cattle,sheep and goats respectively, in Ethiopia [150].The pooled prevalence of FBP in the present meta-
analysis was 22.8% (12–39.1) in raw milk and 15.3%(5.6–35.8) in other dairy products (Table 7). However, astudy by Keba et al. [8], from Ethiopia reported only a 6and 10% pooled prevalence of Salmonella and E. coli re-spectively in raw cow milk. On the other hand, studyconducted by Abunna et al. [151] on boiled milk andBedasa et al. [91] on pasteurized milk reported no E. colipositive samples. Similarly, Tesfay et al. [152] and Ejeoet al. [114] did not detect Salmonella in pasteurized milkand other processed dairy product samples. This sup-ports the concept that it is not common to detect patho-gens like E. coli and Salmonella in processed dairyproducts but pathogens can enter the food chain as con-taminants during post process product handling up tothe consumption time. Specifically, E. coli is a marker offecal contamination and the higher prevalence indicatesreduced level of hygienic practice [6, 153]. Paudyal et al.[6], also explained that differences in food types as wellas non-uniform protocols for sampling and identificationmight have contributed to heterogeneity although somehigh prevalence data could be factual due to an extensivevariety of raw and RTE foods. This significant prevalenceof FBP in different food items and other environmentalsamples may be linked with cross contamination of thefood items.A safe drinking water, also called potable water is
water does not contain harmful or potentially harmfulsubstances and does not present any risk to humanhealth [154, 155]. However, one study specifically re-ported 3.3% Salmonella prevalence in drinking water[117]. Our study also showed 38.8 and 11.5% combineprevalence estimate of Salmonella and pathogenic E. coliin river water and wastewater, respectively. The currentreview findings are partially in agreement with the re-ports of Desta [156], Tsega et al. [157] and Melaku [154]from Ethiopia, who reported, higher proportions of totalcoliform and fecal coliform counts above the recom-mended national and international standards in drinkingwater. Denno et al. [138] reported that drinking un-treated water from private wells and recreation in sur-face waters are risk factors for FBD. Furthermore, bothSalmonella and E. coli normally live in the intestinaltracts of in healthy and disease conditions which may in-crease the contamination and cross contamination ofdifferent foods and drinking water. The pathogens arealso naturally found in the environment and in both do-mestic and wild animals [6, 146]. Some animal speciesare asymptomatic and act carriers; hence they play a
Belina et al. One Health Outlook (2021) 3:19 Page 24 of 30

prominent role in epidemiological distribution of theFBD [79].In general occurrence of FBP may vary with different
risk factors but it is difficult to identify the specific factorsthat might have contributed to high heterogeneity of FBPprevalence. The prevalence data could be factual due toan extensive variety of foods that are processed or handledunder different hygienic conditions. As described in theavailable studies, most of the FBP are not endogenouscontaminants but are introduced as exogenous contami-nants during handling, processing and preparation [5, 6].The separate analysis of different risk factors associatedwith occurrence of FBP in the environmental samples alsoindicates significant differences in occurrence of FBDamong the administrative regions or city councils, inEthiopia. Significantly, the highest prevalence (p < 0.01) ofSalmonella and pathogenic E. coli is reported from Am-hara regional state (Table 7). Such variation could be dueto different methods of diagnosis, sample sizes and studylocations among other reasons [26]. The least prevalenceestimate, 6.5% (4.3–9.7), reported from central Ethiopia,however, might implies presence of relatively betterawareness about FBP in and around the capital of thecountry, Addis Ababa. Lack of regular reports and un-equal accessibility of FBD data at different levels due topoor cooperation among human and environmentalhealth professionals, and animal health or veterinarianscan also be one reason for the variation among regionsand districts. As a matter of fact, there is poor informationsharing and communication across the key relevant sec-tors and multi-sectoral working mechanism in response todisease outbreaks and other one health-related hazards isalmost absent in Ethiopia [158].
Limitations of the studyThis study has some limitations which is obviously ex-pected from such a study. Possible sources of bias in-clude the inclusion/exclusion criteria, the chosendatabase, the date, the language, and the number of arti-cles included as well as the article type selected for thisstudy. Moreover, small number of pathogens consideredfor the analysis is also a limitation—i.e., only pathogenicE. coli, Salmonella, Shigella and Campylobacter spp.,were included in the study to determining the overallpooled prevalence of FBP in Ethiopia. This may have im-pacts on the statistical estimates of the pooled preva-lence of FBP. We believe that the inconstant number ofstudies in each subgroup variable (Fig. 2) may also affectthe results of subgroup analysis as less than ten studieswere also included in few subgroups. Besides, most ofthe included studies detected the FBP using routine cul-ture and biochemical tests. As a result, our study onlygives the general picture of FBP in Ethiopia and couldn’t
estimate relative importance of each serotype orpathotype.
ConclusionIn conclusion, overall pooled prevalence estimate of bac-terial FBP was 8%, with relatively higher prevalence esti-mates in the environmental samples than in humanstool. There was a substantial variation in occurrence ofFBP, specifically Salmonella and E. coli, under differentepidemiological settings like, in different food items,food contact surfaces as well as among age group cat-egories. On the other hand, the current review highlightsthat FBP are important in all age group categories inEthiopia though the significantly highest prevalence esti-mate, 6.4%, was reported in UFC.Furthermore, in the majority of the eligibly included
studies in the current review, FBP were identified usingroutine culture and biochemical test based diagnostictechniques which imply there is a high need for ad-vanced laboratory protocols to enhance the diagnosisand detection of FBD in Ethiopia. Besides, almost all ofthe retrieved studies were conducted in a fragmentedmanner either in human, animal or environmental sam-ples which indicates there is a research gap in source at-tribution of the disease in the country. Thus, furtherFBD studies at the human, animal and environmentalinterface employing advanced diagnostic techniques isneeded in order to investigate the source attributions ofhuman or animal infection in an integrated one healthapproach.
AbbreviationsASF: Animal sourced foods; CSA: Central Statistical Agency;EHEC: Enterohemorrhagic E. coli; EIEC: Enteroinvasive E. coli;EPEC: Enteropathogenic E. coli; FBD: Foodborne diseases; FBP: Foodbornepathogens; FERG: Foodborne Epidemiology Reference Group; NTS: Nontyphoidal Salmonella; PCR: Polymerase chain reaction; RTE food: Ready to eatfood; SNNP: Southern Nations, Nationalities, and Peoples; UFC: Under fivechildren
Supplementary InformationThe online version contains supplementary material available at https://doi.org/10.1186/s42522-021-00048-5.
Additional file 1: Annex 1. Specific key words (search terms) used toretrieve potential articles to identifying the most important FBP inchildren in Ethiopia.
AcknowledgementsThe authors like to acknowledge Haramaya University for its provision of freeinternet access during the study.
Authors’ contributionsIn general, all authors were participated in designing the methodology, dataextraction, result presentation and discussion. Specifically: DB: Involved inidentification of study variables or outcomes (Fig. 2) and developing thesearch terms. DB also performed article collection and de-duplication, dataextraction as well as data analysis and interpretation of the results. YH: per-formed the details of the study variables or outcomes identification, he alsoinvolved in the article collection and in both first and second screening
Belina et al. One Health Outlook (2021) 3:19 Page 25 of 30

processes. TG: contributed in search terms development, highly contributedin overall screening methods and he also coordinated the second phase ofscreening process and Reference management. TH and PMK: conductedoverall framework synthesis and also contributed in interpretation and dis-cussion of the meta-analysis results. All authors read and approved the finalmanuscript.
FundingThe study is part of the FOCAL (Foodborne disease epidemiology,surveillance and control in African LMIC. FOCAL is a multi-partner multi-country research project co-funded by the Bill & Melinda Gates Foundationand the Foreign, Commonwealth & Development Office (FCDO) of theUnited Kingdom Government (grant agreement investment ID OPP1195617).
Availability of data and materialsThe data used in this systematic review and meta-analyses was presented inthe study and also the remaining data is accessible by requesting, from thecorresponding author. Additionally, as supplementary file Annex 1 is submit-ted with this paper.
Declarations
Ethics approval and consent to participateThis paper is prepared from a reviewed data and did not involve any samplecollection. So an ethical approval and participant consent were not requiredas per Ethiopian Government rules.
Consent for publicationAll authors consented for the publication of this study.
Competing interestsAll authors read and approved the final manuscript. Its contents are solelythe responsibility of the authors. All authors declare that they have nocompeting interests.
Author details1College of Veterinary Medicine, Haramaya University, P.O. Box 138, DireDawa, Ethiopia. 2College of Agriculture and Environmental Sciences,Haramaya University, Dire Dawa, Ethiopia. 3National Food Institute, TechnicalUniversity of Denmark, Lyngby, Denmark. 4College of Health and MedicalSciences, Haramaya University, Dire Dawa, Ethiopia.
Received: 1 March 2021 Accepted: 9 June 2021
References1. Adley CC, Ryan MP. Chapter 1- The Nature and Extent of Foodborne
Disease. In: Barros-Velázquez J, editor. Antimicrobial Food Packaging:Academic; 2016. p. 1–10. https://www.sciencedirect.com/topics/food-science/food-borne-disease.
2. Bintsis T. Foodborne pathogens. AIMS Microbiol. 2017;3(3):529–63. https://doi.org/10.3934/microbiol.2017.3.529.
3. Gupta R, Gupta A, Singh RP, Singh PK, Singh RL. Chapter 4 - Food Allergies.In: Singh RL, Mondal S, editors. Food Safety and Human Health: Academic;2019. p. 99–125. https://www.sciencedirect.com/science/article/pii/B9780128163337000047.
4. Heredia N, García S. Animals as sources of food-borne pathogens: A review.Anim Nutr. 2018;4(3):250–5. https://doi.org/10.1016/j.aninu.2018.04.006.
5. Rane S. Street vended food in developing world: hazard analyses. Indian JMicrobiol. 2011;51(1):100–6. https://doi.org/10.1007/s12088-011-0154-x.
6. Paudyal N, Anihouvi V, Hounhouigan J, Matsheka MI, Sekwati-Monang B,Amoa-Awua W, et al. Prevalence of foodborne pathogens in food fromselected African countries – A meta-analysis. Int J Food Microbiol. 2017;249:35–43. https://doi.org/10.1016/j.ijfoodmicro.2017.03.002.
7. Girma G. Prevalence, Antibiogram and growth potential of Salmonella andShigella in Ethiopia: implications for public health. A Review. Res J Microbiol.2015;10(7):288–307 https://scialert.net/abstract/?doi=jm.2015.288.307.
8. Keba A, Rolon ML, Tamene A, Dessie K, Vipham J, Kovac J, et al. Review ofthe prevalence of foodborne pathogens in milk and dairy products inEthiopia. Int Dairy J. 2020;109:104762.
9. Chen L, Alali W. Editorial: recent discoveries in human serious foodbornepathogenic Bacteria: resurgence, pathogenesis, and control strategies. FrontMicrobiol. 2018;9:2412. https://doi.org/10.3389/fmicb.2018.02412.
10. CDC. What is a foodborne disease outbreak and why do they occur, 2020.Available from: http://www.cdc.gov/foodsafety/facts.html#whatisanoutbreak
11. Welda-Giorgis N. Reported diarrheal cases among patients including HIV/AIDS visiting Kamash Health Centre between 2011 and 2015. M. Sc. thesis,Addis Ababa University department of Biology, Addis Ababa, Ethiopia; 2017-08. http://etd.aau.edu.et/handle/123456789/7342.
12. Pieracci EG, Hall AJ, Gharpure R, Haile A, Walelign E, Deressa A, et al.Prioritizing zoonotic diseases in Ethiopia using a one health approach. OneHealth. 2016;2:131–5. https://doi.org/10.1016/j.onehlt.2016.09.001.
13. Feleke H, Medhin G, Abebe A, Beyene B, Kloos H, Asrat D. Enteric pathogensand associated risk factors among under-five children with and withoutdiarrhea in Wegera District, Northwestern Ethiopia. PAMJ. 2018;29:72.
14. Zeru K, Kumi A. Sanitary conditions of food establishments in Mekelle town,Tigray, north Ethiopia. Ethiop J Health Dev. 2017;21:3–11 https://www.ajol.info//index.php/ejhd/article/view/10025.
15. CDC/The Centers for Disease Control and Prevention. Global health-Ethiopia: What CDC is doing in Ethiopia: global health security. 2018. www.cdc.gov/globalhealth/countries/ethiopia.
16. Kagambèga A, Lienemann T, Aulu L, Traoré AS, Barro N, Siitonen A, et al.Prevalence and characterization of Salmonella enterica from the feces ofcattle, poultry, swine and hedgehogs in Burkina Faso and their comparisonto human Salmonella isolates. BMC Microbiol. 2013;13(1):253. https://doi.org/10.1186/1471-2180-13-253.
17. Eguale T, Asrat D, Alemayehu H, Nana I, Gebreyes WA, Gunn JS, et al.Phenotypic and genotypic characterization of temporally relatednontyphoidal Salmonella strains isolated from humans and food animals inCentral Ethiopia. Zoonoses Public Health. 2018;65(7):766–76. https://doi.org/10.1111/zph.12490.
18. Griffin PM, Tauxe RV. The epidemiology of infections caused by Escherichiacoli O157:H7, other enterohemorrhagic E. coli, and the associatedhaemolytic uremic syndrome. Epidemiol Rev. 1991;13(1):60–97. https://doi.org/10.1093/oxfordjournals.epirev.a036079.
19. Atnafie B, Paulos D, Abera M, Tefera G, Hailu D, Kasaye S, et al. Occurrenceof Escherichia coli O157:H7 in cattle feces and contamination of carcass andvarious contact surfaces in abattoir and butcher shops of Hawassa, Ethiopia.BMC Microbiol. 2017;17(1):24. https://doi.org/10.1186/s12866-017-0938-1.
20. World Bank, People, Pathogens, and our Planet. Volume 1: Towards a oneHealth Approach for Controlling Zoonotic Diseases. Washington, DC: TheWorld Bank; 2010. https://openknowledge.worldbank.org/handle/10986/2844
21. McDermott J, Grace D. Agriculture-associated diseases: adapting agricultureto improve human health. In: Fan S, Pandya-Lorch R, editors. Reshapingagriculture for nutrition and health. Washington, DC: IFPRI; 2012. p. 12–103.https://www.ifpri.org/publication/reshaping-agriculture-nutrition-and-health.
22. Greger M. The human/animal interface: emergence and resurgence ofzoonotic infectious diseases. Crit Rev Microbiol. 2007;33(4):243–99. https://doi.org/10.1080/10408410701647594.
23. Lindahl JF, Grace D. The consequences of human actions on risks forinfectious diseases: a review. Infect Ecol Epidemiol. 2015;5:30048.
24. Zelelie TZ, Demissew GDS, Tilahun AT, Hillary A. Enteropathogens in Under-Five Children with Diarrhea in Health Facilities of Debre Berhan Town, NorthShoa, Ethiopia. Ethiop J Health Sci. 2018;29(2):203 https://www.ajol.info/index.php/ejhs/article/view/188119.
25. Tosisa W. Prevalence and antibiotic resistance of enteric bacterial pathogensisolated from childhood diarrhea in ambo town public health institutions.M. Sc. thesis, Addis Ababa University Department of Microbiology,Immunology, and Parasitology, Addis Ababa, Ethiopia; 2015-02. http://etd.aau.edu.et/bitstream/handle/123456789/6276/Mohammed%20Biset.pdf;jsessionid=991DA0181E96BD94CB535EBD0846231C?sequence=1.
26. Assefa A, Bihon A. A systematic review and meta-analysis of prevalence ofEscherichia coli in foods of animal origin in Ethiopia. Heliyon. 2018;4(8):e00716. https://doi.org/10.1016/j.heliyon.2018.e00716.
27. Tadesse G. Prevalence of human salmonellosis in Ethiopia: a systematicreview and meta-analysis. BMC Infec dis. 2014;14(1):88. https://doi.org/10.1186/1471-2334-14-88.
28. Tosisa W, Mihret A, Ararsa A, Eguale T, Abebe T. Prevalence andantimicrobial susceptibility of Salmonella and Shigella species isolated fromdiarrheic children in ambo town. BMC Pediatr. 2020;20(1):91. https://doi.org/10.1186/s12887-020-1970-0.
Belina et al. One Health Outlook (2021) 3:19 Page 26 of 30

29. Eguale T, Gebreyes WA, Asrat D, Alemayehu H, Gunn JS, et al. Non-typhoidal Salmonella serotypes, antimicrobial resistance and co-infectionwith parasites among patients with diarrhea and other gastrointestinalcomplaints in Addis Ababa, Ethiopia. BMC Infect Dis. 2015;15:497.
30. Wang N. 2018 Conducting Meta-analyses of proportions in R. John JayCollege of Criminal Justice, CUNY. https://www.researchgate.net/publication/325486099_How_to_Conduct_a_Meta-Analysis_of_Proportions_in_R_A_Comprehensive_Tutorial
31. Viechtbauer W. Conducting Meta-Analyses in R with the metafor Package. JStat Softw. 2010;36(3) https://www.jstatsoft.org/article/view/v036i03.
32. Hamza TH, van Houwelingen HC, Stijnen T. The binomial distribution ofmeta-analysis was preferred to model within-study variability. J ClinEpidemiol. 2008;61(1):41–51. https://doi.org/10.1016/j.jclinepi.2007.03.016.
33. Basu A. How to conduct meta-analysis: A basic tutorial: University ofCanterbury; 2017. https://peerj.com/preprints/2978.pdf
34. Borenstein M, Hedges LV, Higgins JPT, Rothstein HR. Introduction to Meta-analysis. Chichester: Wiley; 2009. https://chb.bmn.ir/Asset/files/Introduction-to-Meta-Analysis.pdf. https://doi.org/10.1002/9780470743386.
35. Higgins JP, Thompson SG, Deeks JJ, Altman DG. Measuring inconsistency inmeta-analyses. BMJ. 2003;327(7414):557–60. https://doi.org/10.1136/bmj.327.7414.557.
36. Fu R, Gartlehner G, Grant M, Shamliyan T, Sedrakyan A, Wilt TJ, et al.Conducting quantitative synthesis when comparing medical interventions:AHRQ and the Effective Health Care Program. J Clin Epidemiol. 2011;64(11):1187–97. 21477993. https://doi.org/10.1016/j.jclinepi.2010.08.010.
37. Abdissa R, Haile W, Fite AT, Beyi AF, Agga GE, Edao BM, et al. Prevalence ofEscherichia coli O157:H7 in beef cattle at slaughter and beef carcasses atretail shops in Ethiopia. BMC Infect Dis. 2017;17(1):277. https://doi.org/10.1186/s12879-017-2372-2.
38. Abera B, Hailu T, Beza L, Mulu W, Yizengaw E, Kibret M. Aetiology of acutediarrhoea and antimicrobial usage among children aged under five years athealth centres in Bahir Dar, Ethiopia. Trop Doct. 2020;50(3):190–4. https://doi.org/10.1177/0049475520912558.
39. Adugna A, Kibret M, Abera B, Nibret E, Adal M. Antibiogram of E. coliserotypes isolated from children aged under five with acute diarrhea inBahir Dar town. Afr Health Sci. 2015;15(2):656–64. https://doi.org/10.4314/ahs.v15i2.45.
40. Amsalu A, Geto Z, Asegu D, Eshetie S. Antimicrobial resistance pattern ofbacterial isolates from different clinical specimens in southern Ethiopia: Athree year retrospective study. Afr J Bacteriol Res. 2017;9(1):1–8 https://academicjournals.org/journal/JBR/article-abstract/14A127962796.
41. Ayenew Z, Biazin H, Gebre-Selassie S, Yeshitila B, Mihret A, Abebe T. Entericpathogens and antimicrobial susceptibility profile among pediatric patientswith diarrhea in Addis Ababa, Ethiopia. Ethiop Med J. 2019;1:57–65 https://emjema.org/index.php/EMJ/article/view/1203.
42. GebreSilasie YM, Tullu KD, Yeshanew AG. Resistance pattern and maternalknowledge, attitude and practices of suspected Diarrheagenic Escherichiacoli among children under 5 years of age in Addis Ababa, Ethiopia: crosssectional study. Antimicrob Resist Infect Control. 2018;7:110.
43. Huruy K, Kassu A, Mulu A, Worku N, Fetene T, Gebretsadik S, et al. Intestinalparasitosis and shigellosis among diarrheal patients in Gondar teachinghospital, Northwest Ethiopia. BMC Res Notes. 2011;4(1):472. https://doi.org/10.1186/1756-0500-4-472.
44. Kebede A, Aragie S, Shimelis T. The common enteric bacterial pathogensand their antimicrobial susceptibility pattern among HIV-infected individualsattending the antiretroviral therapy clinic of Hawassa university hospital,southern Ethiopia. Antimicrob Resist Infect Control. 2017;6:128.
45. Mamuye Y, Metaferia G, Birhanu A, Desta K, Fantaw S. Isolation andantibiotic susceptibility patterns of Shigella and Salmonella among under 5children with acute diarrhoea: a cross-sectional study at selected publichealth facilities in Addis Ababa, Ethiopia. Clin Microbiol. 2015;4:1.
46. Mekonnen M, Geda B, Teklemariam Z, Weldegebreal F, Balakrishnan S.Prevalence of childhood diarrhea and associated risk factors in Dire Dawa,eastern Ethiopia. J Public Health. 2017;26(1):29–37 https://link.springer.com/article/10.1007/s10389-017-0843-y.
47. Getie M, Abebe W, Tessema B. Prevalence of enteric bacteria and theirantimicrobial susceptibility patterns among food handlers in Gondar town,Northwest Ethiopia. Antimicrob Resist Infect Control. 2019;8(1):111. https://doi.org/10.1186/s13756-019-0566-7.
48. Mulu W, Abera B, Yimer M, Hailu T, Ayele H, Abate D, et al. Bacterial agentsand antibiotic resistance profiles of infections from different sites that
occurred among patients at Debre Markos referral hospital, Ethiopia: across-sectional study. BMC Res Notes. 2017;10:254.
49. Garedew L, Solomon S, Worku Y, Worku H, Gemeda D, Lelissa G, et al.Diagnosis and treatment of human salmonellosis in Addis Ababa City,Ethiopia. Biomed Res Int. 2018:6406405.
50. Abebe W, Earsido A, Taye S, Assefa M, Eyasu A, Godebo G. Prevalence andantibiotic susceptibility patterns of Shigella and Salmonella among childrenaged below five years with Diarrhoea attending Nigist Eleni Mohammedmemorial hospital, South Ethiopia. BMC Pediatr. 2018;18(1):241. https://doi.org/10.1186/s12887-018-1221-9.
51. Admassu M, Yemane G, Kibret M, Abera B, Nibret E. Adal, M. prevalence andantibiogram of Shigella and Salmonella spp. from under five children withacute diarrhea in Bahir Dar town. EJST. 2015;8(1):27–35 https://www.ajol.info/index.php/ejst/article/view/126122.
52. Ameya G, Tsalla T, Getu F, Getu E. Antimicrobial susceptibility pattern, andassociated factors of Salmonella and Shigella infections among under fivechildren in Arba Minch, South Ethiopia. Ann Clin Microbiol Antimicrob.2018;17(1):1. https://doi.org/10.1186/s12941-018-0253-1.
53. Andualem B, Geyid A. Antimicrobial responses of Yersinia enterocoliticaisolates in comparison to other commonly encountered bacteria thatcauses diarrhoea. East Afr Med J. 2005;82(5):241–6. https://doi.org/10.4314/eamj.v82i5.9313.
54. Assefa A, Girma M. Prevalence and antimicrobial susceptibility patterns ofSalmonella and Shigella isolates among children aged below five years withdiarrhea attending robe general hospital and Goba referral hospital, SouthEast Ethiopia. Trop Dis Travel Med Vaccines. 2019;5(1):19. https://doi.org/10.1186/s40794-019-0096-6.
55. Awole M, Gebre-Selassie S, Kassa T, Kibru G. Isolation of potential bacterialpathogens from the stool of HIV-infected and HIV-non-infected patientsand their antmicrobial susceptibility patterns in Jimma hospital, south WestEthiopia. Ethiop Med J. 2002;40(4):353–64.
56. Beyene G, Haile-Amlak A. Antimicrobial sensitivity pattern of Campylobacterspecies among children in Jimma University Specialized Hospital, southwestEthiopia. Ethiop J Health Dev. 2004;18(3):185–9 https://www.ajol.info/index.php/ejhd/article/view/9958.
57. Beyene G, Tasew H. Prevalence of intestinal parasite, Shigella andSalmonella species among diarrheal children in Jimma health center, Jimmasouthwest Ethiopia: a cross sectional study. Ann Clin Microbiol Antimicrob.2014;13:10.
58. Demissie AT, Wubie TM, Yehuala FM, Fetene MD, Gudeta AG, et al. Sci J PubHealth. 2014;2(5):469–75 http://www.sciencepublishinggroup.com/journal/paperinfo.aspx?journalid=251&doi=10.11648/j.sjph.20140205.24.
59. Gebreegziabher G, Asrat D, W/Amanuel Y, Hagos T. Isolation andantimicrobial susceptibility profile of Shigella and Salmonella species fromchildren with acute Diarrhoea in Mekelle hospital and semen health center,Ethiopia. Ethiop J Health Sci. 2018;28(2):197–206. https://doi.org/10.4314/ejhs.v28i2.11.
60. Hawaz H, Girma S, Tezera Y, Ahmed U, Kelel M. Prevalence and drugsusceptibility pattern of Shigella and Salmonella species in under tendiarrhoeic children admitted to Tirunesh-Beijing hospital. Int J. 2017;3(2):63https://www.sci-rep.com/index.php/scirep/article/view/259.
61. Hayamo M, Alemayehu T, Tadesse B, Mitiku E, Bedawi Z. Shigella andSalmonella, antibiotics susceptibility pattern and associated risk factorsamong diarrheic children in southern Ethiopia: a cross sectional study:Research Square; 2020. https://www.researchsquare.com/article/rs-12803/v1
62. Lamboro T, Ketema T, Bacha K. Prevalence and antimicrobial resistance inSalmonella and Shigella species isolated from outpatients, Jimma Universityspecialized hospital, Southwest Ethiopia. Can J Infect Dis Med Microbiol.2016:4210760.
63. Mekonnen GK, Mengistie B, Sahilu G, Kloos H, Mulat W. Etiologies ofdiarrhea and drug susceptibility patterns of bacterial isolates among under-five year children in refugee camps in Gambella region, Ethiopia: a casecontrol study. BMC Infect Dis. 2019;19:1008.
64. Mengistu G, Mulugeta G, Lema T, Aseffa A. Prevalence and antimicrobialsusceptibility patterns of Salmonella serovars and Shigella species. J MicrobBiochem Technol. 2014;6(S2):S2–006 https://www.longdom.org/abstract/prevalence-and-antimicrobial-susceptibility-patterns-of-salmonellaserovars-and-shigella-species-9170.html.
65. Mulatu G, Beyene G, Zeynudin A. Prevalence of Shigella, Salmonella andcampylobacter species and their susceptibility patters among under five
Belina et al. One Health Outlook (2021) 3:19 Page 27 of 30
children with diarrhea in Hawassa town, South Ethiopia. Ethiop J Health Sci.2014;24(2):101–8. https://doi.org/10.4314/ejhs.v24i2.1.
66. Reda AA, Seyoum B, Yimam J, Andualem G, Fiseha S, Vandeweerd JM.Antibiotic susceptibility patterns of Salmonell and Shigell isolates in Harar,eastern, Ethiopia. J Infect Dis Immun. 2011;3(8):134–9 https://academicjournals.org/article/article1379604128_Reda%20et%20al.pdf.
67. Terfassa A, Jida M. Prevalence and antibiotics susceptibility pattern ofSalmonella and Shigella species among diarrheal patients attendingNekemte referral hospital, Oromia, Ethiopia. Int J Microbiol. 2018:9214689.
68. Teshome B, Teklemariam Z, Admassu Ayana D, Marami D, Asaminew N.Salmonella and Shigella among patients with diarrhea at public healthfacilities in Adama, Ethiopia: prevalence, antimicrobial susceptibility pattern,and associated factors. SAGE Open Med. 2019;7:2050312119846041.
69. Yemane G, Mulaw G, Gaim T. Prevalence and antimicrobial susceptibility ofSalmonella species in diarrheal children under five-years of age in Bahir Dartown, Ethiopia. Int J Int sci Inn Tech Sec A. 2014;13(2):12–7 https://webzoom.freewebs.com/ijiit/140302A03.pdf.
70. Abera B, Biadegelgen F, Bezabih B. Prevalence of Salmonella typhi andintestinal parasites among food handlers in Bahir Dar town, NorthwestEthiopia. Ethiop J Health Dev. 2010;24(1):46–50 https://www.ajol.info/index.php/ejhd/article/view/62944.
71. Beyene G, Nair S, Asrat D, Mengistu Y, Engers H, Wain J. Multidrug resistantSalmonella Concord is a major cause of salmonellosis in children inEthiopia. J Infect Dev Ctries. 2011;5(1):23–33. https://doi.org/10.3855/jidc.906.
72. Mengist A, Mengistu G, Reta A. Prevalence and antimicrobial susceptibilitypattern of Salmonella and Shigella among food handlers in cateringestablishments at Debre Markos university, Northwest Ethiopia. Int J InfectDis. 2018;75:74–9. https://doi.org/10.1016/j.ijid.2018.08.008.
73. Aklilu A, Kahase D, Dessalegn M, Tarekegn N, Gebremichael S, Zenebe S,et al. Prevalence of intestinal parasites, salmonella and shigella amongapparently health food handlers of Addis Ababa University student'scafeteria, Addis Ababa, Ethiopia. BMC Res Notes. 2015;8:17.
74. Awol N, Nigusse D, Ali M. Prevalence and antimicrobial susceptibility profileof Salmonella and Shigella among food handlers working in foodestablishment at Hawassa city, Southern Ethiopia. BMC Res Notes. 2019;12(1):712. https://doi.org/10.1186/s13104-019-4725-y.
75. Bafa TA, Sherif EM, Hantalo AH, Woldeamanuel GG. Magnitude ofenteropathogens and associated factors among apparently healthy foodhandlers at Wolkite University Student's cafeteria, Southern Ethiopia. BMCRes Notes. 2019;12(1):567. https://doi.org/10.1186/s13104-019-4599-z.
76. Mama M, Alemu G. Prevalence, antimicrobial susceptibility patterns andassociated risk factors of Shigella and Salmonella among food handlers inArba Minch University, South Ethiopia. BMC Infect Dis. 2016;16(1):686.https://doi.org/10.1186/s12879-016-2035-8.
77. Marami D, Hailu K, Tolera M. Prevalence and antimicrobial susceptibilitypattern of Salmonella and Shigella species among asymptomatic foodhandlers working in Haramaya University cafeterias, Eastern Ethiopia. BMCRes Notes. 2018;11(1):74. https://doi.org/10.1186/s13104-018-3189-9.
78. Solomon FB, Wada FW, Anjulo AA, Koyra HC, Tufa EG. Burden of intestinalpathogens and associated factors among asymptomatic food handlers inSouth Ethiopia: emphasis on salmonellosis. BMC Res Notes. 2018;11(1):502.https://doi.org/10.1186/s13104-018-3610-4.
79. Tadesse G, Mitiku H, Teklemariam Z, Marami D. Salmonella and Shigellaamong asymptomatic street food vendors in the Dire Dawa city, easternEthiopia: prevalence, antimicrobial susceptibility pattern, and associatedfactors. Environ Health Insights. 2019;13:1178630219853581.
80. Takele S, Woldemichael K, Gashaw M, Tassew H, Yohannes M, Abdissa A.Prevalence and drug susceptibility pattern of Salmonella isolates fromapparently healthy slaughter cattle and personnel working at the Jimmamunicipal abattoir, south-West Ethiopia. Trop Dis Travel Med Vaccines. 2018;4(1):13. https://doi.org/10.1186/s40794-018-0072-6.
81. Ten Hove RJ, Tesfaye M, Ten Hove WF, Nigussie M. Profiling of antibioticresistance of bacterial species recovered from routine clinical isolates inEthiopia. Ann Clin Microbiol Antimicrob. 2017;16(1):46. https://doi.org/10.1186/s12941-017-0221-1.
82. Abreham S, Teklu A, Cox E, Tessema TS. Escherichia coli O157:H7:distribution, molecular characterization, antimicrobial resistance patternsand source of contamination of sheep and goat carcasses at an exportabattoir, Mojdo, Ethiopia. BMC Microbiol. 2019;19(1):215. https://doi.org/10.1186/s12866-019-1590-8.
83. Bekele T, Zewde G, Tefera G, Feleke A, Zerom K. Escherichia coli O157:H7 inraw meat in Addis Ababa, Ethiopia: prevalence at an abattoir and retailersand antimicrobial susceptibility. Int J Food Contam. 2014;1(1):1–9 https://foodcontaminationjournal.biomedcentral.com/articles/10.1186/s40550-014-0004-9.
84. Messele YE, Abdi RD, Yalew ST, Tegegne DT, Emeru BA, Werid GM.Molecular determination of antimicrobial resistance in Escherichia coliisolated from raw meat in Addis Ababa and Bishoftu, Ethiopia. Ann ClinMicrobiol Antimicrob. 2017;16(1):55. https://doi.org/10.1186/s12941-017-0233-x.
85. Tassew A. Isolation, Identification, Antimicrobial Profile and MolecularCharacterization of Enterohaemorrhagic E. coli O157: H7 Isolated FromRuminants Slaughtered at Debre Zeit ELFORA Export Abattoir and AddisAbaba Abattoirs Enterprise. M. Sc. thesis, Addis Ababa University College ofVeterinary Medicine and Agriculture, Bishoftu, Ethiopia; 2015-08. http://etd.aau.edu.et/handle/123456789/4135.
86. Dulo F, Feleke A, Szonyi B, Fries R, Baumann MP, Grace D. Isolation ofmultidrug-resistant Escherichia coli O157 from goats in the Somali region ofEthiopia: A cross-sectional, Abattoir-Based Study. PLoS One. 2015;10(11):e0142905. https://doi.org/10.1371/journal.pone.0142905.
87. Tegegne HA, Berhanu B, Getachew Y, Serda B, Nölkes D, Tilahun S, et al.Microbiological safety and hygienic quality of camel meat at abattoir andretail houses in Jigjiga City, Ethiopia. J Infect Dev Ctries. 2019;13(3):188–94.https://doi.org/10.3855/jidc.9686.
88. Haileselassie M, Taddele H, Adhana K, Kalayou S. Food safety knowledgeand practices of abattoir and butchery shops and the microbial profile ofmeat in Mekelle City, Ethiopia. Asian Pac J Trop Biomed. 2013;3(5):407–12.https://doi.org/10.1016/S2221-1691(13)60085-4.
89. Sarba EJ, Kelbesa KA, Bayu MD, Gebremedhin EZ, Borena BM, Teshale A.Identification and antimicrobial susceptibility profile of Escherichia coliisolated from backyard chicken in and around ambo, Central Ethiopia. BMCVet Res. 2019;15(1):85. https://doi.org/10.1186/s12917-019-1830-z.
90. Mesele F. Occurrence of Escherichia coli O157:H7 in lactating cows and dairyfarm environment and its antimicrobial susceptibility pattern at adami tulujido kombolcha district, mid rift valley, Ethiopia. M. Sc. thesis, Addis AbabaUniversity College of Veterinary Medicine and Agriculture, Bishoftu, Ethiopia;2018–06. http://etd.aau.edu.et/handle/123456789/12297.
91. Bedasa S, Shiferaw D, Abraha A, Moges T. Occurrence and antimicrobialsusceptibility profile of Escherichia coli O157:H7 from food of animal originin Bishoftu town, Central Ethiopia. Int J Food Contam. 2018;5(2):1–8 https://foodcontaminationjournal.biomedcentral.com/articles/10.1186/s40550-018-0064-3.
92. Garedew L, Berhanu A, Mengesha D, Tsegay G. Identification of gram-negative bacteria from critical control points of raw and pasteurized cowmilk consumed at Gondar town and its suburbs, Ethiopia. BMC PublicHealth. 2012;12(1):950. https://doi.org/10.1186/1471-2458-12-950.
93. Amenu K, Spengler M, Markemann A, Zárate AV. Microbial quality of waterin rural households of Ethiopia: implications for Milk safety and publichealth. J Health Popul Nutr. 2014;32(2):190–7.
94. Assefa A, Regassa F, Ayana D, Amenu K, Abunna F. Prevalence andantibiotic susceptibility pattern of Escherichia coli O157:H7 isolated fromharvested fish at Lake Hayq and Tekeze dam, Northern Ethiopia. Heliyon.2019;5(12):e02996. https://doi.org/10.1016/j.heliyon.2019.e02996.
95. Gebregiorgis A, Tessema TS. Characterization of Escherichia coli isolatedfrom calf diarrhea in and around Kombolcha, south Wollo, Amhara region,Ethiopia. Trop Anim Health Prod. 2016;48(2):273–81. https://doi.org/10.1007/s11250-015-0946-9.
96. Hussen F. Molecular identification for six virulent genes of Escherichia coliisolated from diarrheic calves and their resistance profile to antimicrobials inselected towns of south wollo administrative zone, Amhara, Ethiopia. M. Sc.thesis, Addis Ababa University College Of Health Sciences, Department OfMedical Biochemistry, Addis Ababa, Ethiopia; 2018-10. http://etd.aau.edu.et/handle/123456789/14450.
97. Kahsay AG, Asgedom SW, Weldetinsaa HL. Enteric bacteria, methicillinresistant S. aureus and antimicrobial susceptibility patterns from busessurfaces in Mekelle city, Tigray, Ethiopia. BMC Res Notes. 2019;12(1):337.
98. Aliyi F. 2019 Assesments of hygienic practice, Enumiration and isolation ofSthylococcus Aures and E.coli along camel Milk value chain in Gumbi-Bordode Distirict of Western Hararghe. Haramaya: M. Sc. thesis, HaramayaUniversity college of Veterinary medicine; 2019.
99. Amare A, Worku T, Ashagirie B, Adugna M, Getaneh A, Dagnew M.Bacteriological profile, antimicrobial susceptibility patterns of the isolates
Belina et al. One Health Outlook (2021) 3:19 Page 28 of 30

among street vended foods and hygienic practice of vendors in Gondartown, Northwest Ethiopia: a cross sectional study. BMC Microbiol. 2019;19(1):120. https://doi.org/10.1186/s12866-019-1509-4.
100. Kibret M, Tadesse M. The bacteriological safety and antimicrobialsusceptibility of bacteria isolated from street-vended white lupin (Lupinusalbus) in Bahir Dar, Ethiopia. Ethiop J Health Sci. 2013;23(1):19–26.
101. Alemu G, Mama M, Siraj M. Bacterial contamination of vegetables sold inArba Minch town, Southern Ethiopia. BMC Res Notes. 2018;11(1):775. https://doi.org/10.1186/s13104-018-3889-1.
102. Disassa N, Sibhat B, Mengistu S, Muktar Y, Belina D. Prevalence andAntimicrobial Susceptibility Pattern of E. coli O157:H7 Isolated fromTraditionally Marketed Raw Cow Milk in and around Asosa Town, WesternEthiopia. Vet Med Int. 2017;2017:7581531.
103. Abera T, Legesse Y, Mummed B, Urga B. Bacteriological quality of raw camelmilk along the market value chain in Fafen zone, Ethiopian Somali regionalstate. BMC Res Notes. 2016;9:285.
104. Reta MA, Bereda TW, Alemu AN. Bacterial contaminations of raw cow’s milkconsumed at Jigjiga City of Somali Regional State, Eastern Ethiopia. Int JFood Contam. 2016;3(4) https://link.springer.com/article/10.1186/s40550-016-0027-5.
105. Berhe G, Wasihun AG, Kassaye E, Gebreselasie K. Milk-borne bacterial healthhazards in milk produced for commercial purpose in Tigray, northernEthiopia. BMC Public Health. 2020;20(1):894. https://doi.org/10.1186/s12889-020-09016-6.
106. Beyi AF, Fite AT, Tora E, Tafese A, Genu T, Kaba T, et al. Prevalence andantimicrobial susceptibility of Escherichia coli O157 in beef at butcher shopsand restaurants in Central Ethiopia. BMC Microbiol. 2017;17(1):49. https://doi.org/10.1186/s12866-017-0964-z.
107. Abayneh M, Tesfaw G, Woldemichael K, Yohannis M, Abdissa A. Assessmentof extended-spectrum β-lactamase (ESBLs) - producing Escherichia coli fromminced meat of cattle and swab samples and hygienic status of meatretailer shops in Jimma town, Southwest Ethiopia. BMC Infect Dis. 2019;19(1):897. https://doi.org/10.1186/s12879-019-4554-6.
108. Tassew H, Abdissa A, Beyene G, Gebre-Selassie S. Microbial flora and foodborne pathogens on minced meat and their susceptibility to antimicrobialagents. Ethiop J Health Sci. 2010;20(3):137–43. https://doi.org/10.4314/ejhs.v20i3.69442.
109. Belachew T, Mihret A, Legesse T, Million Y, Desta K. High level of drugresistance by gram-negative bacteria from selected sewage polluted urbanrivers in Addis Ababa, Ethiopia. BMC Res Notes. 2018;11(1):524. https://doi.org/10.1186/s13104-018-3622-0.
110. Moges F, Endris M, Belyhun Y, Worku W. Isolation and characterization ofmultiple drug resistance bacterial pathogens from waste water in hospitaland non-hospital environments, Northwest Ethiopia. BMC Res Notes. 2014;7(1):215. https://doi.org/10.1186/1756-0500-7-215.
111. Kebede A, Kemal J, Alemayehu H, Habte MS. Isolation, identification, andantibiotic susceptibility testing of Salmonella from slaughtered bovines andOvines in Addis Ababa abattoir Enterprise, Ethiopia: A Cross-Sectional Study.Int J Bacteriol. 2016;2016:3714785.
112. Ketema L, Ketema Z, Kiflu B, Alemayehu H, Terefe Y, Ibrahim M, et al.Prevalence and antimicrobial susceptibility profile of Salmonella Serovarsisolated from slaughtered cattle in Addis Ababa, Ethiopia. Biomed Res Int.2018;2018:9794869.
113. Teklu A, Negussie H. Assessment of risk factors and prevalence ofSalmonella in small ruminants and environment in an export abattoir,Modjo, Ethiopia. Am-Eurasian J Agric Environ Sci. 2011;10:992–9 https://www.researchgate.net/publication/235412850.
114. Ejo M, Garedew L, Alebachew Z, Worku W. Prevalence and antimicrobialresistance of Salmonella isolated from animal-origin food items in Gondar,Ethiopia. Biomed Res Int. 2016;2016:4290506.
115. Kiflu B, Alemayehu H, Abdurahaman M, Negash Y, Eguale T. Salmonellaserotypes and their antimicrobial susceptibility in apparently healthy dogsin Addis Ababa, Ethiopia. BMC Vet Res. 2017;13(1):134. https://doi.org/10.1186/s12917-017-1055-y.
116. Bedada TL, Dera FA, Edicho RM, Gebre SG, Asefa YB, Sima WG, et al.Mycological and bacteriological quality and safety of bottled water inEthiopia. Open Microbiol J. 2018;12(1):200–8. https://doi.org/10.2174/1874285801812010200.
117. Yasin M, Ketema T, Bacha K. Physico-chemical and bacteriological quality ofdrinking water of different sources, Jimma zone, Southwest Ethiopia. BMCRes Notes. 2015;8(1):541. https://doi.org/10.1186/s13104-015-1376-5.
118. Eguale T, Engidawork E, Gebreyes WA, Asrat D, Alemayehu H, Medhin G,et al. Fecal prevalence, serotype distribution and antimicrobial resistance ofsalmonellae in dairy cattle in Central Ethiopia. BMC Microbiol. 2016;16(1):20.https://doi.org/10.1186/s12866-016-0638-2.
119. Girma G, Ketema T, Bacha K. Microbial load and safety of paper currenciesfrom some food vendors in Jimma Town, Southwest Ethiopia. BMC ResNotes. 2014;7:843.
120. Abdi RD, Mengstie F, Beyi AF, Beyene T, Waktole H, Mammo B, et al.Determination of the sources and antimicrobial resistance patterns ofSalmonella isolated from the poultry industry in southern Ethiopia. BMCInfect Dis. 2017;17(1):352. https://doi.org/10.1186/s12879-017-2437-2.
121. Taddese D, Tolosa T, Deresa B, Lakow M, Olani A, Shumi E. Antibiogramsand risk factors of Salmonella isolates from laying hens and eggs in Jimmatown, South Western Ethiopia. BMC Res Notes. 2019;12(1):472. https://doi.org/10.1186/s13104-019-4516-5.
122. Garedew L, Hagos Z, Addis Z, Tesfaye R, Zegeye B. Prevalence andantimicrobial susceptibility patterns of Salmonella isolates in associationwith hygienic status from butcher shops in Gondar town, Ethiopia.Antimicrob Resist Infect Control. 2015;4(1):21. https://doi.org/10.1186/s13756-015-0062-7.
123. Schwarzer G, Carpenter JR, Rücker G. Fixed Effect and Random Effects Meta-Analysis. In: Meta-Analysis with R. Use R! Cham: Springer; 2015. https://link.springer.com/chapter/10.1007/978-3-319-21416-0_2.
124. R Core Team. R: A language and environment for statistical computing.Vienna: R Foundation for Statistical Computing; 2020. https://www.R-project.org/
125. WHO. WHO estimates of the global burden of foodborne diseases:foodborne disease burden epidemiology reference group 2007-2015. 2015.ISBN 978 92 4 156516 5. https://www.who.int/foodsafety/publications/foodborne_disease/fergreport/en/
126. Havelaar AH. The public health burden of unsafe foods: a need for globalcommitment. The First FAO/WHO/AU International Food Safety ConferenceAddis Ababa, 12-13 February. 2019. http://www.fao.org/3/CA3056EN/ca3056en.pdf.
127. Gashaw A, Kassu A, Moges F, Tiruneh M, Huruy K. Prevalence of Bacteriaand intestinal parasites among food handlers in Gondar town, NorthwestEthiopia. J Health Popul Nutr. 2008;26:451–5 https://www.researchgate.net/publication/23650530.
128. Taylor LH, Latham SM, Woolhouse ME. Risk factors for human diseaseemergence. Philos Trans R Soc Lond Ser B Biol Sci. 2001;356(1411):983–9.https://doi.org/10.1098/rstb.2001.0888.
129. Foley SL, Lynne AM. Food animal-associated Salmonella challenges:pathogenicity and antimicrobial resistance. J Anim Sci. 2008;86(14 Suppl):E173–87. https://doi.org/10.2527/jas.2007-0447.
130. Doyle ME, Kaspar C, Archer J, Klos R. White Paper on Human Illness Causedby Salmonella from all Food and NonFood Vectors. Foundation for Meat &Poultry Research & Education1150 Connecticut Ave NW, Suite 1200,Washington, DC 20036. 2009: 07-403. http://meatpoultryfoundation.org/research/white-paper-human-illness-caused-salmonella-all-food-and-non-food-vectors
131. Kasimoglu Dogru A, Ayaz ND, Gencay YE. Serotype identification andantimicrobial resistance profiles of Salmonella spp. isolated from chickencarcasses. Trop Anim Health Prod. 2010;42:893–7.
132. Harb A, O’Dea M, Abraham S, Habib I. Childhood Diarrhoea in the easternMediterranean region with special emphasis on non-Typhoidal Salmonellaat the human–food Interface, Pathogens 2019, 8, 60. https://www.mdpi.com/2076-0817/8/2/60, DOI: https://doi.org/10.3390/pathogens8020060
133. Zelalem A, Sisay M, Vipham J, Abegaz K, Kebede A, Terefe Y. The prevalenceand antimicrobial resistance profiles of bacterial isolates from meat andmeat products in Ethiopia: a systematic review and meta-analysis. Int J FoodContam. 2019;6(1) https://app.dimensions.ai/details/publication/pub.1111754874.
134. Healy JM, Bruce BB. Travel-Related Infectious Diseases. Salmonellosis(Nontyphoidal): CDC; 2019. https://wwwnc.cdc.gov/travel/yellowbook/2020/travel-related-infectious-diseases/salmonellosis-nontyphoidal
135. Croxen MA, Law RJ, Scholz R, Keeney KM, Wlodarska M, Finlay BB. Recentadvances in understanding enteric pathogenic E. coli. Clin Microbiol Rev.2013;26(4):822–80. https://doi.org/10.1128/CMR.00022-13.
136. Endale A. Characterization of Diarrheagenic Escherichia coli strains isolatedfrom dairy calves in fiche, Debretsige and Muketuri towns. North Shoa: MSc.
Belina et al. One Health Outlook (2021) 3:19 Page 29 of 30
thesis submitted to school of graduate studies, Addis Ababa University;2018. http://etd.aau.edu.et/handle/123456789/18210.
137. Ayana Z, Yohannis M, Abera Z. Food-borne bacterial diseases in Ethiopia. AcJ Nutrition. 2015;4(1):62–76 https://www.semanticscholar.org/paper/Food-Borne-Bacterial-Diseases-in-Ethiopia-Dibessa-Yohannis/995140933a7f5e6a7f9ef0595b883150ecb31ac4.
138. Denno DM, Keene WE, Hutter CM, Koepsell JK, Patnode M. Flodin-Hursh,et al. tri-county comprehensive assessment of risk factors for sporadicreportable bacterial enteric infection in children. J Infect Dis. 2009;199(4):467–76. https://doi.org/10.1086/596555.
139. Hohmann EL. Nontyphoidal salmonellosis. Clin Infect Dis. 2001;32(2):263–9.https://doi.org/10.1086/318457.
140. Central Statistical Agency (CSA). Ethiopia Demographic and Health Survey2011, Addis Ababa. Retrieved on 17 Feb 2021. https://dhsprogram.com/pubs/pdf/PR10/PR10.pdf
141. Rahman AE, Moinuddin MD, Molla M, Worku A, Hurt L, Kirkwood B, et al.Childhood diarrheal deaths in seven low- and middle-income countries,2014. Available at http://www.who.int/bulletin/volumes/92/9/13-134809/en/.Retrieved on 10 Feb. 2021.
142. Hackshaw A. Small studies: strengths and limitations. Eur Respir J. 2008;32(5):1141–3. https://doi.org/10.1183/09031936.00136408.
143. Nataro JP, Kaper JB. Diarrheagenic Escherichia coli. Clin Microbiol Rev. 1998;11(1):142–201. https://doi.org/10.1128/CMR.11.1.142.
144. Beneduce L, Spano G, Massa S. Escherichia coli O157:H7 generalcharacteristics, isolation and identification techniques. Ann Microbiol. 2003;53(4):511–27 https://www.researchgate.net/publication/228472914_Escherichia_coli_O157H7_general_characteristics_isolation_and_identification_techniques.
145. Abayneh E, Nolkes D, Asrade B. Review on common foodborne pathogensin Ethiopia. Afr J Microbiol Res. 2014;8(53):4027–40 https://academicjournals.org/journal/AJMR/article-abstract/580D1E649725.
146. Abebe E, Gugsa G, Ahmed M. "Review on Major Food-Borne ZoonoticBacterial Pathogens", J Trop Med, 2020, Article ID 4674235, 19 2020. https://www.hindawi.com/journals/jtm/2020/4674235/
147. Gonçalves-Tenório A, Silva BN, Rodrigues V, Cadavez V, Gonzales-Barron U.Prevalence of pathogens in poultry meat: A Meta-analysis of Europeanpublished surveys. Foods. 2018;7(5):69. https://www.readcube.com/articles/10.3390%2Ffoods7050069. https://doi.org/10.3390/foods7050069.
148. Tadesse G, Gebremedhin EZ. Prevalence of Salmonella in raw animalproducts in Ethiopia: a meta-analysis. BMC Res Notes. 2015;8(1):163. https://doi.org/10.1186/s13104-015-1127-7.
149. Assefa A. Prevalence of Escherichia coli O157:H7 in foods of animal origin inEthiopia: A meta-analysis. Cogent Food Agric. 2019;5(1):1–10 https://www.tandfonline.com/doi/full/10.1080/23311932.2019.1642981.
150. Tadesse G, Tessema TS. A meta-analysis of the prevalence of Salmonella infood animals in Ethiopia. BMC Microbiol. 2014;14(1):270. https://doi.org/10.1186/s12866-014-0270-y.
151. Abunna F, Worku H, Gizaw F, Ragassa F, Ayana D, Amenu K, et al.Assessment of post-harvest handling practices, quality and safety of milkand antimicrobial susceptibility profiles of Escherichia coli O157:H7 isolatedfrom milk in and around Asella town, Oromia, Ethiopia. Ann Public HealthRes. 2018;5:1072 https://www.jscimedcentral.com/PublicHealth/publichealth-5-1072.pdf.
152. Tesfay T, Kebede A, Seifu E. Quality and safety of cow milk produced andmarketed in Dire Dawa town, eastern Ethiopia. Int J Integr Sci InnovTechnol. 2013;2:1–5 https://webzoom.freewebs.com/ijiit/130206B01.pdf.
153. Akhtar S, Sarker MR, Hossain A. Microbiological food safety: a dilemma ofdeveloping societies. Crit Rev Microbiol. 2014;40(4):348–59. https://doi.org/10.3109/1040841X.2012.742036.
154. Melaku T. Investigating physicochemical and bacteriological drinking waterquality hygiene and sanitation practices and prevalence of waterbornediseases in selected sites of Bahir Dar City. Diss. 2019; https://ir.bdu.edu.et/handle/123456789/10924.
155. WHO. Guidelines for drinking-water quality. Geneva: World HealthOrganization; 2011. http://apps.who.int/iris/bitstream/handle/10665/44584/9789241548151_eng.pdf?sequence=1
156. Desta K. Physicochemical and bacteriological assessment of drinking waterfrom source to households distribution point in Debereziet town: M.Sc.thesis, Addis Ababa University; 2009. http://etd.aau.edu.et/handle/123456789/5185
157. Tsega N, Sahile S, Kibret M, Abera B. Bacteriological and physicochemicalquality of drinking water in rural community of Ethiopia. Afr Health Sci.2013;13(4):1147–52 https://www.ajol.info/index.php/ahs/article/view/100465.
158. Onyango D, Fascendini M, Wieland B, Ikiror D, Sircely J, Tefera S. One healthpolicy context of Ethiopia, Somalia and Kenya. Nairobi: ILRI; 2019. https://cgspace.cgiar.org/bitstream/handle/10568/106965/One_Health_Policy.pdf?sequence=1&isAllowed=y
Publisher’s NoteSpringer Nature remains neutral with regard to jurisdictional claims inpublished maps and institutional affiliations.
Belina et al. One Health Outlook (2021) 3:19 Page 30 of 30


![Measuring prevalence and risk factors for fall-related injury in ...Secure Site falls prevention into their public health policy frameworks.[3,4,6,7,8,9,10] Epidemiological research](https://img.dokumen.tips/doc/110x75/607c3921a5627145c15fbd50/measuring-prevalence-and-risk-factors-for-fall-related-injury-in-secure-site.jpg)


