Embed Size (px)
Citation preview
ARTICLE
Pressure shock fronts formed by ultra-fast shearcracks in viscoelastic materialsM. Gori 1, V. Rubino 1, A.J. Rosakis1 & N. Lapusta2,3
Spontaneously propagating cracks in solids emit both pressure and shear waves. When a
shear crack propagates faster than the shear wave speed of the material, the coalescence of
the shear wavelets emitted by the near-crack-tip region forms a shock front that significantly
concentrates particle motion. Such a shock front should not be possible for pressure waves,
because cracks should not be able to exceed the pressure wave speed in isotropic linear-
elastic solids. In this study, we present full-field experimental measurements of dynamic
shear cracks in viscoelastic polymers that result in the formation of a pressure shock front, in
addition to the shear one. The apparent violation of classic theories is explained by the strain-
rate-dependent material behavior of polymers, where the crack speed remains below the
highest pressure wave speed prevailing locally around the crack tip. These findings have
important implications for the physics and dynamics of shear cracks such as earthquakes.
DOI: 10.1038/s41467-018-07139-4 OPEN
1 Graduate Aerospace Laboratory (GALCIT), California Institute of Technology, Pasadena CA 91125 California (CA), USA. 2Mechanical and Civil Engineering,California Institute of Technology, Pasadena 91125 CA, USA. 3 Seismological Laboratory, California Institute of Technology, Pasadena CA 91125 California(CA), USA. Correspondence and requests for materials should be addressed to V.R. (email: [email protected])
NATURE COMMUNICATIONS | ���������(2018)�9:4754� | DOI: 10.1038/s41467-018-07139-4 |www.nature.com/naturecommunications 1
1234
5678
90():,;

Shock fronts are sharp discontinuities that arise whenever aperturbing feature, such as a crack traveling through amedium, exceeds the characteristic speed of the waves by
which the energy is transferred in the medium. In such a situa-tion, the waves coalesce into a sharp shock front, as observed inatmospheric supersonic flight, hypersonic re-entry from space,meteoroid transit through the atmosphere, and motion of planetswith respect to the solar wind1–5.
In fracture mechanics and geophysics, shear shock fronts havebeen observed to arise by the coalescence of shear waves emittedby tips of spontaneously propagating shear ruptures exceedingthe shear wave speed of the surrounding material6–9. Theseruptures are commonly referred to as intersonic or supershear.The speed of the spontaneously propagating cracks is a funda-mental problem that has captivated the interest of the scientificcommunity for several decades due to its implications acrossmultiple scientific and engineering disciplines6,9–18. In particular,the study of shear cracks propagating along frictional interfacesand the associated shock fronts is relevant to earthquakedynamics19–22. The formation of the shock fronts is an importantproblem in its own right, due to implications of this phenomenonfor strong ground motion much farther from earthquake-producing faults than currently accounted for in seismichazard6–9,19–21.
Spontaneously propagating cracks are driven by elastodynamicwaves, where the energy released by the crack motion is trans-ferred through the medium to the crack tip region with the(higher) pressure wave speed and (lower) shear wave speed. It isintuitively evident that a crack cannot exceed the fastest way totransfer energy: the pressure wave speed6,10,11,13,14. Hence, theformation of a shock front may appear impossible for the pres-sure waves.
In this study, we provide the first experimental evidence ofspontaneously propagating shear ruptures forming a pressureshock front and explain the formation by the strain-rate-depen-dent—and hence spatially variable—stiffening of the material inthe vicinity of the rupture tip. The presence of the pressure shockfronts enables us to refer to our cracks as supersonic.
ResultsFormation and observation of pressure shock fronts. The pre-sented dynamic shear ruptures are produced in an experimentalset-up developed to mimic earthquakes in the laboratory6,8,9,22(Fig. 1a; see Methods section). The set-up features a quadrilateralspecimen made of a polymeric material—either Poly(methylmethacrylate) (PMMA) or Homalite-100—with an interfaceinclined at an angle α (Fig. 1a). The uniform external load Pvertically applied to the specimen (yellow arrows) results in anormal and a shear static pre-stress acting along the interface.The tests exhibited in Figs. 1 and 2 have been conducted underthe following experimental conditions: P= 21 MPa and α= 30°for PMMA and P= 25 MPa and α= 29° for Homalite-100. Tocheck the repeatability of the experimental outcomes, several testshave been done under nominally the same experimental condi-tions. The ruptures are triggered by the local brief pressure releasedue to the rapid sublimation of a Ni-Cr wire filament placedacross the specimen’s interface turning into plasma. The ruptureinitiation is imposed, but the subsequent crack propagation isspontaneous. This laboratory earthquake set-up has been suc-cessfully employed in the past to study several key rupture phe-nomena including supershear transition to intersonic speeds9,rupture directionality and limiting speeds due to bimaterialeffects23, off-fault damage generation14, pulse-like to crack-liketransitions24, opening of thrust faults25, and friction evolution26.
It is quite challenging to capture the highly dynamic evolutionof these shear ruptures in the laboratory, as they take mere tens ofmicroseconds to span the experimental samples. The full-fieldvisualization of supersonic cracks employed here is enabled byour recently developed dynamic imaging technique26 based on acombination of high-speed photography and digital imagecorrelation (DIC; see Methods section). A sequence of 128high-speed digital images—with temporal sampling of up to twomillion frames per second—is converted into a temporal series ofdisplacement fields by the DIC method, with algorithms tailoredto treat displacement discontinuities along an interface26. Theparticle velocity and strain fields are computed by temporal andspatial differentiation of the displacement fields, respectively. Thestrain-rate maps are obtained by time differentiation of the strainfields. In a set of repeated experiments, an array of four strain-gage stations have been placed along the interface to capture therupture’s arrival time and to confirm the supersonic nature of therupture (Supplementary Fig. 1).
The full-field images of the particle velocity, strain, and strain-rate fields during dynamic ruptures in our experiments exhibittwo pairs of sharp fronts diverging from the rupture tip,associated with the formation of the pressure and shear shockfronts (Fig. 1a, inset; Fig. 2 and Supplementary Fig. 2; andSupplementary Movie 1). The shear shock fronts, occurring whenthe rupture exceeds the shear wave speed, have been observedusing photoelasticity6,8,9,14,22,25, a technique sensitive to sheardeformations. Our newly developed high-speed DIC techniquereveals the additional formation of a pressure shock front. Thepressure shock fronts are most visible in the distribution of thevolumetric strain rate, tr _εð Þ (Fig. 2c, d), whereas the shear shockfronts are most noticeable in the distribution of the shear strainrate, _ε12 (Fig. 2e, f), consistent with the properties of thecorresponding waves.
Confirming the shock nature of the pressure features. How canwe confirm that these features are indeed pressure shock frontsand not some other expression of a pressure wave field that wouldbe present around any crack tip8? As the shock front is theenvelope of coalescing waves, the defining feature of a shock frontis the kinematic relationship that holds among the inclinationangle β of the shock front, the wave speed (either cs or cpdepending on the front), and rupture speed Vr
1,5,7–9:
βs;p ¼ arcsinðcs;p=VrÞ ð1Þ
The inclination angle of the shock front is the angle that thefront forms with the path of the propagating feature, in our casethe specimen's interface.
To verify this relation for the pressure shock fronts, we need tofind the rupture speed, inclination angle, and wave speed of thematerial. We compute the rupture speed Vr from the temporalseries of velocity maps by tracking the rupture tip location alongthe interface at each frame (Fig. 1c and Methods section). Thisleads to the steady rupture speed of Vr= 2.57 km s−1 within thewindow of observation for the experiment with PMMA shown inFigs. 1, 2 (left column), 3 (top inset), Supplementary Figure 2, andSupplementary Movie 1. The inclination angle varies along thepressure shock front (Fig. 2); for the steady rupture speed, thekinematic relation (Eq. 1) would imply that the wave speeds aredecreasing in the interface-normal direction. Such an observationis consistent with the viscoelastic response to spatially variablestrain rates, with the higher strain rates closer to the crack tipleading to more viscoelastic stiffening and hence higher wavespeeds. Indeed, several experimental studies in polymers,
ARTICLE NATURE COMMUNICATIONS | DOI: 10.1038/s41467-018-07139-4
2 NATURE COMMUNICATIONS | ���������(2018)�9:4754� | DOI: 10.1038/s41467-018-07139-4 | www.nature.com/naturecommunications

including PMMA18,27–31 and Homalite-1007,8,27, have accountedfor their viscoelastic nature by considering the specimens as stilluniformly linear elastic but with uniformly altered (stiffer) valuesof elastic constants during their dynamic response. Some of thosestudies29–31 considered two sets of uniform material properties:unstiffened (low-frequency) ones ahead of the rupture arrival andstiffened (high-frequency) ones for the spatial locations along theinterface behind the rupture tip. Several studies6–8,18,27,28,31observed crack tip speeds similar to the ones reported in thiswork but did not recognize their significance, comparing thecrack tip speeds to the uniformly higher dynamic wave speedsand concluding that the cracks are intersonic, a well-knownphenomenon7,8,18,28,31, where pressure shock fronts cannot exist.Our findings emphasize the qualitative importance of theviscoelastic effects in creating the spatially heterogeneous stiffen-ing—due to spatially inhomogeneous strain rates—that has notyet been considered, which is key to the formation of the pressureshock fronts.
DiscussionWe find that the non-uniform stiffening due to viscoelasticeffects, and hence spatially variable wave speeds, can indeedexplain our experimental observations, including the inclinationangles of the pressure shock front observed in our experiments.We use the published data on how strain rates affect the Young’sand shear moduli32–37 (Fig. 3), focusing on the PMMA due to theabundance of available data. We employ the approximation of
quasi-elastic solid38,39 (see Methods section), in which the func-tional form for the material properties is that of a linear-elasticsolid but each effective material constant is assumed to depend onthe local, instantaneous level of the strain rate. As a consequenceof this approximation, the effective wave speeds of the polymersinvestigated here are functions of the strain rate32–37 (Fig. 3).For the areas not yet reached by the crack or waves, the strainrate is near zero; we select the low-strain-rate (LSR) value of_εj j ¼ 10$4 s$1 to represent that regime, and the correspondingpressure and shear wave speeds are cLSRp ¼ 1:79 kms$1 andcLSRs ¼ 0:86 kms$1, respectively (Fig. 3 and Fig. 1c). As Vr > cLSRp
(Fig. 1c), the rupture propagates supersonically with respect tothe effective pressure wave speed of the far field, which experi-ences the LSR conditions. At the crack tip, much higher strainrates—of the order of _εj j ¼ 4 ´ 103 s$1—develop (Fig. 3, bottominset), constituting the high-strain-rate (HSR) regime. The cor-responding effective pressure and shear wave speeds are cHSR
p ¼2:85 kms$1 and cHSR
s ¼ 1:37 kms$1, respectively (Fig. 3 andFig. 1c). Therefore, the rupture propagates intersonically withrespect to the HSR wave speeds (cHSR
s <Vr ¼ 2:57 kms$1<cHSRp ), in
local agreement with basic physics and energy-release-rate ana-lytical models6,10,11,13,14 of rupture growth in linear-elastic solids.At several locations along the pressure shock front (Fig. 3, upperinset, cyan star symbols), the local inclination angle βp is mea-sured to range between 71° and 83° and, based on the relation(Eq. 1), the corresponding values of the local pressure wave speed,
⋅
Field of view
for high-speed DIC
12.5 mm
250 mm
NiCr wire
3
2.5
2
1.5
1
0.5
020 40 60 80 100 120
Rupturepropagation
Shear Mach peakPressureMach peak
3.5
3
2.5
2
1.5
1
0.5
020 40 60 80 100 120
Rup
ture
spe
ed (
km s
–1)
u 1 (m
s–1
)
x1 (mm)
x1 (mm)
·
cpHSR ( ⎢εε ⎢≈ 4 × 10³ s–1)
cpLSR ( ⎢εε ⎢≈ 10–4 s–1)
cSHSR ( ⎢εε ⎢≈ 4 × 10³ s–1)
cSLSR ( ⎢εε ⎢≈ 10–4 s–1)
Interface
Interface
α
x 2 x 1
a b
c
u 1
Fig. 1 Laboratory set-up and the captured ultra-fast shear ruptures. a Dynamic rupture is produced on a sample interface (green-shaded area) loaded incompression and shear by a compressive vertical load (yellow arrows). The rupture is triggered by the sudden disintegration of a Ni-Cr wire filament andsubsequently propagates spontaneously over the interface. Its dynamics is captured using a speckle pattern applied over a portion of the specimen’ssurface, ultra-high-speed photography, and DIC algorithms. The inset exhibits the distribution of interface-parallel particle velocity, _u1, 58 μs afternucleation. The white lines highlight the peaks associated with the pressure and shear shock fronts, and the white circles illustrate how the shear shockfront is generated by the coalescence of shear wavelets. b The profile of the particle velocity, _u1; along the line (violet) at a distance x2=− 27.5 mm fromthe interface, plotted at time intervals of 5 μs, exhibits two peaks associated with the pressure and shear Mach fronts. c The rupture speed vs. positionalong the interface, x1, is computed by tracking the rupture tip in the temporal sequence of velocity maps. The comparison with the pressure wave speedcLSRp for the low strain rates (Fig. 3) confirms the supersonic nature of the rupture, Vr>c
LSRp (see text). At the crack tip, where considerably higher strain
rates develop (Fig. 3, lower inset), the rupture is locally intersonic, cHSRs <Vr<c
HSRp
NATURE COMMUNICATIONS | DOI: 10.1038/s41467-018-07139-4 ARTICLE
NATURE COMMUNICATIONS | ���������(2018)�9:4754� | DOI: 10.1038/s41467-018-07139-4 |www.nature.com/naturecommunications 3
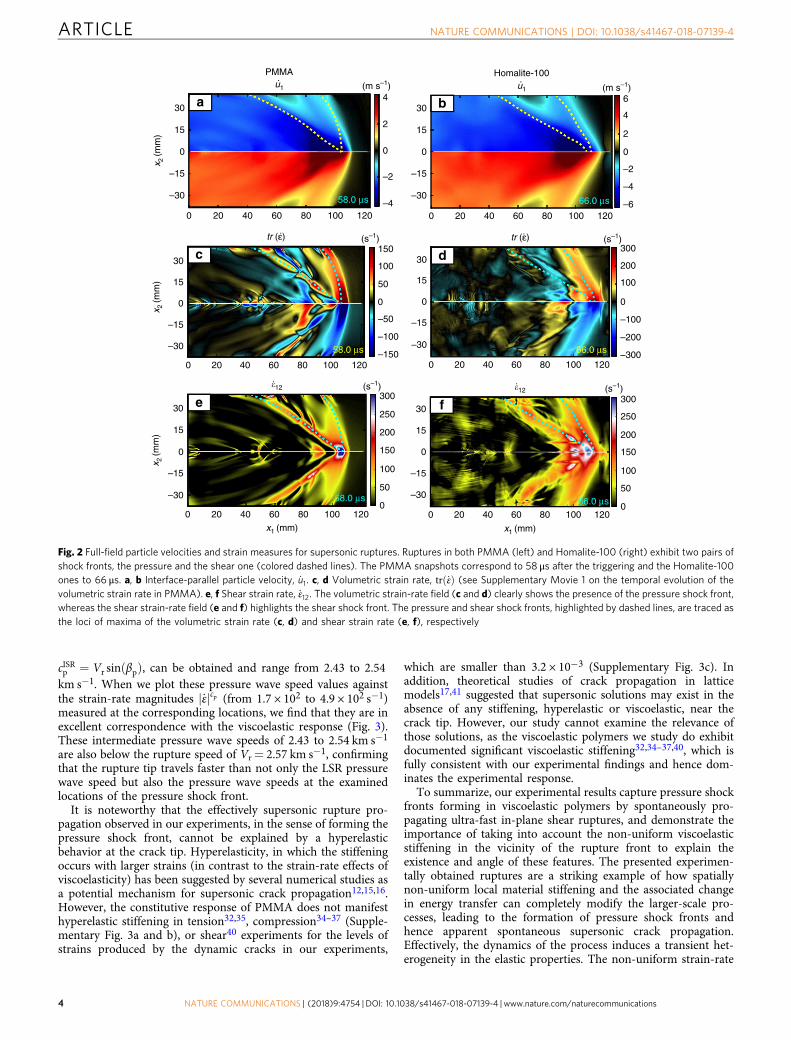
cISRp ¼ Vr sinðβpÞ, can be obtained and range from 2.43 to 2.54km s−1. When we plot these pressure wave speed values againstthe strain-rate magnitudes _εj jcp (from 1.7 × 10² to 4.9 × 10² s−1)measured at the corresponding locations, we find that they are inexcellent correspondence with the viscoelastic response (Fig. 3).These intermediate pressure wave speeds of 2.43 to 2.54 km s−1
are also below the rupture speed of Vr= 2.57 km s−1, confirmingthat the rupture tip travels faster than not only the LSR pressurewave speed but also the pressure wave speeds at the examinedlocations of the pressure shock front.
It is noteworthy that the effectively supersonic rupture pro-pagation observed in our experiments, in the sense of forming thepressure shock front, cannot be explained by a hyperelasticbehavior at the crack tip. Hyperelasticity, in which the stiffeningoccurs with larger strains (in contrast to the strain-rate effects ofviscoelasticity) has been suggested by several numerical studies asa potential mechanism for supersonic crack propagation12,15,16.However, the constitutive response of PMMA does not manifesthyperelastic stiffening in tension32,35, compression34–37 (Supple-mentary Fig. 3a and b), or shear40 experiments for the levels ofstrains produced by the dynamic cracks in our experiments,
which are smaller than 3.2 × 10⁻³ (Supplementary Fig. 3c). Inaddition, theoretical studies of crack propagation in latticemodels17,41 suggested that supersonic solutions may exist in theabsence of any stiffening, hyperelastic or viscoelastic, near thecrack tip. However, our study cannot examine the relevance ofthose solutions, as the viscoelastic polymers we study do exhibitdocumented significant viscoelastic stiffening32,34–37,40, which isfully consistent with our experimental findings and hence dom-inates the experimental response.
To summarize, our experimental results capture pressure shockfronts forming in viscoelastic polymers by spontaneously pro-pagating ultra-fast in-plane shear ruptures, and demonstrate theimportance of taking into account the non-uniform viscoelasticstiffening in the vicinity of the rupture front to explain theexistence and angle of these features. The presented experimen-tally obtained ruptures are a striking example of how spatiallynon-uniform local material stiffening and the associated changein energy transfer can completely modify the larger-scale pro-cesses, leading to the formation of pressure shock fronts andhence apparent spontaneous supersonic crack propagation.Effectively, the dynamics of the process induces a transient het-erogeneity in the elastic properties. The non-uniform strain-rate
30
15
0
–15
–30
x 2 (m
m)
0 20 40 60 80 100 120
. .
tr (ε).
..
tr (ε).
58.0 µs
58.0 µs
66.0 µs
66.0 µs
66.0 µs
58.0 µs
(m s–1)4
2
0
–2
–4
(s–1) (s–1)
(s–1)
30
15
0
–15
–30
x 2 (m
m)
x 2 (m
m)
x1 (mm)x1 (mm)
0 20 40 60 80 100 120
!12 !12(s–1)
30
15
0
–15
–30
0 20 40 60 80 100 120
150
100
50
0
–50
–100
–150
300
250
200
150
100
50
0
PMMAu1·
u1·
Homalite-100
(m s–1)
30
15
0
–15
–30
0 20 40 60 80 100 120
6
4
2
0
–2
–4
–6
30
15
0
–15
–30
0 20 40 60 80 100 120
300
200
100
0
–100
–200
–300
30
15
0
–15
–30
0 20 40 60 80 100 120
300
250
200
150
100
50
0
a
c
b
d
fe
Fig. 2 Full-field particle velocities and strain measures for supersonic ruptures. Ruptures in both PMMA (left) and Homalite-100 (right) exhibit two pairs ofshock fronts, the pressure and the shear one (colored dashed lines). The PMMA snapshots correspond to 58 μs after the triggering and the Homalite-100ones to 66 μs. a, b Interface-parallel particle velocity, _u1. c, d Volumetric strain rate, tr _εð Þ (see Supplementary Movie 1 on the temporal evolution of thevolumetric strain rate in PMMA). e, f Shear strain rate, _ε12. The volumetric strain-rate field (c and d) clearly shows the presence of the pressure shock front,whereas the shear strain-rate field (e and f) highlights the shear shock front. The pressure and shear shock fronts, highlighted by dashed lines, are traced asthe loci of maxima of the volumetric strain rate (c, d) and shear strain rate (e, f), respectively
ARTICLE NATURE COMMUNICATIONS | DOI: 10.1038/s41467-018-07139-4
4 NATURE COMMUNICATIONS | ���������(2018)�9:4754� | DOI: 10.1038/s41467-018-07139-4 | www.nature.com/naturecommunications

fields associated with the rupture tip and the resulting non-uniform viscoelastic stiffening are essential for the formation of apressure shock front, in addition to the shear one. These findingsare important for a number of engineering and geologicalapplications, as they demonstrate how high and non-uniformstrain rates at the crack tip can induce a non-uniform viscoelasticresponse in the materials that may be treated as uniformly linearelastic under many other conditions. It is noteworthy that mostmaterials, including rocks42,43, exhibit viscoelasticity at the high-strain-rate regimes characteristic of rapidly propagating dynamiccracks. In studies of dynamic earthquake ruptures, the mainemphasis so far has been on how high stresses at the rupture tipcan induce damage and hence decrease the effective elasticproperties and wave speeds6,44–46. Our study illustrates thepotential of a significant counter-acting phenomenon in whichthe local elastic properties are transiently increased due to vis-coelastic effects, promoting faster rupture propagation,
potentially all the way to apparently supersonic ruptures withrespect to the wave speeds in most of the bulk.
MethodsLaboratory set-up. The laboratory set-up employed in this study is the describedin details in previous works6,7,9,22,24–26. Our specimen configuration features eithera 200 × 250 × 12.5 mm3 PMMA or a 200 × 200 × 10 mm3 Homalite-100 plate. Thesample is separated into two identical halves by an oblique cut at an angle α (Fig. 1aand Supplementary Fig. 1a). The juxtaposition of these two halves creates aninterface (green-shaded area). In order to obtain repeatable and desired tribologicalconditions, these surfaces are polished to near optical-grade finish and bead-blastedby employing glass particles in the range of 104–211 mm diameter7,26. A uniformload P is vertically applied to the specimen, resulting in a resolved normal (σ0 = Pcos2α) and shear (τ0= P sin α cos α) stress on the interface. Rupture nucleation isobtained by means of the rapid discharge of an electric potential through a0.08 mm Ni-Cr wire filament, placed across the interface (Fig. 1a and Supple-mentary Fig. 1a). Before initiation, electrical charges are accumulated in a capacitorbank in order to achieve a potential of 1.5 (for tests with Homalite-100) to 2 kV(for tests with PMMA). The wire’s rapid sublimation produces a short pressurepulse, inducing the rupture initiation by locally frictionally weakening the interface.In this study, we present three tests conducted on PMMA and one test onHomalite-100. All experiments performed with PMMA have an applied far-fieldload of P= 21MPa; one configuration features an inclination angle of α= 30°(Figs. 1 and 2; Fig. 3, top inset; Supplementary Figs. 2 and 3c; and SupplementaryMovie 1) and the other two are at α= 29° (Fig. 3, bottom inset; and SupplementaryFig. 1). The two tests with α= 29° are used to verify the rupture propagation speed(Supplementary Fig. 1), of whom one configuration employs a smaller imagingwindow in order to achieve higher accuracy with the full-field technique (Fig. 3,bottom inset; and Supplementary Fig. 1a and c); and the other one features an arrayof three strain gauges (Supplementary Fig. 1). The experiment with Homalite-100is characterized by a far-field load of P= 25MPa and an inclination angle of α=29° (Fig. 2, right column). The full-field images of velocity, strain, and strain ratesare obtained by the employment of our dynamic imaging technique based on thecombination of ultra-high-speed photography, DIC algorithms47 and post-processing analysis26. The strain-rate magnitude field is computed from the strain-
rate components as the Frobenius norm of the tensor: _εj j ¼ _εF ¼ffiffiffiffiffiffiffiffi_ε : _ε
p¼
ffiffiffiffiffiffiffiffi_εij _εij
q,
assuming plane-stress conditions.
Wave-speed computation. Effective wave speeds due to viscoelastic stiffening areassumed to be a function of the strain rate, by adopting linear-elastic relations withthe values of elastic moduli dependent on the local level of strain rate. The elasticmodulus of PMMA is tracked as a function of the strain rate using measurementsderived from the literature32,34–37,48–55 (Fig. 3), ranging from quasi-static com-pression tests (10−5 s−1) to highly dynamic conditions (104 s−1). As these mea-surements are from uniaxial tests and they need to be related to the three-dimensional strain-rate fields of our tests, we compute the strain-rate magnitude
from the corresponding tensor as _εj j ¼ffiffiffiffiffiffiffiffi_εij _εij
q. The pressure and shear wave speeds
are then calculated as a function of the strain-rate magnitude using the linear-elastic relations for plane strain with the elastic moduli depending on the specificlevel of strain rate (Fig. 3): cp ¼
ffiffiffiffiffiffiffiffiffiffiffiffiffiffiffiffiffiffiffiffiffiffiffiffiffiffiffiffiffiffiffiffiffiffiffiffiffiffiffiffiffiffiffiffiffiffiffiffiffiffiffiffiffiffiffiffiE 1$ νð Þ= ρ 1þ νð Þ 1$ 2νð Þ½ '
pand
cs ¼ffiffiffiffiffiffiffiffiffiffiffiffiffiffiffiffiffiffiffiffiffiffiffiffiffiffiffiE= 2ρ 1þ νð Þ½ '
p, assuming density ρ= 1180 kg m−3 (measured) and a con-
stant Poisson’s ratio of ν= 0.3535,37. Least-square fits of the wave speeds versusstrain-rate magnitude (Fig. 3, red line) are then used to determine the LSR andHSR wave-speed values discussed in the main text and presented in Fig. 1c andSupplementary Figure 1c. The functional form of the fitted curve is aþ b log _εj jð Þ,where a= 2.24 and b= 5.9 × 10⁻² for the pressure wave speed.
Rupture speed computation. The rupture speed is computed by tracking therupture tip along the interface using the temporal sequence of the full-field images.In analogy with numerical simulations of shear ruptures11,56, we identify therupture tip as the location where the slip velocity exceeds a preset threshold _δth.The slip velocity _δ is obtained from the difference of the _u1 particle velocitycomponent parallel to the interface, immediately above and below it. In our cal-culations, we use _δth ¼ 2:5m s$1 as a threshold for the slip velocity, as it is suffi-ciently above the noise level to avoid spurious oscillations and still well below thepeaks of the slip velocity, which are in the range of 10 to 20 m s−1. Changing thethreshold within ± 1 m s−1 does not produce a substantial difference in the arrivaltimes. Adopting this procedure, the rupture arrival time is identified at eachlocation along the interface and the rupture speed is computed with a second-order-accurate central-difference scheme, using the sequence of locations andrupture arrival times (Fig. 1c and Supplementary Fig. 1c). To validate the rupturespeed obtained from this procedure, we also compute it from the arrival times at aset of three strain-gage measurement locations, each measuring the direct strain inthe direction parallel to the interface, ε11 (Supplementary Fig. 1). In this calculation,we select the threshold of the strain signal to be ε11;th
"" "" ¼ 10$3 (SupplementaryFig. 1b, horizontal dashed line). Two nominally identical experiments have been
Pressure wave speed vs. strain rate
3.5
3
2.5
2
1.5
c p (
km s
–1)
LSR10–4 10–2 100 102 104
HSR
⎪ε⎪ (s–1)
⎪
·
⎪
4
2
0
–2
–4
0 3 6 129 15 18
4000
3000
2000
1000
0
ε·
·ε (s–1)
cpLSR
cpHSR
Vr
30
15
0
–15
–30
0 20 40 60 80 100 120
500
400
300
200
100
0
(s–1)·⏐ ⏐Blumenthal et al. 2002
Chen and cheng 2002Foster et al. 2015Lee and Swallowe 2006Li and Lambros 2001Maiden and Green 1966Moy et al. 2002Mulliken and Boyce 2006Richeton et al. 2005bRicheton et al. 2006Richeton et al. 2007Song and Chen 2004Wu et al. 2004
Fig. 3 Strain-rate dependence of the pressure wave speed in PMMA. Thevalues of the pressure wave speeds cp computed based on the elasticmoduli versus strain-rate data acquired from the literature as reported inthe legend32,34–37,48–55, where the diamond symbols indicate tensile tests,as opposed to the other symbols that indicate compressive tests. The redsolid line is a logarithmic fit of this data (see Methods section). The valuesof cp for several locations along the pressure shock front (cyan stars),predicted from the relation (Eq. 1) between the inclination angles of thepressure shock front and rupture speed, are plotted vs. the strain ratedetermined at those locations. The two sets of pressure wave speeds (fromthe literature and from our experiments) show an excellent agreement,demonstrating that the inclination angles of the pressure shock fronts areconsistent with the viscoelastic stiffening induced. The rupture speed Vr=2.57 km s−1 (dotted black line) is higher than all of those shock-wavedetermined pressure wave speeds, indicating that the rupture is supersonicwith respect to them. The high-strain-rate (HSR) pressure wave speed,corresponding to the strain rate of about 4 × 10³ s−1 at the crack tip (theblue region in the bottom inset), is determined as the wave speed on thelogarithmic fit (red line) that corresponds to that strain rate (green star).The strain-rate level at the crack tip is obtained from a similar testperformed on a sample at an angle α= 29° (rather than 30°) under thesame loading conditions, by focusing on a smaller field of view, whichenables a higher strain-rate resolution (lower inset). The low-strain-rate(LSR) pressure wave speed (see Discussion section) corresponds to thepurple star. The green and purple vertical dashed lines refer to theequivalent strain-rate levels for these near-field and far-fieldmeasurements, and the corresponding predicted values of the pressurewave speeds are indicated by the horizontal green and purple dashed lines
NATURE COMMUNICATIONS | DOI: 10.1038/s41467-018-07139-4 ARTICLE
NATURE COMMUNICATIONS | ���������(2018)�9:4754� | DOI: 10.1038/s41467-018-07139-4 |www.nature.com/naturecommunications 5

conducted on PMMA, under a far-field load of P= 21MPa and an inclinationangle of α= 29°. The rupture speed has been measured using either the DICtechnique (employing a small field of view) or the strain gages (SupplementaryFig. 1). (Strain measurements by DIC and strain gages cannot be performedsimultaneously in our experiments, as the high-power flash illumination, requiredfor the high-speed image acquisition26,57, releases a strong electro-magnetic pulsethat interferes with the strain gages, compromising their ability to measure physicalstrains.) The electric discharge, delivered to the Ni-Cr wire for triggering, alsoinduces an electro-magnetic pulse that last several tens of microseconds. Thisdisturbance produces spurious oscillations that overlap with the strain signals, inparticular in the proximity of the wire notch (Supplementary Fig. 1a and b).However, the main features associated with rupture propagation are still clearlyidentifiable and allow precise rupture arrival time calculations, the results of whichare in excellent agreement with the DIC ones (Supplementary Fig. 1c).
Data availabilityData supporting the findings of this study are available from the correspondingauthor upon request.
Received: 31 May 2018 Accepted: 15 October 2018
References1. Liepmann, H. W. & Roshko, A. Elements of Gasdynamics. (Courier
Corporation, 1957).2. Decker, R. et al. Voyager 1 in the foreshock, termination shock, and
heliosheath. Science 309, (2020–2024 (2005).3. Dougherty, M. et al. Cassini magnetometer observations during Saturn orbit
insertion. Science 307, 1266–1270 (2005).4. Fisk, L. A. Journey into the unknown beyond. Science 309, 2016–2017 (2005).5. Anderson Jr, J. D. Fundamentals of Aerodynamics. (Tata McGraw-Hill
Education, 2010).6. Rosakis, A. J., Xia, K., Lykotrafitis, G. & Kanamori, H. in Treatise in
Geophysics. 2nd edn, Vol. 4, pp 183–213 (Elsevier, Amsterdam, 2007).7. Mello, M., Bhat, H., Rosakis, A. & Kanamori, H. Identifying the unique
ground motion signatures of supershear earthquakes: theory and experiments.Tectonophysics 493, 297–326 (2010).
8. Mello, M., Bhat, H. S. & Rosakis, A. J. Spatiotemporal properties of sub-Rayleigh and supershear rupture velocity fields: theory and experiments. J.Mech. Phys. Solids 93, 153–181 (2016).
9. Xia, K., Rosakis, A. J. & Kanamori, H. Laboratory earthquakes: the sub-Rayleigh-to-supershear rupture transition. Science 303, 1859–1861 (2004).
10. Freund, L. B. Dynamic Fracture Mechanics (Cambridge Univ. Press, 1998).11. Needleman, A. An analysis of intersonic crack growth under shear loading. J.
Appl. Mech. 66, 847–857 (1999).12. Abraham, F. F. & Gao, H. How fast can cracks propagate? Phys. Rev. Lett. 84,
3113–3113 (2000).13. Rice, J. R. New Perspectives on Crack and Fault Dynamics. (Springer, 2001).14. Rosakis, A. J. Intersonic shear cracks and fault ruptures. Adv. Phys. 51,
1189–1257 (2002).15. Abraham, F. F. et al. Simulating materials failure by using up to one billion
atoms and the world’s fastest computer: Brittle fracture. Proc. Natl Acad. Sci.USA 99, 5777–5782 (2002).
16. Buehler, M. J., Abraham, F. F. & Gao, H. Hyperelasticity governs dynamicfracture at a critical length scale. Nature 426, 141–146 (2003).
17. Marder, M. Supersonic rupture of rubber. J. Mech. Phys. Solids 54, 491–532(2006).
18. Fineberg, J. & Bouchbinder, E. Recent developments in dynamic fracture:some perspectives. Int. J. Fract. 196, 33–57 (2015).
19. Bouchon, M. & Vallée, M. Observation of long supershear rupture during themagnitude 8.1 Kunlunshan earthquake. Science 301, 824–826 (2003).
20. Dunham, E. M., Favreau, P. & Carlson, J. M. A supershear transitionmechanism for cracks. Science 299, 1557–1559 (2003).
21. Ellsworth, W. et al. Near-field ground motion of the 2002 Denali fault, Alaska,earthquake recorded at pump station 10. Earthq. Spectra 20, 597–615 (2004).
22. Mello, M., Bhat, H. S., Rosakis, A. J. & Kanamori, H. Reproducing thesupershear portion of the 2002 Denali earthquake rupture in laboratory. EarthPlanet. Sci. Lett. 387, 89–96 (2014).
23. Xia, K., Rosakis, A. J., Kanamori, H. & Rice, J. R. Laboratory earthquakesalong inhomogeneous faults: directionality and supershear. Science 308,681–684 (2005).
24. Lu, X., Lapusta, N. & Rosakis, A. J. Pulse-like and crack-like ruptures inexperiments mimicking crustal earthquakes. Proc. Natl Acad. Sci. USA 104,18931–18936 (2007).
25. Gabuchian, V., Rosakis, A. J., Bhat, H. S., Madariaga, R. & Kanamori, H.Experimental evidence that thrust earthquake ruptures might open faults.Nature 545, 336–339 (2017).
26. Rubino, V., Rosakis, A. J. & Lapusta, N. Understanding dynamic frictionthrough spontaneously evolving laboratory earthquakes. Nat. Commun. 1–12,https://doi.org/10.1038/ncomms15991 (2017).
27. Rosakis, A. J., Samudrala, O., Singh, R. P. & Shukla, A. Intersonic crackpropagation in bimaterial systems. J. Mech. Phys. Solids 46, 1789–1814 (1998).
28. Ben-David, O., Cohen, G. & Fineberg, J. The dynamics of the onset offrictional slip. Science 330, 211–214 (2010).
29. Svetlizky, I. & Fineberg, J. Classical shear cracks drive the onset of dryfrictional motion. Nature 509, 205 (2014).
30. Bayart, E., Svetlizky, I. & Fineberg, J. Slippery but tough: the rapid fracture oflubricated frictional interfaces. Phys. Rev. Lett. 116, 194301 (2016).
31. Svetlizky, I., Bayart, E., Cohen, G. & Fineberg, J. Frictional resistance withinthe wake of frictional rupture fronts. Phys. Rev. Lett. 118, 234301 (2017).
32. Wu, H., Ma, G. & Xia, Y. Experimental study of tensile properties of PMMA atintermediate strain rate. Mater. Lett. 58, 3681–3685 (2004).
33. Singh, R. P. & Parameswaran, V. An experimental investigation of dynamiccrack propagation in a brittle material reinforced with a ductile layer. Opt.Laser Eng. 40, 289–306 (2003).
34. Richeton, J., Schlatter, G., Vecchio, K. S., Rémond, Y. & Ahzi, S. A unifiedmodel for stiffness modulus of amorphous polymers across transitiontemperatures and strain rates. Polymer (Guildf.). 46, 8194–8201 (2005).
35. Mulliken, A. D. & Boyce, M. C. Mechanics of the rate-dependent elastic--plastic deformation of glassy polymers from low to high strain rates. Int. J.Solids Struct. 43, 1331–1356 (2006).
36. Lee, S. & Swallowe, G. Quasi-static and dynamic compressive behaviour ofpoly (methyl methacrylate) and polystyrene at temperatures from 293 K to363 K. J. Mater. Sci. 41, 6280–6289 (2006).
37. Richeton, J., Ahzi, S., Vecchio, K. S., Jiang, F. C. & Makradi, A. Modeling andvalidation of the large deformation inelastic response of amorphous polymersover a wide range of temperatures and strain rates. Int. J. Solids Struct. 44,7938–7954 (2007).
38. Schapery, R. A. A method of viscoelastic stress analysis using elastic solutions.J. Frankl. Inst. 279, 268–289 (1965).
39. Knauss, W. & Zhu, W. Nonlinearly viscoelastic behavior of polycarbonate. I.Response under pure shear. Mech. Time Depend. Mater. 6, 231–269 (2002).
40. Fleck, N. A., Stronge, W. J. & Liu, J. H. High strain-rate shear response ofpolycarbonate and polymethyl methacrylate. Proc. R. Soc. Lond. A Mater. 429,459–479 (1990).
41. Guozden, T. M., Jagla, E. A. & Marder, M. Supersonic cracks in lattice models.Int. J. Fract. 162, 107–125 (2010).
42. Zhang, Q. & Zhao, J. A review of dynamic experimental techniques andmechanical behaviour of rock materials. Rock. Mech. Rock. Eng. 47,1411–1478 (2014).
43. Qiao, L., Li, M., Li, Q. & Li, Y. A strain rate dependent damage viscoelasticmodel for granite. EJGE 21 (2016).
44. Ben‐Zion, Y. Collective behavior of earthquakes and faults: continuum‐discrete transitions, progressive evolutionary changes, and different dynamicregimes. Rev. Geophys. 46 (2008).
45. Cochran, E. S. et al. Seismic and geodetic evidence for extensive, long-livedfault damage zones. Geology 37, 315–318 (2009).
46. Heap, M., Faulkner, D., Meredith, P. & Vinciguerra, S. Elastic modulievolution and accompanying stress changes with increasing crack damage:implications for stress changes around fault zones and volcanoes duringdeformation. Geophys. J. Int. 183, 225–236 (2010).
47. Sutton, M. A., Orteu, J. J. & Schreier, H. Image Correlation for Shape, Motionand Deformation Measurements: Basic Concepts, Theory and Applications(Springer Science & Business Media, 2009).
48. Maiden, C. & Green, S. Compressive strain-rate tests on six selected materialsat strain rates from 10− 3 to 104 in/in/sec. J. Appl. Mech. 33, 496–504 (1966).
49. Li, Z. & Lambros, J. Strain rate effects on the thermomechanical behavior ofpolymers. Int. J. Solids Struct. 38, 3549–3562 (2001).
50. Chen, W., Lu, F. & Cheng, M. Tension and compression tests of two polymersunder quasi-static and dynamic loading. Polym. Test. 21, 113–121 (2002).
51. Blumenthal, W. R. et al. Influence of temperature and strain rate on thecompressive behavior of PMMA and polycarbonate polymers. AIP Conf. Proc.620, 665–668 (2002).
52. Moy, P., Weerasooriya, T., Chen, W. & Hsieh, A. Dynamic stress-strainresponse and failure behavior of PMMA. In ASME 2003 InternationalMechanical Engineering Congress and Exposition 105–109 (Applied Mechanicsand Biomedical Technology, Washington, DC, USA, 15–21 November 2003).
53. Song, B. & Chen, W. Loading and unloading split Hopkinson pressure barpulse-shaping techniques for dynamic hysteretic loops. Exp. Mech. 44,622–627 (2004).
54. Richeton, J., Ahzi, S., Vecchio, K., Jiang, F. & Adharapurapu, R. Influence oftemperature and strain rate on the mechanical behavior of three amorphous
ARTICLE NATURE COMMUNICATIONS | DOI: 10.1038/s41467-018-07139-4
6 NATURE COMMUNICATIONS | ���������(2018)�9:4754� | DOI: 10.1038/s41467-018-07139-4 | www.nature.com/naturecommunications

polymers: characterization and modeling of the compressive yield stress. Int. J.Solids Struct. 43, 2318–2335 (2006).
55. Foster, M., Love, B., Kaste, R. & Moy, P. The rate dependent tensile responseof polycarbonate and poly-methylmethacrylate. J. Dyn. Behav. Mater. 1,162–175 (2015).
56. Liu, Y. & Lapusta, N. Transition of mode II cracks from sub-Rayleigh tointersonic speeds in the presence of favorable heterogeneity. J. Mech. Phys.Solids 56, 25–50 (2008).
57. Xing, H. Z., Zhang, Q. B., Braithwaite, C. H., Pan, B. & Zhao, J. High-speedphotography and digital optical measurement techniques for geomaterials:fundamentals and applications. Rock Mech. Rock Eng. 50, 1611–1659 (2017).
AcknowledgementsThis study was supported by the US National Science Foundation (NSF) (grant EAR1321655 and EAR-1651235), the US Geological Survey (USGS) (grant G16AP00106),and the Southern California Earthquake Center (SCEC), contribution number 6276.SCEC is funded by NSF Cooperative Agreement EAR-1033462 and USGS CooperativeAgreement G12AC20038. We thank Drs Ravichandran and Knauss for helpfuldiscussions.
Author contributionsM.G., V.R., A.J.R., and N.L. contributed to developing the main ideas, interpreting theresults, and producing the manuscript. M.G. and V.R. performed the measurements onPMMA and Homalite-100, respectively. V.R. contributed in overseeing the experimentalwork.
Additional informationSupplementary Information accompanies this paper at https://doi.org/10.1038/s41467-018-07139-4.
Competing interests: The authors declare no competing interests.
Reprints and permission information is available online at http://npg.nature.com/reprintsandpermissions/
Publisher’s note: Springer Nature remains neutral with regard to jurisdictional claims inpublished maps and institutional affiliations.
Open Access This article is licensed under a Creative CommonsAttribution 4.0 International License, which permits use, sharing,
adaptation, distribution and reproduction in any medium or format, as long as you giveappropriate credit to the original author(s) and the source, provide a link to the CreativeCommons license, and indicate if changes were made. The images or other third partymaterial in this article are included in the article’s Creative Commons license, unlessindicated otherwise in a credit line to the material. If material is not included in thearticle’s Creative Commons license and your intended use is not permitted by statutoryregulation or exceeds the permitted use, you will need to obtain permission directly fromthe copyright holder. To view a copy of this license, visit http://creativecommons.org/licenses/by/4.0/.
© The Author(s) 2018
NATURE COMMUNICATIONS | DOI: 10.1038/s41467-018-07139-4 ARTICLE
NATURE COMMUNICATIONS | ���������(2018)�9:4754� | DOI: 10.1038/s41467-018-07139-4 |www.nature.com/naturecommunications 7