Embed Size (px)
Citation preview

Pressure changes associated with the ascent and bursting ofgas slugs in liquid-¢lled vertical and inclined conduits
M.R. James a;�, S.J. Lane a, B. Chouet b, J.S. Gilbert a
a Department of Environmental Science, Institute of Environmental and Natural Sciences, Lancaster University,Lancaster LA1 4YQ, UK
b U.S.G.S., 345 Middle¢eld Road, MS 910, Menlo Park, CA 94025, USA
Received 9 August 2002; received in revised form 3 October 2002; accepted 21 November 2002
Abstract
At basaltic volcanoes, the sources of long-period and very-long-period seismicity and acoustic signals arefrequently described in terms of fluid dynamic processes, in particular the formation and ascent of gas slugs within themagma column and their bursting at the surface. To investigate pressure changes associated with these processes, two-phase flow experiments have been carried out in vertical and inclined pipes with both single gas slugs and acontinuously supplied gas phase. The ascent of individual gas slugs is accompanied by strong dynamic pressurevariations resulting from the flow of liquid around the slug. These dynamic transients generate sub-static pressuresbelow the ascending slug in viscosity-controlled systems, and produce super-static pressures when the slug reaches thesurface and motion ceases in inertia-dominated systems. Conduit inclination promotes a change of regime frombubbly to slug flow and favours an increase in size and velocity of the slugs at the expense of their frequency ofoccurrence during continuously supplied two-phase flow. The experimental pressure data support previous theoreticalanalyses of oscillatory sources in ascending slugs as the slugs approach the surface and burst. Pressure oscillations arealso observed during the release of gas slugs and in their wake region.1 2003 Elsevier B.V. All rights reserved.
Keywords: Strombolian-type eruptions; very-long-period seismicity; slug £ow; pressure oscillations
1. Introduction
As commonly observed at Kilauea, Stromboli,and Etna volcanoes, the separation of exsolvinggases from low-viscosity magmas can result indistinct styles of volcanic activity. These represent
the surface expressions of di¡erent two-phase(magma and gas) £ow regimes within the conduit,with Hawaiian eruptions being the result of annu-lar £ow and Strombolian eruptions representingthe bursting of large individual gas bubbles. Asthe repeatability of many long-period (LP, 0.2^2 s)and very-long-period (VLP, 2^100 s) seismicevents recorded at basaltic volcanoes suggest,they have non-destructive, £uid dynamic sources(Chouet, 1988; Chouet et al., 1994; Neuberg etal., 1994; Chouet, 1996; Chouet et al., 1997,1999; Ripepe and Gordeev, 1999; Ripepe et al.,
0377-0273 / 03 / $ ^ see front matter 1 2003 Elsevier B.V. All rights reserved.doi:10.1016/S0377-0273(03)00232-4
* Corresponding author. Tel. : +44-(0)1524-65201;Fax: +44-(0)1524-593985.
E-mail addresses: [email protected] (M.R. James),[email protected] (S.J. Lane), [email protected](B. Chouet), [email protected] (J.S. Gilbert).
VOLGEO 2669 20-11-03
Journal of Volcanology and Geothermal Research 129 (2004) 61^82
R
Available online at www.sciencedirect.com
www.elsevier.com/locate/jvolgeores

2001; Chouet et al., 2002; Konstantinou, 2002).An understanding of these processes is becomingincreasingly important. LP events are commonlybelieved to represent the result of resonatingsource regions (Chouet, 1988, 1992, 1996; Kuma-gai and Chouet, 1999) whereas VLP events areattributed to the wholesale movement of liquid(Arciniega-Ceballos et al., 1999; Nishimura etal., 2000; Kumagai et al., 2001; Chouet et al.,2002). In this study, we carry out pressure mea-surements on two-phase laboratory £ows in pipesto gain further insights into how large ascendingbubbles can act as sources of seismic and acousticenergy.At Stromboli, both tremor and eruption seismic
signals have been associated with bubble coales-cence and rise (Chouet et al., 1997, 1999; Ripepeand Gordeev, 1999; Ripepe et al., 2001; Chouetet al., 2002), and infrasonic acoustic measure-ments have been modelled with processes associ-ated with bubbles bursting at the surface of thelava column (Vergniolle and Brandeis, 1996; Ri-pepe and Gordeev, 1999). Recent work on VLPseismic data from Stromboli points to highly re-peatable source mechanisms associated with ex-plosions (Chouet et al., 1999, 2002). The locationsof these sources, o¡set from directly under thevent region, suggest a conduit inclined roughly30‡ from the vertical, rising from a depth of about200 m below the surface (Chouet et al., 2002). Theinclination of the conduit has implications notonly for the stability of the £ow regimes likelyto occur within it, but also for the details ofhow these £ow regimes are expressed. Accord-ingly, the experiments described here were carriedout in both vertical and inclined tubes in order toinvestigate the dependence of £ow patterns ontube inclination and quantify the resulting pres-sure £uctuations within the £ow.Engineering applications such as transport
pipelines and bubble column reactors have drivena comprehensive literature on two-phase (gas^liq-uid) £ows in pipes, although much work remainsto be done to achieve full understanding of thecomplexities of the £uid dynamics involved (Joshi,2001). A considerable amount of this literaturedescribes details of the slug £ow regime (believedto be responsible for Strombolian eruptions
(Blackburn et al., 1976; Seyfried and Freundt,2000) at basaltic volcanoes) in which large bub-bles with diameters approaching that of the pipe,rise within a continuous liquid phase. In engineer-ing, this regime is usually described by using theterms ‘Taylor bubble’ for the gas phase and ‘liq-uid slug’ for the connected, liquid phase. How-ever, we retain here the terminology commonlyused in the volcanology literature (Jaupart andVergniolle, 1989; Seyfried and Freundt, 2000; Ri-pepe et al., 2001) and by Clift et al. (1978), inwhich the gas phase is referred to as the slug.Detailed two-phase £ow studies have focused onthe bubbly to slug £ow regime transition (Legiuset al., 1997; Cheng et al., 1998; Krussenberg etal., 2000), slug ascent velocity (Nicklin et al.,1962; White and Beardmore, 1962; Zukoski,1966; Wallis, 1969; Seyfried and Freundt, 2000;Shosho and Ryan, 2001), coalescence of slugs(Shemer and Barnea, 1987; Pinto and Campos,1996), and the documentation of slug shapes (Go-pal and Jepson, 1998; Polonsky et al., 1999a;Seyfried and Freundt, 2000) and liquid £ow pat-terns around slugs (Kawaji et al., 1997; Polonskyet al., 1999b; Bugg and Saad, 2002).Three dimensionless parameters are required to
compare gas slugs rising buoyantly in liquid-¢lledtubes in di¡erent systems (White and Beardmore,1962). These are the Froude number:
Fr ¼ UoffiffiffiffiffiffiffigD
p ð1Þ
Morton number:
Mo ¼ gW 4
bc3 ð2Þ
and Eo«tvo«s number:
Eo ¼ bgD2
c
ð3Þ
where Uo represents the terminal ascent velocityof the slug, g is the gravitational acceleration con-stant, D is the internal diameter of the tube, andW, b, and c are the viscosity, density, and surfacetension of the liquid, respectively. Within thespace de¢ned by these parameters there exists aregion within which viscous and surface tensionforces are trivial (White and Beardmore, 1962). In
VOLGEO 2669 20-11-03
M.R. James et al. / Journal of Volcanology and Geothermal Research 129 (2004) 61^8262

this region, bounded by Mo6 1036 and Eos 100(White and Beardmore, 1962), slugs are inertiallycontrolled and rise at their maximum velocity invertical tubes, given by Fr=0.35. Zukoski (1966)demonstrated that slugs rising in inclined tubescan exceed this velocity by up to V80%.In basaltic systems with vertical conduits, typi-
cal ranges of these parameters are 0.16Fr6 0.35,1056Eo6 107, and 1056Mo6 1010, assuming506W6 500 Pa s, b=2600 kg m33 and c=0.4N m31 for basalt, and 16D6 10 m for the con-duit (Seyfried and Freundt, 2000). These rangesindicate that gas slugs ascend within a transitionalregime with a velocity dependent on slug volumeand liquid viscosity. When Eos 100, the surfacetension plays little role in determining the slugascent velocity (Wallis, 1969). In the experimentsdescribed here, D=0.038 m, 0.166Uo 6 0.33 ms31, 0.0016W6 0.9 Pa s, and cW0.07 N m31,which place the £ows within the inertial andtransitional regimes with 0.266Fr6 0.54,2006Eo6 270, and 103116Mo6 14 (Table 1).As the diameter of our laboratory-scale pipe dic-tates a much smaller Eo«tvo«s number than in ba-saltic systems, surface e¡ects will be enhanced inour experiments, but should not represent a con-trolling factor.To assess the importance of viscous e¡ects, a
dimensionless inverse viscosity:
Nf ¼ Eo3
Mo
� �14 ¼ bD
32g
12
W
ð4Þ
may also be considered (Fabre and Line¤, 1992), inwhich the viscous regime is given by Nf 6 2, andinviscid approximations are appropriate forNf s 300. For the parameters given above for abasaltic system, 166Nf 6 5000 while, in our lab-oratory £ows, 346Nf 6 30 000. It is worth noting
that in the inviscid case, where slugs are inertiallycontrolled, the condition Fr=0.35 implies that Nf
becomes proportional to the Reynolds number,Re, de¢ned as Re= bUD/W. Reynolds numbersfor slugs in our experiments vary between V10and 104. For a basaltic system and assuming slugrise velocities of order 1 m s31, 56Re6 103.Therefore, our experiments cover relevant re-gimes, with end members under inertial controland approaching viscous control. Processes sug-gested by our pressure measurements shouldtherefore be scalable to basaltic systems.
2. Apparatus
Our experiments were carried out using a tubeof borosilicate glass with internal diameter of 38mm (Fig. 1). In experiments with vertical tubes,the apparatus was suspended from its top endusing a rubber bicycle inner tube to isolate thetube from external vibrations. In experimentswith inclined tubes, the bicycle inner tube wasdisconnected from the top of the tube and loopedthrough a chain attached at two di¡erent pointsalong the tube. Pressure sensors were mounted inthe base of and at various intervals along the ex-perimental tube with the sensor inlets set £ushwith the inside surface of the tube. Two di¡erenttypes of pressure sensor were used, namely BOCEdwards Active Strain Gauges (ASGs) and Hon-eywell di¡erential pressure sensors 163PC01D75(163PCs). The ASG pressure sensor has a fre-quency range of d.c. to V1 kHz and an absoluteaccuracy of S 400 Pa. The 163PC sensor measuresthe di¡erence of pressure between the ‘wet’ sens-ing inlet and pressure outside the tube (i.e. atmo-spheric pressure), and has a dynamic range ofS 800 Pa and quoted response time of 1 ms. How-
Table 1Typical values of dimensionless constants for slug ascent in vertical tubes during the experiments
Experimental liquid Viscosity Dimensionless number Observed control
(Pa s) Fr Mo Eo Nf Re
Water 0.001 0.35 (0.54) 10311 200 104 V104 inertialSugar 1 0.09 0.29 (0.47) 1033 250 320 95 (145) transitionalSugar 2 0.9 0.26 (0.33) 14 270 34 9 (11) viscous
Where they di¡er signi¢cantly, typical values for tubes inclined at 40‡ are given between parentheses.
VOLGEO 2669 20-11-03
M.R. James et al. / Journal of Volcanology and Geothermal Research 129 (2004) 61^82 63

ever, unexplained phase di¡erences observed insome of the data recovered from these sensorsat frequencies higher than 100 Hz (possibly result-ing from slight contamination of the semi-con-ducting sensing wafer) suggest that a slower re-sponse time of 0.01 s may better characterisesuch transducers. A microphone AKG CK 77WR, with £at response between 200 and 10 kHz
(31 db at 100 Hz, 38 db at 30 Hz), was also usedto record acoustic signals above the liquid col-umn.Output voltages from the sensors were logged
at a sampling rate of 5 kHz with 16-bit resolutionusing a National Instruments DAQ board in aPC. Experiments were also recorded with a digitalvideo camera (Canon DM-XL1 in FRAMEmode) synchronised to the pressure data by in-cluding an LED binary counter (incremented bythe scan clock of the logging board) within the¢eld of view. Using a shutter speed of 1/1000 s,the digital images could be correlated to the sen-sor data with an accuracy of S 5 data points(1 ms).Two di¡erent kinds of experiments were carried
out, in which air was the gas phase and sugar^water solutions were used for the liquid phase.Tap water was used as the lowest-viscosity liquid(0.001 Pa s). To obtain more viscous liquids,white cane sugar was dissolved in tap water toproduce solutions with viscosities of 0.09 and0.9 Pa s, and densities of 1250 and 1320 kgm33, respectively (Table 1). The rise of singlegas slugs was investigated in the three liquidsover a range of tube inclinations. Gas slugs wereproduced by using a gate made of either a Te£onor copper sheet set in a joint located 20 cm abovethe base of the tube (Fig. 1). The upper portion ofthe tube was then ¢lled with liquid up to a heightof about 2 m, leaving the lower section dry. Rapidremoval of the gate released the gas slug. To min-imise oscillations of the liquid column inducedduring release of the slug, the gas section waspressurised to hydrostatic pressure prior to slugrelease. Unfortunately, di⁄culties in producing aperfectly gas-tight seal at the gate (particularlywhen the tube was inclined) made it di⁄cult tocompletely eliminate such transient oscillations.The nominal mass of gas in a slug was 0.3 g.Further experiments were carried out in which
a constant supply of gas was injected via either awooden or ceramic bubbler (¢sh tank aerators) atthe base of the tube, and pressure changes weremeasured during the continuous rise of the bub-bles and developing gas slugs produced in thatmanner. These experiments were conducted overa range of tube inclinations and two liquid viscos-
Fig. 1. Experimental apparatus consisting of a 2.5-m-longliquid-¢lled glass tube. (a) Apparatus setup. Pressure sensors(ASG transducers) are located along the tube, and smaller-range 163PC di¡erential pressure transducers are set up closeto or just above the liquid surface. A removable gate is usedfor slug generation during single slug experiments. This gateis omitted during continuous gas-supply experiments, duringwhich gas enters the liquid column from a bubbler set in thebase of the tube. (b) Tube mounting con¢gurations. In ex-periments carried out with a vertical tube, the tube is sus-pended from a concrete ceiling using rubber tubing (rt). Inexperiments with inclined tubes, the tubing is connected to achain (ch), which is attached at two di¡erent points to theexperimental tube. The angle of the tube is varied by alteringthe length of chain on either side of the suspension pointand the tube is tilted counterclockwise within the plane ofthe sketch shown in (a), so that transducers ASG 3, ASG 4,and 163PC2 are located on the upper wall of the tube.
VOLGEO 2669 20-11-03
M.R. James et al. / Journal of Volcanology and Geothermal Research 129 (2004) 61^8264

ities (0.001 and 0.09 Pa s). The pressurised gaswas provided by a regulated air cylinder to min-imise oscillations generated by the source.
3. Experiments with single gas slugs
Characteristic pressure changes induced duringthe ascent of individual gas slugs were observed inall our experiments. The behaviour of the pressure£uctuations was found to depend on both the liq-
Fig. 2. Pressure changes recorded by the ASG sensors duringthe ascent of a gas slug or rise of a buoyant £oat. (a) Abso-lute pressures recorded during the ascent of a slug in liquidwith a viscosity of 0.9 Pa s. Pressure equalisation of the slugwas carried out before slug release. The slope of the ASG 1data before slug release is the result of gas loss from the slugsource caused by a slightly leaky gate, however, the slug wasstill slightly above static pressure when it was released asshown by the relatively large pressure drop. The oscillationsnear 7 s are caused by vibrations of the apparatus and liquidcolumn triggered at the withdrawal of the gate retaining theslug. Upon reaching the surface of the liquid near 19 s, theslug bursts, leaving the upper sensors (ASG 5 and 6) no lon-ger immersed in liquid. (b) Results obtained for a slug underatmospheric pressure released in a liquid with viscosity of0.001 Pa s. Note that the individual pressure traces are la-belled on both the left- and right-hand side of the plot.Without pressure equalisation, the vertical oscillations of theliquid column induced by the release of the slug are responsi-ble for the large dynamic pressures recorded. With the excep-tion of ASG 1 located at the base of the tube beneath theslug, the maximum amplitude of pressure oscillations, indi-cated by the grey line with symbols and measured by theright-hand scale, is directly proportional to the pressuretransducer depth. The pressure changes recorded during theslug ascent and bursting in (a) are clari¢ed in (c), where thestatic pressure immediately after slug release has been sub-tracted from the data of each sensor. As the slug ascendsand expands, sensors above it detect an increased pressuredue to the increasing head of water. Sensors below the slugdetect a gradually decreasing pressure due to the increasingmagnitude of dynamic losses in the £owing liquid around theexpanding slug. After the slug bursts, a gradual £ow of liq-uid returns the pressure values to their new static pressures(which are lower than the initial static pressures due to thevolume below the gate now being occupied by liquid). Forcomparison with (c), the data shown in (d) represent the as-cent of an incompressible £oat in the same liquid (0.9 Pa s).These data demonstrate the absence of the pressure changesassociated with the expansion of the slug as it ascends thetube.
VOLGEO 2669 20-11-03
M.R. James et al. / Journal of Volcanology and Geothermal Research 129 (2004) 61^82 65

uid viscosity and tube inclination. In order todemonstrate the main features of the pressurechanges recorded, Fig. 2a shows the ASG datafrom an experiment carried out with a verticaltube and a liquid viscosity of 0.9 Pa s. Thesedata represent absolute pressures, therefore theiro¡sets are representative of the di¡erent heads ofliquid above individual sensors. At 0 s the datarepresent the hydrostatic pressure at each sensorbefore the slug is released, and at 25 s the datare£ect the decreased hydrostatic pressures afterthe slug has burst. During intermediate times,the pressure data represent the contributionsfrom both hydrostatic pressure and dynamic pres-sure variations associated with liquid movements.These pressure changes, and variations in themdue to liquid viscosity and tube inclination, arediscussed below for the time intervals includingthe slug release, slug rise, slug approaching thesurface, and slug bursting.
3.1. Slug release
The transient oscillations detected near 7 s (Fig.2a) are due to vibrations of the apparatus andwater column induced during slug release. Pres-sure equalisation of the gas slug was carried outbefore its release, therefore static pressures mea-sured above the slug do not change rapidly andthese transients mainly re£ect the accelerations ofthe apparatus and liquid column induced by thephysical removal of the gate. Several experimentswere also carried out during which the gas wasleft at atmospheric pressure before release. Datacollected during these experiments displayedmuch larger pressure oscillations (Fig. 2b) in-duced by the water column bouncing on the gasslug after its release. These dynamic pressure os-cillations re£ect the acceleration of the liquid col-umn, as demonstrated by the increasing magni-tude of pressure oscillation with increasingsensor depth (shown by the grey line and symbolsin Fig. 2b). At the base of the column, the pres-sure increase required to accelerate all the liquidabove it must be signi¢cantly larger than the pres-sure increase measured near the surface of theliquid, where only a small amount of pressure isrequired to accelerate a comparatively smaller
mass of liquid. Above the slug and in a liquidof constant density, just as the hydrostatic pres-sure is proportional to depth, the amplitudes ofdynamic pressure oscillations are also proportion-al to depth. Below the slug, in contrast with hy-drostatic pressure, amplitudes are constant withdepth. With a greater liquid viscosity, the oscilla-tion amplitude would be reduced from thoseshown in Fig. 2b due to the smaller accelerationsof the liquid.
3.2. Slug ascent
After the removal of the gate, the slug rises pastthe pressure sensors, which sequentially detect apressure drop as a result of the decreased massabove them (Fig. 2a). The roughly linear pressuredrop recorded during the interval 12^19 s by sen-sors ASG 2^5 marks the passage of the body ofthe slug past each transducer. However, as indi-cated by the subsequent pressure increase back tohydrostatic when the slug bursts near 19 s, someof the pressure drop must also re£ect a dynamice¡ect associated with the liquid £owing aroundthe gas slug. The pressure increase near 19 s re-£ects the termination of this dynamic e¡ect andgradual slumping of the liquid ¢lm from aroundthe sides of the burst bubble, back to the top ofthe liquid column.Dynamic e¡ects are more obvious in Fig. 2c,
where the initial hydrostatic pressure immediatelyfollowing slug release has been subtracted fromthe data. These results show the pressure changesdetected by each sensor during slug ascent andslug burst. A steady pressure increase is detectedbefore the slug reaches a transducer, and a gentlepressure decrease is observed after the slug hascompletely passed by the transducer. Finally, thepressure increases again after the slug has burst atthe surface of the liquid. Final static pressures arelower than those recorded at the beginning of theexperiment, re£ecting the lower level of liquid inthe tube as the liquid now ¢lls the volume origi-nally occupied by gas below the gate.As the gas slug rises in the tube, it expands in
response to the decreasing static pressure it expe-riences (Polonsky et al., 1999a; Seyfried andFreundt, 2000). Consequently, the surface of the
VOLGEO 2669 20-11-03
M.R. James et al. / Journal of Volcanology and Geothermal Research 129 (2004) 61^8266

water column must rise and the pressure sensorsabove the slug detect the increased water headabove them. This results in a steady increase ofpressure before the slug reaches a transducer (Fig.2c). Following the passage of the slug past thetransducer (indicated by the sharp pressure de-crease), the pressure measured by this sensor con-tinues to gradually decrease until the slug burstsat the surface. This non-intuitive behaviour is theresult of dynamic losses within the £uid ¢lm £ow-ing past the sides of the rising slug due to theliquid viscosity. As the slug ascends and expands,the increasing slug length increases the magnitudeof this e¡ect, which manifests itself in the gradualpressure decreases measured below the slug (Fig.2c).These interpretations are supported by the data
in Fig. 2d, which show results obtained in an ex-periment in which the gas slug was replaced by anincompressible £oat (a 101-mm-long cylinder witha diameter of 31 mm and mass of 10.5 g). Theresults in Fig. 2d are qualitatively similar to thosein Fig. 2c, but lack the subtle pressure changesassociated with the expansion of a rising gas
slug. For example, sharp pressure decreases areobserved as the £oat passes each sensor, and pres-sure increases are seen in association with thecessation of liquid £ow after the £oat has reachedthe surface. However, the gradual pressurechanges due to increasing liquid head and increas-ing slug length are not present.Detailed observations of the pressure changes
immediately behind ascending slugs show thatthe wake region varies with liquid viscosity. Vis-ual observations indicate that slugs rising in waterare trailed by a turbulent wake containing manyentrained small bubbles. In this case, the shape ofthe slug base is constantly changing. This wakee¡ect is demonstrated in the pressure data illus-trated in Fig. 3. In a liquid with viscosity of 0.001Pa s, the passage of the slug is followed by a shortinterval of low pressure. Pressure oscillations ob-served within this low-pressure interval re£ect theturbulent nature of the bubble wake. In contrast,no low-pressure interval is detected behind slugsrising in a 0.9-Pa-s liquid. In a liquid of intermedi-ate viscosity (0.09 Pa s), the transient pressuredecrease is still observed but the pressure oscilla-tions are absent.
Fig. 4. Dependence of the slug ascent velocity on tube incli-nation and liquid viscosity. The velocity is given in dimen-sionless form by the Froude number. The solid curve showsthe empirical ¢t obtained by Zukoski (1966) for slugs ascend-ing in vertical and inclined tubes ¢lled with an inviscid liq-uid. The results from our 0.001 and 0.09 Pa s solutions aresimilar, indicating that slugs in our experiments were risingclose to this inertial regime. Velocities are considerably re-duced in a 0.9-Pa-s solution, suggesting that viscosity is in-creasingly controlling slug ascent in higher-viscosity liquids.The inertial maximum of Fr=0.35 for vertical tubes (Whiteand Beardmore, 1962) is indicated by the dashed line.
Fig. 3. Pressure changes observed in the wakes of slugs as-cending in liquids of di¡erent viscosities. In tap water (0.001Pa s), the wake immediately behind the slug (expanded inthe inset box) shows a low-pressure signal lasting V400 msand representing a length scale of V2.3D. During this inter-val, pressure oscillations are measured in coincidence withthe visually observed turbulent nature of the slug wake. In asugar solution with viscosity of 0.09 Pa s, the reduced pres-sure region is still present, however, no oscillations are de-tected. In a sugar solution with viscosity of 0.9 Pa s, the re-duced pressure region and oscillations are both absent. For aliquid at this viscosity, the wake region is not observed to beturbulent.
VOLGEO 2669 20-11-03
M.R. James et al. / Journal of Volcanology and Geothermal Research 129 (2004) 61^82 67

Slug ascent velocities were determined fromvideo records. Measurements were made in thetop 30 cm of the tube, and the results are repre-sented by Froude numbers for di¡erent tube in-clinations and liquid viscosities (Fig. 4). The scat-ter in the data displayed in Fig. 4 primarilyre£ects the fact that the apparatus was not opti-mised for velocity measurements. In particular,the pressure sensor mounting brackets obscuredsections of the tube, thus reducing the area ofthe video frames available for analysis. Despitesuch limitations, our data are found to be com-
parable with previously published results (Zuko-ski, 1966) and are presented here to illustrate theirdependence on conduit inclination. For liquid vis-cosities of 0.001 and 0.09 Pa s (with Nf =30 000and 340, respectively), the di¡erence in viscositydoes not appear to a¡ect the velocity results,which lie close to the empirical curve of Zukoski(1966) and demonstrate velocity increases ofup to 50% in inclined tubes. Ascent velocitiesin a liquid with viscosity of 0.9 Pa s (Nf =34)are signi¢cantly lower, pointing to the increasingimportance of viscous drag for values of Nf low-
Fig. 5. Pressure oscillations detected as a slug approaches the liquid surface. (a) Data for vertical tubes. Increasing oscillation am-plitudes are observed in the 163PC data above the slug only in a low-viscosity (0.001 Pa s) liquid (only 163PC 1 data shown).(b) Raw pressure data (lower trace), and band-pass ¢ltered (7^100 Hz band) pressure (upper trace). The spectrogram (0.2-s win-dow sliding in increments of 0.02 s across the record) shows the frequency increase detected as the slug approaches the surface.The white line superimposed on the spectrogram represents the frequency of longitudinal oscillations of the gas slug estimatedfrom Eq. 7, see text). (c) Data for tubes inclined at 40‡. The more pronounced oscillations are believed to be an experimental ar-tefact. The increasing oscillation amplitudes seen in (a) as the slug approaches the surface are not observed in this case. Note thesmall pressure spike in front of the slug on the upper wall of the tube (163PC 2 data).
VOLGEO 2669 20-11-03
M.R. James et al. / Journal of Volcanology and Geothermal Research 129 (2004) 61^8268
er than those included in the Zukoski (1966)curve.
3.3. Slug approaching the liquid surface
Low-amplitude pressure oscillations were fre-quently observed as the slug approached the sur-face. Fig. 5a illustrates oscillations detected infront of the nose of a slug in water (0.001 Pa s).The top panel in Fig. 5b shows the data of Fig. 5aafter ¢ltering with a 7^100-Hz band-pass ¢lter.The oscillations show a marked frequency in-crease as the front of the bubble approaches andpasses by the transducer. No similar oscillationswere detected in higher-viscosity liquids in verticaltubes (Fig. 5a) or in inclined tubes (Fig. 5c),although their detection may have been hamperedby higher levels of background oscillations in thelatter experiments. The source of the backgroundoscillations is unknown, but the fact that thesewere observed only in inclined tubes and couldpersist even after a slug had burst, suggests thatthey were probably not directly related to slugascent. Background oscillations were absent priorto slug release and we surmise these may representan experimental artefact associated with the re-moval of the gate and the apparatus suspensionsystem for inclined tubes.The data in Fig. 5c illustrate the spatial distri-
bution of pressure in front of the bubble in in-clined tubes. The pressure sensor located near thetop of the tube (sensor 163PC 2 in Fig. 1) re-corded pressure spikes before the noses of passingslugs. These spikes represent dynamic pressurechanges associated with the movement of the liq-uid out of the path of the slug. The spike duration(V150 ms in 0.001-Pa-s liquid) suggests that thepressure transient originates within a short dis-tance (V1D) in front of the slug, in agreementwith previous calculations and measurements ofthe liquid velocity ¢eld ahead of a gas slug (Po-lonsky et al., 1999a; Bugg and Saad, 2002).
3.4. Slug burst
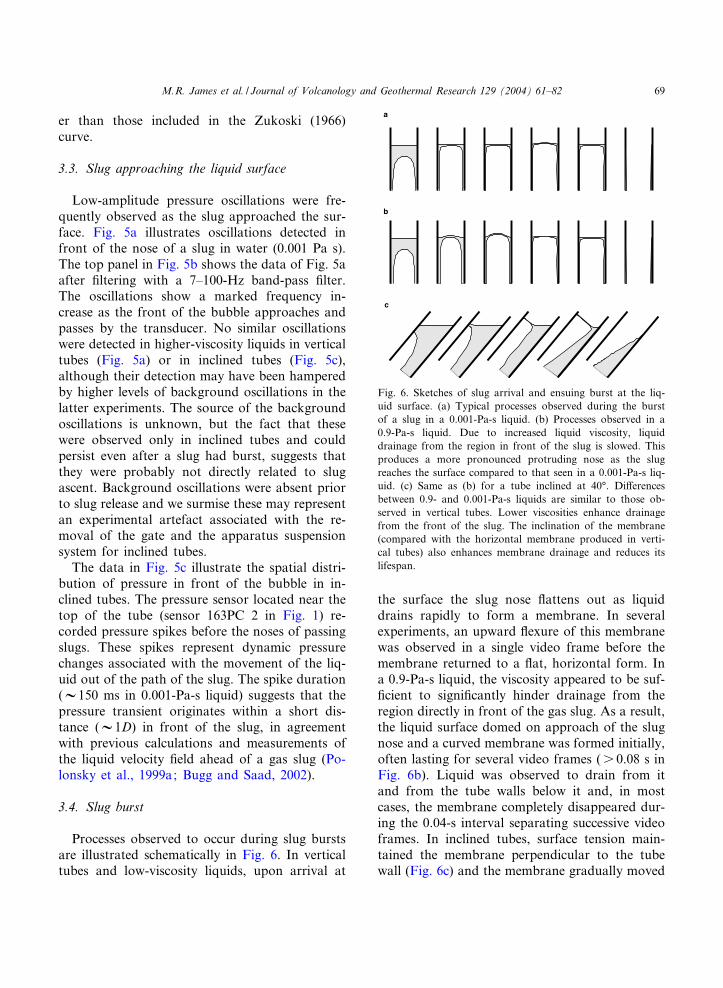
Processes observed to occur during slug burstsare illustrated schematically in Fig. 6. In verticaltubes and low-viscosity liquids, upon arrival at
the surface the slug nose £attens out as liquiddrains rapidly to form a membrane. In severalexperiments, an upward £exure of this membranewas observed in a single video frame before themembrane returned to a £at, horizontal form. Ina 0.9-Pa-s liquid, the viscosity appeared to be suf-¢cient to signi¢cantly hinder drainage from theregion directly in front of the gas slug. As a result,the liquid surface domed on approach of the slugnose and a curved membrane was formed initially,often lasting for several video frames (s 0.08 s inFig. 6b). Liquid was observed to drain from itand from the tube walls below it and, in mostcases, the membrane completely disappeared dur-ing the 0.04-s interval separating successive videoframes. In inclined tubes, surface tension main-tained the membrane perpendicular to the tubewall (Fig. 6c) and the membrane gradually moved
Fig. 6. Sketches of slug arrival and ensuing burst at the liq-uid surface. (a) Typical processes observed during the burstof a slug in a 0.001-Pa-s liquid. (b) Processes observed in a0.9-Pa-s liquid. Due to increased liquid viscosity, liquiddrainage from the region in front of the slug is slowed. Thisproduces a more pronounced protruding nose as the slugreaches the surface compared to that seen in a 0.001-Pa-s liq-uid. (c) Same as (b) for a tube inclined at 40‡. Di¡erencesbetween 0.9- and 0.001-Pa-s liquids are similar to those ob-served in vertical tubes. Lower viscosities enhance drainagefrom the front of the slug. The inclination of the membrane(compared with the horizontal membrane produced in verti-cal tubes) also enhances membrane drainage and reduces itslifespan.
VOLGEO 2669 20-11-03
M.R. James et al. / Journal of Volcanology and Geothermal Research 129 (2004) 61^82 69

upward as the liquid drained past the body of theslug. The membrane inclination enhanced £uiddrainage from it so that full-tube width mem-branes were seldom observed in inclined tubes.
Fig. 8. Pressure changes measured at the base of the experi-mental tube (at transducer ASG 1 located V2 m below theliquid surface) during the bursting of gas slugs. The data areshown for di¡erent liquid viscosities and tube inclinations.Each trace has been o¡set vertically and horizontally forclarity. The arrival of the slug at the surface coincides withthe step-like pressure increase in each trace. The shapes ofthe pressure signals induced as the slug reaches the surface,range from smooth large-amplitude pressure increases in ver-tical tubes and high-viscosity liquids (due to the gradualslumping of the liquid coating the walls of the tube), tosharp smaller-amplitude pressure spikes in inclined tubes andlow-viscosity liquids (due to the termination of dynamic pro-cesses). (b) Maximum amplitude of the sub-static pressuremeasured at ASG 1 (i.e. the di¡erence between the pressurerecorded just prior to the slug arriving at the surface and thepressure recorded at the end of the experiment), plotted fora range of tube angles and three liquid viscosities.
Fig. 7. Pressure changes measured near the liquid surfaceduring the bursting of a slug. The pressure (163PC, left-handaxis) and microphone data (black, horizontal trace, centredon 0 Pa in the right-hand scale) are shown together with vid-eo observations for slugs bursting in 0.001-Pa-s (a) and 0.9-Pa-s (b) liquids. Representative frequencies are labelled, in-cluding frequencies near 100 Hz associated with longitudinalwave resonance of the air column in the open end of the ex-perimental tube. Ticks on the top horizontal axis mark thetiming of individual video frames. In (a), the frequencies ofpressure oscillations detected by transducers 163PC 1 (blacktrace) and 163PC 2 (grey trace) are observed to increase asthe slug reaches the surface (see also Fig. 5b). The oscilla-tions are detected by the microphone as they approach itssensitivity range and the air column is stimulated into reso-nance. The sudden onset of frequencies s 500 Hz is attrib-uted to the production and oscillation of a membrane at thesurface. The second burst of acoustic energy is attributed to£uid sloshing at the base of the bubble after the membranehas burst. No oscillations are observed in the more viscous£uid in (b). The small steps in the 163PC data in (b) are be-lieved to represent the bursting of the bubble. These steps al-ways appear within V80 ms prior to the last observation ofthe top membrane.
VOLGEO 2669 20-11-03
M.R. James et al. / Journal of Volcanology and Geothermal Research 129 (2004) 61^8270

Pressure oscillations were detected by the mi-crophone and 163PC sensors during the genera-tion and destruction of the membrane. Oscillationamplitudes were largest in low-viscosity liquids,and appeared to be heavily damped in higher-vis-cosity liquids. Fig. 7a shows the 163PC and mi-crophone data recorded during a slug burst in avertical tube ¢lled with a 0.001-Pa-s viscosity liq-uid. The low-frequency oscillations discussed inthe previous section can be observed in the163PC data as the slug nose approaches the sur-face. The oscillation frequency increases up toabout 100 Hz as a domed membrane brie£y formsand oscillations begin to be picked up by the mi-crophone. As the membrane £attens, the micro-phone picks up higher frequencies in the range540^680 Hz attributed to oscillations of the mem-brane itself. These higher frequencies, however,were often swamped by stronger signals with fre-quencies near 100 Hz (Fig. 7a) attributed toacoustic resonance of the air column in the openend of the tube. No oscillations were detected ina similar experiment carried out with a 0.9-Pa-s
liquid (Fig. 7b), suggesting an overdamped sys-tem.The steps in the 163PC data in Fig. 7b are
believed to be related to the bursting of the mem-brane. In experiments carried out with dyed waterto increase the visibility of the liquid, the pressuresteps always occurred within the two frames (0.08s) preceding the observed disappearance of themeniscus ring surrounding the membrane. Ac-cordingly, we interpret the pressure drop as result-ing from the initial bursting of the membrane,which releases the small surface tension pressureremaining in the expanded slug. The time delaybefore the disappearance of the meniscus ringtherefore re£ects the time required to completelycollapse the membrane and drain the meniscusring. In experiments with water in vertical tubes,the pressure steps ranged between 5 and 7 Pa,close to the 7-Pa excess pressure calculated for a£at bubble top surface pulled downward by sur-face tension. Smaller pressure steps were mea-sured in experiments conducted with water in in-clined tubes (near 4 Pa in a tube inclined at 45‡)
Fig. 9. Examples of £ow regimes observed during continuously supplied two-phase £ow. (a) Bubbly £ow. (b) Transitional £ow.(c) Slug £ow. The images are obtained at di¡erent magni¢cations, but each represents a view of the same tube with external di-ameter of 4 cm.
VOLGEO 2669 20-11-03
M.R. James et al. / Journal of Volcanology and Geothermal Research 129 (2004) 61^82 71

and larger steps were observed for higher-viscosityliquids (V18 Pa in a 0.9-Pa-s liquid), suggestingthat there may also be a pressure contribution dueto the non-negligible mass of liquid in the mem-brane. If this is assumed to account for V11 Pain the 0.9-Pa-s liquid, then the implied membranethickness would be V1 mm, a reasonable valuefor a liquid with this viscosity.Pressure changes were also recorded by the
ASG sensors along the tube during the burstingof slugs at the liquid surface (Fig. 2a,c), with thesharp onset of the pressure increases coincidingwith the nose of the slug arriving at the surfaceof the liquid. The shape of the pressure signal wasobserved to vary with both liquid viscosity andtube angle. The pressure signals (Fig. 8a) rangefrom a large-magnitude, smoothly increasing pres-sure in high-viscosity liquids in vertical tubes, torelatively smaller, sharp pulses in low-viscosityliquids in inclined tubes. The diversity of pressurewaveforms between these extremes is illustrated inthe middle panel of Fig. 8a for a range of tubeinclinations and ¢xed liquid viscosity of 0.09 Pa s.In all experiments, a sub-static pressure was re-corded during slug ascent, followed by a return tohydrostatic pressure after the slug had burst. Themaximum magnitudes of the sub-static pressuresrecorded are shown in Fig. 8b.The large magnitudes of the pressure changes
observed in high-viscosity liquids in vertical tubesre£ect the relative importance of dynamic lossesin the liquid ¢lm around the gas slug as it ascends.The high liquid viscosity also prevents rapiddrainage of this ¢lm, resulting in a slow andsmooth pressure increase after the slug burst(Figs. 2a,c and 8a). In inclined tubes, the gasslug is concentrated against the upper wall ofthe tube, e¡ectively increasing the thickness ofthe liquid ¢lm which £ows past below the slug.As a result, dynamic losses due to the liquid vis-cosity are decreased in this region of £ow (due todecreased liquid velocities) and drainage after theslug burst is more rapid. This accounts for thesmaller magnitudes and decreased durations ofthe pressure increases observed in a 0.9-Pa-s liq-uid in a tube inclined at 40‡ (Fig. 8a).Only a very small overall pressure increase is
observed in low-viscosity liquids. This minimal
increase re£ects the small dynamic losses due toviscosity in the £owing liquid. Superimposed onthis increase, however, is a V400-Pa pressurepulse, which exceeds hydrostatic pressure andtherefore cannot be the result of a static e¡ect.We interpret this pulse as re£ecting the suddencollapse of the liquid velocity ¢eld in front ofthe slug upon its arrival at the surface of the liq-uid. During slug ascent, volume conservation re-quires that the liquid immediately ahead of theslug must accelerate downward to £ow past theslug. This annular liquid ¢lm must then decelerate
Fig. 10. Results of gas-volume fraction measurements carriedout during continuous gas supply experiments. (a) Gas-vol-ume fractions measured over a range of tube inclinations forliquid viscosities of 0.001 and 0.09 Pa s. (b) Data from simi-lar experiments carried out with a coarser bubbler. Di¡erent£ow regimes are indicated by dashed lines (bubbly £ow),dotted lines (transitional £ow), and bold lines (slug £ow).The open symbols show the overall results obtained when asurface foam layer is present and is included in the gas-vol-ume fraction calculation. The foam is taken into account byadding the thickness of foam to the height of the liquid sur-face measured during the £ow.
VOLGEO 2669 20-11-03
M.R. James et al. / Journal of Volcanology and Geothermal Research 129 (2004) 61^8272

back to stationary below the slug. For a slug withascent velocity U and radius rs, the volume £ux isZrs
2U, corresponding to a downwards £owing liq-uid mass £ux of bZrs
2U. If the slug occupiesV90% of the cross-sectional area of the tube,the liquid ¢lm must accelerate up to 10U, e¡ec-tively inducing a reaction force of 10bZrs
2U2
(mass £uxUvelocity change) on the stationary liq-uid above the slug.To decelerate this liquid back to stationary, a
force with the same magnitude but opposite direc-tion is required. Neglecting viscous dissipationand considering only liquid inertia, the down-ward-£owing annular ¢lm exerts this force onthe stationary liquid below the slug. During slugascent, these equal and opposite forces above andbelow the slug cancel each other out, however,when the slug reaches the surface, the force abovethe slug disappears shortly before the force decel-erating the liquid below the slug. Over the cross-
sectional area of the tube this translates into apressure pulse with magnitude 40bU2(rs/D)2. Forwater (1000 kg m33) and a slug velocity of V0.2m s31, this yields 360 Pa.We believe that the agreement between this es-
timate and the data shown in Fig. 8a providesstrong support for the viability of such mecha-nism in the generation of the super-static pressurespikes recorded at the arrival of inertial slugs atthe liquid surface. The only other process capableof generating pressures larger than static is the jetrecoil from the bursting slug. However, the super-static pressures measured in the slugs were ob-served to be small (Fig. 7), indicating that jetrecoil has a negligible e¡ect in our experiments.
4. Experiments with a continuous supply of gas
Experiments in which gas was supplied contin-
Fig. 11. ASG and microphone data recorded during continuous gas supply experiments with water (0.001 Pa s). (a) Verticaltube. (b) Tube inclined at 40‡. Ramps in the ASG data indicate the approach and passage of gas slugs past the sensors.
VOLGEO 2669 20-11-03
M.R. James et al. / Journal of Volcanology and Geothermal Research 129 (2004) 61^82 73

uously to the base of the liquid column were onlycarried out with two di¡erent solutions, namelytap water (0.001 Pa s) and a sugar solution witha viscosity of 0.09 Pa s. At higher viscosities, thebubblers used could not produce small dispersedbubbles, but generated only large, slug-like bub-bles. Therefore, the transition between bubbly andslug £ow was not investigated in the 0.9-Pa-s so-lution with the apparatus available for these ex-periments.
4.1. Flow regimes
A series of experiments were carried out over arange of tube inclinations and gas-supply rates toinvestigate the dependence of £ow regime andaverage gas-volume fraction on these parameters.An average gas-volume fraction was calculatedfrom the average height of the liquid surface mea-
sured during two-phase £ow compared to theheight of the liquid surface measured duringzero gas £ux. Bubbly, transitional, and slug £owregimes were observed over a range of gas £uxesof 0.3^5 l min31 (either measured at, or calibratedto atmospheric pressure). These regimes wereidenti¢ed by visual observation and typical exam-ples are illustrated in Fig. 9. The bubbly regime ischaracterised by small, well dispersed ascendingbubbles with a relatively narrow size distribution(Fig. 9a). The transitional regime is marked bythe appearance of bubble clusters and consider-ably larger bubbles resulting from coalescence ofsmaller bubbles (Fig. 9b). In other studies, theonset of the transitional regime has been identi¢edby the presence of a bimodal bubble size distribu-tion suggestive of bubble coalescence (Krussen-berg et al., 2000). The slug £ow regime is charac-terised by larger bubbles with diameters similar to
Fig. 12. ASG and microphone data recorded during continuous gas supply experiments with a sugar solution (0.09 Pa s). (a) Ver-tical tube. (b) Tube inclined at 40‡. The time delays (6 0.5 s) between individual peaks in the sawtooth signals recorded by ASG6 and the corresponding onsets of acoustic signals recorded by the microphone are measures of the times taken by the noses ofindividual slugs to travel from the depth of ASG 6 to the surface of the liquid.
VOLGEO 2669 20-11-03
M.R. James et al. / Journal of Volcanology and Geothermal Research 129 (2004) 61^8274

that of the con¢ning tube. These bubbles are lon-ger than they are wide (Fig. 9c).Fig. 10 shows the average gas-volume fraction
measured as a function of gas £ux and tube in-clination. The gas-volume fraction decreases withincreasing tube inclination (Fig. 10a). The e¡ect isstronger in a low-viscosity (0.001 Pa s) liquid thanfor a higher-viscosity (0.09 Pa s) liquid. In theseexperiments, the £ow regimes were dominantlyslug £ows, with some transitional and bubbly£ows at the lowest gas £uxes. Fig. 10b showssimilar data for a 0.09-Pa-s sugar solution aeratedwith a coarser ceramic bubbler to demonstrate£ow regime transitions. The coarser bubblerproved more e⁄cient at producing bubbles inhigher-viscosity liquids and in generating en-hanced regions of bubbly £ow. Di¡erent £ow re-gimes are indicated by the dashed, dotted, andbold lines in Fig. 10b. The production of a foamyhead was also observed at some £ow rates (Fig.10b). In our experiments, foam generation was aresult of bubbly £ow conditions and the foamhead was destroyed by the onset of transitionaland slug £ow and greatly reduced by tube incli-nation. This behaviour is in contrast to the resultsof Seyfried and Freundt (2000), who report agradual aeration of their liquid column duringslug £ow due to a down£ow of bubbles entrainedduring slug burst.
4.2. Pressure measurements
Examples of ASG and microphone pressure re-cordings obtained over a 20-s interval during con-tinuous gas supply are shown in Fig. 11 for aliquid viscosity of 0.001 Pa s and tube inclinationsof 0 and 40‡. Near the region of bubble genera-tion, pressure changes are dominated by this pro-cess, resulting in a relatively noisy and high-fre-quency signal (see trace at ASG 1). The datarecorded at ASG 1 are relatively well correlatedwith those recorded at ASG 2, but at ASG 3 andhigher up the £uid column most of this high-fre-quency signal is gone. Pressure changes recordedat ASG 3^5 are increasingly dominated by a saw-tooth signal with upgoing ramps re£ecting the in-creasing static pressures due to slug expansionduring slug ascent. The arrival of most (but not
all) of the slugs at the surface and their subse-quent bursting is indicated by the microphone.If the amplitude of pressure change at ASG 5and 6 is viewed as a proxy for slug size, thenthe acoustic energy released at bursting does notappear to be well correlated with the slug size.The pressure data collected in vertical and in-clined tubes appear to be relatively similar, how-ever, inclined tubes generated less acoustic energythan vertical tubes.Data collected during similar experiments with
a 0.09-Pa-s viscosity solution are shown in Fig.
Fig. 13. (a) ASG 6 (grey) and microphone (black) data re-corded during a slug burst event in a continuous gas £ow ex-periment. The increasing then decreasing pressure recordedby ASG 6 is due to the increasing static pressure as the ex-panding slug approaches the transducer, then decreasing stat-ic pressure as the gas slug passes the transducer. The pres-sure oscillations detected by the ASG 6 transducer as theslug approaches the surface are considerably enhanced com-pared to those measured during the ascent of single slugs.(b) Microphone data magni¢ed to illustrate the quasi-mono-chromatic characteristics of the signal with frequency near120 Hz. This signal is consistent with longitudinal wave reso-nance of the air column in the open end of the experimentaltube.
VOLGEO 2669 20-11-03
M.R. James et al. / Journal of Volcanology and Geothermal Research 129 (2004) 61^82 75

12. The results are qualitatively similar to thoseobtained in experiments with water (0.001 Pa s),but display larger pressure variations. Speci¢cally,the magnitudes of acoustic pressure changes areup to three times larger than those observed dur-ing the experiments with water. The higher-ampli-tude ASG data indicate that the slugs are largerand less frequent than in the 0.001-Pa-s liquid.The number of slugs per unit time also dependson the tube inclination. Over the 20-s interval, 27slugs were observed in a 0.001-Pa-s liquid in avertical tube vs. 21 slugs for the same liquid ina tube inclined at 40‡. In contrast, 22 slugs wereobserved over the same interval in a 0.09-Pa-sliquid in a vertical tube vs. 13 slugs for thesame liquid in a tube inclined at 40‡.Fig. 13 shows the details of a slug burst in a
vertical tube ¢lled with a 0.09-Pa-s liquid. Fig.13a shows data from ASG 6 and the microphoneduring the slug burst near 16.5 s. The ASG 6 datashow pressure oscillations as the slug approachesthe surface. These oscillations are one order ofmagnitude larger than those recorded during theascent of a single slug. This is interpreted to re-£ect the continuous nature of the £ow, which gen-erates many sources of oscillations and enhancesthe stimulation of the resonant frequencies of theascending slugs. Similarly, the microphone data(see detail in Fig. 13b) show much larger ampli-tudes than observed in individual slugs. The oscil-lation frequency near 120 Hz in Fig. 13b is con-sistent with longitudinal acoustic resonance of theair in the open end of the tube. Frequencies di-rectly related to membrane oscillation were notobserved.The continuous gas supply experiments show
sub-static pressures at the base of the tube similarto those observed during single slug experiments.The magnitudes of the pressure changes belowstatic were largest for viscous liquids in verticaltubes aerated with high gas £uxes (V1.5 kPa ina 0.09-Pa-s liquid aerated with a gas £ux of 5 lmin31) and decreased with increasing tube incli-nation (V700 Pa in a 0.09-Pa-s liquid aeratedwith a gas £ux of 5 l min31 in a tube inclinedat 40‡), decreasing gas £ux (V350 Pa in a 0.09-Pa-s liquid aerated with a gas £ux of 1 l min31 ina vertical tube), and decreasing liquid viscosity
(V240 Pa in a 0.001-Pa-s liquid aerated with agas £ux of 5 l min31in a vertical tube).
5. Discussion
Our experiments demonstrate the importance oftube inclination in promoting bubble coalescenceand hence slug formation by locally enhancing thegas-volume fraction on the upper wall of the tube.For any reasonably long conduit, only very smallangles of inclination could therefore result in tran-sitional, if not slug, £ow. Once a large bubble isproduced, its increased ascent velocity will allowit to continue to grow by enhanced coalescence.Even in situations with multiple rising slugs ofsimilar sizes, it has been demonstrated that slugscontinue to coalesce if their separation distance isless than 10^20D (Pinto and Campos, 1996; Po-lonsky et al., 1999a).The inclined conduit imaged at Stromboli vol-
cano (Chouet et al., 2002) could thus e¡ectivelycontrol the production of gas slugs by enhancedcoalescence rather than by the collapse of foamrafts. The slugs generated in this manner will risemore rapidly and are likely to be larger than thoseexpected in vertical conduits. For a conduit in-clined at 30‡, slug ascent velocity is likely to beincreased by V40%. Taking this velocity increaseinto account may help reconcile di¡erences be-tween previously calculated slug ascent velocitiesand those determined from infrasonic data (Ri-pepe et al., 2001). The pressure data in Fig. 8also suggest that tube inclination enhances inertiale¡ects in single-slug £ows. By concentrating theslug on the upper conduit wall and increasing thethickness of the downward-£owing liquid ¢lm,tube inclination reduces dynamic losses due toviscosity within this back£ow. Consequently,slugs ascending inclined tubes should be less sus-ceptible to factors such as wall roughness.The £ow regime produced may have further
consequences than simply determining the sizeof bubbles bursting at the surface. The ascent ofsmall bubbles is signi¢cantly less e⁄cient at liquidmixing than the ascent of slugs. In a magma, thiscould allow su⁄cient cooling of the top surface toform a carapace. Slug £ow is also more e⁄cient at
VOLGEO 2669 20-11-03
M.R. James et al. / Journal of Volcanology and Geothermal Research 129 (2004) 61^8276

disrupting the surface, as demonstrated duringsome of the continuous supply experiments inwhich foam layers, having accumulated duringbubbly £ow, were destroyed when the £ow regimewas changed to slug £ow. Liquid mixing by slugascent is particularly enhanced in inclined con-duits, where a complete circulatory system canbe observed, with the liquid near the lower surfaceof the conduit being drawn downwards. It istherefore possible that inclined conduits favourtypical Strombolian-type activity, whereas anearly vertical conduit might periodically inducemore violent explosions caused by the disruptionof a cool carapace or a foam layer with a signi¢-cant yield strength. In essence, conduit inclinationshould be considered as having the potential forconsiderable control over eruptive style.
5.1. Forces and pressure changes
The pressure £uctuations recorded during theascent of individual gas slugs include contribu-tions from both static and dynamic processes.The production of gas slugs at basaltic volcanoesis frequently ascribed to the collapse of an accu-mulating foam layer (Jaupart and Vergniolle,1989; Chouet et al., 1997; Ripepe and Gordeev,1999). Combining the pressure changes caused byfoam layer collapse with our data may accountfor the process believed to be responsible forVLP seismic data at Stromboli (Chouet et al.,2002).Numerical investigations of foam collapse as a
possible seismic source at Stromboli were previ-ously carried out by Ripepe and Gordeev (1999).Considering only static e¡ects, Ripepe and Gor-deev (1999) concluded that pressure changeswould only be small (V80^800 Pa) for ‘free coa-lescence’ of bubbles in basaltic systems. However,Chouet et al. (2002) demonstrated the possibilityof generating much larger pressure changes (up to106 Pa) if dynamic e¡ects of bubble growth arealso accounted for.If signi¢cant super-static pressures can be gen-
erated, VLP seismic signals may be related to thewhole-scale translational motion of the liquid col-umn on top of the slug. As the gas expands inorder to adjust to static pressure, a downward-
directed single force is initially produced as a re-action force to the upward accelerating mass ofliquid displaced by the piston-like action of theslug (Takei and Kumazawa, 1994). As the slugstarts to accelerates upwards, magma must alsoaccelerate downward to ¢ll the void left by theescaping gas. The downward acceleration of theliquid ¢lm which is produced around the sluggenerates a reaction force in the form of an up-ward-directed single force. When the slug reachesthe surface, this latter force is reversed as thedownward-£owing liquid mass in the ¢lm is decel-erated and a single downward force is exerted.This process was described from the viewpointof accelerating and decelerating liquid on theside of the ascending slug in Section 3.4 and isbelieved to be responsible for the pressure pulsesrecorded during the bursting of slugs in low-vis-cosity liquids (see lower panel in Fig. 8a).As the slug rises, the viscosity of the down-
£owing magma exerts a shear stress on the con-duit walls. This viscous drag is responsible for thegeneration of the sub-static pressures measuredbelow the slug in our experiments (Figs. 2c and8b). A simple way to envisage this process is toassume that a section of the liquid ¢lm £owingpast the bubble essentially goes into free fall andreaches its terminal velocity as determined by thewall friction and liquid viscosity (Wallis, 1969).This volume of liquid in the shape of an annular¢lm of ‘equilibrium’ thickness, is supported by thetube wall (Brown, 1965) and exerts a downwardforce on it, due to its mass. This liquid mass isthus e¡ectively removed from the measured hy-drostatic head, and results in the sub-static pres-sures measured below the slug. Even if the liquidin the down-£owing ¢lm around the slug neverreaches its terminal velocity, this mechanism stillapplies because of the shear stress exerted by the£owing liquid on the walls of the tube.An accurate assessment of the magnitude of
this pressure drop requires a calculation of thefull £ow ¢eld around the slug. Such calculationis beyond the scope of the present study, which islimited to a simpli¢ed extrapolation of our resultsto parameters consistent with a basaltic system.The mass of the liquid ¢lm may be estimatedunder the assumption that the pressure drop is
VOLGEO 2669 20-11-03
M.R. James et al. / Journal of Volcanology and Geothermal Research 129 (2004) 61^82 77

due to a liquid ¢lm of ‘equilibrium’ thickness thatis present over the entire length of the slug. Thisassumption neglects the non-uniform thickness ofthe ¢lm and also disregards the fact that the ¢lmis not fully supported by the wall. However, theseare opposing factors whose e¡ects tend to canceleach other out and become less important withincreasing slug lengths. Brown (1965) gave anequation for the equilibrium thickness, N0, of the¢lm in a vertical tube as:
N 0 ¼31þ
ffiffiffiffiffiffiffiffiffiffiffiffiffiffiffiffi1þ ND
p
Nð5Þ
where:
N ¼
ffiffiffiffiffiffiffiffiffiffiffiffiffiffiffiffiffi14:5
b2gW2
3
sð6Þ
For the liquid viscosities considered in our experi-ments (0.9, 0.09 and 0.001 Pa s), this yields N0 = 6,3, and 0.8 mm, respectively. Using these values ofN0 and assuming a 0.2-m-long slug, the decreasesin hydrostatic pressure associated with the remov-al of this liquid from the static head are 1700, 830and 170 Pa. Although Eq. 5 was developed fromequations for inertial slugs, adjusted to accountfor viscous e¡ects within a laminar, down-£owing¢lm (Brown, 1965), conditions that are not all metin our experiments, these estimates are in reason-able agreement with the measured values of 1800,1100 and 130 Pa in Fig. 8b. For a basaltic systemwith D=2 m, W=400 Pa s and b=2600 kg m33
(Vergniolle and Brandeis, 1996), a liquid ¢lm withthickness of 0.3 m is calculated which, for a 10-m-long slug, implies a mass of 5U104 kg, yielding apressure drop on the order of 100 kPa. Accord-ingly, during slug ascent, the ‘source’ regionwould experience a sub-static pressure of V100kPa and the conduit walls would experience adownward force of V5U105 N. Although the
magnitudes of these pressures and forces are twoand three orders of magnitude less than thoserequired to interpret seismic data from Stromboli(Chouet et al., 2002), the crude nature of ourcalculations suggests that their importance shouldnot necessarily be discounted.As shown in Fig. 8, pressure changes triggered
by the bursting of the gas slug at the surface de-pend on the inclination of the conduit, and mayvary from a gradual increase of pressure back tohydrostatic to a sharp pressure pulse larger thanstatic. Such variations may be considered to re-£ect slug dynamics ranging from inertial behav-iour (small sub-static pressures during slug ascentand a super-static pressure pulse during bursting)to viscous behaviour (large-magnitude sub-staticpressures during slug ascent and no super-staticpressure pulse on bursting). The pressure changesindicative of inertial behaviour are thought to bepresent in the data of Ripepe et al. (2001), whoproduced gas slugs from foam collapse (see ¢g. 12in Ripepe et al., 2001). If a basaltic system pro-duces slugs that are dominantly inertially-con-trolled, then the magnitude of the pressure pulsegenerated upon the arrival of a slug at the surfaceis likely to be on the order of 104 to 105 Pa(bW2600 kg m33 and 0.66U6 2 m s31 ; Section3.4). However, this is also likely to be combinedwith another pulse due to the jet recoil force (Ka-namori et al., 1984; Chouet et al., 1997) due to adynamically-produced super-static pressure in theslug.
5.2. Pressure oscillations
Seismic and acoustic data from basaltic volca-noes display a range of characteristic periods as-sociated with the source process (e.g. Chouet,1996; Chouet et al., 2002). During our experi-ments, pressure oscillations (Table 2) were gener-
Table 2Pressure oscillations recorded
Source Observed frequency Duration
Turbulent £ow in the slug wake V19 Hz duration of slug ascentLongitudinal oscillations of the slug as it approaches the surface V12 to 30 Hz 6 1 sBubble membrane oscillation V540 to 680 Hz 6 100 msLongitudinal resonance of the air column above the liquid V100 to 120 Hz exponential decay lasting up to V1 s.
VOLGEO 2669 20-11-03
M.R. James et al. / Journal of Volcanology and Geothermal Research 129 (2004) 61^8278

ated during slug release (Fig. 2b), in the slug wake(Fig. 3), as slugs approached the surface (Fig. 5),and during and after slugs burst at the surface(Figs. 7 and 13). Vergniolle et al. (1996) consid-ered several di¡erent modes of gas slug oscillationto account for acoustic data recorded during ex-plosions at Stromboli. One of the modes theyconsidered is the longitudinal oscillation of anascending slug in a tube. The oscillation frequen-cies observed in our experiments are consistentwith longitudinal oscillations of slugs under atmo-spheric pressure as the slug approaches the sur-face of the liquid. This process e¡ectively repre-sents the ‘bouncing’ of the liquid column on topof a gas spring, with frequency given by (Ver-gniolle et al., 1996):
f L ¼ 12Z
ffiffiffiffiffiffiffiffiffiffiffiffiffiffiffiffiQ Pg
bLeqHl
sð7Þ
where Q is the ratio of speci¢c heats of the gas(Q=1.3 for air), Leq is the equilibrium bubblelength, Hl is the depth of the slug in the liquid,and Pg is the gas pressure in the slug. For slugsunder atmospheric pressure and with equilibriumlengths of 8 and 24 cm, released under water col-umns 2 m in height, our measured oscillation fre-quencies are 4.7 and 2.8 Hz, in close agreementwith the values of 5.0 and 2.9 Hz calculated withEq. 7. These oscillations (Fig. 2b) display peak-to-peak amplitudes of up to 45 kPa, which are threeorders of magnitude larger than the change instatic pressure expected if compression of thegas slug is calculated without consideration ofthe dynamic terms. Dynamic pressures were alsoobserved below the bubble (at ASG 1 in Fig. 2b),where static pressure does not change after therelease of the slug. This type of oscillation couldbe induced in a basaltic system due to foam col-lapse and would greatly enhance pressure changesassociated with this process.The increasing frequency of oscillations ob-
served as slugs approach the surface can also bemodelled as longitudinal bubble oscillations. Thewhite line in the spectrogram in Fig. 5b representsthe frequency calculated from Eq. 7 assuming abubble length of 0.22 m, an ascent velocity 0.2 ms31, and an arrival time at the surface of 13.79 s
(taken from the video data). Given that Eq. 7does not account for the domed top of the slugwhich, at shallow depths, will be of similar size tothe head of liquid above it, the calculated resultsare in remarkable agreement with the data. Theseoscillations are observable for V0.7 s before theslug bursts, representing a distance of V4D. Pre-vious work suggested that the local liquid velocity¢eld in front of a slug extends no further than Din front of the nose, and is probably con¢nedwithin a scale closer to 0.5D (Polonsky et al.,1999b; Bugg and Saad, 2002). Therefore, it seemsunlikely that these oscillations are being triggeredby the interaction of the liquid velocity ¢eld withthe liquid surface. It is more probable that theybecome detectable as their amplitude increasesdue to the decreasing mass of oscillating waterabove the slug.Vergniolle et al. (1996) also suggested that dif-
ferent frequencies within their acoustic data mightbe accounted for by shape oscillations of a bubblenose, vibrations of the bubble membrane pro-duced at the surface, and kinematic waves in thedraining £uid ¢lms after the bubble has burst.During our experiments with single gas slugs wedid not detect any shape oscillations of bubblenoses, although extreme shape distortions wereobserved during the continuous gas supply experi-ments due to turbulence in the liquid the slugswere passing through. Single slugs did demon-strate membrane oscillations and kinematic wavesin the draining ¢lm, although no recorded pres-sure signals can be ascribed to the kinematicwaves.The membrane oscillations considered by Ver-
gniolle et al. (1996) (their ‘bubble oscillationmode’) were radial movements of a domed mem-brane allowed to move across a liquid surface.However, in the experiments described here, mem-branes were bounded by the tube and are there-fore considered as ‘drum skins’ rather than asoscillating bubbles. The frequency, fm, of the fun-damental axial mode of oscillation for this geom-etry is given by (Morse and Ingard, 1968):
f m ¼ 0:382741a
ffiffiffiffiffiffiTb s
rð8Þ
where T is the tension force per unit length of
VOLGEO 2669 20-11-03
M.R. James et al. / Journal of Volcanology and Geothermal Research 129 (2004) 61^82 79

edge, bs is the surface mass density, and a (0.019m) is the membrane radius. The membranes pro-duced by slugs are bounded by an upper and low-er interfacial surface, hence T=2c, and the fre-quencies ascribed to their oscillation rangebetween V540 and 680 Hz. De¢ning the surfacemass density as btm, where tm is the membranethickness, and using b=1000 kg m33 andc=0.07 N m31 for water, we obtain from Eq. 8membrane thicknesses of 200 and 120 nm for thefrequencies of 540 and 680 Hz, respectively. Thesevalues are small but not unreasonable for bubblemembrane thicknesses, and we interpret these fre-quencies as being due to this fundamental axialoscillation mode. However, in many experimentsthese oscillations were swamped by those associ-ated with tube resonance (V100^120 Hz, depend-ing on the exact con¢guration of the tube and theliquid level in it).The ¢nal oscillatory source we consider is the
slug wake, during the passage of which pressureoscillations with frequencies near 19 Hz were re-corded in 0.001-Pa-s liquid (Fig. 3). At this vis-cosity, the slugs rose with Reynolds numbers ofV8000, placing them well into the region of tur-bulent wakes (Res 300) as de¢ned by Camposand Guedes de Carvalho (1988). This is in agree-ment with visual observations of the turbulentslug wake, much of which was marked by a trainof entrained bubbles behind the slug. Duringthese experiments, the base of the slug was alsoobserved to constantly change shape in a sloshingmanner. Although we cannot attribute any pres-sure changes to this process, Polonsky et al.(1999a) showed that the amplitudes of pressure£uctuations associated with such wakes increasewith slug length, and that the frequencies of pres-sure £uctuations depend on slug length only forbubbles shorter than V10D. Slugs in some basal-tic systems might be expected to rise with Reyn-olds numbers s 300, so turbulent wakes may pro-vide seismic sources or energy to stimulateresonance of other parts of the system.
6. Summary
Pressure measurements carried out during the
ascent of gas slugs in liquid-¢lled tubes demon-strate the importance of both static and dynamicpressure changes. Conduit inclination promotesbubble coalescence and the slug £ow regime intwo-phase £ow, increasing slug size and slug as-cent velocity at the expense of the frequency ofoccurrence of slugs as compared to identical gas£uxes in vertical tubes. By concentrating gas onthe upper wall of the tube and increasing thethickness of the liquid ¢lm £owing around thelower surface of the slug, tube inclination e¡ec-tively increases the importance of inertial overviscous e¡ects within the £ow.The ascent of bubbles and slugs provides a rich
source of pressure oscillations (Table 2). Di¡erentfrequencies are detected at di¡erent heights alongthe £uid column in continuous gas-supplied £owexperiments. Near the surface, pressure oscilla-tions are dominated by changes in the statichead and by longitudinal oscillations of the gasslugs. The frequency of the latter oscillations in-creases as the slugs approach the surface.
Acknowledgements
We are grateful to J. Bailey and K. Courtneyfor assistance during some of the experiments andto G. Ryan for useful discussions. M.R.J. wassupported by The Leverhulme Trust (F/00185A), and equipment was funded by The RoyalSociety. We thank E. Calder and R. Seyfriedwhose helpful comments improved this manu-script.
References
Arciniega-Ceballos, A., Chouet, B.A., Dawson, P., 1999. Verylong-period signals associated with vulcanian explosions atPopocatepetl Volcano, Mexico. Geophys. Res. Lett. 26,3013^3016.
Blackburn, E.A., Wilson, L., Sparks, R.S.J., 1976. Mechanicsand dynamics of Strombolian activity. J. Geol. Soc. London132, 429^440.
Brown, R.A.S., 1965. The mechanics of large gas bubbles intubes I. Bubble velocities in stagnant liquids. Can. J. Chem.Eng. 43, 217^223.
Bugg, J.D., Saad, G.A., 2002. The velocity ¢eld around aTaylor bubble rising in a stagnant viscous £uid: Numerical
VOLGEO 2669 20-11-03
M.R. James et al. / Journal of Volcanology and Geothermal Research 129 (2004) 61^8280

and experimental results. Int. J. Multiphase Flow 28, 791^803.
Campos, J.B.L.M., Guedes de Carvalho, J.R.F., 1988. An ex-perimental study of the wake of gas slugs rising in liquids.J. Fluid Mech. 196, 27^37.
Cheng, H., Hills, J.H., Azzorpardi, B.J., 1998. A study of thebubble-to-slug transition in vertical gas-liquid £ow in col-umns of di¡erent diameter. Int. J. Multiphase Flow 24,431^452.
Chouet, B.A., 1988. Resonance of a £uid-driven crack: Radi-ation properties and implications for the source of long-pe-riod events and harmonic tremor. J. Geophys. Res. 93,4375^4400.
Chouet, B., 1992. A seismic model for the source of long-peri-od events and harmonic tremor. In: Gasparini, P., Scarpa,R., Aki, K. (Eds.), Volcanic Seismology. IAVCEI Proc. Vol-canol. 3, Springer, Berlin, pp. 133^156.
Chouet, B.A., 1996. Long-period volcano seismicity: Its sourceand use in eruption forecasting. Nature 380, 309^316.
Chouet, B.A., Page, R.A., Stephens, C.D., Lahr, J.C., Power,J.A., 1994. Precursory swarms of long-period events at Re-doubt Volcano (1989^1990), Alaska: Their origin and use asa forecasting tool. In: Miller, T.P., Chouet, B.A. (Eds.), The1989^1990 Eruptions of Redoubt Volcano, Alaska. J. Vol-canol. Geotherm. Res. 62, 95^135.
Chouet, B., Saccorotti, G., Martini, M., Dawson, P., De Luca,G., Milana, G., Scarpa, R., 1997. Source and path e¡ects inthe wave ¢elds of tremor and explosions at Stromboli Vol-cano, Italy. J. Geophys. Res. 102, 15129^15150.
Chouet, B., Saccorotti, G., Dawson, P., Martini, M., Scarpa,R., De Luca, G., Milana, G., Cattaneo, M., 1999. Broad-band measurements of the sources of explosions at Strom-boli Volcano, Italy. Geophys. Res. Lett. 26, 1937^1940.
Chouet, B., Dawson, P., Ohminato, T., Martini, M., Sacco-rotti, G., Giudicepietro, F., De Luca, G., Milana, G., Scar-pa, R., 2002. Source mechanisms of explosions at StromboliVolcano, Italy, determined from moment-tensor inversionsof very-long-period data. J. Geophys. Res. (in press).
Clift, R., Grace, J.R., Weber, M.E., 1978. Bubbles, Drops andParticles. Academic Press, New York.
Fabre, J., Line¤, A., 1992. Modelling of two-phase slug £ow.Annu. Rev. Fluid Mech. 24, 21^46.
Gopal, M., Jepson, W.P., 1998. The study of dynamic slug£ow characteristics using digital image analysis ^ Part I:Flow visualisation. J. Energy Res. Technol. Trans.A.S.M.E. 120, 97^101.
Jaupart, C., Vergniolle, S., 1989. The generation and collapseof a foam layer at the roof of a basaltic magma chamber.J. Fluid Mech. 203, 347^380.
Joshi, J.B., 2001. Computational £ow modelling and design ofbubble column reactors. Chem. Eng. Sci. 56, 5893^5933.
Kanamori, H., Given, J.W., Lay, T., 1984. Analysis of seismicbody waves excited by the Mount St. Helens eruption ofMay 18, 1980. J. Geophys. Res. 89, 1856^1866.
Kawaji, W.R., DeJesus, J.M., Tudose, G., 1997. Investigationof £ow structures in vertical slug £ow. Nucl. Eng. Des. 175,37^48.
Konstantinou, K.I., 2002. Deterministic non-linear source pro-cesses of volcanic tremor signals accompanying the 1996Vatnajokull eruption, central Iceland. Geophys. J. Int. 148,663^675.
Krussenberg, A.K., Prasser, H.M., Scha¡rath, A., 2000. A newcriterion for the identi¢cation of the bubble slug transitionin vertical tubes. Kerntechnik 65, 7^13.
Kumagai, H., Chouet, B.A., 1999. The complex frequencies oflong-period seismic events as probes of £uid compositionbeneath volcanoes. Geophys. J. Int. 138, F7^F12.
Kumagai, H., Ohminato, T., Nakano, M., Ooi, M., Kubo, A.,Inoue, H., Oikawa, J., 2001. Very-long-period seismic sig-nals and caldera formation at Miyake Island, Japan. Science293, 687^690.
Legius, H.J.W.M., van den Akker, H.E.A., Narumo, T., 1997.Measurements on wave propagation and bubble and slugvelocities in cocurrent upward two-phase £ow. Exp. Therm.Fluid Sci. 15, 267^278.
Morse, P.M., Ingard, K.U., 1968. Theoretical Acoustics.McGraw-Hill, New York.
Neuberg, J., Luckett, R., Ripepe, M., Braun, T., 1994. High-lights from a seismic broadband array on Stromboli volca-no. Geophys. Res. Lett. 21, 749^752.
Nicklin, D.J., Wilkes, J.O., Davidson, J.F., 1962. Twophase £ow in vertical tubes. Trans. Inst. Chem. Eng. 40,61^68.
Nishimura, T., Nakamichi, H., Tanaka, S., Sato, M., Kobaya-shi, T., Ueki, S., Hamaguchi, H., Ohtake, M., Sato, H.,2000. Source process of very long period seismic events as-sociated with the 1998 activity of Iwate Volcano, northeast-ern Japan. J. Geophys. Res. 105, 19135^19147.
Pinto, A.M.F.R., Campos, J.B.L.M., 1996. Coalescence of twogas slugs rising in a vertical column of liquid. Chem. Eng.Sci. 51, 45^54.
Polonsky, S., Barnea, D., Shemer, L., 1999a. Averaged andtime-dependent characteristics of the motion of an elongatedbubble in a vertical pipe. Int. J. Multiphase Flow 25, 795^812.
Polonsky, S., Shemer, L., Barnea, D., 1999b. The relationbetween the Taylor bubble motion and the velocity ¢eldahead of it. Int. J. Multiphase Flow 25, 957^975.
Ripepe, M., Gordeev, E., 1999. Gas bubble dynamics modelfor shallow volcanic tremor at Stromboli. J. Geophys. Res.104, 10639^10654.
Ripepe, M., Ciliberto, S., Schiava, M.D., 2001. Time con-straints for modeling source dynamics of volcanic explosionsat Stromboli. J. Geophys. Res. 106, 8713^8727.
Seyfried, R., Freundt, A., 2000. Experiments on conduit £owand eruption behavior of basaltic volcanic eruptions. J. Geo-phys. Res. 105, 23727^23740.
Shemer, L., Barnea, D., 1987. Visualisation of the instantane-ous velocity pro¢les in gas^liquid slug £ow. Physicochem.Hydrodyn. 8, 243^253.
Shosho, C.E., Ryan, M.E., 2001. An experimental study of themotion of long bubbles in inclined tubes. Chem. Eng. Sci.56, 2191^2204.
Takei, Y., Kumazawa, M., 1994. Why have the single force
VOLGEO 2669 20-11-03
M.R. James et al. / Journal of Volcanology and Geothermal Research 129 (2004) 61^82 81
and torque been excluded from seismic source models? Geo-phys. J. Int. 118, 20^30.
Vergniolle, S., Brandeis, G., 1996. Strombolian explosions 1. Alarge bubble breaking at the surface of a lava column as asource of sound. J. Geophys. Res. 101, 20433^20447.
Vergniolle, S., Brandeis, G., Mareschal, J.-C., 1996. Strombo-lian explosions 2. Eruption dynamics determined fromacoustic measurements. J. Geophys. Res. 101, 20449^20466.
Wallis, G.B. 1969. One-Dimensional Two-Phase Flow.McGraw-Hill, New York.
White, E.T., Beardmore, R.H., 1962. The velocity of rise ofsingle cylindrical air bubbles through liquids contained invertical tubes. Chem. Eng. Sci. 17, 351^361.
Zukoski, E.E., 1966. In£uence of viscosity, surface tension,and inclination angle on motion of long bubbles in closedtubes. J. Fluid Mech. 25, 821^837.
VOLGEO 2669 20-11-03
M.R. James et al. / Journal of Volcanology and Geothermal Research 129 (2004) 61^8282