Embed Size (px)
Citation preview

PRESS NOTE
ON
PERIODIC LABOUR FORCE SURVEY (PLFS)
Annual Report [July 2019 – June 2020]
NATIONAL STATISTICAL OFFICE
MINISTRY OF STATISTICS AND PROGRAMME IMPLEMENTATION
GOVERNMENT OF INDIA
Page 2 of 6
GOVERNMENT OF INDIA MINISTRY OF STATISTICS AND PROGRAMME IMPLEMENTATION
1 Sravana, 1943 Saka 23rdJuly, 2021
PRESS NOTE
Periodic Labour Force Survey (PLFS) – Annual Report [July, 2019 – June, 2020]
A. Introduction
Considering the importance of availability of labour force data at more frequent time intervals, National Statistical Office (NSO) launched Periodic Labour Force Survey (PLFS) in April 2017. The objective of PLFS is primarily twofold:
to estimate the key employment and unemployment indicators (viz. Worker Population
Ratio, Labour Force Participation Rate, Unemployment Rate) in the short time interval of
three months for the urban areas only in the ‘Current Weekly Status’ (CWS).
to estimate employment and unemployment indicators in both ‘Usual Status’ (ps+ss)
and CWS in both rural and urban areas annually.
The first Annual Report (July 2017- June 2018) covering both rural and urban areas giving estimates of all important parameters of employment and unemployment in both usual status (ps+ss) and current weekly status (CWS) was released in May 2019 and the second Annual Report ( July 2018 - June 2019) was released inJune 2020. Now the third Annual Report is being brought out by NSO on the basis of Periodic Labour Force Survey conducted during July 2019-June 2020.
B. Sample Design of PLFS
1. A rotational panel sampling design has been used in urban areas. In this rotational panel scheme, each, selected household in urban areas is visited four times, in the beginning with ‘First Visit Schedule’ and thrice periodically later with a ‘Revisit Schedule’. In urban area, samples for a panel within each stratum were drawn in the form of two independent sub-samples. The scheme of rotation ensures that 75% of the first-stage sampling units (FSUs)1 are matched between two consecutive visits. There was no revisit in the rural samples. For rural areas, samples for a stratum/sub-stratum were drawn randomly in the form of two independent sub-samples. For rural areas, in each quarter of the survey period, 25% FSUs of annual allocation were covered.
1Villages and urban blocks are the smallest area units taken as first-stage sampling units (FSU) in rural and urban
areas respectively.

Page 3 of 6
C. Sampling method
2. Sample Size for First Visit during July 2019- June 2020 in rural and urban areas for the Annual Report:Out of the total number of 12,800 FSUs (7,024 villages and 5,776 UFS blocks) allotted for the survey at the all-India level during July 2019- June 2020, a total of 12,569 FSUs (6,913 villages and 5,656 urban blocks) could be surveyed for canvassing the PLFS Schedule. The number of households surveyed was 1,00,480 (55,291 in rural areas and 45,189 in urban areas) and number of persons surveyed was 4,18,297 (2,40,231 in rural areas and 1,78,066 in urban areas).
3. Conceptual Framework of Key Employment and Unemployment Indicators: The Periodic Labour Force Survey (PLFS) gives estimates of Key employment and unemployment Indicators like the Labour Force Participation Rates (LFPR), Worker Population Ratio (WPR), Unemployment Rate (UR), etc. These indicators, and the ‘Usual Status’ and ‘Current Weekly Status’ are defined as follows:
(a) Labour Force Participation Rate (LFPR): LFPR is defined as the percentage of persons in labour force (i.e. working or seeking or available for work) in the population.
(b) Worker Population Ratio (WPR): WPR is defined as the percentage of employed persons in the population.
(c) Unemployment Rate (UR): UR is defined as the percentage of persons unemployed among the persons in the labour force.
(d) Activity Status- Usual Status: The activity status of a person is determined on the basis of the activities pursued by the person during the specified reference period. When the activity status is determined on the basis of the reference period of last 365 days preceding the date of survey, it is known as the usual activity status of the person.
(e) Activity Status- Current Weekly Status (CWS): The activity status determined on the basis of a reference period of last 7 days preceding the date of survey is known as the current weekly status (CWS) of the person.
4. The Annual Report on PLFS 2019-20 is available at this Ministry’s website (https://mospi.gov.in). The key results are given in the statements annexed.
***
Page 4 of 6
Key Findings of PLFS, Annual Report 2019- 2020
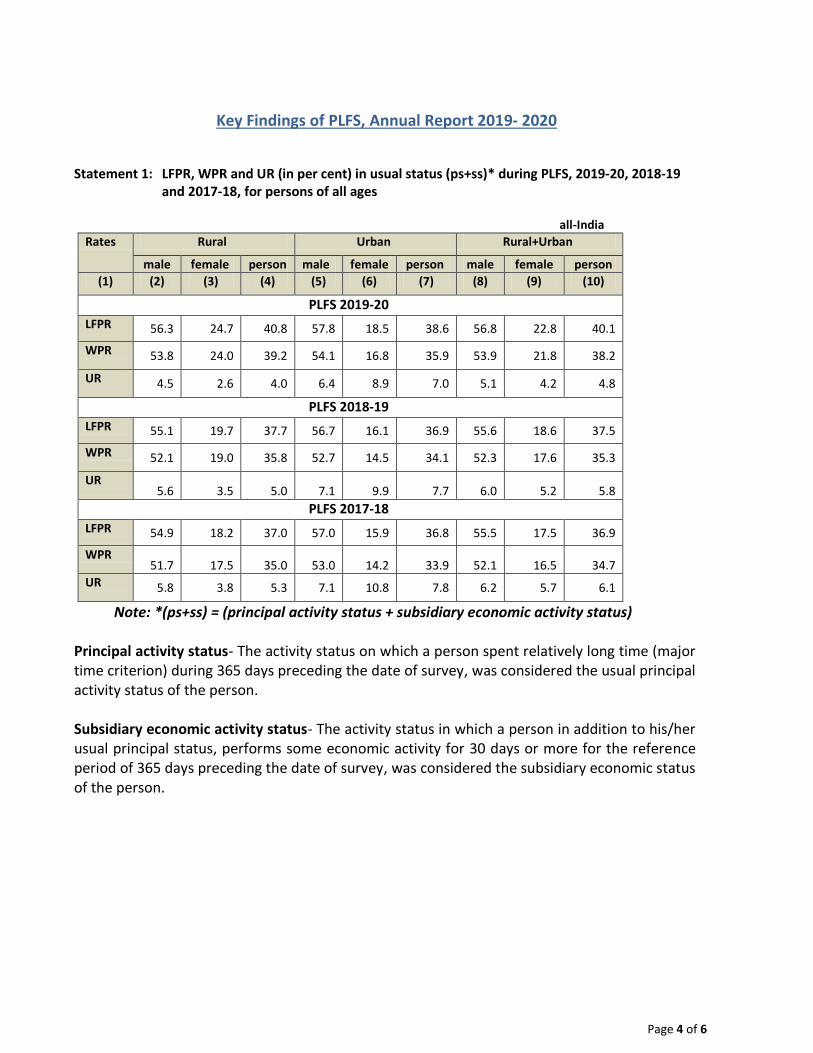
Statement 1: LFPR, WPR and UR (in per cent) in usual status (ps+ss)* during PLFS, 2019-20, 2018-19
and 2017-18, for persons of all ages
all-India
Rates Rural Urban Rural+Urban
male female person male female person male female person
(1) (2) (3) (4) (5) (6) (7) (8) (9) (10)
PLFS 2019-20
LFPR 56.3 24.7 40.8 57.8 18.5 38.6 56.8 22.8 40.1
WPR 53.8 24.0 39.2 54.1 16.8 35.9 53.9 21.8 38.2
UR 4.5 2.6 4.0 6.4 8.9 7.0 5.1 4.2 4.8
PLFS 2018-19
LFPR 55.1 19.7 37.7 56.7 16.1 36.9 55.6 18.6 37.5
WPR 52.1 19.0 35.8 52.7 14.5 34.1 52.3 17.6 35.3
UR 5.6 3.5 5.0 7.1 9.9 7.7 6.0 5.2 5.8
PLFS 2017-18
LFPR 54.9 18.2 37.0 57.0 15.9 36.8 55.5 17.5 36.9
WPR 51.7 17.5 35.0 53.0 14.2 33.9 52.1 16.5 34.7
UR 5.8 3.8 5.3 7.1 10.8 7.8 6.2 5.7 6.1
Note: *(ps+ss) = (principal activity status + subsidiary economic activity status) Principal activity status- The activity status on which a person spent relatively long time (major time criterion) during 365 days preceding the date of survey, was considered the usual principal activity status of the person. Subsidiary economic activity status- The activity status in which a person in addition to his/her usual principal status, performs some economic activity for 30 days or more for the reference period of 365 days preceding the date of survey, was considered the subsidiary economic status of the person.
Page 5 of 6
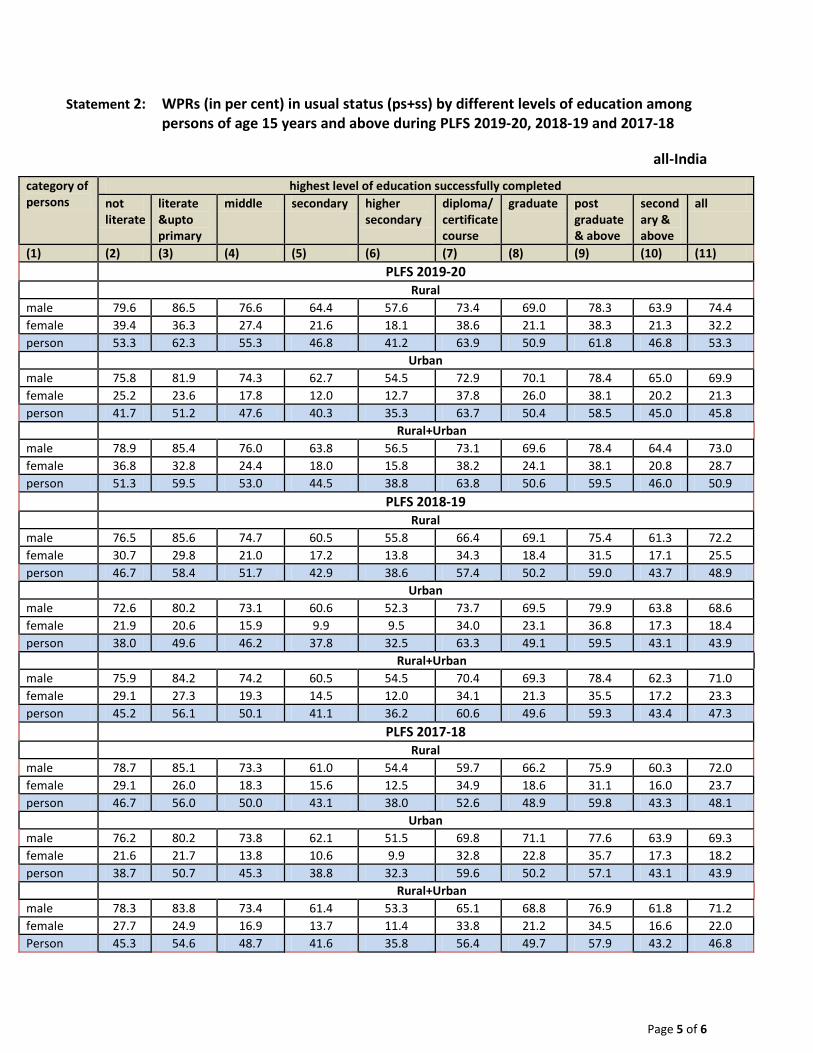
Statement 2: WPRs (in per cent) in usual status (ps+ss) by different levels of education among persons of age 15 years and above during PLFS 2019-20, 2018-19 and 2017-18
all-India
category of persons
highest level of education successfully completed
not literate
literate &upto primary
middle secondary higher secondary
diploma/ certificate course
graduate post graduate & above
secondary & above
all
(1) (2) (3) (4) (5) (6) (7) (8) (9) (10) (11)
PLFS 2019-20 Rural
male 79.6 86.5 76.6 64.4 57.6 73.4 69.0 78.3 63.9 74.4
female 39.4 36.3 27.4 21.6 18.1 38.6 21.1 38.3 21.3 32.2
person 53.3 62.3 55.3 46.8 41.2 63.9 50.9 61.8 46.8 53.3
Urban
male 75.8 81.9 74.3 62.7 54.5 72.9 70.1 78.4 65.0 69.9
female 25.2 23.6 17.8 12.0 12.7 37.8 26.0 38.1 20.2 21.3
person 41.7 51.2 47.6 40.3 35.3 63.7 50.4 58.5 45.0 45.8
Rural+Urban
male 78.9 85.4 76.0 63.8 56.5 73.1 69.6 78.4 64.4 73.0
female 36.8 32.8 24.4 18.0 15.8 38.2 24.1 38.1 20.8 28.7
person 51.3 59.5 53.0 44.5 38.8 63.8 50.6 59.5 46.0 50.9
PLFS 2018-19 Rural
male 76.5 85.6 74.7 60.5 55.8 66.4 69.1 75.4 61.3 72.2
female 30.7 29.8 21.0 17.2 13.8 34.3 18.4 31.5 17.1 25.5
person 46.7 58.4 51.7 42.9 38.6 57.4 50.2 59.0 43.7 48.9
Urban
male 72.6 80.2 73.1 60.6 52.3 73.7 69.5 79.9 63.8 68.6
female 21.9 20.6 15.9 9.9 9.5 34.0 23.1 36.8 17.3 18.4
person 38.0 49.6 46.2 37.8 32.5 63.3 49.1 59.5 43.1 43.9
Rural+Urban
male 75.9 84.2 74.2 60.5 54.5 70.4 69.3 78.4 62.3 71.0
female 29.1 27.3 19.3 14.5 12.0 34.1 21.3 35.5 17.2 23.3
person 45.2 56.1 50.1 41.1 36.2 60.6 49.6 59.3 43.4 47.3
PLFS 2017-18 Rural
male 78.7 85.1 73.3 61.0 54.4 59.7 66.2 75.9 60.3 72.0
female 29.1 26.0 18.3 15.6 12.5 34.9 18.6 31.1 16.0 23.7
person 46.7 56.0 50.0 43.1 38.0 52.6 48.9 59.8 43.3 48.1
Urban
male 76.2 80.2 73.8 62.1 51.5 69.8 71.1 77.6 63.9 69.3
female 21.6 21.7 13.8 10.6 9.9 32.8 22.8 35.7 17.3 18.2
person 38.7 50.7 45.3 38.8 32.3 59.6 50.2 57.1 43.1 43.9
Rural+Urban
male 78.3 83.8 73.4 61.4 53.3 65.1 68.8 76.9 61.8 71.2
female 27.7 24.9 16.9 13.7 11.4 33.8 21.2 34.5 16.6 22.0
Person 45.3 54.6 48.7 41.6 35.8 56.4 49.7 57.9 43.2 46.8
Page 6 of 6
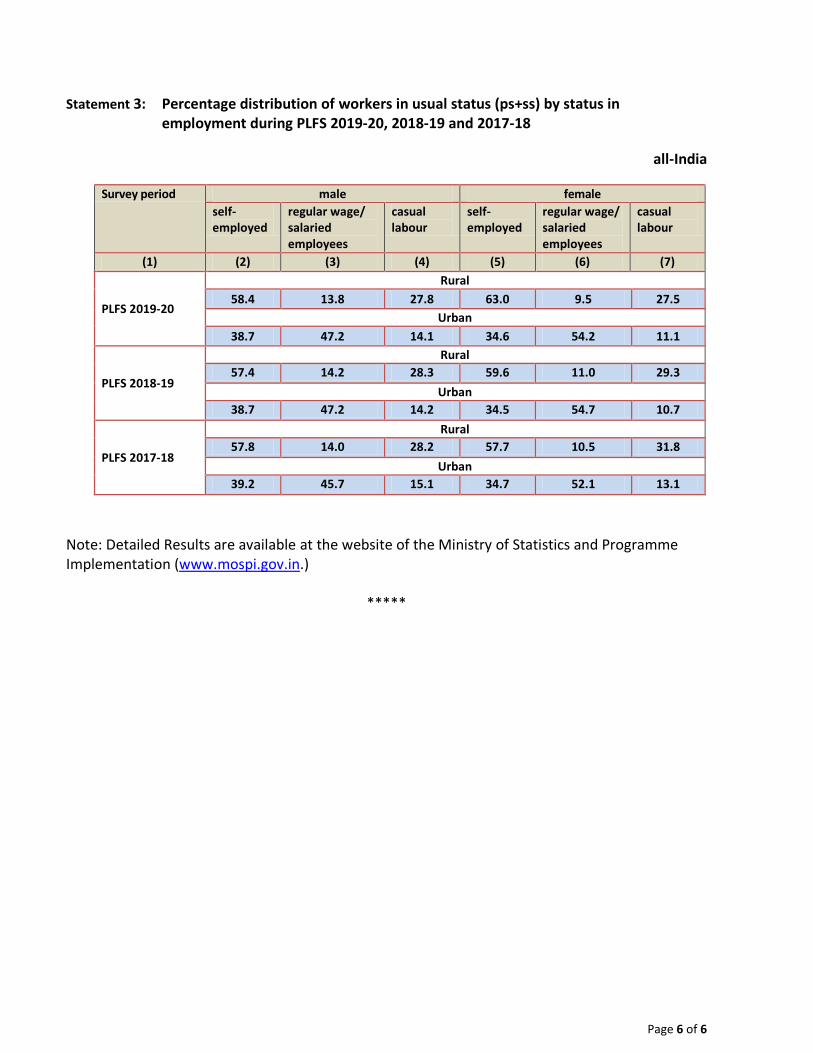
Statement 3: Percentage distribution of workers in usual status (ps+ss) by status in employment during PLFS 2019-20, 2018-19 and 2017-18
all-India
Survey period male female
self- employed
regular wage/ salaried employees
casual labour
self- employed
regular wage/ salaried employees
casual labour
(1) (2) (3) (4) (5) (6) (7)
PLFS 2019-20
Rural
58.4 13.8 27.8 63.0 9.5 27.5
Urban
38.7 47.2 14.1 34.6 54.2 11.1
PLFS 2018-19
Rural
57.4 14.2 28.3 59.6 11.0 29.3
Urban
38.7 47.2 14.2 34.5 54.7 10.7
PLFS 2017-18
Rural
57.8 14.0 28.2 57.7 10.5 31.8
Urban
39.2 45.7 15.1 34.7 52.1 13.1
Note: Detailed Results are available at the website of the Ministry of Statistics and Programme Implementation (www.mospi.gov.in.)
*****


![>iK]]S0ialGRS aia2 Sal a¸ /S^KIS plFS,Kl1K Kl]S,p]SoS p Qa5(*7Ø&Ø57Ø056$*4$/ #&.Ø1/$-(72A1))Ø&Ø$. >iK]]S0ialGRS aia2_ Sal_a¸ /S^KIS plFS,Kl1K_Kl]S,p]SoS p_Qa "a_mK^ilKOopoo>ºGa]i>ºIK]GpaSaG>iK]]poaQl>mma±>ua]oKF>mo](https://img.dokumen.tips/doc/110x75/5e9ab457270b2a465e396d77/iks0ialgrs-aia2-sal-a-skis-plfskl1k-klspsos-p-qa-57570564.jpg)