Embed Size (px)
Citation preview

Report and Consolidated Financial Statements 2010
President Petroleum Company PLC
{ 1 }
Contents
Corporate Information 2
Chairman’s Statement 3
Directors’ Report 7
Directors’ Remuneration Report 13
Corporate Governance Statement 17
Statement of Directors’ Responsibilities 19
Independent Auditor’s Report 21
Consolidated Statement of Comprehensive Income 23
Consolidated Statement of Financial Position 24
Consolidated Statement of Changes in Equity 25
Consolidated Statement of Cash Flows 26
Notes to the Consolidated Accounts 27
Company Balance Sheet 57
Notes to the Company Accounts 58
Glossary 62
Notice of Annual General Meeting 63
{ 2 }
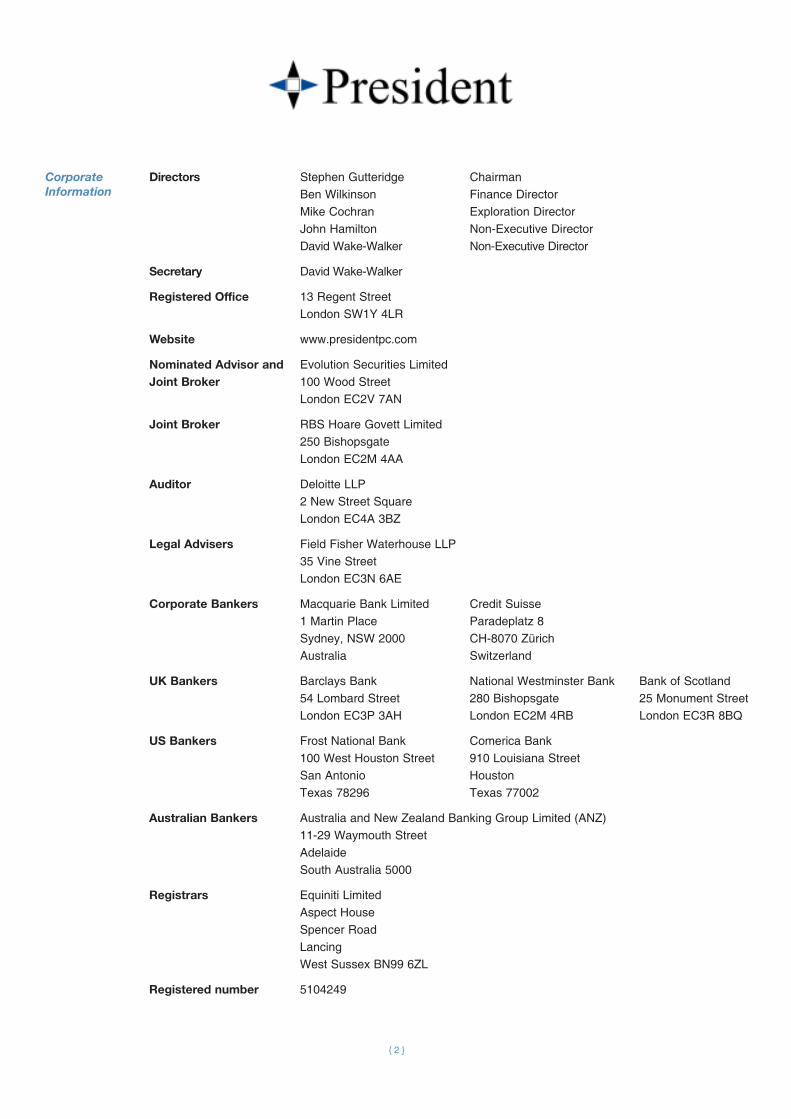
CorporateInformation
Directors Stephen Gutteridge Chairman Ben Wilkinson Finance Director Mike Cochran Exploration Director John Hamilton Non-Executive Director David Wake-Walker Non-Executive Director
Secretary David Wake-Walker
Registered Office 13 Regent Street London SW1Y 4LR
Website www.presidentpc.com
Nominated Advisor and Evolution Securities LimitedJoint Broker 100 Wood Street London EC2V 7AN
Joint Broker RBS Hoare Govett Limited 250 Bishopsgate London EC2M 4AA
Auditor Deloitte LLP 2 New Street Square London EC4A 3BZ
Legal Advisers Field Fisher Waterhouse LLP 35 Vine Street London EC3N 6AE
Corporate Bankers Macquarie Bank Limited Credit Suisse 1 Martin Place Paradeplatz 8 Sydney, NSW 2000 CH-8070 Zürich Australia Switzerland
UK Bankers Barclays Bank National Westminster Bank Bank of Scotland 54 Lombard Street 280 Bishopsgate 25 Monument Street London EC3P 3AH London EC2M 4RB London EC3R 8BQ
US Bankers Frost National Bank Comerica Bank 100 West Houston Street 910 Louisiana Street San Antonio Houston Texas 78296 Texas 77002
Australian Bankers Australia and New Zealand Banking Group Limited (ANZ) 11-29 Waymouth Street Adelaide South Australia 5000
Registrars Equiniti Limited Aspect House Spencer Road Lancing West Sussex BN99 6ZL
Registered number 5104249

{ 3 }
Chairman’s Statement
Summary
Following the November 2009 transformation of the Group, President’s twin focus in 2010 was to
prove up the potential value in the existing legacy assets in Louisiana, USA, and South Australia
through drilling, and to add new assets through acquisition.
In January, the Group completed the acquisition of a 25% working interest in the East White Lake
field in Louisiana and in August further deep drilling rights were acquired at President’s existing
East Lake Verret field.
The 2010 drilling and development plan for the legacy assets included two high-impact wells in
Louisiana and South Australia respectively, and further low-cost drilling and work-overs at existing
producing fields, with an emphasis on increasing oil production.
The schedule for drilling the deep Kafoury 3 well in Louisiana was contingent on the acquisition
of the new leases and drilling commenced in November. A shortage of suitable drilling rigs in
Australia impacted the timetable for drilling the Northumberland 2 well, but a contract was signed
in August and the well spudded in March 2011.
In addition to the completed acquisitions in Louisiana, President evaluated a number of additional
deals during the year but none met the Company’s value criteria. Further acquisitions are
anticipated and with increased spending commitments planned on drilling and development, the
Company successfully raised US$50 million through a placing of shares in October. The placing
was over-subscribed and well supported by Levine Capital Management, President’s largest
shareholder, and major UK institutions, both existing shareholders and new investors.
Financial Summary
-
Net Gas Production mmcf per month
0
5
10
15
20
25
30
35
EWL
ELV
Jan Feb Mar Apr May Jun Jul Aug Sep Oct Nov Dec
500
1,000
1,500
2,000
2,500
3,000
3,500
4,000
EWL
ELV
Jan Feb Mar Apr May Jun Jul Aug Sep Oct Nov Dec
Net Oil Production bbls per month
$70
$75
$80
$85
$90
$3.00
$3.50
$4.00
$4.50
$5.00
$5.50
$6.00
$6.50
$7.00
Prices US$
Gas
Oil
50
100
150
200
250
300
Gas
Oil
Average Total
Net Hydrocarbons Production boe/d
Jan Feb Mar Apr May Jun Jul Aug Sep Oct Nov Dec Jan Feb Mar Apr May Jun Jul Aug Sep Oct Nov Dec
2010 sales revenues, net of royalties, over-rides and other interests, increased by 11% to
US$3.4 million. This was despite average 2010 production of 185 boe/day being lower than 2009,
when production included the Orion field, which was sold in June 2009. The strong revenue
{ 4 }
Chairman’s Statement
performance was driven by the successful acquisition of East White Lake and a drilling and
development plan focused on oil. Annual oil production increased by over 50% year-on-year and
oil currently contributes 50% of production compared with 25% at the end of 2009. Better oil prices
during the first half of the year helped boost revenue, whilst the oil production effect contributed
to strong second half revenues of US$1.67 million, almost double 2009 levels.
The contribution to overheads from operations before depreciation increased by 6.5% to
US$2.02 million while depreciation increased to reflect the re-appraisal of East Lake Verret
reserves. Group overheads also rose as the Group utilised resources to assist in evaluating
deal opportunities.
The October placing substantially increased the Group’s year-end cash balances and net assets,
to US$45.7 million and US$57.5 million respectively. This strong cash position will enable the
Group to continue the work on its existing asset base and fund business development.
US Operations
Following President’s acquisition of a 25% working interest in East White Lake, Peak Energy, the
operator, drilled two successful development wells which increased President’s share of
production from 22 boe/day in January to a peak of 100 boe/day by the middle of the year. This
increase, half of which was oil production, offset a decline in gas production at East Lake Verret.
This decline was largely due to ever-increasing water production at the Kafoury 2 well, the largest
producing well in the field. This decline is expected to continue in 2011 and as a result the
Company has reduced its estimate of reserves for Kafoury 2 to reflect this.
The main upside identified at East Lake Verret was in deeper sands that were not current
producers in the field but were significant producers in neighbouring fields. The deep rights to drill
these prospects were acquired and the Kafoury 3 well was spudded in November. Kafoury 3 was
drilled into a previously undrilled fault block and encountered significantly higher than expected
pressures with complex geology and frequent high levels of background gas. Despite the
challenging drilling conditions, President succeeded in completing and testing the well, but the test
interval failed to produce commercial flows of gas. The drilling of Kafoury 3 took twice as long as
anticipated with a corresponding increase in costs. At the year-end US$5.1 million of costs relating
to Kafoury 3 were included in intangible assets.
There remains further potential in the Group’s Louisiana fields, particularly at East White Lake
where recent work and strong oil prices have encouraged a low cost drilling plan in 2011 targeting
increased oil production which will benefit from a severance tax holiday and where any resulting
profitability will be sheltered by President’s US tax losses. Following the unsuccessful Kafoury 3
exploration well, President has reviewed its strategy for Louisiana and will limit further investment
to low-risk activity that will provide immediate additions to production.

{ 5 }
Australia Operations
The primary focus of President’s Australian operations in 2010 was to spud the first exploration
well, Northumberland 2, on the PEL 82 licence in South Australia. Whilst the geological, planning
and regulatory aspects proceeded as planned, the shortage of suitable onshore drilling rigs and
the cost of mobilisation to PEL 82 delayed the schedule. However, a contract for a drilling rig was
signed in August, the well was spudded early in March 2011 and the results were announced in
mid-April.
Whilst the well did not make a commercial discovery, the clear identification of hydrocarbons in
the system, with a significantly thicker than expected Waarre reservoir sand, has given
encouragement and impetus to move forward with further work on the licence. The results from
Northumberland 2 have de-risked other prospects on PEL 82, particularly where we are able to
identify structures with a complete and effective seal, and planning of the next steps in the
exploration programme, potentially to include both seismic and drilling, is underway. The Board is
of the view that, although non-commercial, Northumberland 2 may have enhanced the value
proposition of PEL 82 both in terms of increased potential and reduction of risk.
An airborne gravity and magnetic survey was carried out on the Group’s PEL 132 licence in South
Australia and this has provided additional information to assist in the licence renewal and
relinquishment process. PEL 132 is in a frontier area and it may be difficult to justify commercially
significant additional expenditure in the near future.
Production and Reserves
Production
Natural Gas
(mmcf)
Oil
(bbls)
Total Hydrocarbons
(mboe)
Producing Field 2010 2009 2010 2009 2010 2009
Orion 0.0 198.0 0 5,267 0.0 38.3
East Lake Verret 161.2 314.5 13,971 14,754 40.8 67.2
East White Lake 62.4 0.0 16,339 0 26.7 0.0
223.6 512.5 30,310 20,021 67.5 105.5
Reserves
Net US Commercial Reserves mboe
1P Proved Probable Possible Total
As at 31 December 2009 779.3 208.8 0.0 988.1
East White Lake acquisition 471.8 0.0 858.0 1,329.8
Total 2009 Annual Report 1,251.1 208.8 858.0 2,317.9
Reserves per 1 April 2010 CPR 1,132.5 207.8 634.6 1,974.9
Produced to end 2010 (52.5) 0.0 0.0 (52.5)
Kafoury 2 reserve reduction (95.5) 0.0 0.0 (95.5)
As at 31 December 2010 984.5 207.8 634.6 1,826.9
Chairman’s Statement

{ 6 }
Chairman’s Statement
Prospects
The drilling of President’s legacy assets was an important step, but the key driver of the company’s
growth strategy remains our ability to create value through acquisition and development of
new assets.
Our capability in this area has now been significantly strengthened through the creation of a
corporate structure focused on acquisitions and the recruitment of a high calibre senior team to
deliver them. Whilst a significant deal remained elusive in 2010, President is well-positioned and
well-resourced, and remains confident that attractive new assets, scale and value can be
delivered in a reasonable time-frame and will continue vigorously to pursue that goal.
As the company embarks on a new chapter I have tendered my resignation as Executive
Chairman. With the legacy assets having been financed and exploited, the Group is now in a solid
position to move forward with its growth plans for new opportunities, maximising returns from
existing producing assets, and further evaluating the interesting prospectivity on the PEL 82
licence in Australia. John Hamilton, one of our Non-Executives, has kindly agreed to become
interim Chairman.
Finally I would like to thank our shareholders, customers, partners, advisers and my colleagues
for their support and contribution. I would like to welcome Ben Wilkinson, who joined the Board
as Group Finance Director early in 2011 and to thank Chris Hopkinson and Angelo Baskaran, who
have both stepped down from the Board.
Stephen Gutteridge
Chairman
27 April 2011

{ 7 }
Directors’Report
The Directors present their report and the audited financial statements of President Petroleum
Company PLC for the year ended 31 December 2010.
Financial Review
The results for 2010 have been prepared in accordance with the Group’s accounting policies
under International Financial Reporting Standards (IFRSs). The Group adopts the US Dollar as
its presentation currency to reflect the fact that most of the Group’s activities are denominated in
that currency. The balance sheet of the Parent Company is prepared under UK Generally
Accepted Accounting Policies (GAAP). Proved and probable oil and gas reserves have been
assessed by the directors. These assets are not recognised in the balance sheet, with the
exception of costs incurred to acquire them, evaluate their prospectivity, and bring them into
production.
Net revenue for the year increased to US$3.4 million (2009: US$3.0 million) due to both increased
oil production and underlying commodity prices. Cost of sales of US$5.3 million (2009:
US$3.3 million) have increased to reflect higher depreciation charges in relation to the reserve
reduction on the Kafoury 2 well in addition to production in the year. In consequence the gross loss
for the year increased to US$1.9 million (2009: loss US$0.2 million).
Impairment charges for the year of US$2.9 million (2009: US$1.2 million) correspond to the
declining production at East Lake Veret while Intangible assets of US$14.4 million (2009:
US$6.2 million) include US$5.1 million spent as at the year-end on the Kafoury 3 well which was
subsequently plugged and abandoned in 2011 (see note 13).
Year-end cash balances of US$45.7 million (2009: US$10.1 million) reflect the October 2010
placing of US$50 million (gross) and operating cashflow of US$0.7 million. Loan finance from
Macquarie Bank has been reduced to US$0.15 million and is expected to be repaid in full in
June 2011.
Further commentary on the Group’s revenues, overheads and cash position is included in the
Chairman’s Statement on pages 3 to 6.
Principal Activities
The Group conducts an international business whose principal activities are the exploration for
and the evaluation and production of oil and gas. A detailed review of the development of the
business of the Group is contained in the Chairman’s Statement on pages 3 to 6.
Results and Dividends
The loss for the year after taxation amounted to US$6.7 million (2009: loss US$4.4 million). The
Directors do not recommend a dividend.

{ 8 }
Directors’Report
Directors
The current Directors of the Company and those who served during the year were as follows:
Stephen Gutteridge
Benjamin Wilkinson (appointed 14 February 2011)
Dr. Michael Cochran
John Hamilton
David Wake-Walker
Angelo Baskaran (resigned 9 February 2011)
Chris Hopkinson (resigned 24 September 2010)
None of the Directors has a service agreement of more than one year’s duration. Save as
disclosed in the Directors’ Remuneration Report on page 13 no Director has had a material
interest in any contract of significance with the Company or its subsidiaries during the year. Details
of the Directors’ interests in the shares of the Company are also set out in the Directors’
Remuneration Report.
Capital Structure
Details of the issued share capital, together with details of the movements in the Company’s
issued share capital during the year are shown in note 23. Each Ordinary Share carries the right
to one vote at general meetings of the Company.
On 30 September 2010 the Company raised approximately US$50 million, before costs of
US$2.4 million, by the issue of 63,291,140 Ordinary Shares to institutional investors at a price of
50 pence per share. The proceeds have been allocated to exploration drilling in Louisiana
and Australia.
Under its Articles of Association, the Company has the authority to issue a further 36 million
Ordinary Shares
Subsequent Events
The Kafoury 3 exploration well, East Lake Verret Field (“ELV”), Louisiana, spudded in November
2010 and drilling continued beyond the year-end as a consequence of high pressures creating
extremely challenging conditions. Eventually, in early 2011, a promising section of the well was
tested but proved inconclusive and the well was subsequently plugged and abandoned.
The Northumberland 2 exploration well, PEL82, South Australia, spudded in March 2011 and
results were announced in mid-April with the well being plugged and abandoned. Although not a
commercial discovery the well has provided encouragement for further work on the
PEL82 licence.

{ 9 }
Directors’Report
Substantial Shareholders
As at 15 April 2011, the latest practicable date prior to the publication of this report, the following
interests appeared in the register.
Lynchwood Nominees Limited 32,728,386 30.10%
Harewood Nominees Limited 8,220,000 7.56%
BNY (OCS) Nominees Limited 7,390,300 6.80%
TD Waterhouse Nominees (Europe) Limited 5,677,495 5.22%
Nortrust Nominees Limited 4,414,427 4.06%
Mineworkers Pension Scheme /Chase GIS/ Nominees Limited 3,828,242 3.52%
Barclayshare Nominees Limited 3,598,217 3.31%
HSDL Nominees Limited 3,527,009 3.24%
British Coal Staff Superannuation Scheme /Chase GIS/
Nominees Limited 3,356,719 3.09%
Included in the above, the Company has been advised of the following beneficial holdings.
Levine Capital Management Limited 32,530,289 29.92%
Schroders 10,860,492 9.99%
Henderson Global Investors Ltd 10,820,000 9.95%
Baillie Gifford & Co 7,900,000 7.27%
Jupiter Asset Management Limited 4,157,673 3.82%
Key Performance Indicators
Key Performance Indicators are used to measure the extent to which Directors and management
are reaching key objectives. The principal methods by which the Directors monitor the Group’s
performance are volumes of net production reviewed against prior year and the extent of
exploration success. The Directors also carry out a regular review of cash available for exploration
and development and review actual capital expenditure and operating expenses against forecasts
and budgets.
2010 2009Increase/
(Decrease)
Net gas production mmcf 224 513 (56.3)%
Net oil and natural gas liquid production mbbls 30.3 20.0 51.5%
Total net hydrocarbons mboe 67.5 105.5 (36.0)%
Well operating costs US$000 1,421 1,186 19.8%
Well operating costs per boe US$ 21.02 11.24 87.0%
Cash balances US$000 45,690 10,089 352.9%

{ 1 0 }
Directors’Report
The decline in production volumes of natural gas reflects the 5 month contribution from the Orion
field in 2009 and a decline in gas production from East Lake Verret. A detailed review of the
development of the business of the Group is contained in the Chairman’s Statement on
pages 3 to 6.
Going Concern
The Company’s business activities, together with the factors likely to affect its future development,
performance and position are set out in this report. The financial position of the Company, its cash
flows, liquidity position and borrowing facilities are described in the Financial Summary on page 3.
In addition, note 28 to the financial statements includes the Company’s objectives, policies and
processes for managing its capital; its financial risk management objectives; details of its financial
instruments and hedging activities; and its exposures to credit risk and liquidity risk.
The Company has considerable financial resources and as a consequence, the Directors believe
that the company is well placed to manage its business risks successfully despite the current
uncertain economic outlook and to meet all commitments as they fall due. Further details of the
Group’s commitments are set out in note 27.
The Directors have a reasonable expectation that the Company has adequate resources to
continue in operational existence for the foreseeable future. Thus they continue to adopt the going
concern basis of accounting in preparing the annual financial statements.
Environment
President Petroleum ensures that it understands and effectively manages the actual and potential
environmental impact of its current and future activities. All local and national environmental
regulations are observed in the countries in which the Group operates.
Principal Risks and Uncertainty Facing the Company
The principal risks and uncertainty arise first from unsuccessful drilling. The risks fall into three
main areas:
- Although seismic data may indicate the possibility of a resource, a test drilling may
reveal that there is no significant oil or gas.
- Detailed evaluation after the test drilling may demonstrate that, after production costs,
the well is not commercially viable.
- Before production commences unforeseen technical problems may result in cost
overruns that make the well uneconomic.
These risks are potentially mitigated by geological analysis prior to significant expenditure being
incurred.
Once a well is in production the principal risks and uncertainty from operating the well are:
- Environmental objections causing the well to be shut in.
- Technical failure of the plant causing significant down time when the well is not
producing.
These risks are mitigated by managing our responsibilities as operator.
{ 1 1 }
Directors’Report
A key focus of the Company’s strategy is to pursue acquisition opportunities. There is a potential
risk of executing an acquisition which subsequently fails to meet the Company’s value criteria. To
mitigate this risk, the Company has assembled a management team with appropriate skills and
experiences in identifying and executing value enhancing transactions.
Payment Policy and Practice
It is Company and Group policy to settle all debts with creditors on a timely basis and in accordance
with the terms of credit agreed with each supplier. Normal payment terms are 30 days or less. The
Group had no trade creditors overdue at 31 December 2010. The average creditor days were 78
(2009: 16). Average creditor days are calculated on year-end creditors against purchases in the
year. 2010 average days are higher than usual due to capital costs in respect of drilling in progress
as at the year end.
Financial Risk Management Objectives and Policies
Exchange rate risk
The Group has principally financed its operations from equity issues raised in pounds sterling.
Pounds sterling have been converted to US Dollars and Australian Dollars to match expected
expenditure plans. This principally consists of drilling of Kafoury 3 in Louisiana and Northumberland
2 in South Australia.
The Group has oil and gas production in the US and receives revenue in US Dollars. Currently
planned Group expenditures are largely in US or Australian Dollars and the Group mitigates
currency risk by holding cash reserves in those two currencies. Sterling is retained for central
corporate costs.
Price risk
The Group’s financial performance is related to oil and gas prices. The Group reviews its financing
requirements and its hedging policies when required. At present the Directors believe there is no
requirement to enter into new hedging contracts for current production.
Third Party Indemnities
The Group has taken out Directors and Officers liability insurance.
Related Parties
The Group has entered into related party transactions, the details of which are outlined in
note 31.
{ 1 2 }
Directors’Report
Auditor
Each of the persons who is a Director at the date of approval of this annual report confirms that:
• so far as the Director is aware, there is no relevant audit information of which the
company’s auditor is unaware; and
• theDirectorhastakenallthestepsthatheoughttohavetakenasaDirectorinorder
to make himself aware of any relevant audit information and to establish that the
Company’s auditor is aware of that information.
This confirmation is given and should be interpreted in accordance with the provisions of
Section 418 of the Companies Act 2006.
Deloitte LLP have expressed their willingness to continue in office as auditor and a resolution to
reappoint them will be proposed at the forthcoming Annual General Meeting.
Annual General Meeting
Attention is drawn to the Notice of Meeting enclosed with this Annual Report which sets out the
resolutions to be proposed at the forthcoming Annual General Meeting.
The Annual General Meeting will be held on 15 June 2011 at 11:00 a.m.
ON BEHALF OF THE BOARD
Stephen Gutteridge
Chairman
27 April 2011

{ 1 3 }
Directors’Remuneration Report (unaudited)
Whilst the Company is not required to present a Directors’ Remuneration Report, as it is not
subject to the Listing Rules of the Financial Services Authority nor the requirements of Schedule 8
of the Large and Medium-sized Companies and Groups (Accounts and Reports) Regulations
2008, AIM notice 36 states that the annual accounts must provide disclosure of directors’
remuneration for the year by each director. The Company has chosen to present this information
in a separate Directors’ Remuneration Report here.
The current Directors are:
Stephen Gutteridge - Executive Chairman
Stephen Gutteridge has 30 years’ experience of the energy sector with Shell, Amerada Hess,
Seeboard and the International Petroleum Exchange. He has held Board positions as Chairman,
Executive Director and Non-Executive Director in a number of companies. He is currently a
Director of TQ Group Ltd and Fulcrum Utility Services Limited.
Benjamin Wilkinson - Finance Director
Ben Wilkinson is a Chartered Accountant and holds a Bachelor of Science in Economics. After
qualifying with BDO Stoy Hayward, he joined ABN AMRO (subsequently Royal Bank of Scotland)
as an Oil & Gas Corporate Finance banker. He joined President Petroleum from Levine Capital
Management Advisors Limited.
Dr. Michael Cochran - Exploration Director
Mike Cochran has over 40 years’ experience of the oil and gas business. Previously he was
Senior Vice-President, Strategy and Planning and Head of Worldwide Exploration for Anadarko
Petroleum Corporation. Prior to his time at Anadarko, Mike was with Gulf Oil Company in Africa,
South America and the US.
John Hamilton - Non-Executive Director and Chairman of Remuneration Committee
John Hamilton is Managing Director of Levine Capital Management Advisors Limited and was
previously Group Finance Director of Imperial Energy Corporation PLC, until January 2009. Prior
to joining Imperial Energy, John held senior positions at ABN AMRO.
David Wake-Walker - Non-Executive Director and Chairman of Audit Committee
David Wake-Walker spent over 25 years in financial services management, principally in
corporate banking, prior to taking on a number of private equity, trading and corporate advisory
roles. He has served as a non-executive Director for numerous companies, both in the UK and
overseas, including as Chairman.
{ 1 4 }
Directors’Remuneration Report (unaudited)
Remuneration Committee
The Remuneration Committee’s primary objective is to provide recommendations to the Board on
the Group’s remuneration policies and to determine the remuneration of the Executive Directors
and other key employees. The Remuneration Committee comprises John Hamilton (Chairman),
David Wake-Walker and Stephen Gutteridge. Mr Gutteridge does not participate in any decision
affecting his own remuneration. Other Directors may be invited to attend meetings of the
Remuneration Committee but do not participate in any decision affecting their own remuneration.
The Remuneration Committee meets as necessary, and during the year met formally five times.
All committee members were present at these meetings.
Remuneration Policy
The Group’s policy is to maintain levels of remuneration so as to attract, motivate and retain
Directors and other key employees of the highest calibre who can contribute their experience and
views to the Group’s strategy and operations. Individual remuneration packages are structured to
align rewards with the performance of the Group and the interests of shareholders.
Directors’ Terms, Conditions and Remuneration
The Directors have been engaged under the terms of letters of appointment. With the exception
of Stephen Gutteridge, their engagements can be terminated upon three months’ notice by either
party. Mr Gutteridge’s engagement can be terminated upon six months’ notice by either party,
except in the event of a change of control when the Group is required to give twelve months’
notice. Re-appointment is subject to the Company’s Articles of Association, which provide for
retirement by rotation every three years. For the year ended 31 December 2010, the Directors’
remuneration comprised a basic salary and the granting of share options. There were no taxable
benefits or payments to pension schemes other than BUPA payments of US$14,880 in respect
of two years of private health cover for the benefit of Stephen Gutteridge.
Salary
The remuneration of Directors is set out as below.
Note 2010 2009
US$000 US$000
Stephen Gutteridge 261 283
Angelo Baskaran (resigned 9 February 2011) a 164 165
Dr. Michael Cochran b 121 10
John Hamilton b 46 4
David Wake-Walker c 58 59
Christopher Hopkinson (resigned 24 September 2010) 29 3
Peter Clutterbuck (resigned 1 December 2009) - 59
679 583
{ 1 5 }
Directors’Remuneration Report (unaudited)
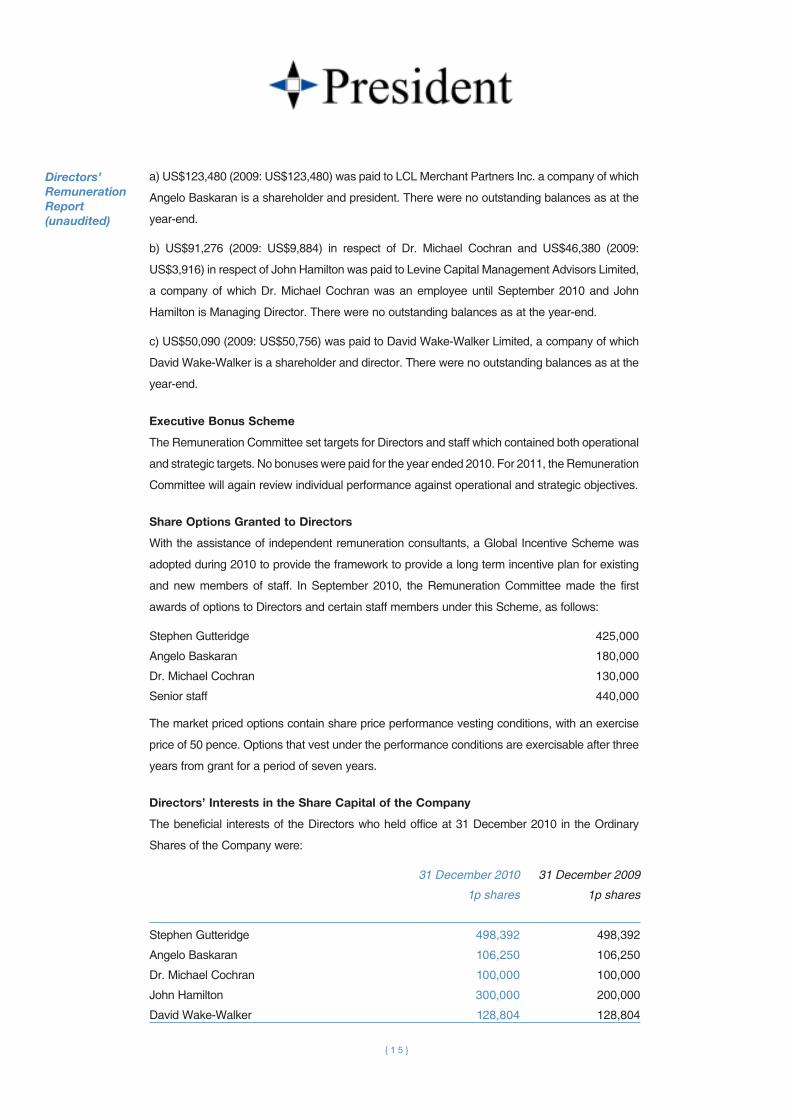
a) US$123,480 (2009: US$123,480) was paid to LCL Merchant Partners Inc. a company of which
Angelo Baskaran is a shareholder and president. There were no outstanding balances as at the
year-end.
b) US$91,276 (2009: US$9,884) in respect of Dr. Michael Cochran and US$46,380 (2009:
US$3,916) in respect of John Hamilton was paid to Levine Capital Management Advisors Limited,
a company of which Dr. Michael Cochran was an employee until September 2010 and John
Hamilton is Managing Director. There were no outstanding balances as at the year-end.
c) US$50,090 (2009: US$50,756) was paid to David Wake-Walker Limited, a company of which
David Wake-Walker is a shareholder and director. There were no outstanding balances as at the
year-end.
Executive Bonus Scheme
The Remuneration Committee set targets for Directors and staff which contained both operational
and strategic targets. No bonuses were paid for the year ended 2010. For 2011, the Remuneration
Committee will again review individual performance against operational and strategic objectives.
Share Options Granted to Directors
With the assistance of independent remuneration consultants, a Global Incentive Scheme was
adopted during 2010 to provide the framework to provide a long term incentive plan for existing
and new members of staff. In September 2010, the Remuneration Committee made the first
awards of options to Directors and certain staff members under this Scheme, as follows:
Stephen Gutteridge 425,000
Angelo Baskaran 180,000
Dr. Michael Cochran 130,000
Senior staff 440,000
The market priced options contain share price performance vesting conditions, with an exercise
price of 50 pence. Options that vest under the performance conditions are exercisable after three
years from grant for a period of seven years.
Directors’ Interests in the Share Capital of the Company
The beneficial interests of the Directors who held office at 31 December 2010 in the Ordinary
Shares of the Company were:
31 December 2010 31 December 2009
1p shares 1p shares
Stephen Gutteridge 498,392 498,392
Angelo Baskaran 106,250 106,250
Dr. Michael Cochran 100,000 100,000
John Hamilton 300,000 200,000
David Wake-Walker 128,804 128,804

{ 1 6 }
Directors’Remuneration Report (unaudited)
There has been no change in the interest of any Director between 1 January 2011 and the date
of this report, save that Ben Wilkinson (appointed Finance Director 14 February 2011) is the
beneficial holder of 40,000 Ordinary Shares.
During 2010, the highest mid-market price of the Company’s shares was 96.0p and the lowest
was 51.5p. The year-end price was 87.5p.
This report was approved by the Board on 27 April 2011 and was signed on its behalf by:
John Hamilton
Chairman of the Remuneration Committee
27 April 2011
{ 1 7 }
It is the objective of the Board to maintain a high standard of Corporate Governance. As an AIM
listed company, full compliance with the Combined Code is not a formal obligation. The Group
has, however, sought to adopt the provisions of the code that are appropriate to its size and
organisation and to establish frameworks for the achievement of this objective.
The Board
President Petroleum’s business is international in scope and carries political, commercial and
technical risks. Accordingly, particular attention is paid to the composition and balance of the
Board to ensure that it has wide experience of the sector and regulatory environment in which
President Petroleum operates and appropriate financial and risk management skills. In each
Board appointment, whether executive or non-executive, the Board considers that objectivity and
integrity, as well as skills, experience and ability which will assist the Board in its key functions,
are pre-requisites for appointment. The Board currently comprises the Chairman, two other
executive Directors and two non-executive Directors.
Board Committees
The audit committee comprises David Wake-Walker (Chairman) and John Hamilton. The
remuneration committee comprises John Hamilton (Chairman), David Wake-Walker and
Stephen Gutteridge.
The role of the Audit Committee includes:
- monitoring the integrity of the financial statements of the Group and formal
announcements relating to the Group’s financial performance and reviewing any
significant financial reporting judgments contained in them
- reviewing accounting policies, accounting treatments and disclosures in financial
reports
- reviewing the Group’s internal financial controls and internal control and risk
management systems
- overseeing the Group’s relationship with the external auditor, including making
recommendations to the Board as to the appointment or reappointment of the external
auditor, reviewing their terms of engagement and monitoring the external auditor’s
independence, objectivity and effectiveness, and
- reviewing the Group’s whistle blowing procedures and ensuring that arrangements are
in place for the proportionate and independent investigation of possible improprieties in
respect of financial reporting and other matters and for appropriate follow up action.
The role of the Remuneration Committee includes:
- determining and recommending to the Board the remuneration policy for the executive
Directors and other senior employees; the non-executive Directors’ remuneration is set
by the Board upon the recommendation of the Remuneration Committee.
Corporate Governance Statement

{ 1 8 }
Corporate Governance Statement
Board Committees (continued)
- within the terms of the agreed policy, determining the total individual remuneration
package for each executive Director
- determining the level of awards made under the Company’s share option plans and any
long-term incentive plan and the performance conditions which are to apply
- determining bonuses payable under any cash or share bonus scheme adopted by
the Group
- determining the vesting awards under any long term incentive plan put in place by the
Group and the exercise of share options, and
- determining the policy for pension arrangements, service agreements and termination
payments for executive Directors.
Relations with Shareholders
Communications with shareholders are given high priority by the Board. President Petroleum
sends its annual report and accounts to all shareholders. The Company also sends its June
interim statement to all shareholders. The Group endeavours to maintain a regular dialogue with
institutions and analysts particularly in relation to interim and full year results. The Board welcomes
as many investors as possible to the Annual General Meeting and invites discussion on issues
facing the Group. The Company maintains an up to date website.
Internal Controls
The Board acknowledges its responsibility for the Group’s system of internal control and for
reviewing its effectiveness. The Group’s system of internal control is designed to manage rather
than eliminate the risk of failure to achieve business objectives and can only provide reasonable
but not absolute assurance against material misstatement or loss.
As an oil and gas exploration and production company with current operations concentrated in
the US and Australia, President Petroleum is, by virtue of the nature of its business and the
countries in which it operates, subject to a variety of business risks.
The Group’s system of internal control plays a critical role in managing the risks towards the
achievement of President Petroleum’s corporate vision and objectives and is also central to
safeguarding President Petroleum’s shareholders’ interests and the Group’s assets. An ongoing
process has been established for identifying, evaluating and managing the significant risks faced
by the Group.
Bribery Act
The board is committed to compliance with the provisions of the Bribery Act 2010 once they
become law.
{ 1 9 }
Statement of Directors’ Responsibilities
The Directors are responsible for preparing the Annual Report and the financial statements in
accordance with applicable law and regulations.
Company law requires the Directors to prepare financial statements for each financial year. Under
that law the Directors are required to prepare the Group financial statements in accordance with
International Financial Reporting Standards (IFRSs) as adopted by the European Union and
Article 4 of the IAS Regulation and have elected to prepare the parent company financial
statements in accordance with United Kingdom Generally Accepted Accounting Practice (United
Kingdom Accounting Standards and applicable law). Under company law the Directors must not
approve the accounts unless they are satisfied that they give a true and fair view of the state of
affairs of the Company and of the profit or loss of the Company for that period.
In preparing the Parent Company financial statements, the Directors are required to:
• selectsuitableaccountingpoliciesandthenapplythemconsistently;
• makejudgmentsandaccountingestimatesthatarereasonableandprudent;
• preparethefinancialstatementsonthegoingconcernbasisunlessitisinappropriateto
presume that the Company will continue in business.
In preparing the Group financial statements, International Accounting Standard 1 requires that the
Directors:
• properlyselectandapplyaccountingpolicies;
• presentinformation,includingaccountingpolicies,inamannerthatprovidesrelevant,
reliable, comparable and understandable information;
• provideadditionaldisclosureswhencompliancewiththespecificrequirementsinIFRSs
are insufficient to enable users to understand the impact of particular transactions, other
events and conditions on the entity’s financial position and financial performance; and
• makeanassessmentoftheCompany’sabilitytocontinueasagoingconcern.
The Directors are responsible for keeping adequate accounting records that are sufficient to show
and explain the Company’s transactions and disclose with reasonable accuracy at any time the
financial position of the Company and enable them to ensure that the financial statements comply
with the Companies Act 2006. They are also responsible for safeguarding the assets of the
Company and hence for taking reasonable steps for the prevention and detection of fraud and
other irregularities.
The Directors are responsible for the maintenance and integrity of the corporate and financial
information included on the Company’s website. Legislation in the United Kingdom governing the
preparation and dissemination of financial statements may differ from legislation in other
jurisdictions.

{ 2 0 }
Statement of Directors’ Responsibilities
Responsibility Statement
We confirm that to the best of our knowledge:
• thefinancialstatements,prepared inaccordancewith therelevant financialreporting
framework, give a true and fair view of the assets, liabilities, financial position and profit
or loss of the Company and the undertakings included in the consolidation taken as a
whole; and
• themanagementreport,whichisincorporatedintotheDirectors’report,includesafair
review of the development and performance of the business and the position of the
Company and the undertakings included in the consolidation taken as a whole, together
with a description of the principal risks and uncertainties that they face.
Stephen Gutteridge Benjamin Wilkinson
Chairman Finance Director
27 April 2011 27 April 2011
{ 2 1 }
Independent Auditor’s Report
INDEPENDENT AUDITOR’S REPORT TO THE MEMBERS OF PRESIDENT PETROLEUM
COMPANY PLC
We have audited the financial statements of President Petroleum Company PLC for the year
ended 31 December 2010 which comprise the Consolidated Statement of Comprehensive Income,
the Consolidated Statement of Financial Position, the Consolidated Statement of Changes in
Equity, the Consolidated Statement of Cash Flows, the Parent Company Balance Sheet and the
related notes 1 to 31 of the Consolidated Accounts and 1 to 8 of the Parent Company Accounts.
The financial reporting framework that has been applied in the preparation of the Group financial
statements is applicable law and International Financial Reporting Standards (IFRSs) as adopted
by the European Union. The financial reporting framework that has been applied in the preparation
of the Parent Company financial statements is applicable law and United Kingdom Accounting
Standards (United Kingdom Generally Accepted Accounting Practice).
This report is made solely to the Company’s members, as a body, in accordance with Chapter 3
of Part 16 of the Companies Act 2006. Our audit work has been undertaken so that we might state
to the Company’s members those matters we are required to state to them in an auditor’s report
and for no other purpose. To the fullest extent permitted by law, we do not accept or assume
responsibility to anyone other than the Company and the Company’s members as a body, for our
audit work, for this report or for the opinions we have formed.
Respective responsibilities of directors and auditor
As explained more fully in the Directors’ Responsibilities Statement, the Directors are responsible
for the preparation of the financial statements and for being satisfied that they give a true and fair
view. Our responsibility is to audit and express an opinion on the financial statements in
accordance with applicable law and International Standards on Auditing (UK and Ireland). Those
standards require us to comply with the Auditing Practices Board’s Ethical Standards for
Auditors.
Scope of the audit of the financial statements
An audit involves obtaining evidence about the amounts and disclosures in the financial
statements sufficient to give reasonable assurance that the financial statements are free from
material misstatement, whether caused by fraud or error. This includes an assessment of:
whether the accounting policies are appropriate to the Group’s and the Parent Company’s
circumstances and have been consistently applied and adequately disclosed; the reasonableness
of significant accounting estimates made by the Directors; and the overall presentation of the
financial statements. In addition, we read all the financial and non-financial information in the
annual report to identify material inconsistencies with the audited financial statements. If we
become aware of any apparent material misstatements or inconsistencies we consider the
implications for our report.
{ 2 2 }
Independent Auditor’s Report
Opinion on financial statements
In our opinion:
• thefinancialstatementsgiveatrueandfairviewofthestateoftheGroup’sandofthe
Parent Company’s affairs as at 31 December 2010 and of the Group’s loss for the year
then ended;
• theGroupfinancialstatementshavebeenproperlypreparedinaccordancewithIFRSs
as adopted by the European Union;
• theParentCompanyfinancialstatementshavebeenproperlypreparedinaccordance
with United Kingdom Generally Accepted Accounting Practice; and
• thefinancialstatementshavebeenpreparedinaccordancewiththerequirementsofthe
Companies Act 2006.
Opinion on other matter prescribed by the Companies Act 2006
In our opinion the information given in the Directors’ Report for the financial year for which the
financial statements are prepared is consistent with the financial statements.
Matters on which we are required to report by exception
We have nothing to report in respect of the following matters where the Companies Act 2006
requires us to report to you if, in our opinion:
• adequateaccountingrecordshavenotbeenkeptbytheParentCompany,orreturns
adequate for our audit have not been received from branches not visited by us; or
• theParentCompany financial statementsarenot in agreementwith theaccounting
records and returns; or
• certaindisclosuresofDirectors’remunerationspecifiedbylawarenotmade;or
• wehavenotreceivedalltheinformationandexplanationswerequireforouraudit.
BEvAN WHITEHEAD (SENIOR STATUTORY AUDITOR)
FOR AND ON BEHALF OF DELOITTE LLP
CHARTERED ACCOUNTANTS AND STATUTORY AUDITOR
LONDON, UK
27 April 2011

{ 2 3 }
The accompanying accounting policies and notes form an integral part of these financial statements.
Consolidated Statement of Comprehensive IncomeYear ended 31 December 2010
2010 2009
Note US$000 US$000
Continuing Operations
Revenue 4 3,439 3,931
Royalties, overrides and other interests - (850)
Net revenue 3,439 3,081
Cost of sales 5 (5,320) (3,287)
Gross loss (1,881) (206)
Administrative expenses 6 (2,416) (1,826)
Operating loss before impairment charge (4,297) (2,032)
Impairment charge 7 (2,949) (1,220)
Loss on sale of non-current assets - (180)
Operating loss (7,246) (3,432)
Investment income –
(Loss)/gain on derivative financial instruments 8 (23) 168
Fair value through profit and loss 8 - 353
Interest on bank deposits 86 18
Realised gains on translation of foreign currencies 691 -
Finance costs – interest payable on loan 21 (141) (751)
– release of debtor following
renegotiation of loan 21 - (546)
Loss before tax 9 (6,633) (4,190)
Income tax 11 (101) (181)
Loss for the period from continuing operations (6,734) (4,371)
Other comprehensive income, net of tax
Exchange differences on translation of foreign operations (3) 711
Total comprehensive income for the period attributable
to the equity holders of the parent (6,737) (3,660)
Loss per share 12 US cents US cents
Basic earnings per share from continuing operations (11.6) (23.5)
Diluted earnings per share from continuing operations (11.6) (23.5)
{ 2 4 }
The accompanying accounting policies and notes form an integral part of these financial statements.
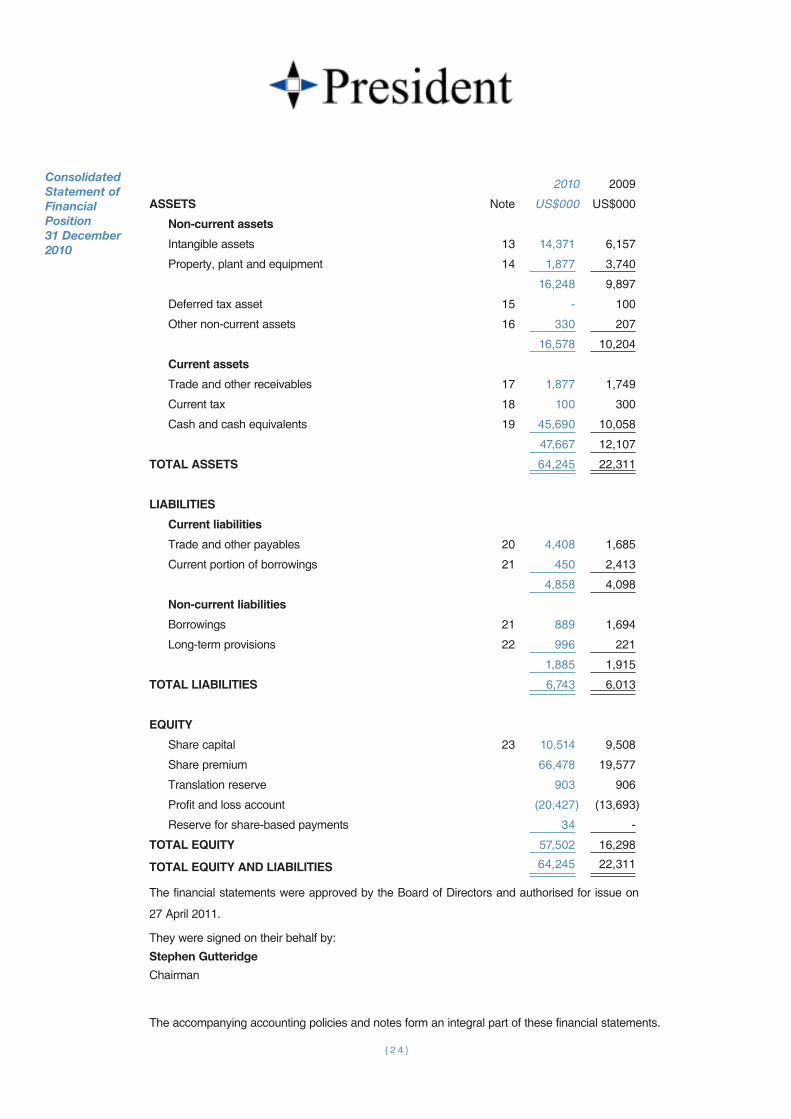
Consolidated Statement of Financial Position 31 December 2010
2010 2009
ASSETS Note US$000 US$000
Non-current assets
Intangible assets 13 14,371 6,157
Property, plant and equipment 14 1,877 3,740
16,248 9,897
Deferred tax asset 15 - 100
Other non-current assets 16 330 207
16,578 10,204
Current assets
Trade and other receivables 17 1,877 1,749
Current tax 18 100 300
Cash and cash equivalents 19 45,690 10,058
47,667 12,107
TOTAL ASSETS 64,245 22,311
LIABILITIES
Current liabilities
Trade and other payables 20 4,408 1,685
Current portion of borrowings 21 450 2,413
4,858 4,098
Non-current liabilities
Borrowings 21 889 1,694
Long-term provisions 22 996 221
1,885 1,915
TOTAL LIABILITIES 6,743 6,013
EQUITY
Share capital 23 10,514 9,508
Share premium 66,478 19,577
Translation reserve 903 906
Profit and loss account (20,427) (13,693)
Reserve for share-based payments 34 -
TOTAL EQUITY 57,502 16,298
TOTAL EQUITY AND LIABILITIES 64,245 22,311
The financial statements were approved by the Board of Directors and authorised for issue on
27 April 2011.
They were signed on their behalf by:
Stephen Gutteridge
Chairman

{ 2 5 }
The accompanying accounting policies and notes form an integral part of these financial statements.
Consolidated Statement of Changes in Equity Year ended 31 December 2010
Share capital
US$000
Share premium US$000
Translation reserve
US$000
Profit and loss account US$000
Reserve for Share-
based Payments
US$000Total
US$000
Balance at 1 January 2009 9,026 8,372 195 (10,256) 1,756 9,093
Share-based payments - - - - 55 55
Shares issued on placing and open offer 482 11,561 - - - 12,043
Costs of issue - (356) - - - (356)
Compensation for cancellation of
share options and warrants
Paid to Macquarie Bank - - - - (492) (492)
Paid to Directors - - - - (256) (256)
Paid to staff - - - - (112) (112)
National Insurance costs - - - - (17) (17)
Transfer following cancellation of
share options and warrants - - - 934 (934) -
Transactions with the owners 482 11,205 - 934 (1,756) 10,865
Loss for the year - - - (4,371) - (4,371)
Other comprehensive income
exchange differences on
translation - - 711 - - 711
Total comprehensive income for the year - - 711 (4,371) - (3,660)
Balance at 1 January 2010 9,508 19,577 906 (13,693) - 16,298
Share-based payments - - - - 34 34
Shares issued on placing and
open offer 1,006 49,310 - - - 50,316
Costs of issue - (2,409) - - - (2,409)
Transactions with the owners 1,006 46,901 - - 34 47,941
Loss for the year - - - (6,734) - (6,734)
Other comprehensive income
exchange differences on
translation - - (3) - - (3)
Total comprehensive income for
the year - - (3) (6,734) - (6,737)
Balance at 31 December 2010 10,514 66,478 903 (20,427) 34 57,502

{ 2 6 }
The accompanying accounting policies and notes form an integral part of these financial statements.
Consolidated Statement of Cash Flows Year ended 31 December 2010
2010 2009
US$000 US$000
Cash flows from operating activities - (Note 25)
Cash generated by operating activities 3,305 2,994
Interest received 86 18
Taxes refunded 200 472
Taxes paid - (177)
3,591 3,307
Cash flows from investing activities
Expenditure on exploration and evaluation assets (10,710) (4,784)
Expenditure on development and production assets (Excluding increase in provision for decommissioning) (1,261) (15)
Deferred consideration in respect of
East White Lake assets 1,400 -
Deposits with state authorities (157) (12)
(10,728) (4,811)
Cash flows from financing activities
Proceeds from issue of shares (net of expenses) 47,907 11,687
Compensation for cancellation of share options and warrants - (877)
Proceeds from sale of non-current assets 223
Drawdown of bank loan - 1,118
Repayment of bank loan capital (4,027) (4,460)
Payment of bank loan interest (141) (343)
43,739 7,348
Net increase in cash and cash equivalents 36,602 5,844
Opening cash and cash equivalents at beginning of year 10,058 3,875
Exchange gains on cash and cash equivalents (970) 339
Closing cash and cash equivalents 45,690 10,058
{ 2 7 }
Notes to the Consolidated Accounts Year ended 31 December 2010
1. General information
Corporate status
President Petroleum Company PLC is a company incorporated in Great Britain under
the Companies Act 2006. The address of the registered office is given on page 2. The
nature of the Group’s operations and its principal activities are set out in note 4 and in
the Directors’ Report on pages 7 to 12. The Company is quoted on the AIM market of
the London Stock Exchange (ticker: PPC), and is headquartered in London, UK, with
offices in Clarkston, Michigan, US.
Presentation currency
The presentation currency of the Group is United States (US) Dollars. The US Dollar has
been adopted as the Group’s presentation currency as the trading and the majority of
the Group’s other transactions and assets are in US Dollars. The Group’s accounting
policy on foreign currencies is detailed in note 2 i).
2. Significant accounting policies
a) Basis of preparation
The Group financial statements have been prepared in accordance with European
Union (EU) endorsed IFRSs, International Financial Reporting Interpretations Committee
(IFRIC) interpretations and with those parts of the Companies Act 2006 applicable to
companies reporting under IFRS. All accounting standards and interpretations issued by
the International Accounting Standards Board and the IFRIC effective at the time of
preparing these financial statements have been applied. The Group financial statements
have been prepared under the historical cost convention except for derivative financial
instruments that have been measured at fair value.
The consolidated financial statements are presented in accordance with
IAS 1: Presentation of financial statements (Revised 2007).
A summary of the significant Group accounting policies adopted in the preparation of the
financial statements is set out below. These policies have been consistently applied to
all the years presented, unless otherwise stated.

{ 2 8 }
Notes to the Consolidated Accounts Year ended 31 December 2010
2. Significant accounting policies (continued)
a) Basis of preparation (continued)
The following Standards and Interpretations have been issued, but are not yet effective
and have not been early adopted by the Group:
IFRS 7 (amended) Disclosures – Transfers of Financial Assets
IFRS 9 Financial instruments
IAS 24 (revised 2009) Related party disclosures
IAS 28 (revised 2008) Investments in associates
IAS 32 (amended) Classification of rights issues
IFRIC 14 (amended) Prepayment of a minimum funding requirement
IFRIC 17 Distributions of non-cash assets to owners
IFRIC 19 Extinguishing financial liabilities with equity instruments
Improvements to IFRSs (May 2010)
The above Standards and Interpretations are not expected to have any material impact
on the Group’s financial statements.
Improvements to IFRS 2009, IFRS 3 (Revised), IAS 27 (Revised), IAS 28 (revised) and
IFRIC 17 have been adopted during the year.
b) Basis of accounting
The preparation of financial statements in conformity with IFRS requires management to
make judgments, estimates and assumptions that affect the application of policies and
reported amounts of assets and liabilities, income and expenses. The estimates and
associated assumptions are based on historical experience and various other factors
that are believed to be reasonable under the circumstances. Actual results may differ
from these estimates. The estimates and underlying assumptions are reviewed on an
ongoing basis. Revisions to accounting estimates are recognised in the period in which
the estimate is revised, if the revision affects only that period, or in the period of the
revision and future periods, if the revision affects both current and future periods.
The accounting policies set out below have been applied to all periods presented.

{ 2 9 }
Notes to the Consolidated Accounts Year ended 31 December 2010
2. Significant accounting policies (continued)
c) Basis of consolidation
The Group financial statements include the results of the Company and all of its
subsidiary undertakings. A subsidiary is an entity controlled, directly or indirectly, by the
Group. Control is the power to govern the financial and operating policies of the entity so
as to obtain benefits from its activities. The financial statements of subsidiaries are
included in the Group financial statements from the date that control commences until
the date that control ceases. There are no unrealised gains and losses or income and
expenses arising from intra group transactions. Intra group balances are eliminated in
preparing the consolidated financial statements.
The Group’s exploration, development and production activities may be conducted as
co-licensee, in jointly controlled operations with other companies. Where the Group is
party to a jointly controlled operation, which is not an entity, the Group accounts directly
for its part of the income and expenditure, assets, liabilities and cash flows.
d) Going concern
The accounts have been prepared under the going concern basis.
The Company’s business activities, together with the factors likely to affect its future
development, performance and position are set out in the Director’s Report on pages 7
to 12. The financial position of the Company, its cash flows, liquidity position and
borrowing facilities are described in the Financial Summary on page 3. In addition,
note 28 to the financial statements includes the Company’s objectives, policies and
processes for managing its capital; its financial risk management objectives; details
of its financial instruments and hedging activities; and its exposures to credit risk and
liquidity risk.
The Company has considerable financial resources and as a consequence, the Directors
believe that the Company is well placed to manage its business risks successfully
despite the current uncertain economic outlook and to meet all commitments as they fall
due. Further details of the Group’s commitments are set out in note 27.
The Directors have a reasonable expectation that the Company has adequate resources
to continue in operational existence for the foreseeable future. Thus they continue to
adopt the going concern basis of accounting in preparing the annual financial
statements.
e) Revenue recognition
Revenue represents sales of oil and gas during the year and is recognised when title
passes to the customer, being the date it leaves the well site. Royalty payments are
recognised as a cost of sale when the related production revenue is recognised. Interest
revenue is accrued on a time basis, by reference to the principal outstanding and at the
effective interest rate applicable.

{ 3 0 }
Notes to the Consolidated Accounts Year ended 31 December 2010
2. Significant accounting policies (continued)
f ) Oil and natural gas exploration and development expenditure
The Group adopts the successful efforts method of accounting for exploration, evaluation
and development costs.
Exploration and evaluation expenditure – intangible assets
All licence acquisition, exploration and evaluation costs are initially capitalised in cost
centres by well, field or exploration area, as appropriate. Directly attributable expenditure
is capitalised insofar as it relates to specific exploration and evaluation activities.
Prelicence costs are expensed in the year in which they are incurred. Exploration and
evaluation costs are then written off unless commercial reserves have been established
or the determination process has not been completed and there are no indications
of impairment.
Exploration and evaluation expenditure is not amortised. If the criteria for recognition of
an exploration and evaluation asset are met, it is classified as either a tangible or
intangible asset, depending on the nature of the asset. When it is determined that such
cost will be recouped through successful development and exploitation or alternatively
by sale of the interest, expenditure will be transferred to Production Assets.
Development and production assets – property, plant and equipment
All field development costs and transferred exploration and evaluation costs are
capitalised as property, plant and equipment. Property, plant and equipment related to
production activities are amortised in accordance with the Group’s Depletion and
Amortisation accounting policy. The Directors carry out regular reviews of development
and production assets and assess the need for provisions for impairment.
Depreciation, depletion and amortisation
All capitalised expenditure carried within each field is depleted from the commencement
of production on a unit of production basis, over the relevant proved developed reserves.
Changes in the estimates of commercial reserves or future field development costs are
dealt with prospectively.
Impairment
Exploration and evaluation assets are reviewed regularly for indications of impairment
and costs are written off where circumstances indicate that the carrying value may not
be recoverable. Where there has been a change in economic conditions that indicates a
possible impairment in a discovery field, the recoverability of the net book value relating
to that field is assessed.

{ 3 1 }
Notes to the Consolidated Accounts Year ended 31 December 2010
2. Significant accounting policies (continued)
f ) Oil and natural gas exploration and development expenditure (continued)
At each reporting date, the Group assesses whether there is any indication that its
exploration and evaluation assets have been impaired. If any such indication exists, the
recoverable amount of the asset is estimated in order to determine the extent of the
impairment, if any. If it is not possible to estimate the recoverable amount of the individual
asset, the recoverable amount of the cash-generating unit to which the asset belongs is
determined. The recoverable amount of an asset or a cash-generating unit is the higher
of its fair value less costs to sell and its value in use. The value in use is the present value
of the future cash flows expected to be derived from an asset or cash-generating unit.
This present value is discounted using a pre-tax rate that reflects current market
assessments of the time value of money and of the risks specific to the asset, for which
future cash flow estimates have not been adjusted. If the recoverable amount of an asset
is less than its carrying amount, the carrying amount of the asset is reduced to its
recoverable amount. That reduction is recognised as an impairment loss in the statement
of comprehensive income.
An impairment loss relating to assets carried at cost less any accumulated depreciation
or amortisation is recognised immediately in the statement of comprehensive income. If
an impairment loss subsequently reverses, the carrying amount of the asset is increased
to the revised estimate of its recoverable amount but limited to the carrying amount that
would have been determined had no impairment loss been recognised in prior years.
The reversal of an impairment loss is recognised in the statement of
comprehensive income.
g) Decommissioning
Where a material liability exists for the removal of production facilities and site restoration
at the end of the productive life of a field, a provision for decommissioning is recognised.
The amount recognised is the present value of future expenditure determined in
accordance with local conditions and requirements. Property, plant and equipment in an
amount equivalent to the provision are created and depreciated on a unit of
production basis.
h) Property, plant and equipment
Property, plant and equipment are stated at cost less accumulated depreciation and any
provision for impairment in value. The Group recognises in the carrying amount of
property, plant and equipment the subsequent costs of replacing part of such items when
they are expected to generate future economic benefits and such costs can be reliably
determined. The carrying value of a part is derecognised when it is replaced. All other
costs are recognised in the statement of comprehensive income as an expense as they
are incurred.

{ 3 2 }
Notes to the Consolidated Accounts Year ended 31 December 2010
2. Significant accounting policies (continued)
h) Property, plant and equipment (continued)
Depreciation is provided on a straight-line basis to write off the cost, less the estimated
residual value, of property, plant and equipment (other than development and production
assets) over their estimated useful lives. Where parts of an item of plant and equipment
have separate lives, they are accounted for and depreciated as separate items.
Development and production assets are depreciated in accordance with the accounting
policy detailed in note 2 f).
The gain or loss arising on the disposal or retirement of an asset is determined as the
difference between the sales proceeds and the carrying amount of the asset and is
recognised as income or loss on sale.
i) Foreign currencies
Functional and presentation currency
The functional currency is the currency of the primary economic environment in which
an entity operates and is normally the currency in which an entity primarily generates and
expends cash. The Parent Company’s functional and presentation currency is pounds
sterling. The Group has chosen the US Dollar as its presentation currency based on the
fact that the Group’s primary transactions originate in US Dollars, these being amongst
others gas and oil sales and the procurement of the majority of the Group’s plant and
drilling services.
Transactions in foreign currencies are translated at the foreign exchange rate ruling at
the date of the transaction. All exchange differences on transactions in currencies other
than the individual entity’s functional currency are recognised as profit or loss in the year
in which they are incurred.
Monetary assets and liabilities that are denominated in foreign currencies at the balance
sheet date are translated at the exchange rate ruling at that date with any exchange
differences arising on retranslation being recognised as profit or loss in the statement of
comprehensive income. Non-monetary items that are measured at fair value in a foreign
currency are translated using the exchange rates at the date when the fair value was
determined. Any exchange differences are included in other comprehensive income.

{ 3 3 }
Notes to the Consolidated Accounts Year ended 31 December 2010
2. Significant accounting policies (continued)
i) Foreign currencies (continued)
Group companies
The results and financial position of all the Group entities (none of which has the
currency of a hyperinflationary economy) that have a functional currency different from
the presentation currency are translated into the presentation currency as follows:
- assets and liabilities for each balance sheet presented are translated at the closing
rate at the date of that balance sheet;
- income and expenses for each income statement are translated at average
exchange rates (unless this average is not a reasonable approximation of the
cumulative effect of the rates prevailing on the transaction dates, in which case
income and expenses are translated at the rate on the dates of the
transactions); and
- all resulting exchange differences are recognised as a separate component
of equity.
On consolidation, exchange differences arising from the translation of the net investment
in foreign operations are taken to shareholders’ equity as an other comprehensive income
or expense. When a foreign operation is partially disposed of or sold, exchange differences
that were recorded in equity are recognised in the statement of comprehensive income as
part of the gain or loss on sale.
Goodwill and fair value adjustments arising on the acquisition of a foreign entity are
treated as assets and liabilities of the foreign entity and translated at the closing rate.
j) Financial instruments
Cash and cash equivalents
Cash and cash equivalents comprise cash at bank and short-term deposits with an
original maturity of three months or less.
Trade payables and other creditors
Trade payables and other creditors are non-interest bearing and are initially recognised
at fair value net of transaction costs and subsequently measured at amortised cost under
the effective interest method.
Derivative financial instruments
The Group uses derivative financial instruments to manage its exposure to fluctuations
in oil and gas prices. Derivative financial instruments are stated at fair value. The Group
does not use hedge accounting. Gains or losses on derivatives are taken directly to the
statement of comprehensive income in the period.

{ 3 4 }
Notes to the Consolidated Accounts Year ended 31 December 2010
2. Significant accounting policies (continued)
j) Financial instruments (continued)
Equity
An equity instrument is any contract that evidences a residual interest in the assets of
the Group after deducting all of its liabilities. Equity instruments issued by the Company
are recorded as the proceeds received, net of direct issue costs, allocated between
share capital and share premium.
Accounting for financial assets
Financial assets are divided into the following categories:
- loans and receivables; and
- financial assets at fair value through profit or loss
Financial assets are assigned to the different categories on initial recognition, depending
on the characteristics of the instrument and its purpose. A financial instrument’s category
is relevant for the way it is measured and whether any resulting income and expenditure
are recognised in the statement of comprehensive income or directly in equity. See
note 28 h) for a summary of the Group’s financial assets by category. An assessment of
whether indications of impairment exist for a financial asset is made at least at each
reporting date. If there is indication of impairment, an impairment review is undertaken.
All income and expense relating to financial assets are recognised in the statement of
comprehensive income line item “finance costs” or “investment income”, respectively.
Loans and receivables are non-derivative financial assets with fixed or determinable
payments that are not quoted in an active market. At initial recognition these are
measured at fair value plus transaction costs, less provision for impairment, and
thereafter at amortised cost under the effective interest rate method. All finance costs
under the effective interest rate method are recognised in the statement of comprehensive
income. The Group’s trade and other receivables fall into this category of financial
instruments. Discounting, however, is omitted where the effect of discounting
is immaterial.
Significant receivables are considered for impairment on a case-by-case basis when
they are past due at the balance sheet date or when objective evidence is received that
a specific counterparty will default. All other receivables are reviewed for impairment in
groups, which are determined by reference to the industry and region or counterparty
and other available features of shared credit risk characteristics, if any.

{ 3 5 }
Notes to the Consolidated Accounts Year ended 31 December 2010
2. Significant accounting policies (continued)
k) Income taxes
Tax expense recognised in the statement of comprehensive income comprises the sum
of deferred tax and current tax not recognised in other comprehensive income or directly
in equity.
Current income tax assets and/or liabilities comprise those obligations to, or claims from,
fiscal authorities relating to the current or prior reporting periods that are unpaid at the
reporting date. Current tax is payable on taxable profit, which differs from profit or loss in
the financial statements.
Calculation of current tax is based on tax rates and tax laws that have been enacted or
substantively enacted by the end of the reporting period.
Deferred income taxes are calculated using the liability method on temporary differences.
Deferred tax is generally provided on the difference between the carrying amounts of
assets and liabilities and their tax bases. However, deferred tax is not provided on the
initial recognition of an asset or liability unless the related transaction is a business
combination or affects tax or accounting profit. Deferred tax on temporary differences
associated with shares in subsidiaries and joint ventures is not provided if reversal of
these temporary differences can be controlled by the Group and it is probable that
reversal will not occur in the foreseeable future. In addition, tax losses available to be
carried forward as well as other income tax credits to the Group are assessed for
recognition as deferred tax assets.
Deferred tax liabilities are provided in full, with no discounting. Deferred tax assets are
recognised to the extent that it is probable that the underlying deductible temporary
differences will be able to be offset against future taxable income.
Current and deferred tax assets and liabilities are calculated at tax rates that are
expected to apply to their respective period of realisation, provided that they are enacted
or substantively enacted at the balance sheet date. Changes in deferred tax assets or
liabilities are recognised as a component of tax expense in the statement of
comprehensive income, except where they relate to items that are charged or credited
directly to equity (such as the revaluation of land) in which case the related deferred tax
is also charged or credited directly to equity.
l) Share-based payments
The Group has applied the requirements of IFRS 2 Share-based Payment. All share-
based awards of the Group are equity settled as defined by IFRS 2. The fair value of
these awards has been determined at the date of grant of the award. This fair value,
adjusted annually by the Group’s estimate of the number of awards that will eventually
vest as a result of non-market conditions, is expensed uniformly over the vesting period.
The fair values are calculated using a Black Scholes option pricing model.
{ 3 6 }
Notes to the Consolidated Accounts Year ended 31 December 2010
2. Significant accounting policies (continued)
m) Operating leases
Rentals payable under operating leases are charged as an expense to the statement of
comprehensive income on a straight line basis over the terms of the relevant lease.
n) Segment reporting
An operating segment is a component of an entity that engages in business activities
from which it may earn revenues and incur expenses and whose results are regularly
reviewed by the Chief Operating Decision Maker. The Group operates in one product
segment which is the exploration and production of hydrocarbons. Segment information
is presented in accordance with IFRS 8 for all periods presented.
3. Critical accounting judgments and key sources of estimation uncertainty
In order to prepare the consolidated financial statements in conformity with IFRS,
management of the Group have to make estimates and judgments. The matters
described below are considered to be the most important in understanding the judgments
that are involved in preparing these statements and the uncertainties that could impact
the amounts reported in the results of operations, financial condition and cash flows.
Group accounting policies are described in Note 2.
Estimation of oil and gas reserves
Oil and gas reserves are key elements in the Group’s investment decision-making
process. They are also an important element in testing for impairment. Changes in
proved oil and gas reserves, particularly proved developed reserves, will affect unit-of-
production depreciation charges against income.
Proved oil and gas reserves are the quantities of oil and natural gas estimated by
management, and verified from time to time by industry experts that demonstrate with
reasonable certainty that they are recoverable in future years from known reservoirs under
existing economic and operating conditions, i.e. prices and costs as of the date the estimate
is made. Estimates of oil and gas reserves are inherently imprecise, require the application
of judgment and are subject to future revision. Accordingly, financial and accounting
measures (such as impairment charges, depreciation, depletion and amortisation charges
and decommissioning provisions) that are based on proved reserves are also subject to
change. Also future gas and oil prices affect the point at which the well becomes uneconomic
and the value of the future cash flows.
Proved reserves are estimated by reference to available reservoir and well information,
including production and pressure trends for producing reservoirs and, in some cases,
subject to definitional limits, to similar data from other producing reservoirs. Proved
reserves estimates are attributed to future development projects only where there is a
significant commitment to project funding and execution and for which applicable
governmental and regulatory approvals have been secured or are reasonably certain to
be secured. Furthermore, estimates of proved reserves only include volumes for which

{ 3 7 }
Notes to the Consolidated Accounts Year ended 31 December 2010
3. Critical accounting judgments and key sources of estimation uncertainty (continued)
Estimation of oil and gas reserves (continued)
access to market is assured with reasonable certainty. All proved reserves estimates are
subject to revision, either upward or downward, based on new information, such as from
development drilling and production activities or from changes in economic factors,
including product prices, contract terms or development plans. The prospective value of
the above assets is not fully carried in the statement of financial position, but unaudited
reserves quantities are detailed in the Chairman’s statement on page 3.
Impairment review
When assessing the carrying value of oil and gas producing wells included in tangible
assets the Company estimates future production levels and prices against predicted
production costs to assess the continuing economic viability of the well. For non-
producing assets included in intangible assets the cost of bringing the resource into
production needs to be assessed against the volumes, prices and operating costs
anticipated from estimated future production. The carrying value of assets subject to
impairment review is US$16 million at the balance sheet date.
Deferred tax assets
The assessment of the probability of future taxable income against which deferred tax
assets can be utilised is based on the Group’s latest approved budget forecast, which is
adjusted for significant non-taxable income and expenses and specific limits to the use
of any unused tax loss or credit. The tax rules in the jurisdictions in which the Group
operates are also carefully taken into consideration. If a positive forecast of taxable
income indicates the probable use of a deferred tax asset, especially when it can be
utilised without a time limit, that deferred tax asset is usually recognised in full. The
recognition of deferred tax assets that are subject to certain legal or economic limits or
uncertainties is assessed individually by management based on the specific facts and
circumstances. As at the balance sheet date the deferred tax assets have no
recognised value.
Provisions for decommissioning
The Group provides for the costs that will be incurred when the well reaches the end of
its economic life. In addition to the costs of physically removing plant and equipment
there are costs associated with returning the area to an environmentally sound condition.
This could include removal of roads, replacement of subsoil, planting of trees etc. to meet
local and national requirements at that time. As these costs will be incurred at some
considerable time in the future, the estimation of these costs is subjective. As at the
balance sheet date the amount of this liability was US$996,000 (2009: US$221,000).

{ 3 8 }
Notes to the Consolidated Accounts Year ended 31 December 2010
4. Segment reporting
In the opinion of the Directors the operations of President Petroleum comprise one class
of business, oil and gas exploration, development and production and the sale of
hydrocarbons and related activities. An operating segment is a component of an entity
that engages in business activities from which it may earn revenues and incur expenses
and whose results are regularly reviewed by the Board of Directors. The Board of
Directors reviews operating results by reference to the core principle of geographic
location. The Group currently has oil and gas production in one geographical market, the
US, and has a head office and associated corporate expenses in the UK. The Group has
exploration assets in the US and Australia.
Segmental analysis
USA Australia UK Total
2010 2010 2010 2010
US$000 US$000 US$000 US$000
Revenue 3,439 - - 3,439
Cost of sales
Depreciation 3,899 - - 3,899
Well operating costs 1,421 - - 1,421
Administrative expenses
Directors and staff costs 575 - 646 1,221
Share incentive costs 18 - 16 34
Other 346 109 706 1,161
Impairment 2,949 - - 2,949
Segment costs 9,208 109 1,368 10,685
Segment operating loss (5,769) (109) (1,368) (7,246)
2009 2009 2009 2009
US$000 US$000 US$000 US$000
Revenue 3,931 - - 3,931
Cost of sales
Royalties, overrides and other
interests 850 - - 850
Depreciation 2,101 - - 2,101
Well operating costs 1,186 - - 1,186
Administrative expenses
Directors and staff costs 452 - 498 950
Share incentive costs 24 - 31 55
Other 312 51 458 821
Impairment 1,220 - - 1,220
Loss on sale of non-current assets 180 - - 180
Segment costs 6,325 51 987 7,363
Segment operating loss (2,394) (51) (987) (3,432)

{ 3 9 }
Notes to the Consolidated Accounts Year ended 31 December 2010
4. Segment reporting (continued)
Major customers 2010 2009
US$000 US$000
Gas purchaser Michigan - 1,741
Oil purchaser Louisiana 1,045 801
Gas purchaser Louisiana 677 1,172
Third party operator - oil and gas 1,549 -
Other 168 217
Total US revenue 3,439 3,931
Segment assets USA Australia UK Total
2010 2010 2010 2010
US$000 US$000 US$000 US$000
Intangible assets 8,958 5,413 - 14,371
Property, plant and equipment 1,877 - - 1,877
10,835 5,413 - 16,248
Other assets 2,097 129 81 2,307
12,932 5,542 81 18,555
2009 2009 2009 2009
US$000 US$000 US$000 US$000
Intangible assets 2,930 3,227 - 6,157
Property, plant and equipment 3,740 - - 3,740
6,670 3,227 - 9,897
Other assets 2,186 59 111 2,356
8,856 3,286 111 12,253
2008 2008 2008 2008
US$000 US$000 US$000 US$000
Intangible assets 2,433 160 - 2,593
Property, plant and equipment 6,229 - - 6,229
8,662 160 - 8,822
Other assets 4,910 471 72 5,453
13,572 631 72 14,275
Segment assets can be reconciled to the Group as follows
2010 2009
US$000 US$000
Segment assets 18,555 12,253
Group cash 45,690 10,058
Group assets 64,245 22,311

{ 4 0 }
Notes to the Consolidated Accounts Year ended 31 December 2010
5. Cost of sales
2010 2009
US$000 US$000
Depreciation 3,899 2,101
Well operating costs 1,421 1,186
5,320 3,287
6. Administrative expenses
Directors and staff costs (including non-executive Directors) 1,221 950
Share-based payments 34 55
Other 1,161 821
2,416 1,826
7. Impairment charge
East Lake Verret - Louisiana 2,949 -
Calvin Deep - Louisiana - 665
Pontiac - Michigan - 555
2,949 1,220
Further details are provided in note 13.
8. (Loss)/gain on derivatives
Fair value movement on derivatives matured in year (57) 168
Fair value movement on derivatives yet to mature
Due in less than one year 34 319
Due in more than one year - 34
- 353
Total recognised in statement of comprehensive income (23) 521
In July 2008 the Group took out hedging contracts covering 45% of projected output
from the then producing Orion and East Lake Verret wells. The Group’s hedge
position in respect of oil contracts as at 31 December 2010 can be summarised
as follows:
Volume 1,649 bbl
Put US$100/bbl
Call US$200/bbl
All open hedge positions will be settled in 2011.
{ 4 1 }
8. Gain on derivatives (continued)
Derivatives are valued at fair value by reference to the Mark to Market valuation of the
forward contracts. Categorisation within the IFRS 7 hierarchy has been determined on
the basis of the lowest level input that is significant to the fair value measurement of the
relevant asset as follows:
Level 1 - valued using quoted prices in active markets for identical assets
Level 2 - valued by reference to valuation techniques using observable inputs other than
quoted prices included within Level 1
Level 3 - valued by reference to valuation techniques using inputs that are not based on
observable market data
All of the Group’s assets valued at fair value fall under Level 2 (see notes 17 and 28).
9. Loss before tax
2010 2009
US$000 US$000
Loss before tax has been arrived at after charging:
Depreciation of property, plant and equipment (note 14) 3,899 2,101
Impairment of intangible assets (note 13) 2,949 1,220
Staff costs (note 10) 1,059 950
Auditor’s remuneration for audit services (see below) 70 69
Rentals payable in respect of land and buildings 78 68
Auditor’s remuneration
Services to the Company
Fees payable to the Company’s auditor for the
audit of the annual accounts 65 64
Fees payable to the Company’s auditor and its
associates for other services
Audit of the financial statements of the Company’s
subsidiaries pursuant to legislation 5 5
Other services relating to taxation 2 9
Notes to the Consolidated Accounts Year ended 31 December 2010

{ 4 2 }
Notes to the Consolidated Accounts Year ended 31 December 2010
10. Staff costs
2010 2009
Number Number
Average monthly number of employees
(including executive Directors and Chairman
but excluding non-executive Directors) 5 4
2010 2009
US$000 US$000
Wages and salaries and Directors’ fees
(including Chairman and excluding non-executive Directors) 969 846
Expense in respect of share-based payments 34 55
Social security costs 56 49
1,059 950
Other than the three executive Directors there are two full time employees of the Group
who are also considered to be key management. The above staff costs are therefore
those for key management.
2010 2009
US$000 US$000
Emoluments paid in respect of the highest paid
Director in the year (excluding share-based
payment charge) 261 283

{ 4 3 }
Notes to the Consolidated Accounts Year ended 31 December 2010
11. Taxation
2010 2009
US$000 US$000
Current tax 1 167
Deferred tax
origination and reversal of temporary differences 100 14
tax liability recognised on temporary differences 409 385
tax asset recognised from unutilised tax losses (409) (385)
- -
101 181
The tax charge for the year can be reconciled to the
statement of comprehensive income as follows:
Loss on ordinary activities before taxation (6,633) (4,190)
Tax at 28% (1,857) (1,173)
Tax losses carried forward but not recognised 1,756 833
Expenses not deductible for tax purposes 95 219
Other temporary differences not recognised as
deferred tax assets 484 342
State taxes 1 167
Difference between US and UK tax rates (378) (207)
101 181
12. Loss per share
2010 2009
US$000 US$000
Net loss for the period attributable to the equity holders of
the Parent Company (6,734) (4,371)
Number Number
‘000 ‘000
Weighted average number of shares in issue 58,278 18,586
US cents US cents
Loss per share
Basic and diluted (11.6) (23.5)
At 31 December 2010, 1,175,000 potential ordinary shares in the company which underline the
company’s share option awards, and which may dilute earnings per share in the future, have not
been included in the calculation of diluted earnings per share because they are anti-dilutive for the
year to 31 December 2010.

{ 4 4 }
Notes to the Consolidated Accounts Year ended 31 December 2010
13. Intangible assets - exploration and evaluation assets
US$000
Cost
At 1 January 2009 3,724
Additions 4,784
Disposals (2,351)
At 1 January 2010 6,157
Additions 10,710
Exchange difference 453
Disposals -
At 31 December 2010 17,320
Impairment
At 1 January 2009 1,131
Impaired in year 1,220
Disposals (2,351)
At 1 January 2010 -
Impaired in year 2,949
At 31 December 2010 2,949
Net Book Value
At 31 December 2010 14,371
At 31 December 2009 6,157
The amounts for intangible exploration and evaluation assets represent active exploration
projects. These amounts will be written off to the statement of comprehensive income as
exploration costs unless commercial reserves are established or the determination
process is not completed and there are no indications of impairment. The outcome of
ongoing exploration, and therefore whether the carrying value of exploration and
evaluation assets will ultimately be recovered, is inherently uncertain.
2010 impairment of US$2.9 million relates to amounts carried for the McKerall 3 well and
other undeveloped reserves on the East Lake Verret field. The revision follows a review,
triggered by the decline in production of Kafoury 2 well, of the carrying value of the
intangible assets.
As shown in note 7 impairment in 2009 related to the full write off of Calvin Deep
Louisiana and Pontiac in Michigan.

{ 4 5 }
Notes to the Consolidated Accounts Year ended 31 December 2010
13. Intangible assets - exploration and evaluation assets (continued)
As at the year-end President was drilling the Kafoury 3 well in Louisiana. Included in the
above is a cost of US$5.1 million as at 31 December 2010. Subsequent to the year-end
the well was plugged and abandoned. Further details are set out in the Chairman’s
Statement.
14. Property, plant and equipment - development and production assets
US$000
Cost
At 1 January 2009 17,113
Additions 15
Disposals (10,297)
At 1 January 2010 6,831
Additions 2,036
At 31 December 2010 8,867
Depreciation
At 1 January 2009 10,884
Charge for the year 2,101
Disposals (9,894)
At 1 January 2010 3,091
Charge for the year 3,899
At 31 December 2010 6,990
Net Book Value
At 31 December 2010 1,877
At 31 December 2009 3,740
15. Deferred Tax
Origination of temporary differences in respect of derivatives at 1 January 2009 114
Temporary differences in respect of intangible assets 385
Losses recognised in the year (385)
Reversal of temporary differences in respect of derivatives (14)
At 1 January 2010 100
Reversal of temporary differences in respect of derivatives (100)
At 31 December 2010 -

{ 4 6 }
Notes to the Consolidated Accounts Year ended 31 December 2010
15. Deferred Tax (continued)
The temporary differences arose from transactions being treated in a different tax period
from that dealt with in the statement of comprehensive income. The Group has
unrecognised tax losses in the US as at 31 December 2010 of US$5 million available for
offset against future profits (2009: US$2 million).
16. Financial assets
2010 2009
US$000 US$000
Fair value of derivatives due in more than one year (note 8) - 34
Deposits with state authorities 330 173
330 207
Deposits will be refunded from the state authorities when the oil and gas wells have been
satisfactorily decommissioned.
17. Trade and other receivables
2010 2009
US$000 US$000
Trade receivables 1,662 1,248
Fair value of derivatives due in less than one year (note 8) 34 319
Other receivables 100 65
Prepayments 81 117
1,877 1,749
All of the Group’s trade and other receivables have been considered for indicators of
impairment. None of the trade and other receivables was found to be impaired. None of
the trade or other receivables is past due as at the reporting date.
Credit risk
There are no material receivables that are aged more than three months or are past due.
The Company has a low credit risk in respect of receivables as a result of supplying
reputable oil and gas purchasers.
18. Current tax
US$000 US$000
Federal tax recoverable 100 300

{ 4 7 }
Notes to the Consolidated Accounts Year ended 31 December 2010
19. Cash and cash equivalents
Cash at bank and in hand 45,690 10,058
20. Trade and other payables
Trade payables 4,281 1,521
Other payables 127 164
4,408 1,685
21. Borrowings and deferred consideration
2010 2009
US$000 US$000
Balance at beginning of year 4,107 6,495
Loan finance provided by Macquarie Bank - 1,118
Deferred consideration in respect of East White Lake assets 1,400 -
Repaid in period Capital repayments 1,390 1,960
Payment on renegotiation of loan 2,778 2,500
Interest paid 141 343
(4,309) (4,803)
Release of unamortised costs to statement of comprehensive income following renegotiation of loan - 546
Interest accrued in period 141 343
Adjustment to increase cost to effective interest rate - 408
Interest payable in statement of comprehensive income in period 141 751
1,339 4,107
Due in less than one year
Macquarie Bank loan finance 150 2,413
Deferred consideration 300 -
450 2,413
Due in more than one year
Macquarie Bank loan finance - 1,694
Deferred consideration 889 -
1,339 4,107
{ 4 8 }
Notes to theConsolidatedAccounts Year ended31 December 2010
21. Borrowings and deferred consideration (continued)
On 30 June 2008 the Group drew down a loan from Macquarie Bank to finance the
acquisition of East Lake Verret assets. The loan was recognised net of loan issue costs
and the fair value of warrants issued to Macquarie Bank as part of the
financing arrangement.
In November 2009 the Group reached agreement with Macquarie Bank to restructure
the Loan Facility. The Group made an early repayment of US$2.5 million and Macquarie
Bank agreed to amend the terms of the Facility Agreement, such that:
a) the financial covenants given by the Group in relation to the adjusted present
value ratio to net debt of the Group and minimum production levels no
longer apply;
b) the Company is no longer under an obligation to issue any further warrants
under the terms of the Facility Agreement or otherwise;
c) the obligation on the Group to apply certain monies paid into a proceeds
account under the Facility Agreement towards general and administrative
expenses no longer applies; and
d) the general undertakings to deliver net profit overriding royalty interest
conveyances granted in favour of Macquarie Bank no longer apply.
In addition, Macquarie Bank agreed to cancel all of the outstanding warrants it held over
ordinary shares in the Company in consideration for the payment by the Company to
Macquarie Bank of the sum of £300,000 (US$492,000). Macquarie Bank also agreed to
subscribe in cash for 1,200,000 1p ordinary shares at 25p at the time of the placing and
open offer.
As a result of this restructuring the Company has released the amounts that were
previously debited to the loan in order to recognise the above additional finance costs.
This has resulted in a non-cash charge to the statement of comprehensive income of
US$546,000 in the year ended 31 December 2009.
In November 2010 some of the proceeds of the 2010 Placing were applied to repay
more of the loan down to a balance of US$200,000 that is being repaid at US$25,000
per month. As at 31 December 2010 the balance was US$150,000.
The loan is secured on the Group’s properties, cash balances and other assets. The loan
is repayable in full by 30 June 2011.

{ 4 9 }
Notes to theConsolidatedAccounts Year ended31 December 2010
22. Provisions
US$000
Decommissioning
At 1 January 2009 316
Disposal (95 )
At 1 January 2010 221
Increase of provision 775
At 31 December 2010 996
Provisions for decommissioning relate to the restoration of a well site to a satisfactory
environmental condition following the cessation of production. These provisions have
been created based on the Group’s internal estimates and, where available, operator’s
estimates. Assumptions, based on the current economic environment, have been made
which management believe are a reasonable basis upon which to estimate the future
liability. These estimates are reviewed regularly to take into account any material
changes to the assumptions. However, actual decommissioning costs will ultimately
depend upon future market prices for the necessary decommissioning works required
which will reflect market conditions at the relevant time. Furthermore, the timing of
decommissioning is likely to depend on when the fields cease to produce at economically
viable rates. This in turn will depend upon future oil and gas prices, which are
inherently uncertain.
23. Share capital
Equity share capital
2010 2009
’000s ’000s
Issued - allotted, called up and fully paid
Deferred shares of par value £0.29 (US$0.54) 16,093 16,093
Ordinary shares of par value £0.01 (US$0.02) 108,738 45,446
US$000 US$000
Deferred shares of par value £0.29 (US$0.54) 8,725 8,725
Ordinary shares of par value £0.01 (US$0.02) 1,789 783
10,514 9,508
The issued share capital is reconciled as follows
Balance at beginning of year 9,508 9,026
Shares issued 1,006 482
Balance at end of year 10,514 9,508
{ 5 0 }
Notes to theConsolidatedAccounts Year ended31 December 2010
24. Share options
On 30 September 2010 the Company granted share options as follows
Stephen Gutteridge 425,000
Michael Cochran 130,000
Angelo Baskaran 180,000
Senior management 440,000
1,175,000
The options are exercisable at 50p at any time commencing on the third anniversary of
the date of grant and expiring on the day before the tenth anniversary of the date of grant
provided that certain market-based performance conditions have been met. Other than
the above, there are no outstanding options over the Company’s Ordinary Shares. No
options have been exercised or are exercisable or have expired in the year.
The aggregate of the estimated fair values of the options is US$411,358. This cost has
been spread over 3 years with three months of the cost (US$34,280) having been taken
to the income statement in the current year.
The inputs into the Black-Scholes model are as follows:
Weighted average share price 56 p
Weighted average exercise price 50 p
Expected volatility 55%
Expected life 3 years
Risk-free rate 1.5%
Expected dividend yields 0.0%
Expected volatility was determined by calculating the historical volatility of the Group’s
share price over the previous three years. The expected life used in the model has been
adjusted, based on management’s best estimate, for the effects of non-transferability,
exercise restrictions and behavioural considerations.
{ 5 1 }
Notes to theConsolidatedAccounts Year ended31 December 2010
25. Notes to the consolidated statement cash flows
2010 2009
US$000 US$000
Loss from operations before taxation (6,633) (4,190)Interest on bank deposits (86) (18)Interest payable on loan 141 751Release of unamortised costs following renegotiation of loan - 546Depreciation of property, plant and equipment 3,899 2,101Impairment 2,949 1,220Loss on sale of non-current assets - 180Provision for decommissioning - (95)Share based payments 34 55Fair value through profit and loss on derivative
financial instruments - (353)Foreign exchange difference 392 415
Operating cash flows before movements in working capital 696 612(Increase)/decrease in receivables (144) 2,943Increase/(decrease) in payables 2,753 (561)
Net cash generated by operating activities 3,305 2,994
Cash and cash equivalents (which are presented as a single class of asset on the face of
the balance sheet) comprise cash at bank and other short-term highly liquid investments
with a maturity of three months or less.
26. Contingent liabilities
There are no contingent liabilities.
27. Capital and operating lease commitments
Capital commitments
As at 31 December 2010 the Group was committed to drilling the Northumberland 2 well,
on the PEL 82 licence in South Australia. The cost of drilling the well (translated at year-end
exchange rates) is expected to be US$8 million.
Operating lease commitments
The Company has leases in respect of its London and Michigan office premises.
Minimum lease payments are as follows:
2010 2009
US$000 US$000
Due within one year 95 68One to five years 23 72
118 140
There are no significant leasing arrangements other than the above rent commitment.

{ 5 2 }
Notes to theConsolidatedAccounts Year ended31 December 2010
28. Risk management objectives and policies
a) Overview
The Group is exposed to market risk through its use of financial instruments and
specifically to currency risk, interest rate risk and certain other price risks, which result
from both its operating and investing activities. The Group’s risk management is
co-ordinated at its London headquarters, in close co-operation with the Board of
Directors, and focuses on actively securing the Group’s short to medium-term cash flows
by minimising the exposure to financial markets. To date, the Group has financed its
operations from equity issues and a loan from Macquarie Bank denominated in US
Dollars. The Group uses financial instruments (other than derivatives) comprising cash,
liquid resources and various items, such as trade debtors and trade creditors that arise
directly from its operations. Other than the hedging contracts referred to below the Group
has not entered into any derivative transactions. In the normal course of its operations
the Group is exposed to foreign currency, commodity price and interest rate risks, which
are currently not significant.
b) Hedging of oil and gas prices
During 2008 the Group benefited from record prices and in July 2008, near the peak of
these prices, the Directors took out a cap and floor hedge based upon estimated 45% of
the future production volumes from existing producing wells. As explained in note 8
minimal volumes remained as at 31 December 2010. The Group keeps its production
profile and gas and oil prices under review and may take out future hedging contracts
when deemed appropriate.
c) Foreign currency risk and sensitivity
With the exception of Group overheads arising in London most of the Group’s
transactions are carried out in US Dollars. The financial statements are produced in US
Dollars as much of its business is conducted in US Dollars. In 2009 the Group
commenced seismic work in Australia at a budgeted cost of A$2.7 million. Australian
Dollars to the value of this commitment were purchased in 2008 to minimise the
exchange risk. In 2010 the Group committed to drilling an exploration well and A$8.0
million were purchased to minimise the exchange risk.
At the year end the Group held the following cash balances.
2010 2009
US$000 US$000
Australian Dollars 8,101 57
US Dollars 25,120 7,483
Sterling 12,469 2,518
45,690 10,058

{ 5 3 }
Notes to theConsolidatedAccounts Year ended31 December 2010
28. Risk management objectives and policies (continued)
Based upon the year end balances, if the exchange rate between the US dollar and
sterling changed by 10% there would be a profit or loss of $2.2 million.If the exchange
rate between the US dollar and the Australian dollar changed by 10% there would
be a profit or loss of $0.8 million.
d) Interest rate risk and sensitivity
The Group places surplus cash on deposits. A 1% change in bank rate would
increase or decrease interest received by approximately US$457,000 per annum
(2009 : US$100,000).
e) Credit risk
The Group’s principal customers are oil and gas utility companies and as such credit risk
is considered to be low. The credit risk for liquid funds is considered to be negligible as
the counterparties are banks with good external credit ratings.
The Group’s exposure to credit risk is limited to the carrying amount of financial assets
recognised at the balance sheet date, as summarised below:
2010 2009
US$000 US$000
Trade receivables 1,662 1,248
Other receivables 100 65
Cash and cash equivalents 45,690 10,058
Derivatives due - 353
Deposits with state authorities 330 173
47,782 11,897
f) Liquidity risk analysis
The Group manages its liquidity needs by carefully monitoring its cash inflows and
outflows due in day-to-day business. Liquidity needs are monitored in various time
bands, on a week-to-week basis, as well as on the basis of a rolling monthly projection.
Long-term liquidity needs for a half year and an annual lookout period are identified
monthly. The Group maintains cash to meet its liquidity requirements for up to
60-day periods.
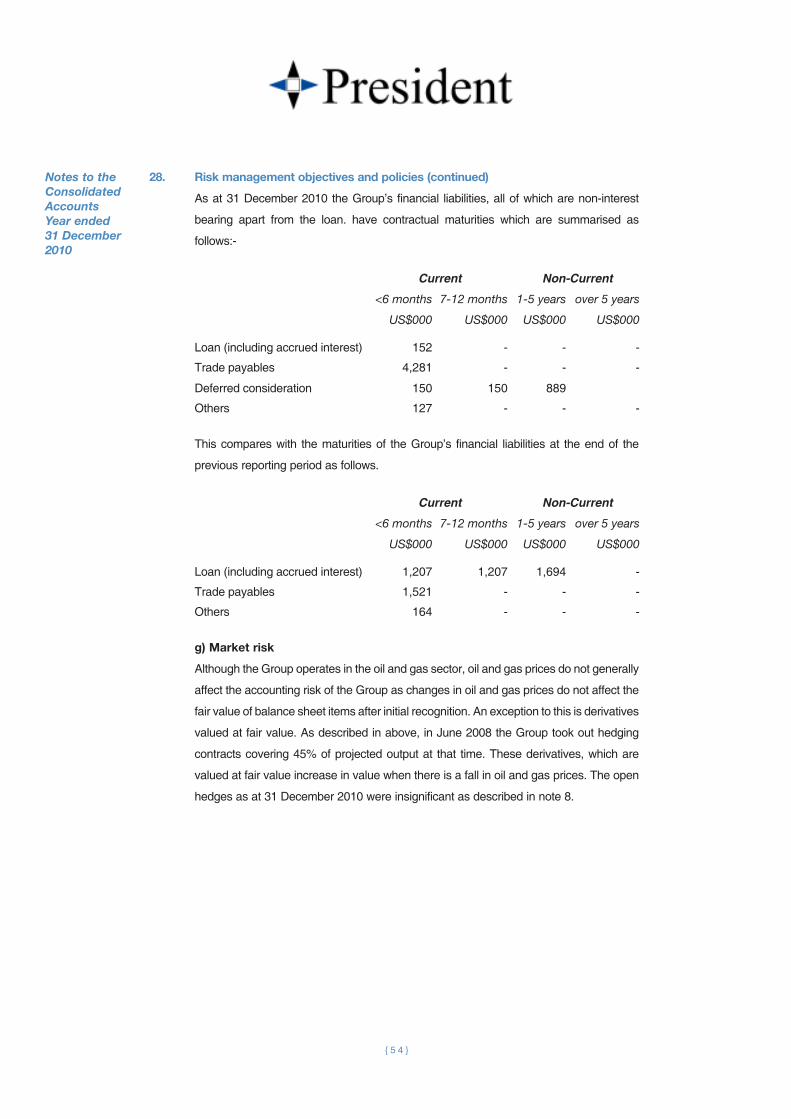
{ 5 4 }
Notes to theConsolidatedAccounts Year ended31 December 2010
28. Risk management objectives and policies (continued)
As at 31 December 2010 the Group’s financial liabilities, all of which are non-interest
bearing apart from the loan. have contractual maturities which are summarised as
follows:-
Current Non-Current
<6 months 7-12 months 1-5 years over 5 years
US$000 US$000 US$000 US$000
Loan (including accrued interest) 152 - - -
Trade payables 4,281 - - -
Deferred consideration 150 150 889
Others 127 - - -
This compares with the maturities of the Group’s financial liabilities at the end of the
previous reporting period as follows.
Current Non-Current
<6 months 7-12 months 1-5 years over 5 years
US$000 US$000 US$000 US$000
Loan (including accrued interest) 1,207 1,207 1,694 -
Trade payables 1,521 - - -
Others 164 - - -
g) Market risk
Although the Group operates in the oil and gas sector, oil and gas prices do not generally
affect the accounting risk of the Group as changes in oil and gas prices do not affect the
fair value of balance sheet items after initial recognition. An exception to this is derivatives
valued at fair value. As described in above, in June 2008 the Group took out hedging
contracts covering 45% of projected output at that time. These derivatives, which are
valued at fair value increase in value when there is a fall in oil and gas prices. The open
hedges as at 31 December 2010 were insignificant as described in note 8.

{ 5 5 }
28. Risk management objectives and policies (continued)
h) Summary of financial assets and liabilities by category
2010 2009
US$000 US$000
Non-current assets
Deposits with state authorities 330 173
Current assets
Trade receivables 1,662 1,248
Other receivables 100 65
Cash and cash equivalents 45,690 10,058
47,452 11,371
Current liabilities – Financial liabilities measured at amortised cost
Trade payables 4,281 1,521
Other payables 127 164
4,408 1,685
Loan
Balance with Macquarie Bank (note 21) 150 4,107
Other financial assets – carried at fair value through profit or loss
Fair value of derivatives (note 8) - 353
The fair value of financial assets and liabilities approximates the carrying value due to
the short-term nature of the financial instruments.
29. Managing capital
The Group’s objectives when managing capital are:
- to safeguard the Company’s ability to continue as a going concern, so that it
can continue to provide returns for shareholders and benefits for other
stakeholders; and
- to provide an adequate return to shareholders by pricing products and services
commensurately with the level of risk.
The Group sets the amount of capital in proportion to risk and its plans for growth. The
Group manages the capital structure and makes adjustments to it in the light of changes
in economic conditions and the risk characteristics of the underlying assets. In order to
maintain or adjust the capital structure, the Group may adjust any amount of dividends
paid to shareholders, return capital to shareholders, issue new shares or sell assets to
reduce debt.
Notes to theConsolidatedAccounts Year ended31 December 2010

{ 5 6 }
30. Subsequent events
The Kafoury 3 exploration well, East Lake Verret Field (“ELV”), Louisiana, spudded in
November 2010 and drilling continued beyond the year-end as a consequence of high
pressures creating extremely challenging conditions. Eventually, in early 2011, a
promising section of the well was tested but proved inconclusive and the well was
subsequently plugged and abandoned (see note 13).
The Northumberland 2 exploration well, PEL82, South Australia, spudded in March 2011
and results were announced in mid-April with the well being plugged and abandoned.
Although not a commercial discovery the well has provided encouragement for further
work on the PEL82 licence.
Further details are set out in the Chairman’s statement.
31. Transactions with Directors and other related parties
Balances and transactions between the Company and its subsidiaries, which are related
parties, have been eliminated on consolidation and are not disclosed in this note.
The Company defines key management personnel as Directors of the Company. Further
information about the remuneration of individual directors is provided in the Directors’
Remuneration Report on pages 13 to 16 which form part of these financial statements.
The Company paid US$775,238 to Levine Capital Management Limited for the
procurement of corporate support services in connection with the October 2010 equity
placing. Levine Capital Management Limited, a company registered in the British Virgin
Islands, is the private investment fund of Peter Levine and the largest shareholder in the
Company. There are no outstanding balances as at the balance sheet date.
Notes to theConsolidatedAccounts Year ended31 December 2010

{ 5 7 }
The accompanying accounting policies and notes form an integral part of these financial statements.
2010 2009
Note £000 £000
Fixed assets
Investment in subsidiaries 3 2,250 2,250
Current assets
Debtors – falling due within one year 4 49 67
Debtors – falling due after one year 4 16,984 10,048
Cash at bank and in hand 27,126 5,275
44,159 15,390
Current liabilities
Creditors – Amounts falling due within one year 5 93 1,264
Net current assets 44,066 14,126
Net assets 46,316 16,376
Equity
Called up share capital 6 5,754 5,122
Share premium 7 40,788 11,291
Retained earnings and other reserves 7 (226) (37)
Total equity attributable to the equity holders 46,316 16,376
The financial statements were approved by the Board of Directors and authorised for issue on
27 April 2011. They were signed on their behalf by:
Stephen Gutteridge
Chairman
Company Balance Sheet 31 December 2010
{ 5 8 }
1. Significant accounting policies
Basis of accounting
The separate financial statements of the Company are presented as required by the
Companies Act 2006. They have been prepared under the historical cost convention and
in accordance with applicable United Kingdom Accounting Standards and law. The
principal accounting policies are summarised below. They have all been applied
consistently throughout the year and the preceding year.
Investments
Fixed asset investments in subsidiaries are shown at cost less provision
for impairment.
Foreign exchange
Transactions denominated in foreign currencies are recorded in the local currency at
actual exchange rates as of the date of the transaction. Monetary assets and liabilities
denominated in foreign currencies at the year-end are reported at the rates of exchange
prevailing at the year end. Any gain or loss arising from a change in exchange rates
subsequent to the date of the transactions is included as an exchange gain or loss in the
profit and loss account.
Related party transactions
The Company has taken advantage of the exemption available under FRS 8 with regard
to the non-disclosure of transactions between Group companies.
Deferred tax
Deferred tax is recognised in respect of all timing differences that have originated but not
reversed at the balance sheet date where transactions or events have occurred at that
date which will result in an obligation to pay more or a right to pay less or to receive more
tax, with the following exceptions:
- provision is made for deferred tax that would arise on remittance of the retained
earnings of overseas subsidiaries, associates and joint ventures only to the extent
that, at the balance sheet date, dividends have been accrued as receivable; and
- deferred tax assets are recognised only to the extent that the Directors consider
that it is more likely than not that there will be suitable taxable profits from which
the future reversal of the underlying timing differences can be deducted.
Deferred tax is measured on an undiscounted basis at the tax rates that are expected to
apply in the years in which timing differences reverse, based on tax rates and laws
enacted or substantively enacted at the balance sheet date.
Notes to the Company Accounts Year ended 31 December 2010

{ 5 9 }
Notes to the Company Accounts Year ended 31 December 2010
1. Significant accounting policies (continued)
Foreign Currencies
Foreign exchange differences on Group balances, where the loan is long-term, that are
denominated in currencies other than the US Dollar at the balance sheet date are
translated at the exchange rate ruling at that date with any exchange differences arising
on retranslation being recognised in the profit and loss account.
2. Profit/(loss) for the year
As permitted by Section 408(1b) of the Companies Act 2006, the Company has elected
not to present its own profit and loss account for the year. President Petroleum Company
PLC reported a loss for the year ended 31 December 2010 of £211,000 (2009: profit
£1,089,000).
In accordance with FRS No. 1 “Cash flow statements (Revised 1996)”, no cash flow
statement has been prepared as the Company’s cash flows are included in the
consolidated financial statements of its ultimate parent company which are made
available to the public on an annual basis.
The auditor’s remuneration for audit services to the company was £20,000 (2009:
£20,000).
3. Investment in subsidiaries
Place of Incorporation
Class of Share Capital
Percentage Held Business
Held Directly
President Petroleum (UK) Limited
GreatBritain
Ordinary 100% Non trading
Held Indirectly
President Petroleum (USA) Inc.
USA Ordinary 100% Oil and Gas
President Petroleum Pty Limited
Australia Ordinary 100% Oil and Gas

{ 6 0 }
Notes to the Company Accounts Year ended 31 December 2010
4. Debtors
2010 2009
£000 £000
Debtors – falling due within one year
Prepayments and accrued income 49 67
Debtors – falling due after one year
Amounts owed by Group undertakings 16,984 10,048
The amounts owed by Group undertakings are repayable on demand. However the
Directors consider that they will not be repaid within one year and have presented them
accordingly in the Company balance sheet.
5. Creditors – amounts falling due within one year
2010
£000
2009
£000
Social Security and other taxes 9 7
Amounts owed to group undertakings - 1,157
Other creditors 84 100
93 1,264
6. Share capital
2010 2009
Equity share capital ’000s ’000s
Allotted, called up and fully paid
Deferred shares of par value 29p each 16,093 16,093
Ordinary shares of par value 1p each 108,738 45,446
2010 2009
£000 £000
Deferred shares of par value 29p each 4,667 4,667
Ordinary shares of par value 1p each 1,087 455
5,754 5,122
The ordinary shares of the Company were reorganised on 30 November 2009 into 1p
ordinary shares that are traded on the London Stock Exchange and 29p deferred shares
that have no voting rights, no rights to dividends and no rights to capital distributions.

{ 6 1 }
7. Share premium account, profit and loss account and share option reserve
Share premium
Profit and loss account
Share option
reserve
£000 £000 £000
Balance at 1 January 2010 11,291 (37) -
Loss for the year - (211)
Premium on allotment in the year 31,013 -
Costs of issue (1,516) -
Share based payments - - 22
Balance at 31 December 2010 40,788 (248) 22
8. Reconciliation of movement in shareholders’ funds
2010 2009
£000 £000
(Loss)/profit for the year (211) 1,089
Shares issued 31,645 7,339
Costs of issue (1,516) (217)
Compensation for cancellation of share options and warrants - (534)
Share-based payments 22 35
Net additions to shareholders’ funds 29,940 7,712
Shareholders’ funds at 1 January 2010 16,376 8,664
Shareholders’ funds at 31 December 2010 46,316 16,376
Notes to the Company Accounts Year ended 31 December 2010
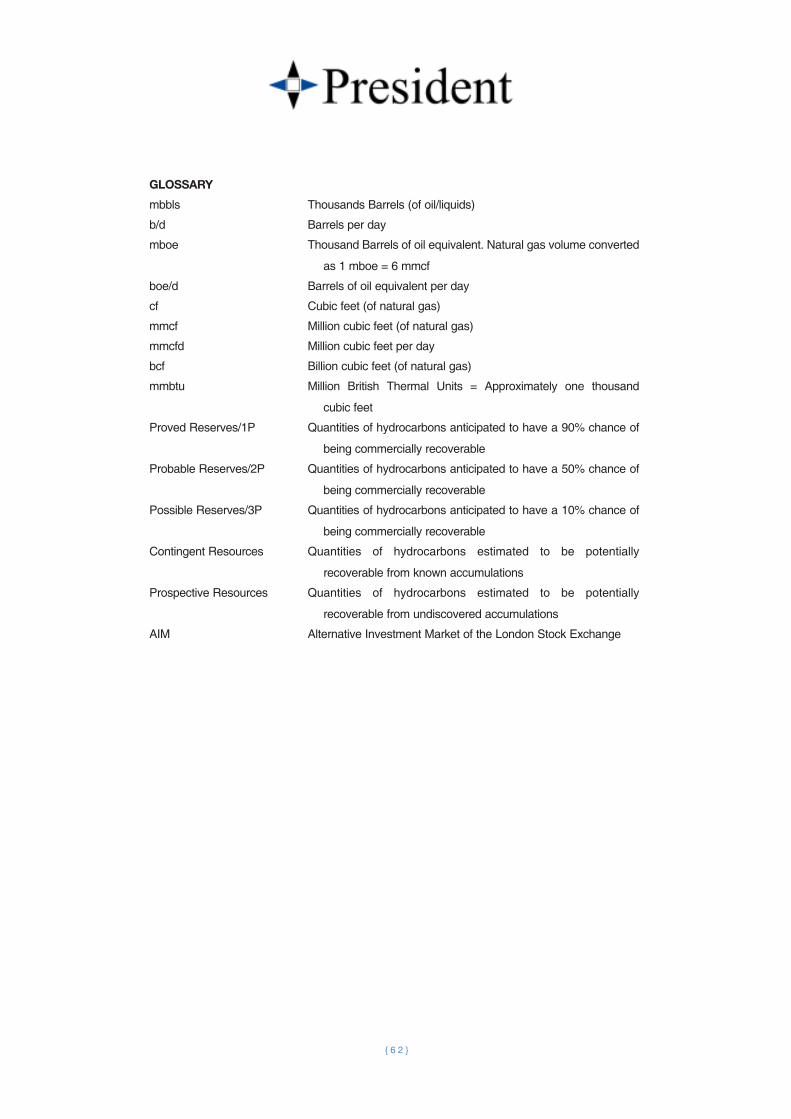
{ 6 2 }
GLOSSARY
mbbls Thousands Barrels (of oil/liquids)
b/d Barrels per day
mboe Thousand Barrels of oil equivalent. Natural gas volume converted
as 1 mboe = 6 mmcf
boe/d Barrels of oil equivalent per day
cf Cubic feet (of natural gas)
mmcf Million cubic feet (of natural gas)
mmcfd Million cubic feet per day
bcf Billion cubic feet (of natural gas)
mmbtu Million British Thermal Units = Approximately one thousand
cubic feet
Proved Reserves/1P Quantities of hydrocarbons anticipated to have a 90% chance of
being commercially recoverable
Probable Reserves/2P Quantities of hydrocarbons anticipated to have a 50% chance of
being commercially recoverable
Possible Reserves/3P Quantities of hydrocarbons anticipated to have a 10% chance of
being commercially recoverable
Contingent Resources Quantities of hydrocarbons estimated to be potentially
recoverable from known accumulations
Prospective Resources Quantities of hydrocarbons estimated to be potentially
recoverable from undiscovered accumulations
AIM Alternative Investment Market of the London Stock Exchange

{ 6 3 }
Notice is hereby given that the Annual General Meeting of the Company will be held on
15 June 2011 at 11:00 a.m. at Pelham Bell Pottinger, 5th Floor, Holborn Gate, 330 High Holborn
WC1V 7QD for the following purposes, namely:
Ordinary Business
As Ordinary Business, to consider and, if thought fit, pass the following resolutions which will be
proposed as Ordinary Resolutions:
1 To receive and adopt the Company’s Financial Statements for the year ended 31
December 2010, together with the reports of the auditor and directors of the Company
(“Directors”) thereon.
2 To re-appoint Deloitte LLP as auditor of the Company until the conclusion of the next
Annual General Meeting at which accounts for the Company are presented and to
authorise the Directors to fix their remuneration.
3 To elect Benjamin Wilkinson as a Director of the Company, who has been appointed
since the last Annual General Meeting and who offers himself for election.
4 To re-elect Michael Cochran as a Director of the Company, who retires in accordance
with the Company’s Articles of Association and offers himself for re-election.
Special Business
As Special Business to consider and if thought fit to pass the following resolutions of which the
resolution numbered 5 will be proposed as an ordinary resolution and the resolution numbered 6
will be proposed as a special resolution:
5 That authority be and is hereby granted to the Directors generally and unconditionally
to allot shares in the capital of the Company or to grant rights to subscribe for or convert
any security into shares in the capital of the Company (“Rights”) pursuant to section 551
of the Companies Act 2006 (the “Act”) up to an aggregate nominal value of £362,458
(such amount equating to one third of the aggregate nominal value of the issued
ordinary share capital of the Company as at the date of this Notice) provided that this
authority will expire at the conclusion of the Annual General Meeting of the Company to
be held in 2012, save that the Company may make an offer or agreement before the
expiry of this authority which would or might require shares to be allotted or Rights to
be granted after such expiry and the Directors may allot shares or grant Rights pursuant
thereto as if the authority conferred hereby had not expired, such authority to be in
substitution for any existing authorities conferred on the Directors pursuant to Section
551 of the Act.
Notice of Annual General Meeting

{ 6 4 }
6. That the Directors be and they are hereby generally empowered pursuant to Section
570 of the Act to allot equity securities (as defined in Section 560 of the Act) pursuant
to the authority conferred by resolution 5 above as if Section 561(1) of the Act did
not apply to any such allotment, provided that this power shall be in substitution for
any previous powers conferred on the Directors pursuant to Section 570 of the Act
and shall be limited to:
(a) allotments made in connection with offers of equity securities to the holders of
ordinary shares in proportion (as nearly as may be) to the respective numbers
of ordinary shares held by them, but subject to such exclusions or other
arrangements as the Directors may deem necessary or expedient in relation
to fractional entitlements or legal or practical problems under the laws of any
overseas territory or the requirements of any recognised regulatory body or
any stock exchange in any territory;
(b) the allotment (otherwise than pursuant to sub-paragraph (a) above) of further
equity securities up to an aggregate nominal amount of £217,475 (such
amount equating to 20 per cent of the aggregate nominal value of the issued
ordinary share capital of the Company as at the date of this Notice)
provided that this authority shall expire at the conclusion of the Annual General Meeting
of the Company to be held in 2012 save that the Company may make an offer or
agreement before the expiry of this power which would or might require equity securities
to be allotted after such expiry and the Directors may allot equity securities pursuant
thereto as if the power conferred hereby had not expired.
BY ORDER OF THE BOARD
David Wake-Walker Registered Office:
Company Secretary 13 Regent Street
27 April 2011 London
SW1Y 4LR
Notes1. Copies or particulars of contracts of service between Directors and the Company or any of its subsidiary undertakings will be available for inspection by members at the registered office of the Company during normal business hours from the date of this notice until xx xx 2011 and at the place of the Annual General Meeting for fifteen minutes prior to and until the conclusion of that meeting.
Notice of Annual General Meeting

{ 6 5 }
Notice of Annual General Meeting
2. Every member has the right to appoint some other person(s) of their choice, who need not be a member, as his proxy to exercise all or any of his rights to attend, speak and vote on their behalf at the meeting. If a member wishes to appoint a person other than the Chairman, he should insert the name of his chosen proxy holder in the space provided. If the proxy is being appointed in relation to less than the member’s full voting entitlement, he should enter in the box next to the proxy holder’s name the number of shares in relation to which they are authorised to act as proxy. If left blank the proxy will be deemed to be authorised in respect of the member’s full voting entitlement (or if this proxy form has been issued in respect of a designated account for a member, the full voting entitlement for that designated account).
3. To appoint more than one proxy, (an) additional proxy form(s) may be obtained by contacting the Company’s registered office or this form may be photocopied. A member should indicate in the box next to the proxy holder’s name (see reverse) the number of shares in relation to which they are authorised to act as his proxy. A member should also indicate by ticking the box provided if the proxy instruction is one of multiple instructions being given. All forms must be signed and should be returned together in the same envelope.
4. To be valid, forms of proxy must be lodged at the office of the Company’s registrars, Freepost SEA 10846, Equiniti Limited, Aspect House, Spencer Road, Lancing, West Sussex BN99 6ZL, not less than 48 hours before the meeting or any adjournment.
5. Pursuant to regulation 41 of the Uncertificated Securities Regulations 2001, members will be entitled to attend and vote at the meeting if they are registered on the Company’s register of members at 6:00 p.m. on 13 June 2011.

Form of ProxyFor AnnualGeneralMeeting
PLEASE COMPLETE IF YOU DO NOT INTEND TO ATTEND IN PERSON
(Company No: 5104249)
I ............................................................................................................ (Name(s) in full in block capitals)
of (address) …………................................................................................................................................
....................................................................................................................................................................
being a member of the above named Company hereby appoint
Name of proxy No. of shares
or, failing him/her the Chairman of the Meeting, as my proxy to vote for me on my behalf in
accordance with the instructions set out below at the Annual General Meeting of the Company to
be held on 15 June 2011 and at any adjournment thereof.
Please tick this box if this form is one of multiple instructions being given
Please delete “Either” or “Or” below and mark “For”, “Against” or “Vote Withheld” as appropriate
and return this form to the Company Secretary/Company’s registrars, Freepost SEA 10846,
Equiniti Limited, Aspect House, Spencer Road, Lancing, West Sussex BN99 6ZL. To be valid this
form must be lodged with the Company’s registrars not less than 48 hours before the Meeting.
Either To vote as my Proxy or failing him/her as the Chairman thinks fit.
Or For Against Vote Withheld
Resolution 1
Resolution 2
Resolution 3
Resolution 4
Resolution 5
Resolution 6
Signed ...............................................................................................................................................
Name ..............................................................................................................................................
Date ..............................................................................................................................................