Embed Size (px)
Citation preview

Presenting Numerical Values from an Investigation
Version 080104

Outline
• Uncertainty
• Propagation of Uncertainty
• Least Squares Fit to Lines

Online References
• www.av8n.com/physics/uncertainty.htm
• mathworld.wolfram.com/LeastSquaresFitting.html
• www.physics.csulb.edu/151lab/exp4/lsf.html

Which is the best measurement?
Which measurement is consistent with the previously published result?
• 6.63 E-34 Js
• 6.7 E-34 Js
• 6.623 E-34 Js
JsEh 34626.6

Which is the best measurement?
Which measurement is consistent with the previously published result?
• 6.613 ±0.003 E-34 Js
• 6.7 ±0.2 E-34 Js
• 6.622±0.001 E-34 Js
JsEh 34626.6

UNCERTAINTY

Uncertainty
Best Power Supply money can buy
CJ’s bad karma
Voltage stabilization circuit
built by Floyd
30 yr oldpiece of precision
equipment
Vibrations from Levi Centerconstruction
Best measurementsthat can be performed

Cumulative Set of Measurementsby Lab Unit #1
05
10
1520
2530
3540
4550
Value
4041424344454647484950
# of
Occ
ura
nce
s

Cumulative Set of Measurementsby Lab Unit #2
0
10
20
30
40
50
60
70
80
90
Value
4041424344454647484950
# of
Occ
ura
nce
s
should report center and width of distribution

45±245±1
may look like numbers, but they’re not.
It’s a way to specify a probability distribution

Relative Uncertainty
An experiment measures the value of the fundamental charge to be:
(1.84 ± 0.09) x 1019 Coulombs
or
1.14 ± 0.06 e
%514.1
06.0
84.1
09.0
1984.1
1909.0
E
E

SignificantFigures

Sig Figs are for Losers
“Non-experts tend to talk about ‘significant digits’, but this approach is heavily flawed.
Professionals general prefer to speak in terms of quantifying the uncertainty.”

Why Sig Fig approach is badAn experiment measures the value of the fundamental charge to be:
1.1 e1.149
1.050
10% rel unc. is implied
Sig Fig approach: 1) misrepresents the true uncertainty (actually the uncertainty is not specified)
2) throws away information 3) can produce erroneous results (see linear fits)
Physicists present a ‘reasonable number’ of digits in published work, but many more digits in calculations.

ExampleCalculational tools for an investigation return the result: 1.64578359 ± 0.05385672 meters
Q: In a professional paper this should be presented as (?):
1.6458 ± 0.0539 meters
1.646 ± 0.054 meters
1.65 ± 0.05 meters
1.6 ± 0.1 meters

Notation
• 1.646 ± 0.054 meters
• 1.646 (54) meters
• 1.646 ± 3% meters
preferred for conversation
preferred for written work

• If you have something worth saying, don’t say it in terms of sig figs.

Types of Uncertainty
• Statistical
• Systematic
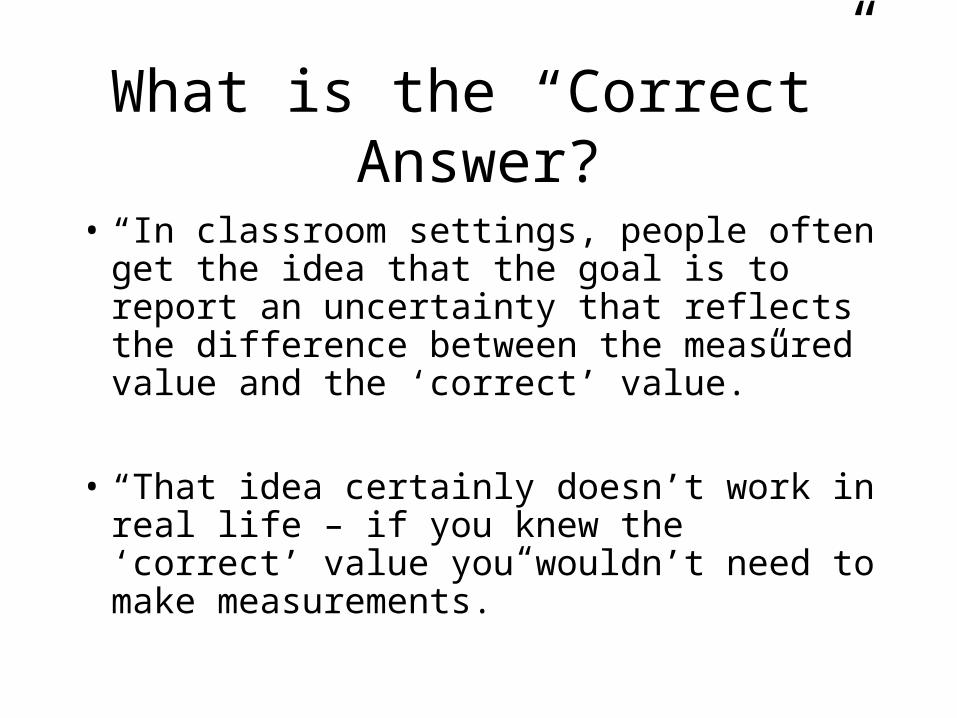
What is the “Correct” Answer?
• “In classroom settings, people often get the idea that the goal is to report an uncertainty that reflects the difference between the measured value and the ‘correct’ value.”
• “That idea certainly doesn’t work in real life – if you knew the ‘correct’ value you wouldn’t need to make measurements.”

PROPAGATION OF UNCERTAINTY

qB
momentumR
22
2
RB
V
m
q
Vqvm 2
2
1
BB RR
VV

23
2
3
22
2
2
21
2
1
2xxxf x
f
x
f
x
f
...,,, 321 xxxff
11 xx
ff
22 xx 33 xx
?

LEAST SQUARES FITTING
Figures and equations from:mathworld.wolfram.com/LeastSquaresFitting.html

The Excel “trendline” function isn’t good enough.
One must always present uncertainties to be a member of the physics community.
y = a0 + a1 x + a2 x2 + …
Use “trendline” to draw the graph.Use “linest” to get the parametersand their corresponding uncertainities.
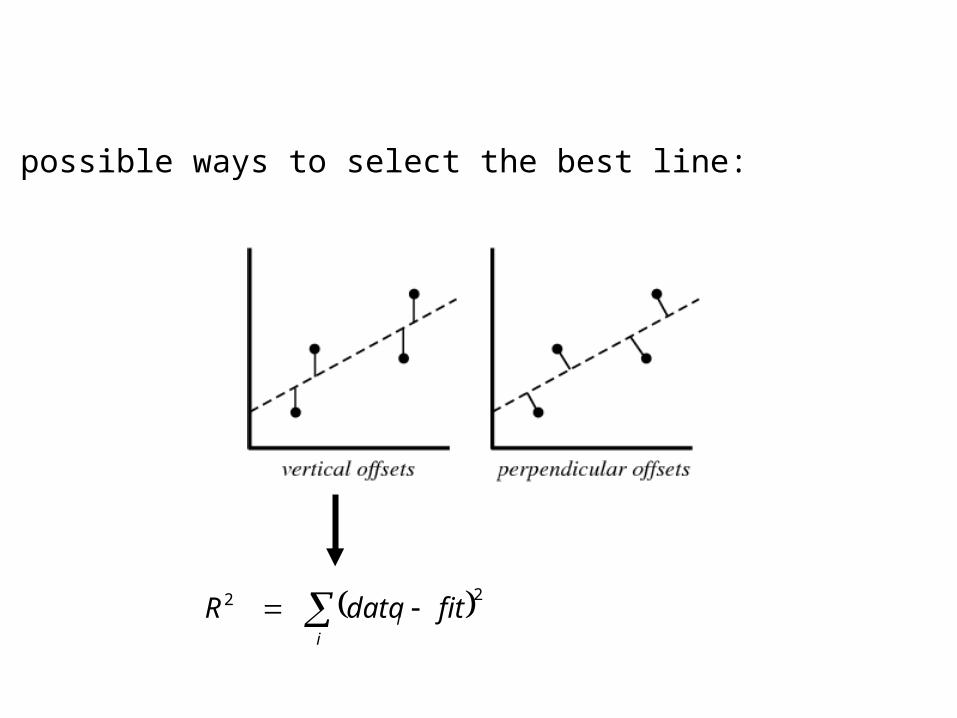
Two possible ways to select the best line:
22 i
i fitdataR
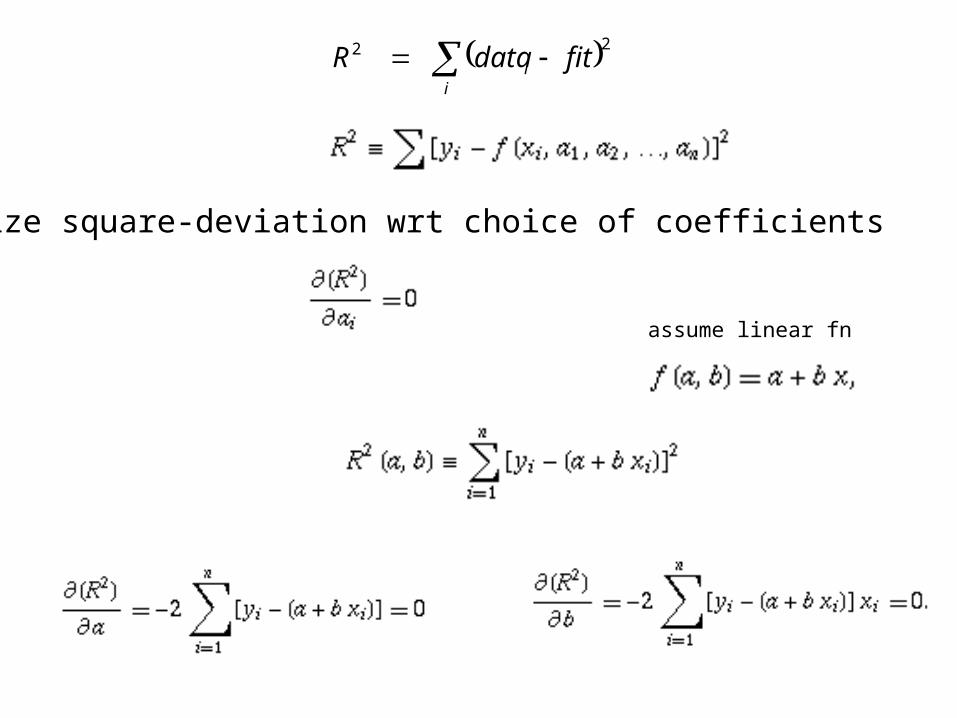
Minimize square-deviation wrt choice of coefficients
22 i
i fitdataR
assume linear fn


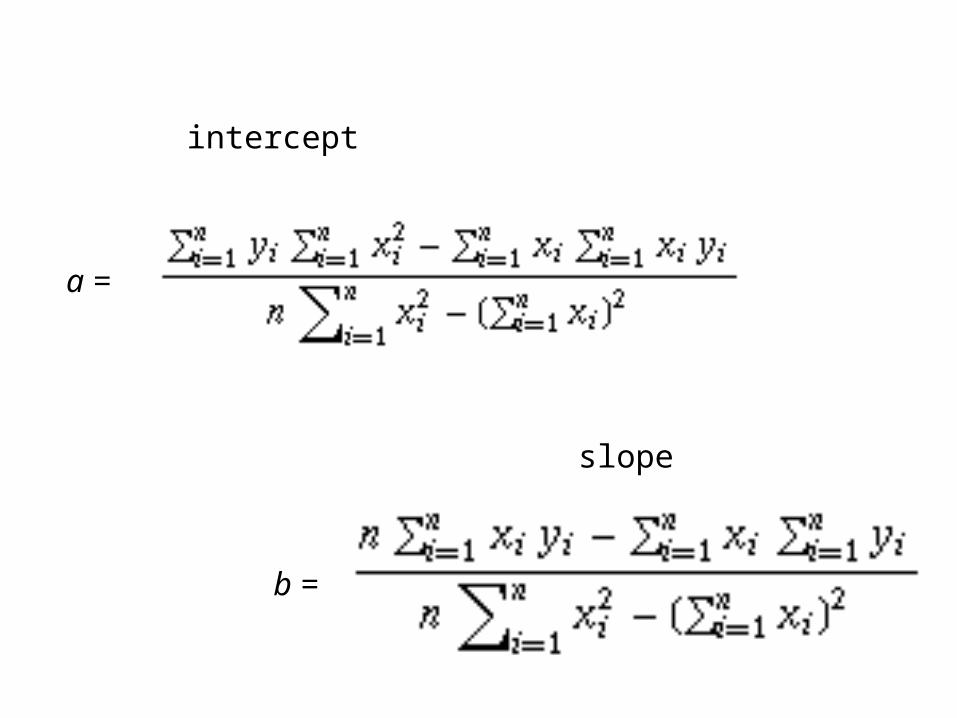
a =
slope
intercept
b =

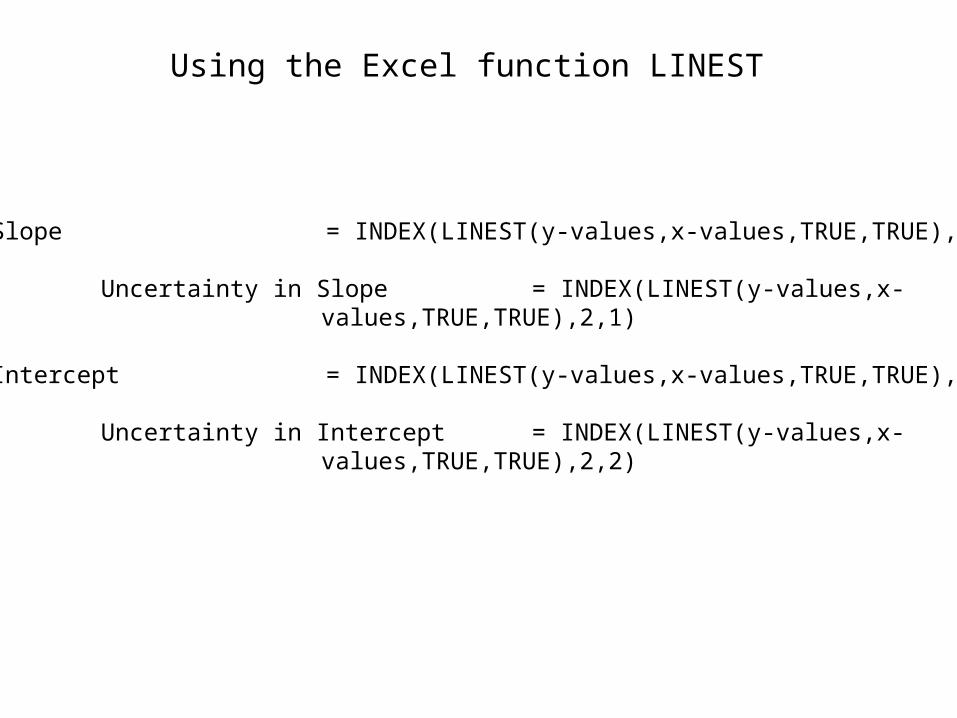
Using the Excel function LINEST
Slope = INDEX(LINEST(y-values,x-values,TRUE,TRUE),1,1)
Uncertainty in Slope = INDEX(LINEST(y-values,x-values,TRUE,TRUE),2,1)
Intercept = INDEX(LINEST(y-values,x-values,TRUE,TRUE),1,2)
Uncertainty in Intercept = INDEX(LINEST(y-values,x-values,TRUE,TRUE),2,2)