Embed Size (px)
Citation preview

Presented to Todd Hamilton, Director Risk ManagementPrabhu RamamoorthyApr 24, 2010
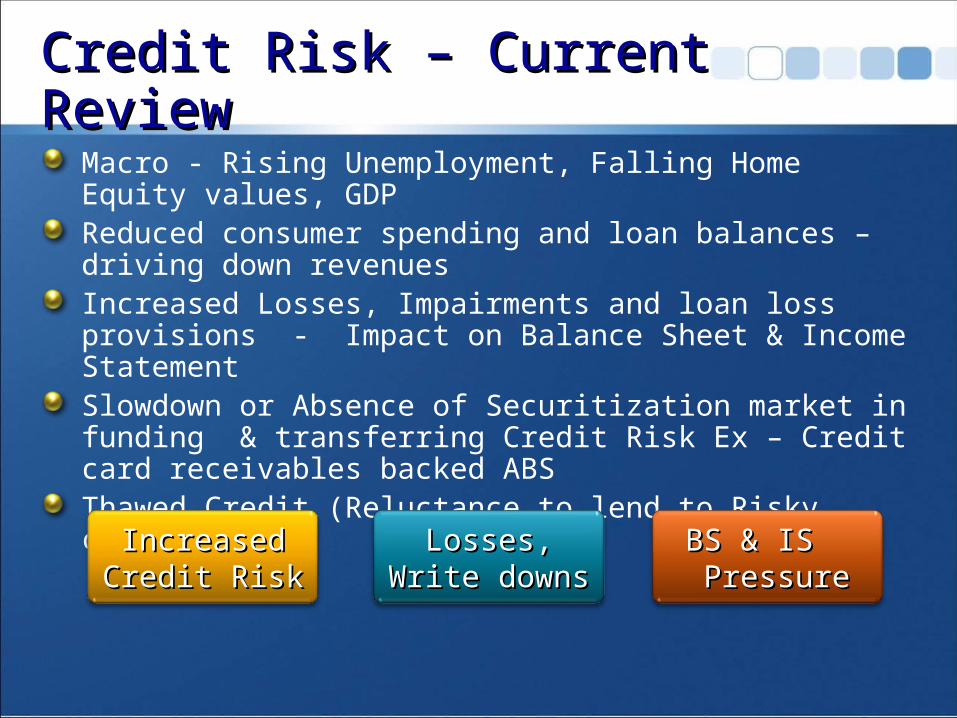
Credit Risk – Current Review Credit Risk – Current Review
Macro - Rising Unemployment, Falling Home Equity values, GDPReduced consumer spending and loan balances – driving down revenuesIncreased Losses, Impairments and loan loss provisions - Impact on Balance Sheet & Income StatementSlowdown or Absence of Securitization market in funding & transferring Credit Risk Ex – Credit card receivables backed ABSThawed Credit (Reluctance to lend to Risky customers)
Source: BASEL II http://www.bis.org/publ/bcbs107.pdf?noframes=1Source: HSBC Finance SEC Annual Report http://www.sec.gov/Archives/edgar/data/354964/000095012310018653/0000950123-10-018653-index.htmSource: http://www.hsbc.com/1/content/assets/investor_relations/hsbc2009ara0.pdf
BS & IS BS & IS PressurePressure
Losses,Losses,Write downsWrite downs
IncreasedIncreasedCredit RiskCredit Risk

Credit Risk in Banks Credit Risk in Banks
Retail Exposure - Credit Cards, SMEs, Mortgage LoansWholesale – Corporate and SovereignCounterparty credit risk - OTC, Derivatives, swaps
Exposure has to be calculated
Also can be analyzed from Balance Sheet and Trading book perspective
Investment Portfolio (Evaluate Credit Risk of Investments)BS – Available for Sale, Held and TradingBS – Assets and Loan exposures mentioned aboveOff-Balance Sheet items
Source: BASEL II http://www.bis.org/publ/bcbs107.pdf?noframes=1Source: HSBC Finance SEC Annual Report http://www.sec.gov/Archives/edgar/data/354964/000095012310018653/0000950123-10-018653-index.htmSource: HSBC PLC Annual Report 2009 http://www.hsbc.com/1/content/assets/investor_relations/hsbc2009ara0.pdf

HSBC North AmericaHSBC North America
HSBC North America – HSBC USA, HSBC Finance, HSBC Canada
Focusing on HSBC Finance Card, Retail Services and Consumer Finance
CompositionRun off Portfolio (Exit Strategy Planned) Core Portfolio (Credit Card & Retail Services)
Loan Modifications in 2009 increased the duration of Run-off Portfolio and the reduced rates due to modifications may reduce the NIM Retain Credit card business for maintaining Credit Quality data
Source: HSBC Holdings PLC JP Morgan Asia Pacific Equity Research 22 April 2010Source: HSBC Finance SEC Annual Report http://www.sec.gov/Archives/edgar/data/354964/000095012310018653/0000950123-10-018653-index.htm

Source: HSBC Finance SEC Annual Report http://www.sec.gov/Archives/edgar/data/354964/000095012310018653/0000950123-10-018653-index.htmSource: HSBC Finance SEC Annual Report
Credit Card, Real Estate and Auto Delinquencies. Reflects today’s serious conditions.

Source: US Credit Card – Credit Card Trusts Credit Suisse Specialty Finance March 15 2010Source: American Express Report The Buckingham Research Group March 15, 2010
Credit Card Delinquencies of Leading Trusts. Shows High Delinquency rates. Are expected to remain flat or head lower for trusts.

Source: http://www.federalreserve.gov/releases/chargeoff/Source: http://www.federalreserve.gov/econresdata/releases/statisticsdata.htm
FDIC Statistics over a longer period shows a spike in delinquency in the last 2 years.Credit card delinquency in blue for Top 100 Commercial Banks.

Source: HSBC Finance SEC Annual Report http://www.sec.gov/Archives/edgar/data/354964/000095012310018653/0000950123-10-018653-index.htm
Charge Off Rates high for Credit Cards, Real Estate secured when compared to Trusts, FDICNote: An accounting change policy took place in 2009 (related to charge-off period).

Source: US Credit Card – Credit Card Trusts Credit Suisse Specialty Finance March 15 2010Source: American Express Report The Buckingham Research Group March 15, 2010
Shows Charge-Offs in Major Credit Trusts tracking the pattern shown earlierCharge-Offs continue to be high.

Source: http://www.federalreserve.gov/releases/chargeoff/Source: http://www.federalreserve.gov/econresdata/releases/statisticsdata.htm
FDIC Statistics over a longer period shows a spike in charge-off in the last 2 years.Credit card Charge-Offs in blue for Top 100 Commercial Banks and charge off rates are extremely high & hit a peak over the historic time period.

Source: HSBC Holdings PLC JP Morgan Asia Pacific Equity Research 22 April 2010Source: HSBC PLC Annual Report 2009 http http://www.hsbc.com/1/content/assets/investor_relations/hsbc2009ara0.pdf
High Loan Loss Provisions for North America. Predicted to decline in future for HSBC North America with recovery. Expected to stay high for HSBC Finance.

Source: HSBC Holdings PLC Barclays Capital Report Financial Services European Banks 29 March 2010Source: HSBC PLC Annual Report 2009 http http://www.hsbc.com/1/content/assets/investor_relations/hsbc2009ara0.pdf
On LHS, Impairments and loan losses continue to be high.On RHS, Shrinking Loan Growth in North America.

Source: http://www.federalreserve.gov/releases/g19/current/Source: http://www.federalreserve.gov/releases/g19/current/Source : US Credit Card – Competitive Trends Credit Suisse Specialty Finance March 23 2010
On LHS, Consumer Revolving Credit declined substantially by 9.6% in 2009.On RHS, CS Revolving changes (annualized) over last 3 months beginning Dec declined.Since June 2008 Credit Lines (Including unused) have come down by 1.4 trillion.In entire 2009, Available credit line decreased by 850 billion (Credit Suisse Estimates).

Source: US Credit Card – Competitive Trends Credit Suisse Specialty Finance March 23 2010Source : Mintel CooperMedia
Card Direct Mailings to acquire customers and competition has increased. Willingness to lend and increase credit card outstanding balances which have been pressurized of late.
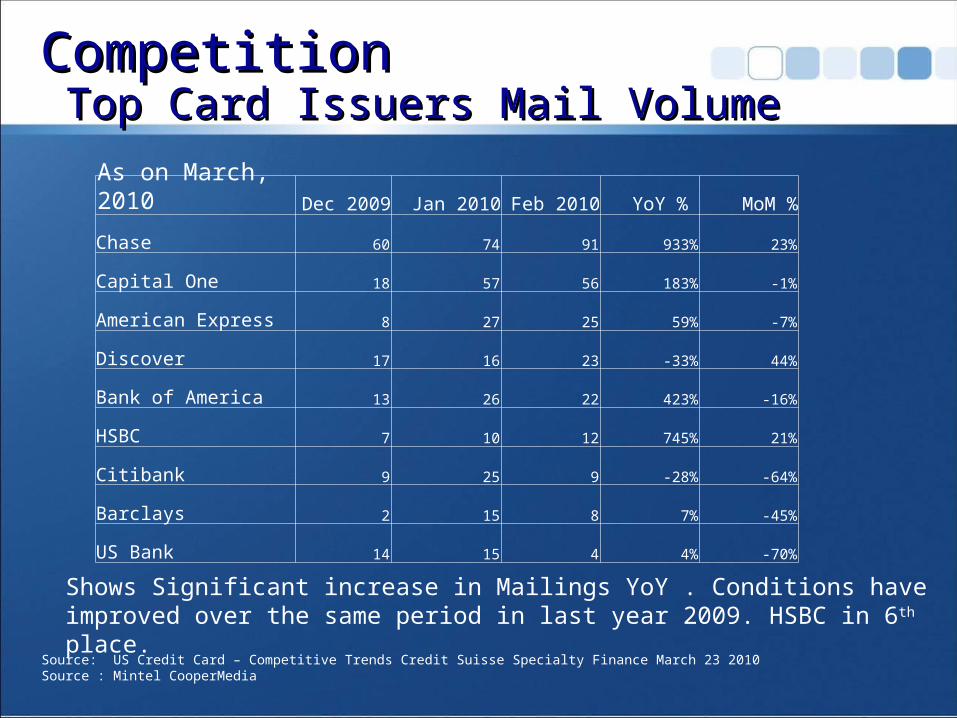
CompetitionCompetition Top Card Issuers Mail Volume Top Card Issuers Mail Volume
Dec 2009 Jan 2010 Feb 2010 YoY % MoM %
Chase 60 74 91 933% 23%
Capital One 18 57 56 183% -1%
American Express 8 27 25 59% -7%
Discover 17 16 23 -33% 44%
Bank of America 13 26 22 423% -16%
HSBC 7 10 12 745% 21%
Citibank 9 25 9 -28% -64%
Barclays 2 15 8 7% -45%
US Bank 14 15 4 4% -70%
Source: US Credit Card – Competitive Trends Credit Suisse Specialty Finance March 23 2010Source : Mintel CooperMedia
As on March, 2010
Shows Significant increase in Mailings YoY . Conditions have improved over the same period in last year 2009. HSBC in 6th place.

Source: US Credit Card – Competitive Trends Credit Suisse Specialty Finance March 23 2010Source : Mintel CooperMedia
Shows product offerings over the last quarters as a percentage of type.On another note, Annual fees also increased (also as a passage of CARD Act).

Source: HSBC Holdings PLC JP Morgan Asia Pacific Equity Research 22 April 2010Source: HSBC PLC Annual Report 2009 http://www.hsbc.com/1/content/assets/investor_relations/hsbc2009ara0.pdf
Declining balances for HSBC Run Off Portfolio and expected Run off.As mentioned earlier, Loan modifications may have prolonged life and reduced NIM.

Source: HSBC Holdings PLC JP Morgan Asia Pacific Equity Research 22 April 2010Source: HSBC PLC Annual Report 2009 http://www.hsbc.com/1/content/assets/investor_relations/hsbc2009ara0.pdf
HSBC Core Portfolio composed of Card and Private Labels.Key to maintaining Credit Quality Data for management purposes.

Source: http://www.ustreas.gov/offices/domestic-finance/debt-management/interest-rate/yield_historical_2009.shtml
Low funding costs. But Prolonged low rates combined with high losses & shrinking assets make it difficult to earn a spread .

Source: HSBC Holdings PLC JP Morgan Asia Pacific Equity Research 22 April 2010Source: HSBC PLC Annual Report 2009 http://www.hsbc.com/1/content/assets/investor_relations/hsbc2009ara0.pdf
On LHS, NIM Actual and Projections for North America.On RHS, You can see that High NIM of HSBC Finance is under pressure and declining.

Source: HSBC Holdings PLC JP Morgan Asia Pacific Equity Research 22 April 2010Source: HSBC PLC Annual Report 2009 http://www.hsbc.com/1/content/assets/investor_relations/hsbc2009ara0.pdf
Reflects exit strategy from CF in HSBC Finance . High LLPs currently. Expected to get better with lower LLP in future.
HSBC North America
Personal Financial Segment FY09 FY10E FY11E FY12E
Total revenue 14,849 12,167 9,495 8,720
Pre-provision profit 9,198 7,025 4,404 3,578
Pre-tax profit -5,226 -3,046 -723 1,560
NIM (NI/AA) 5.84% 5.65% 5.25% 5.25%
Non-II/TR 24% 24% 26% 28%
CIR 38% 42% 54% 59%
LLP/Loans 8.71% 7.30% 4.50% 2.00%
ROA (PBT) -2.71% -1.85% -0.54% 1.31%

External Environment & RegulationsExternal Environment & Regulations CARD ActCARD Act
Prohibits raising of interest rates within 60 days of a late paymentProhibits Changes to contracts(hikes) as a result of late payment on another cardIssuers must provide 45 days advance notice before interest rate hike and changes in writingProhibits issuance of Credit card to people under 21 in principlePrior consent required for over limit feesPromotional APRs must be valid for at least 6 months
ConsequenceReduced Balances & RevenuesHigher feesSource: http://www.kansascityfed.org/comaffrs/creditcards/Webinar.2010.03.08.pdfSource: http://www.federalreserve.gov/consumerinfo/wyntk_creditcardrules.htm

Regulatory RequirementsRegulatory RequirementsBasel II Credit RiskBasel II Credit Risk
Credit Risk Capital CalculationsAIRB -Internal estimates of PD, LGD, EADProbability of Default EstimatesRetail Exposure – Internal DataCorporate - Structural Models such as KMV Merton
Significant Data challenges, quality issuesUsed in Capital Calculations
Source: BASEL II http://www.bis.org/publ/bcbs107.pdf?noframes=1Source: http://www.federatedinvestors.com/ffw/funds/fundoverview.do?basketid=1022&fundshareid=1347&link=products&ut=unregistered_webuser
EADEADLGDLGDPDPD

Banking Models & UsesBanking Models & Uses
Credit Policies & Credit Risk ManagementCredit Scoring Models – Internal, External (A way of expressing Probability of Default)
Bad Rates, Delinquency scoresSegmentation and Individual Scorecards for each segment
Probability of Default Calculations– Logistic Regression, Discriminant Analysis ConsumersSmall Business Credit cardsEx Z score – A Discriminant analysis for scoring companies based on Financial Ratios
Exposure CalculationsLoss forecasts, Return Analysis by Demographics, Product & Borrower CharacteristicsMarketing , Segmentation for exploratory analysis –
CART, CHAID and decision rulesDirect Marketing
Targeted Marketing, Customer selectionPredicting Response Rates for Campaigns
Source: BASEL II http://www.bis.org/publ/bcbs107.pdf?noframes=1Source: Wiley Credit Risk Scorecards Developing and Implementing Intelligent Credit Scoring – Naeem Siddiqi

Credit Scoring ModelsCredit Scoring Models
Credit Score for consumer models – FICO score & Credit Bureaus, borrower characteristics and product characteristicsCredit scoring models for SMEs – combination of business + personal credit scores
Experian, D&B dataIndustry, No of Employees, Size, Geography, Trades opened, SuppliersBankruptcies, Delinquency RateFinancial Information – BS and IS Ratios
Source: BASEL II http://www.bis.org/publ/bcbs107.pdf?noframes=1Source: Wiley Credit Risk Scorecards Developing and Implementing Intelligent Credit Scoring – Naeem Siddiqi

Description CommentsSoundCredit Risk Policies
Due diligence. Operational PoliciesCredit Risk ScoringCredit ConcentrationSetting Notional Limits on ExposureCollateral Management
Prescreening, Monitoring, Diversification, Standardized procedures and well developed internal systems can improve managing credit risk
Insurance Insure Portfolio against losses Insurance may be costly if portfolio has already deteriorated
Pooling & Securitization
Remove from Balance sheet and Transfer risk to other investors. Frees up capital for projects and a funding source
Thaw in Securitization markets. A huge part of the crisis.
Credit Instruments & Hedging
Enter into Offsetting contracts.Example CDSOTC swaps and Derivatives may lead to counterparty credit risk. This can be managed by Netting, Cross Product netting, Collateral, Liquidity Puts
Counterparty credit risk has been a area of great concern in the current financial crisis.
Source: BASEL II http://www.bis.org/publ/bcbs107.pdf?noframes=1Source: http://www.deloitte.com/assets/Dcom-UnitedStates/Local%20Assets/Documents/us_fsi_GlobalRskMgmtSrvy_June09.pdfSource: http://www.sec.gov/Archives/edgar/data/354964/000095012310018653/0000950123-10-018653-index.htm
Basel II requirements and compliance have also assisted in managing risk and capital requirements. A Deloitte report presents interesting insights (see source below).

HSBC Finance SEC 10khttp://www.sec.gov/Archives/edgar/data/354964/000095012310018653/0000950123-10-018653-index.htm
HSBC USA SEC 10khttp://www.sec.gov/Archives/edgar/data/83246/000095012310018586/0000950123-10-018586-index.htm
HSBC Plc Annual Report http://www.hsbc.com/1/content/assets/investor_relations/hsbc2009ara0.pdf
HSBC Holdings Plc JP Morgan Asia Pacific Equity Research 22 April 2010HSBC Holdings Plc Barclays Capital Financial Services European Banks 29 March 2010US Credit Card – Credit Card Trusts Credit Suisse Specialty Finance March 15 2010US Credit Card - Competitive Credit Suisse Specialty Finance March 23 2010American Express Report The Buckingham Research Group March 15, 2010Federal Reserve Statistics
http://www.federalreserve.gov/econresdata/releases/statisticsdata.htmhttp://www.federalreserve.gov/releases/chargeoff/
Wiley Credit Risk Scorecards Developing and Implementing Intelligent Credit Scoring – Naeem Siddiqi