Embed Size (px)
DESCRIPTION
Understanding the Colorectal Cancer Burden in Kentucky: Environmental, Behavioral and Genetic Risk Factors. Presented by: Thomas C. Tucker, PhD, MPH Director Kentucky Cancer Registry Senior Director for cancer Surveillance Associate Director for Cancer Control Markey Cancer Center - PowerPoint PPT Presentation
Citation preview

Understanding the Colorectal Cancer Burden in Kentucky:Environmental, Behavioral and Genetic Risk Factors
Presented by:
Thomas C. Tucker, PhD, MPHDirector Kentucky Cancer RegistrySenior Director for cancer SurveillanceAssociate Director for Cancer ControlMarkey Cancer CenterUniversity of Kentucky
Colon Cancer ForumKnicely Conference Center Bowling Green, KY – Oct. 3, 2013

Topics to be covered
• Factors that contribute to the onset of colorectal cancer.• Colorectal cancer as a % of all cancers incidence cases and deaths.• Colorectal cancer in Kentucky compared to the U.S.• Ranking states by colorectal cancer incidence and mortality rates.• Trends in Kentucky colorectal cancer incidence. • More precisely defining the colorectal cancer burden in Kentucky.• Sources of data available for defining the colorectal cancer burden.• Combining data to better describe the burden of colorectal cancer.• A model for cancer control.• An example of using colorectal cancer incidence data in combination
with other data sources to focus limited resources and measure the impact of interventions.

Factors that contribute to the onset of cancer.
Factors Contributing to the Onset of Cancer
EnvironmentalOccupational
Lifestyle
Family HistoryGenetics
Interactions

Components Contributing to the Onset of Cancer
Lifestyle Factors (68%)
Occupational and Environmental Exposures (18%)
Genetics and Family History (13%)
Source: Harvard Report on Cancer Prevention, Cancer Causes & Control, Vol. 7, Supplement 1, Nov. 1996
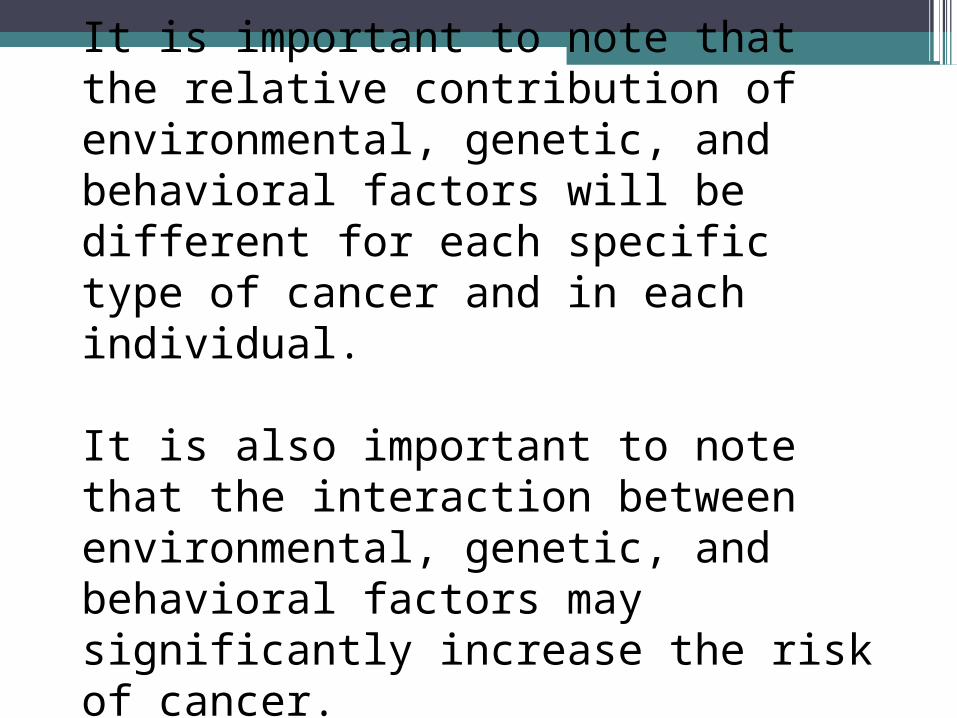
It is important to note that the relative contribution of environmental, genetic, and behavioral factors will be different for each specific type of cancer and in each individual.
It is also important to note that the interaction between environmental, genetic, and behavioral factors may significantly increase the risk of cancer.

Factors Contributing to the Onset of Cancer
EnvironmentalOccupational (18%)
Lifestyle (68%)
Family HistoryGenetics (13%)
Interactions
Colorectal cancer as a % of all cancers incidence cases and deaths.
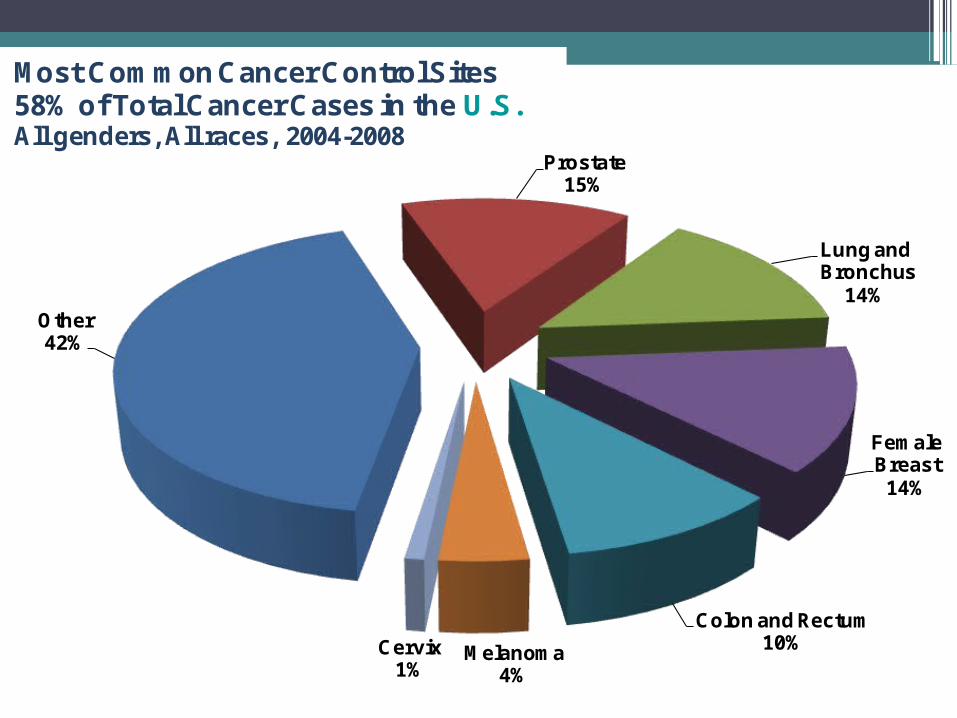
Other42%
Prostate15%
Lung andBronchus
14%
FemaleBreast
14%
Colon and Rectum10%Melanoma
4%Cervix
1%
Most Common Cancer Control Sites58% of Total Cancer Cases in the U.S.All genders, All races, 2004-2008

Other39%
Prostate11%
Lung and Bronchus
18%
FemaleBreast14%
Colon and Rectum11%Melanoma
6%
Cervix1%
Most Common Cancer Control Sites61% of Total Cancer Cases in KentuckyAll genders, All races, 2004-2008

Other48%
Prostate5%
Lung and Bronchus
28%
Female Breast7%
Colon and Rectum9%
Melanoma2%
Cervix1%
Most Common Cancer Control Sites52% of Total Cancer Deaths in the U.S.All genders, All races, 2004-2008

Other42%
Prostate4%
Lung and Bronchus
36%
Female Breast6%
Colon and Rectum9%Melanoma
2%
Cervix1%
Most Common Cancer Control Sites58% of Total Cancer Mortality in KentuckyAll genders, All races, 2004-2008

Comparing colorectal cancer incidence and mortality in Kentucky to the U.S.

Geographic Area Both Genders Males Females
United States 46.2 (46.1-46.3)
53.8 (53.6-53.9)
40.2 (40.0-40.3)
Kentucky 55.1 (54.1-56.1)
65.7 (64.0-67.3)
46.9 (45.7-48.1)
Colorectal Cancer Incidence Rates in the U.S. Compared to Kentucky (2005-2009)
Rates per 100,000 persons and age-adjusted to the 2000 U.S. standard population

Geographic Area Both Genders Males Females
United States 16.7 (16.6-16.8)
20.2 (20.0-20.3)
14.1 (14.0-14.2)
Kentucky 19.8 (19.3-20.4)
24.3 (23.3-25.3)
16.6 (15.9-17.3)
Colorectal Cancer Mortality Rates in the U.S. Compared to Kentucky (2005-2009)
Rates per 100,000 persons and age-adjusted to the 2000 U.S. standard population
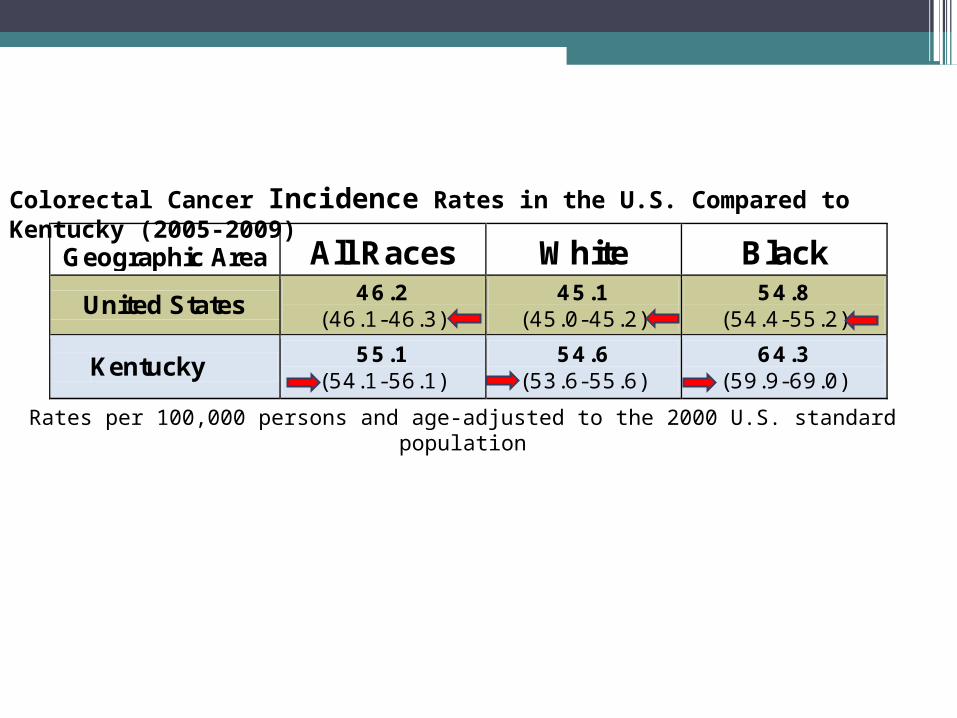
Geographic Area All Races White Black
United States 46.2 (46.1-46.3)
45.1 (45.0-45.2)
54.8 (54.4-55.2)
Kentucky 55.1 (54.1-56.1)
54.6 (53.6-55.6)
64.3 (59.9-69.0)
Colorectal Cancer Incidence Rates in the U.S. Compared to Kentucky (2005-2009)
Rates per 100,000 persons and age-adjusted to the 2000 U.S. standard population
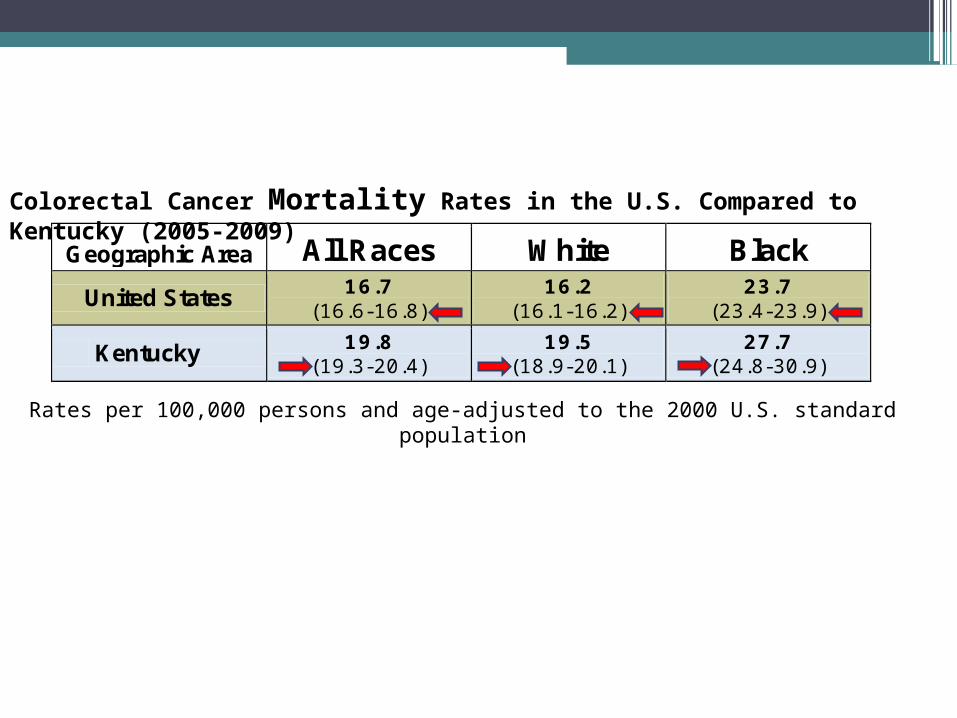
Colorectal Cancer Mortality Rates in the U.S. Compared to Kentucky (2005-2009)
Geographic Area All Races White Black
United States 16.7 (16.6-16.8)
16.2 (16.1-16.2)
23.7 (23.4-23.9)
Kentucky 19.8 (19.3-20.4)
19.5 (18.9-20.1)
27.7 (24.8-30.9)
Rates per 100,000 persons and age-adjusted to the 2000 U.S. standard population

States ranked by colorectal cancer incidence and mortality rates.

Both Genders, Colorectal Cancer Incidence Rates Ranked by State (2005 – 2009)

Both Genders, Colorectal Cancer Mortality Rates Ranked by State (2005 – 2009)

Trends in Kentucky colorectal cancer incidence and mortality rates.


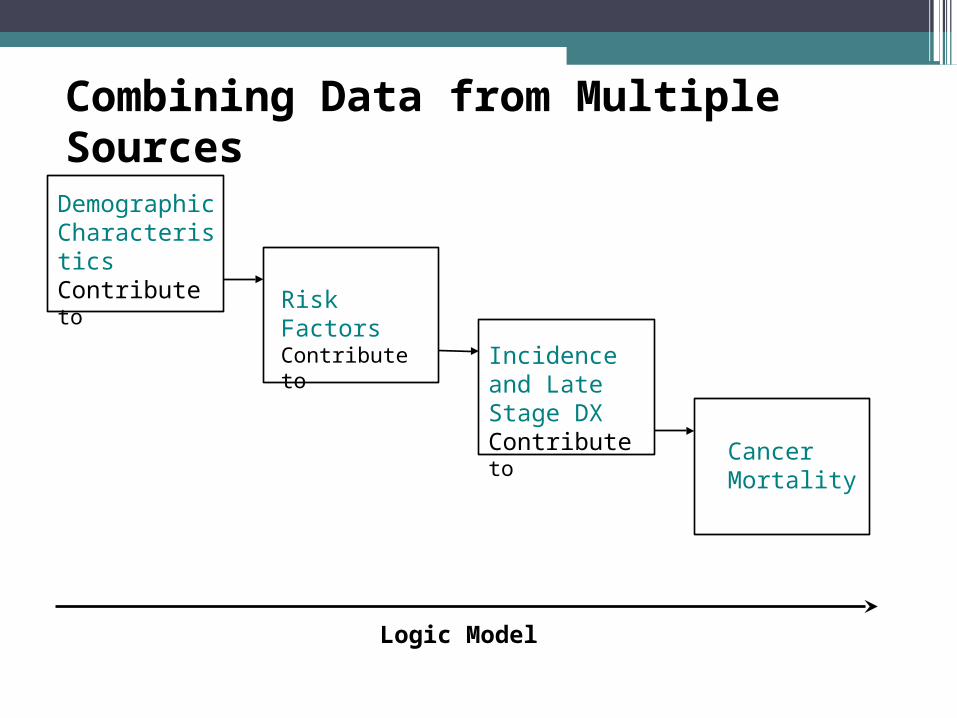
Demographic Characteristics Contribute to
Risk Factors Contribute to
Incidence and Late Stage DX Contribute to
Cancer Mortality
Combining Data from Multiple Sources
Logic Model

Common sources of data that can be used for defining the cancer burden
• Demographic data (Census U.S)• Risk factor data (BRFSS)• Incidence data (KCR)• Mortality data (State Vital Records)

Demographic (U.S. Census) data
• Covers the entire population• Provides details on important factors that influence
the burden of cancer in a population• Is only done once every 10 years in the U.S.• Is difficult to determine the number of people in a
population by race and ethnicity.
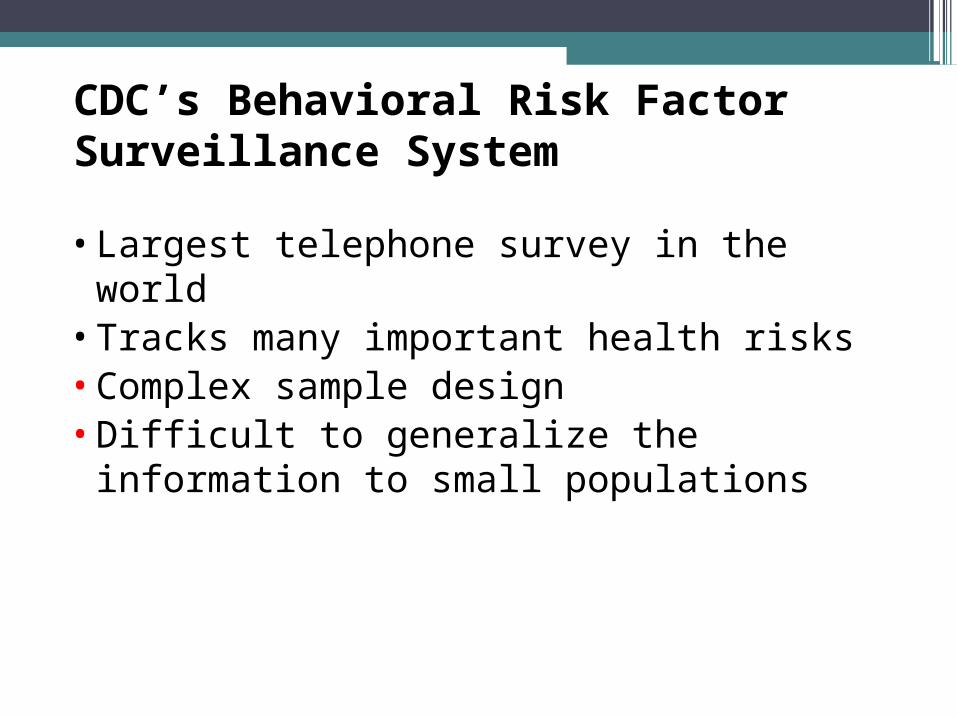
CDC’s Behavioral Risk Factor Surveillance System
• Largest telephone survey in the world• Tracks many important health risks• Complex sample design• Difficult to generalize the information to small
populations
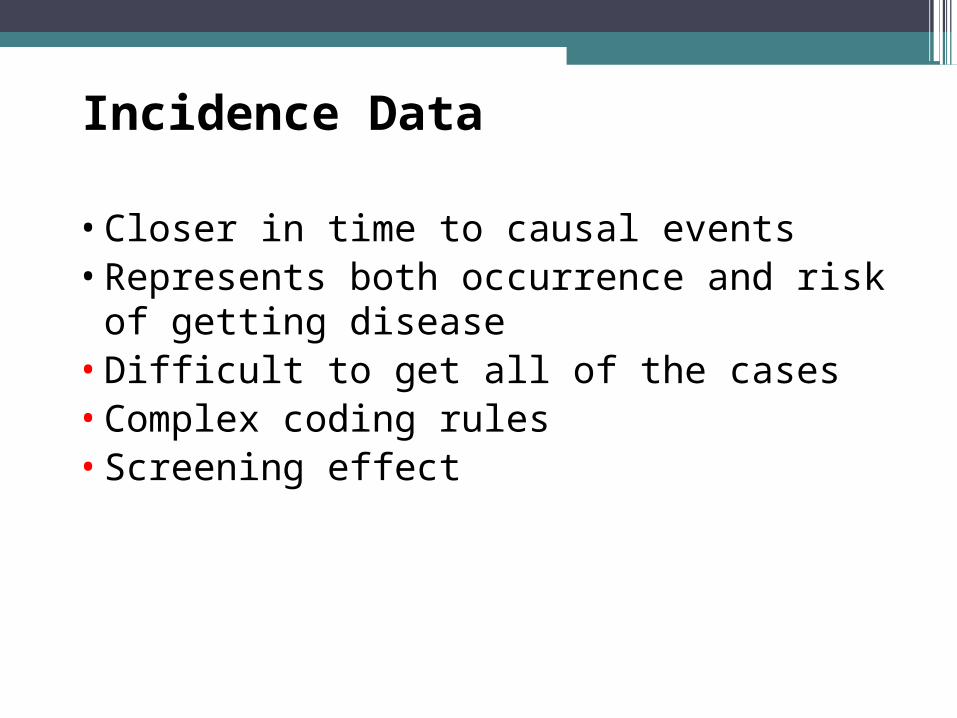
Incidence Data
• Closer in time to causal events• Represents both occurrence and risk of getting
disease• Difficult to get all of the cases• Complex coding rules• Screening effect
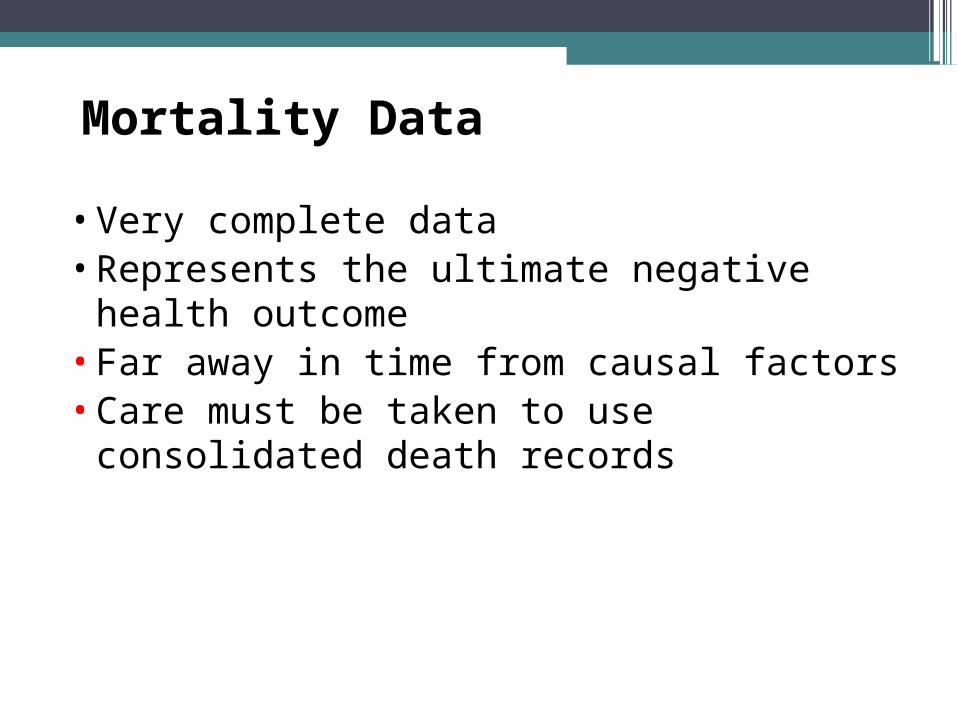
Mortality Data
• Very complete data• Represents the ultimate negative health
outcome• Far away in time from causal factors• Care must be taken to use consolidated death
records

The C-Change Project Objectives
•Build a separate index for the burden of lung, breast, and colorectal cancer.
•Construct the index using demographic data from the U.S. Census; risk factor data from the BRFSS; and incidence, stage at diagnosis, and mortality data from the NAACCR CINA data file.
•Use the index to identify the states with the highest disease burden for lung, breast, and colorectal cancer.
Methodology (Approach)
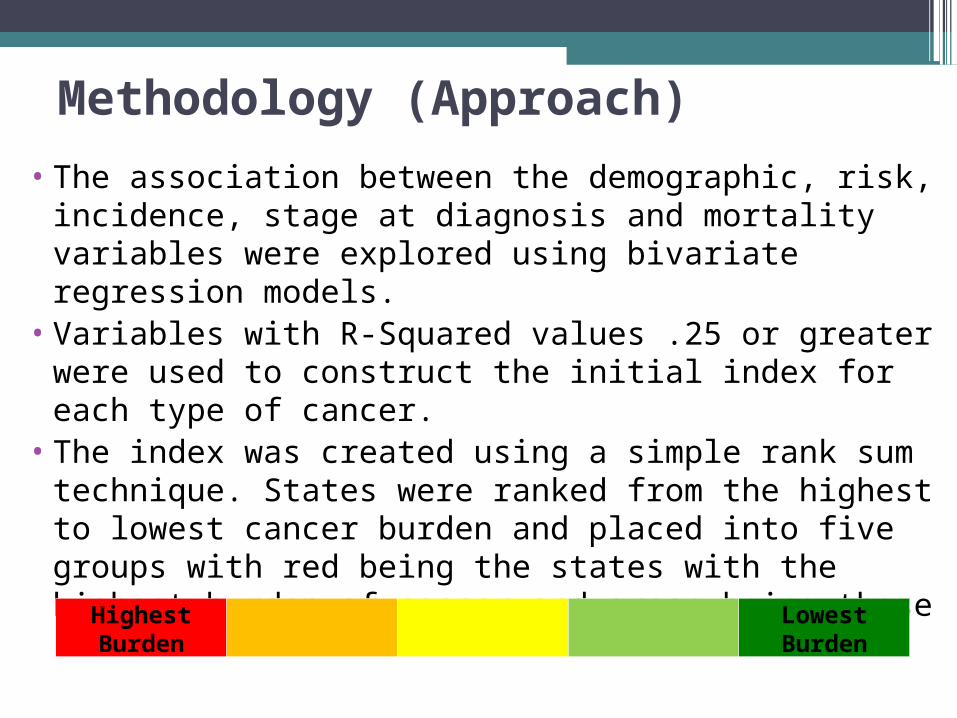
• The association between the demographic, risk, incidence, stage at diagnosis and mortality variables were explored using bivariate regression models.
•Variables with R-Squared values .25 or greater were used to construct the initial index for each type of cancer.
• The index was created using a simple rank sum technique. States were ranked from the highest to lowest cancer burden and placed into five groups with red being the states with the highest burden of cancer and green being those states with the lowest cancer burden.
Highest Burden Lowest Burden

Colorectal Cancer

Colorectal Cancer Rank for States 2008-09
State College Ed+ Colonoscopy Incidence MortalityOverall Index
% Rank % Rank Rate Rank Rate RankMississippi 19.5 3 53.5 2 53.8 2 24.7 1 8Louisiana 20.9 5 51.2 1 53.6 3 23.7 3 12West Virginia 17.3 1 54.1 5 52.4 6 22.4 5 17Kentucky 20.3 4 61.4 30 57.1 1 23.5 4 39Arkansas 19.1 2 54.0 4 45.4 26 22.0 8 40Oklahoma 22.6 9 53.5 3 48.0 16 21.6 13 41Alabama 21.7 6 57.1 14 52.1 8 21.5 15 43Indiana 22.4 8 57.9 18 49.1 14 21.8 10 50Nebraska 27.7 31 55.1 10 50.7 12 22.2 6 59Nevada 21.8 7 55.5 11 45.1 27 21.5 14 59Ohio 24.1 13 59.0 22 47.6 18 21.8 11 64Illinois 30.3 37 57.4 17 52.6 5 22.0 7 66Tennessee 22.7 10 57.9 19 47.3 21 21.0 17 67Pennsylvania 26.4 26 60.7 29 53.2 4 21.7 12 71Alaska 27.0 28 56.6 13 52.3 7 20.1 24 72Iowa 24.5 15 59.8 27 51.2 11 20.6 19 72Missouri 25.0 17 59.6 24 49.1 15 20.8 18 74North Dakota 26.3 25 57.2 16 51.5 10 19.7 26 77Wyoming 23.6 11 54.4 6 41.9 40 19.5 27 84South Dakota 25.3 18 59.3 23 47.0 22 20.2 23 86New Jersey 34.6 44 58.5 21 49.4 13 21.9 9 87Texas 25.8 20 56.2 12 43.5 36 19.2 31 99Montana 27.9 32 54.8 8 45.5 25 18.3 37 102

Hawaii 29.4 34 57.2 15 51.9 9 16.0 48 106South Carolina 24.0 12 62.6 32 41.9 41 20.2 22 107Maine 26.5 27 68.5 43 47.5 20 20.3 21 111Michigan 25.0 16 67.4 40 43.6 35 20.3 20 111New Mexico 25.5 19 54.4 7 38.9 47 17.9 40 113Idaho 24.3 14 54.9 9 40.6 45 16.9 46 114
Georgia 27.2 29 59.7 26 44.6 33 19.5 29 117North Carolina 26.1 23 64.3 34 44.9 30 18.9 32 119Washington DC 49.2 49 66.7 39 44.8 31 24.3 2 121Florida 25.9 22 61.6 31 43.4 37 18.6 34 124New York 32.1 41 64.8 35 47.6 19 19.4 30 125California 30.1 36 58.5 20 44.6 32 17.7 42 130Delaware 27.7 30 71.4 49 45.0 29 19.9 25 133Wisconsin 25.8 21 65.7 38 40.7 44 18.2 39 142New Hampshire 32.9 42 67.9 42 46.3 23 18.5 36 143Oregon 28.6 33 63.8 33 42.2 39 18.3 38 143Arizona 26.3 24 60.4 28 36.0 48 17.1 44 144Maryland 35.7 46 69.1 45 43.2 38 21.2 16 145Massachusetts 38.3 48 68.9 44 46.1 24 18.8 33 149Connecticut 35.2 45 69.1 46 47.9 17 17.0 45 153Rhode Island 30.3 38 69.3 47 44.6 34 18.5 35 154Virginia 33.8 43 67.6 41 41.9 42 19.5 28 154Minnesota 31.4 40 69.6 48 45.1 28 17.8 41 157Colorado 35.9 47 59.6 25 40.0 46 17.5 43 161Washington 31.0 39 65.0 36 41.8 43 16.6 47 165Utah 29.4 35 65.1 37 34.2 49 14.5 49 170
Colorectal Cancer Rank for States 2008-09
State College Ed+ Colonoscopy Incidence MortalityOverall Index
% Rank % Rank Rate Rank Rate Rank

Colorectal Cancer by Area Development District in KY, 2005-2009
Area Development
District
High School
Education (%)
2006-2010
Poverty Rate (%)
2006-2010
Colorectal Cancer
Screening Rate (%)
2006-2010
Age-Adjusted Incidence Late Stage
Incidence %
Age-Adjusted Mortality
Number Rate Number Rate
U.S. 87.6 15.1
Kentucky 81.0 17.4 62.2 13373 58.8 51.4 4410 19.6
Barren River 78.6 19.1 56.0 863 59.0 57.1 286 19.6
Big Sandy 69.0 25.2 55.7 598 68.8 52.3 178 21.2
Bluegrass 84.7 16.9 67.3 2027 54.5 49.9 683 18.7
Buffalo Trace 73.3 22.4 54.5 217 65.9 54.4 75 23.1Cumberland
Valley67.8 28.7 54.4 756 57.7 51.7 286 22.2
Fivco 78.2 19.5 60.0 525 62.8 49.5 157 19.3
Gateway 73.7 25.2 55.8 281 66.8 55.0 98 23.5
Green River 83.0 15.5 62.7 646 53.1 53.8 207 16.9Kentucky
River65.6 29.2 50.8 440 68.4 56.2 140 22.5
Kipda 86.4 14.3 67.3 2926 60.0 49.2 958 19.8Lake
Cumberland70.9 24.3 55.5 706 57.1 52.8 221 17.9
Lincoln Trail 82.7 14.8 59.6 839 63.3 53.1 270 21.0Northern Kentucky
86.4 11.4 64.6 1169 58.4 52.3 413 21.2
Pennyrile 80.1 18.5 57.6 710 57.3 51.7 219 17.8
Purchase 83.0 16.3 66.8 670 53.7 44.7 219 16.9


Colorectal Cancer by Area Development District in KY, 2005-2009
Area Development
District
High School Education, 2006-
2010
Colorectal Cancer
Screening, 2006-2010
Late Stage Incidence Overall
Rank
Percent Rank Percent Rank Rate Rank
Kentucky River 65.6 1 50.8 1 56.2 2 4
Buffalo Trace 73.3 5 54.5 3 54.4 4 12
Gateway 73.7 6 55.8 6 55.0 3 15Cumberland
Valley67.8 2 54.4 2 51.7 11 15
Lake Cumberland 70.9 4 55.5 4 52.8 7 15
Barren River 78.6 8 56.0 7 57.1 1 16
Big Sandy 69.0 3 55.7 5 52.3 8 16
Lincoln Trail 82.7 10 59.6 9 53.1 6 25
Pennyrile 80.1 9 57.6 8 51.7 10 27
Green River 83.0 11 62.7 11 53.8 5 27
Fivco 78.2 7 60.0 10 49.5 13 30Northern Kentucky
86.4 15 64.6 12 52.3 9 36
Bluegrass 84.7 13 67.3 14 49.9 12 39
Purchase 83.0 12 66.8 13 44.7 15 40
Kipda 86.4 14 67.3 15 49.2 14 43

Unique KY Resources for Cancer Control
Kentucky Cancer Registry (KCR)
Kentucky Cancer Program (KCP)Kentucky Cancer Consortium (KCC)
Lung Cancer by Area Development District in KY, 2005-2009
Area Development
District
High School Education 2006-2010
Current Smokers2001-2005
Age-Adjusted Incidence
Age-Adjusted Mortality
Overall Rank
Percent Rank Percent Rank Rate Rank Rate Rank
Kentucky River 65.6 1 35.7 1 124.7 2 99.8 1 5Big Sandy 69.0 3 35.5 2 131.7 1 96.2 2 8
Cumberland Valley 67.8 2 35.5 3 117.2 3 86.0 3 11Gateway 73.7 6 32.0 6 102.1 6 79.9 4 22
Buffalo Trace 73.3 5 33.0 4 96.9 11 78.3 5 25Barren River 78.6 8 31.8 7 105.8 4 78.0 6 25
Lake Cumberland 70.9 4 31.1 10 101.2 7 77.7 7 28Fivco 78.2 7 32.5 5 99.9 8 71.0 10 30
Green River 83.0 11 30.3 11 105.0 5 76.1 8 35Pennyrile 80.1 9 31.3 8 97.2 10 70.1 11 38
Lincoln Trail 82.7 10 31.1 9 96.3 12 66.4 15 46Purchase 83.0 12 28.5 14 97.7 9 69.4 12 47
Northern Kentucky 86.4 15 29.0 12 96.2 13 71.4 9 49Kipda 86.4 14 28.6 13 94.9 14 66.6 14 55
Bluegrass 84.7 13 28.2 15 92.6 15 68.0 13 56
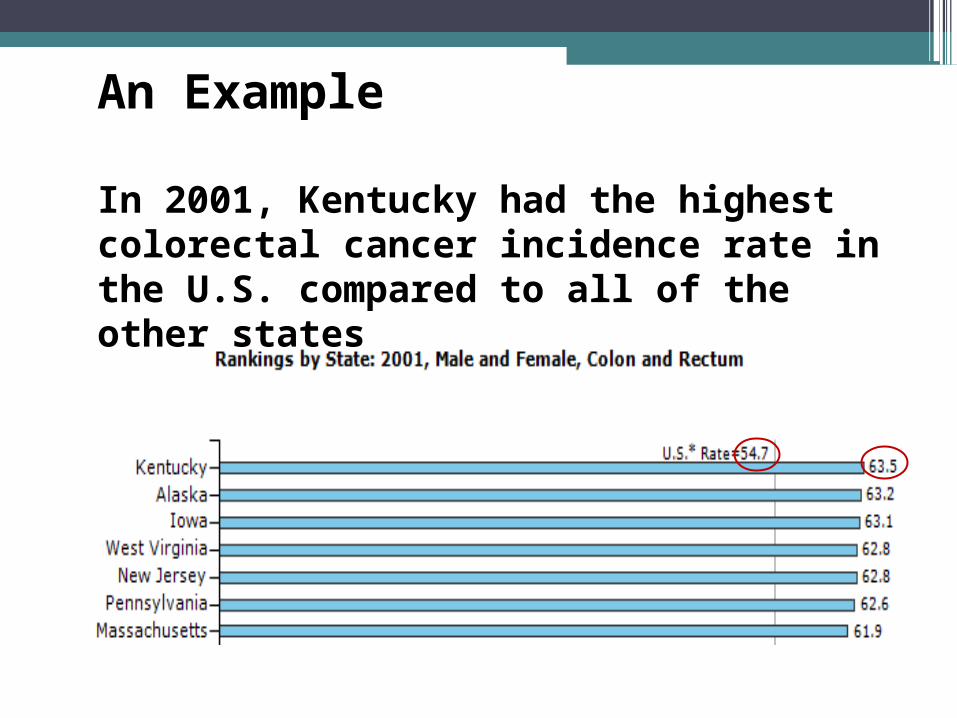
An Example
In 2001, Kentucky had the highest colorectal cancer incidence rate in the U.S. compared to all of the other states

In 2001, it was also noted that Kentucky was ranked 49th in colorectal cancer screening compared to all other states with the second to the lowest rate (34.7% of the age eligible population).
Data about the burden of colorectal cancer was assembled and presented to each of the 15 District Cancer Councils.
Following these presentations, all 15 of the District Cancer Councils implemented evidence-based cancer control programs aimed at increasing colorectal cancer screening for age eligible people living in their District.
What happened following the implementation of these colorectal cancer screening programs?
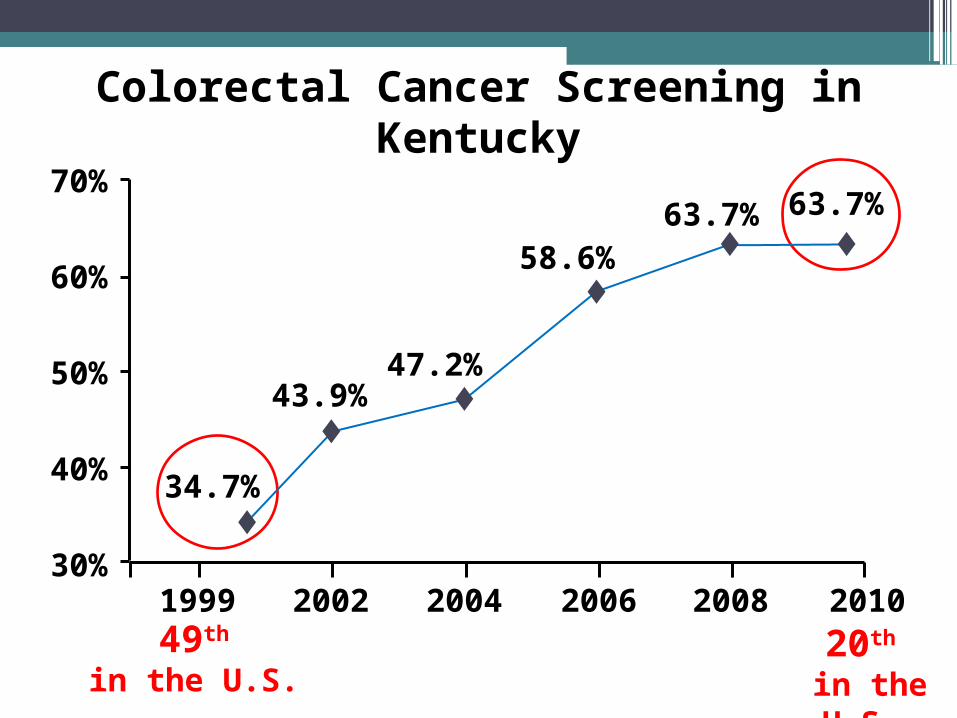
Colorectal Cancer Screening in Kentucky
70%
60%
50%
40%
30%2002 2004 2006
58.6%
47.2%43.9%
34.7%
20081999 2010
63.7%63.7%
49th in the U.S.
20th in the U.S.
The increase in colorectal cancer screening has been accompanied by a 22% decrease in both the incidence and mortality of colorectal cancer in Kentucky. It is important to note that these changes are statistically significant (P<.05). In other words, it is unlikely that these changes happened by random accident.
A 22% reduction in colorectal cancer incidence and mortality in Kentucky is a significant public health success.
Working together we can make a real difference in peoples lives.

Relationship between Areas with High Arsenic Levels and High Colorectal Cancer Incidence Rates in Kentucky
Arsenic and colorectal cancer incidence rates. (Top) Arsenic content and coal field locations in Kentucky; (Bottom) Incidence of colorectal cancer in the Appalachian versus Non-Appalachian region of Kentucky.


Thank You!
QuestionsThe End
Contact Information:Thomas C.Tucker, PhD, MPH
The Kentucky Cancer Registry acknowledges the Centers for Disease Control and Prevention for its support under cooperative agreement U58DP000810 and the National Cancer Institute for its support under contract number N01PC-2010-00031.