Embed Size (px)
Citation preview

Presented by
Rehana Jamal
(GIS Expert & Geographer)
Dated: 02.12.14
Advance Applications of RS/GIS in Geo-Environmental Conservation
Subject
Lecture# 9&10
M.Phil & P.hd
Topic
02 Dec-14 1
Spatial Data Models and Structure
2
Spatial database is a spatial Model of Reality
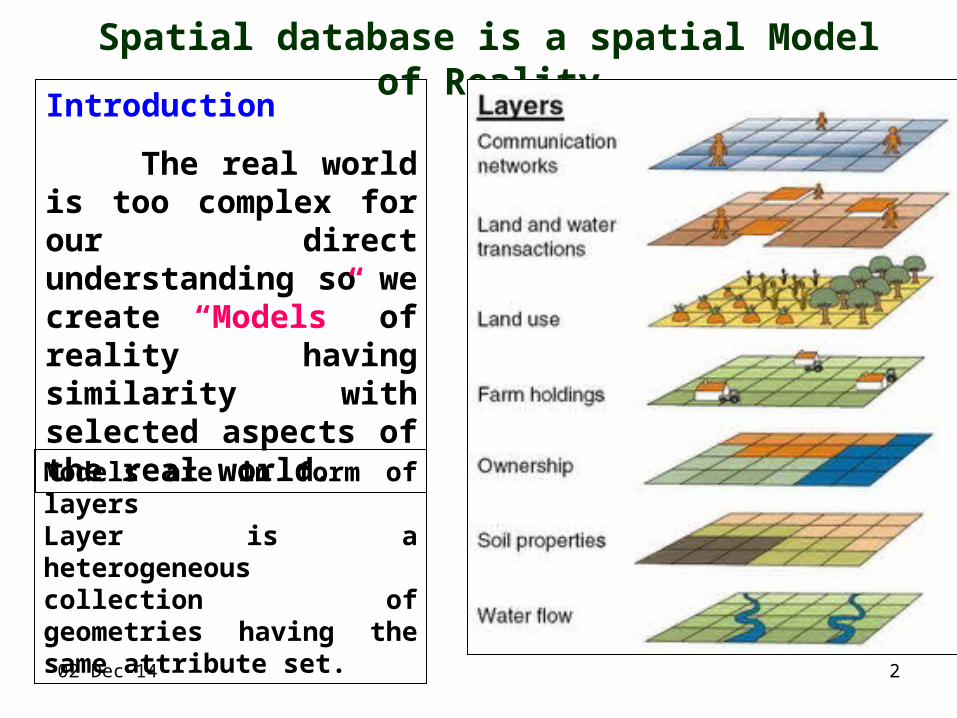
Introduction
The real world is too complex for our direct understanding so we create “Models” of reality having similarity with selected aspects of the real world.
Models are in form of layersLayer is a heterogeneous collection of geometries having the same attribute set.
02 Dec-14

3
Spatial Data Models facilitate
Early analysis of properties, e.g. storage cost, querying ability
Reuse of shared data among multiple applications
Exchange of data across organization
Conversion of data to new software / environment
02 Dec-14
Why Spatial Data Model?
Data structures are complex for GIS because they must include information pertaining to entities with respect to:
positiontopological relationships attribute information.
It is the topologic and spatial aspects of GIS that distinguish it from other types of databases.
First
Second
4
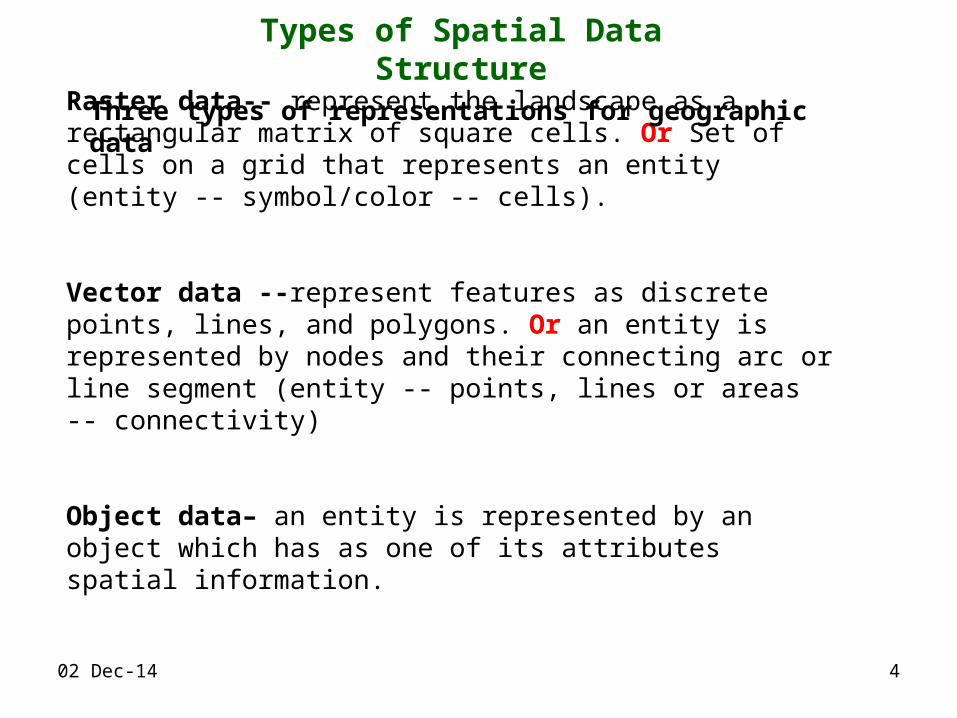
Raster data-- represent the landscape as a rectangular matrix of square cells. Or Set of cells on a grid that represents an entity (entity -- symbol/color -- cells).
Vector data --represent features as discrete points, lines, and polygons. Or an entity is represented by nodes and their connecting arc or line segment (entity -- points, lines or areas -- connectivity)
Object data– an entity is represented by an object which has as one of its attributes spatial information.
Types of Spatial Data Structure
02 Dec-14
Three types of representations for geographic data

5
Raster data models incorporate the use of a grid-cell data structure where the geographic area is divided into cells identified by row and column. This data structure is commonly
called raster.
Raster data Model The term raster implies a regularly spaced grid other tessellated data structures do exist in grid based GIS systems.
Raster data structure represents geographical space by dividing the space into a series of units known as pixels(picture element).
02 Dec-14

VECTOR VECTOR CHARACTERISTICSCHARACTERISTICS
POINT ×
LINE
POLYGON
6
× × × ×
× ×
×
×
×
02 Dec-14 6

7
Point
Line
Polygon
Vector dataRaster data
02 Dec-14

DATA MODELS OF RASTER AND VECTORDATA MODELS OF RASTER AND VECTOR
REAL WORLD 1 2 3 4 5 6 7 8 9 10
1
2
3
4
5
6
7
8
9
10
GRID RASTER VECTOR 802 Dec-14
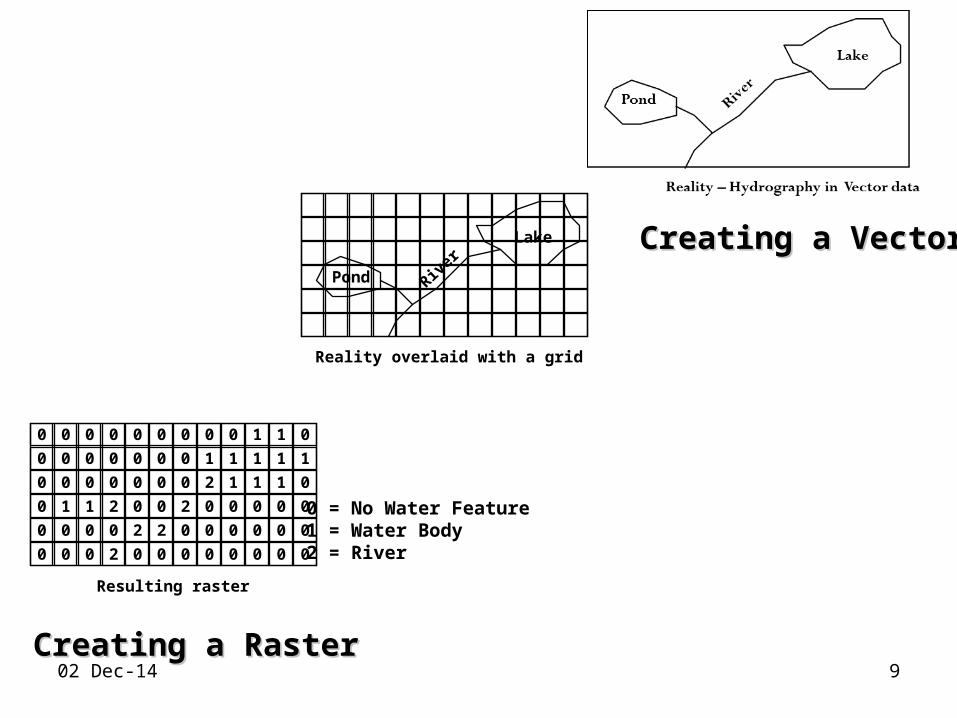
Pond
Lake
River
Reality overlaid with a grid
1 1 0
11
1 1 1
11 1
2
2
22
2
2
11
0 0 0 0 0 0 0 0 0
0 0 0 0 0 0 0
0 0 0 0 0 0 0 0
0 0 0 0 0 0 0 0
0 0 0 0 0 0 0 0 0 0
0 0 0 0 0 0 0 0 0 0 0
Resulting raster
Creating a RasterCreating a Raster
0 = No Water Feature1 = Water Body2 = River
9
Creating a VectorCreating a Vector
02 Dec-14

10
A point is represented by an explicit x,y coordinate in vector format, but as a raster, it is represented as a single cell —the smallest unit of a raster. By definition, a point has no area but is converted to a cell representing area.
Point
02 Dec-14
11
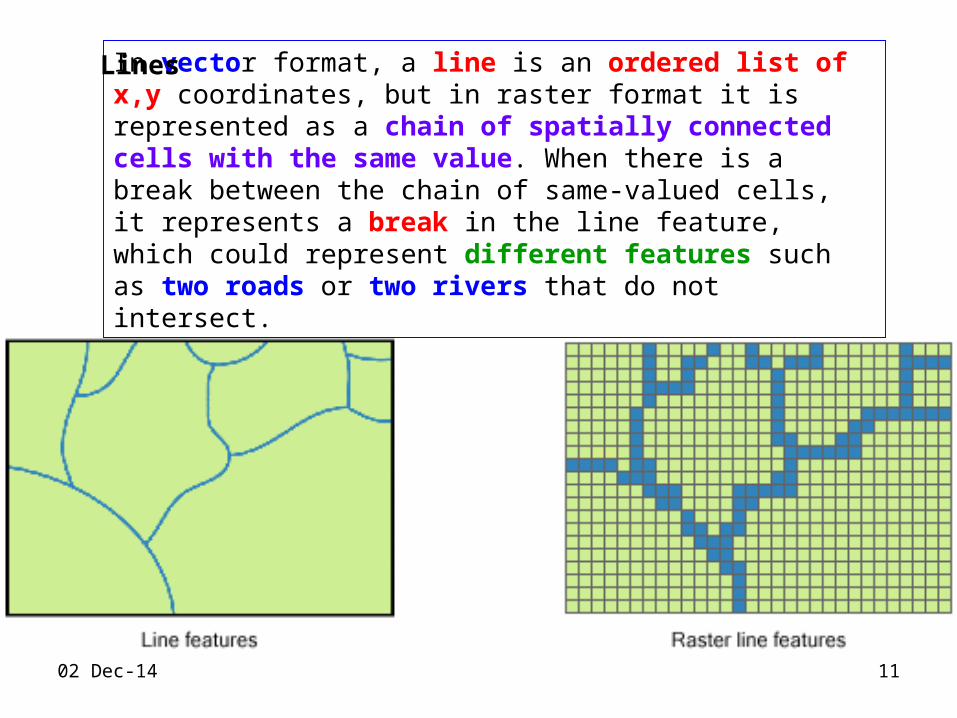
In vector format, a line is an ordered list of x,y coordinates, but in raster format it is represented as a chain of spatially connected cells with the same value. When there is a break between the chain of same-valued cells, it represents a break in the line feature, which could represent different features such as two roads or two rivers that do not intersect.
Lines
02 Dec-14
12
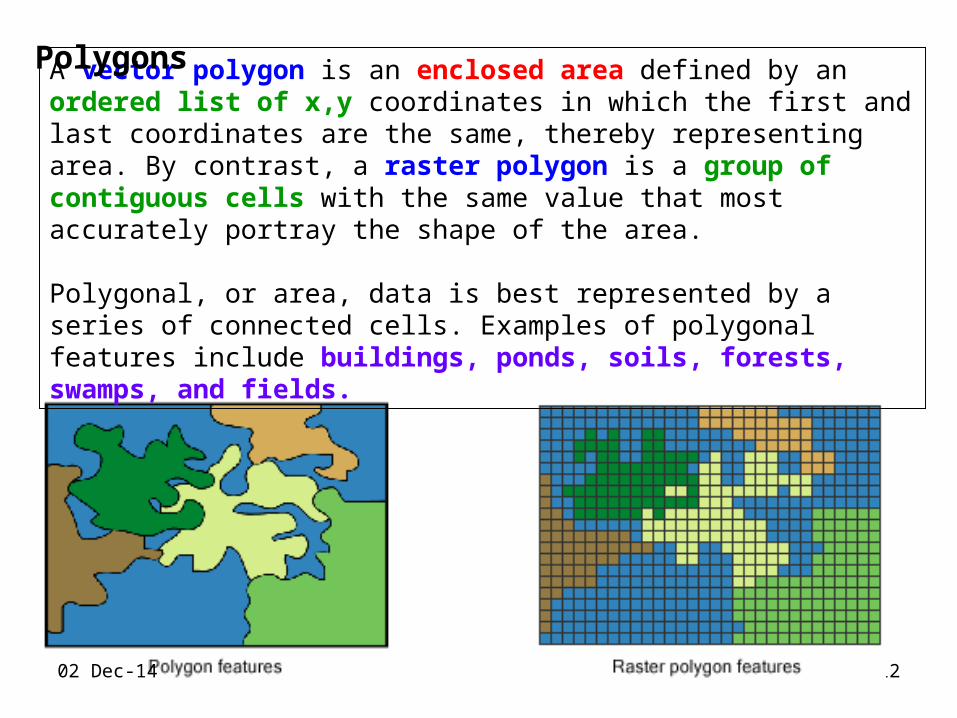
A vector polygon is an enclosed area defined by an ordered list of x,y coordinates in which the first and last coordinates are the same, thereby representing area. By contrast, a raster polygon is a group of contiguous cells with the same value that most accurately portray the shape of the area.
Polygonal, or area, data is best represented by a series of connected cells. Examples of polygonal features include buildings, ponds, soils, forests, swamps, and fields.
Polygons
02 Dec-14
13
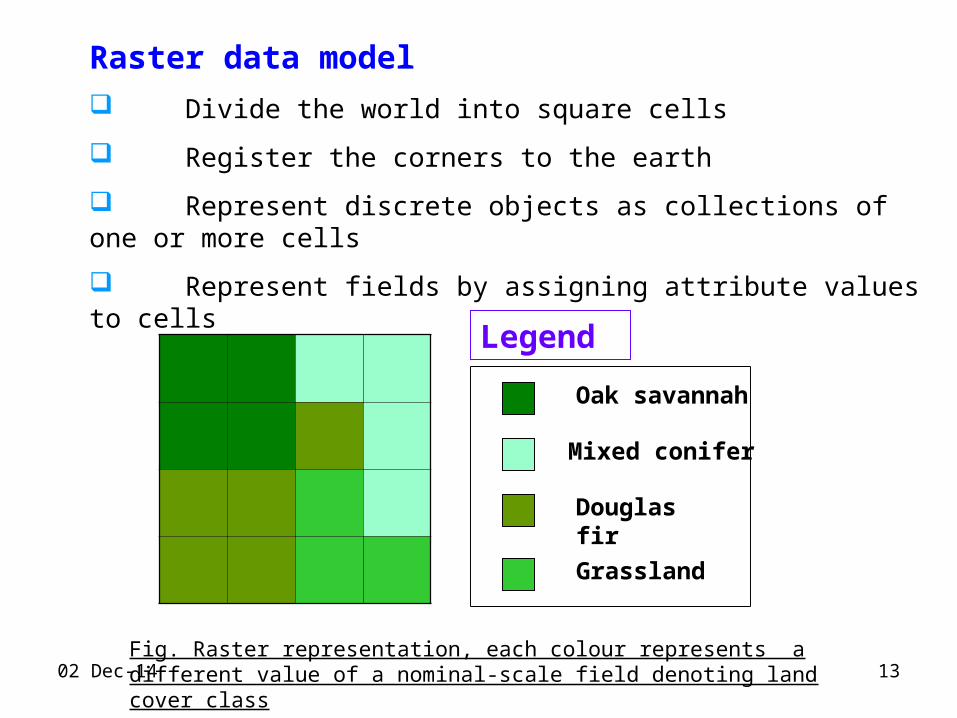
Raster data model
Divide the world into square cells
Register the corners to the earth
Represent discrete objects as collections of one or more cells
Represent fields by assigning attribute values to cells
Oak savannah
Grassland
Mixed conifer
Douglas fir
Legend
Fig. Raster representation, each colour represents a different value of a nominal-scale field denoting land cover class02 Dec-14

grids (ArcGIS & ArcInfo specific)
graphical images (TIFF, JPEG, BMP, GIF, etc.)
USGS DEM (Digital Elevation Model)
remotely-sensed images (Landsat, SPOT, Quick bird, World View 1, AVHRR etc)
Types of Raster Data
02 Dec-14 14
15
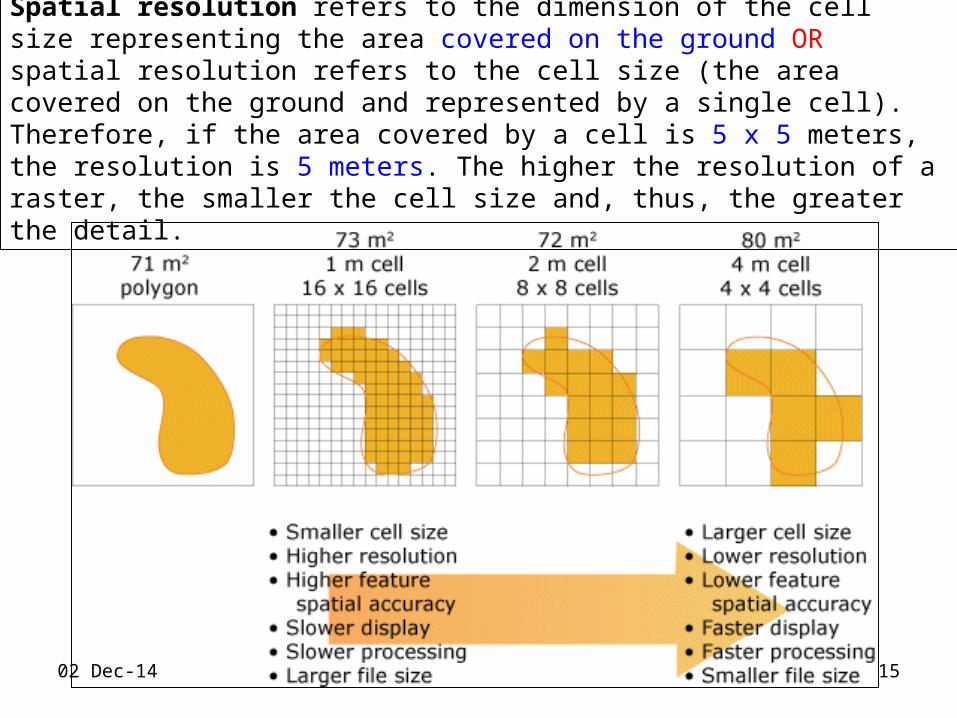
Spatial resolution refers to the dimension of the cell size representing the area covered on the ground OR spatial resolution refers to the cell size (the area covered on the ground and represented by a single cell). Therefore, if the area covered by a cell is 5 x 5 meters, the resolution is 5 meters. The higher the resolution of a raster, the smaller the cell size and, thus, the greater the detail.
02 Dec-14
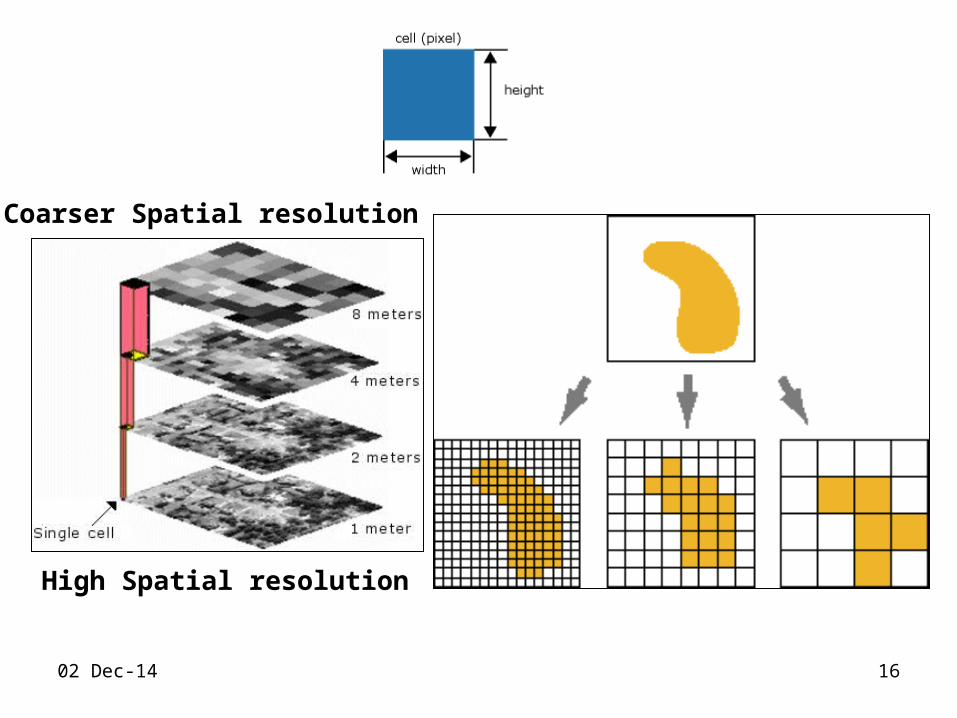
16
Coarser Spatial resolution
High Spatial resolution
02 Dec-14
17
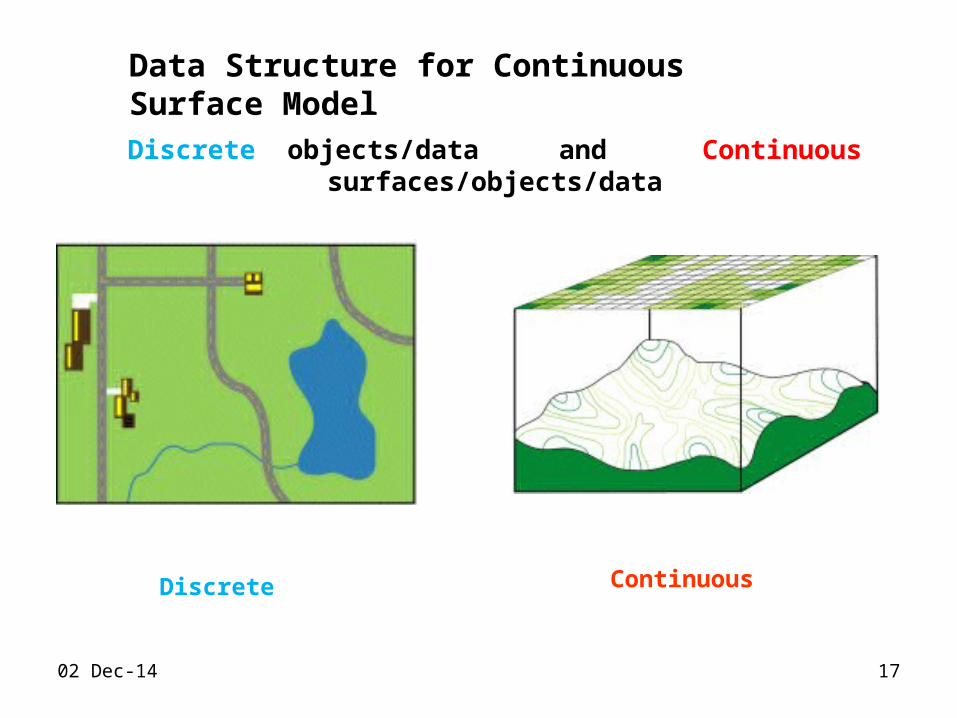
Discrete Continuous
Discrete objects/data and Continuous surfaces/objects/data
Data Structure for Continuous Surface Model
02 Dec-14
18
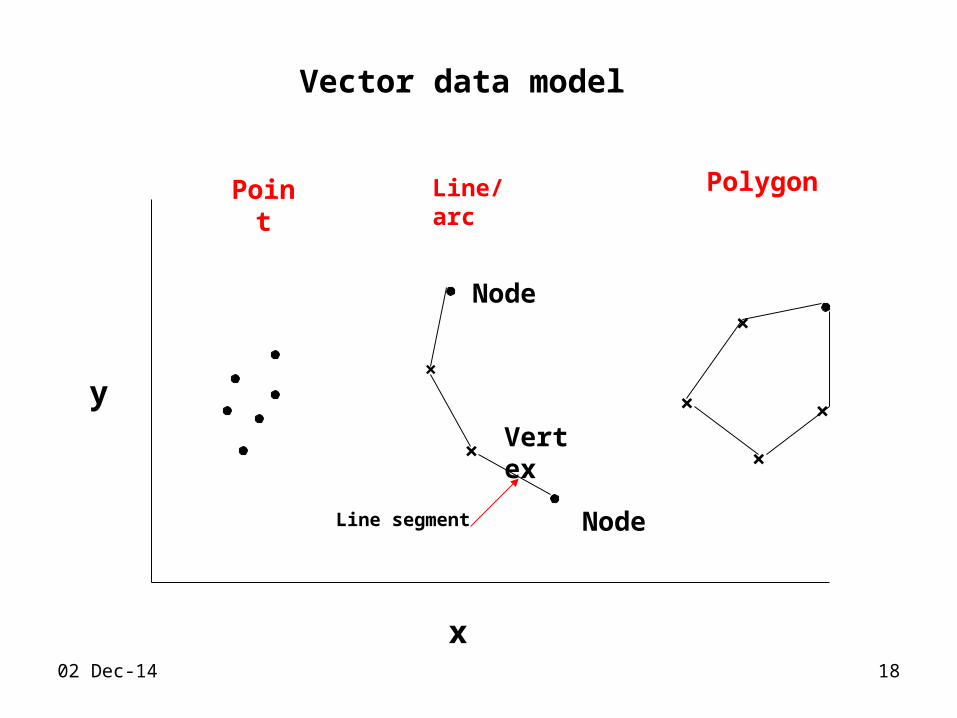
Vector data model
x
y
Point Line/arc Polygon
Node
Vertex
×
×
×
×
×
×
Line segment Node
02 Dec-14

19
Topological data Structure (model)
TopologyTopology is that branch of mathematics used to define spatial relationships between entities (ESRI 1992). For example, an area or polygon is defined by a set of lines which makes up its boundaries. In this case the line is the border between two polygons.
The connectivity or contiguity of these features is referred to as their topology structure (ESRI 1992). By sorting information about the location of a feature relative to other features, topology provides the basis for many kinds of geographic analysis without having access to the absolute locations held in the coordinate files (ESRI 1992).
Topological data Structure
02 Dec-14 19

20
Topological data Structure (model)
The Topological data model is termed Arc-Node data model.
Arc the basic logical entity, a series of point that starts and end at a node.
Node is an intersection point where two or more arcs meet. A node can also occur at the end of a dangling arc i.e. and arc that is not connected to another arc such as the end of
a dead-end street.
Polygon is comprised of a closed chain of arcs that represents the boundary of the area.
Point is encoded as a single XY co-ordinate pair. Point is considered as the polygon with no area.
02 Dec-14

Vector GIS data models
21
Spaghetti model
Topological vector model
TIN (Triangular Irregular Network)
02 Dec-14

Spaghetti model
2202 Dec-14
23
0 10 20 30 40 50 60 70
70
60 50
40
30
20
10
0
a6.D. N5
a7
a7
a7
a7
N6
N1
N2
N3
N4
a1
a2
a2
a2
a3
a4
a4
a5
A
B
C
E
E
X-axis
Y-a
xis
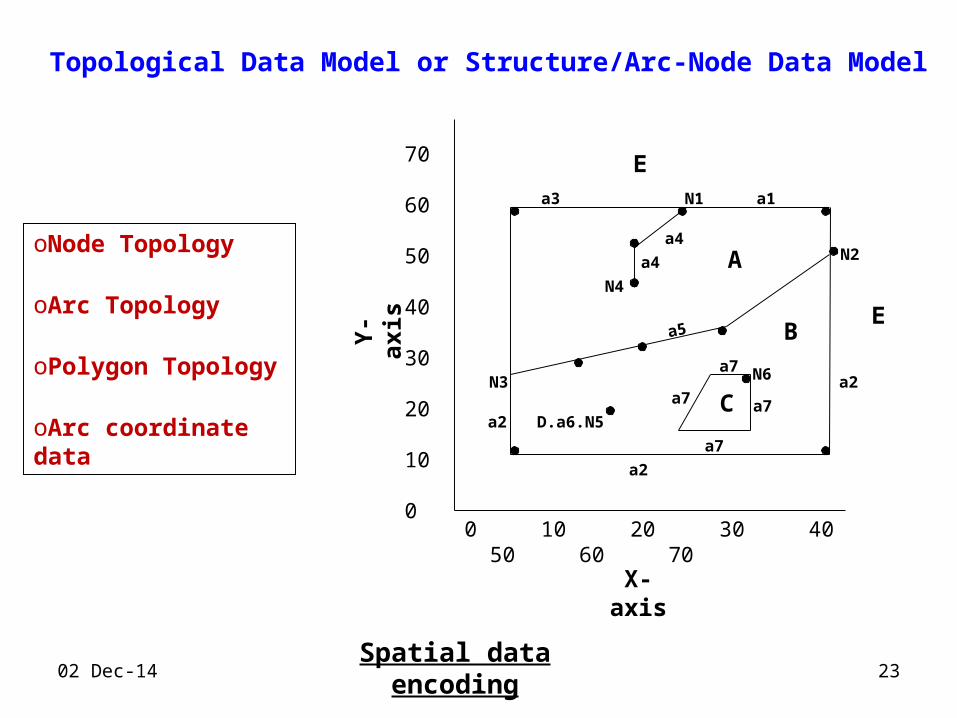
Spatial data encoding
oNode Topology
oArc Topology
oPolygon Topology
oArc coordinate data
Topological Data Model or Structure/Arc-Node Data Model
02 Dec-14

24
A 1,4,5
B 2,4,6
C 3,5,6
A
B C
i. 1 4
ii. 4 4
iii. 6 4
iv. 4 1
Node X Y
1 2 3 4 5 6
2
3
4
5
6
1
iii
iii
iv
1 i iii O A
2 i iv B O
3 iii iv O C
4 i ii A B
5 ii iii A C
6 ii iv C B
Line From To Left Right
Poly Lines
O = “outside” polygon1
2 3
4 5
6
Topological Data Model or structure/Arc-Node Data Model
02 Dec-14

The Triangulated Irregular Network (TIN) data model is an alternative to the raster and vector data models for representing continuous surfaces.
The Triangulated Irregular Network (TIN) data model
TIN Data Model
Four Tables for TIN Model
Node Table it lists each triangle and the nodes which define it.
Edge Table it lists three triangles adjacent to each facets. The triangles that border the boundary of the TIN show only two adjacent facets.
XY Co-ordinate Table it lists the co-ordinate values of each node.
Z Table it is the altitude value of each node. 02 Dec-14 25

26
Topological Relationships between Spatial Objects orSpatial relationship in Topological data model
Containment
Contiguity/Adjacency
Connectivity
02 Dec-14

27
Raster dataVector data Object data
02 Dec-14
Three types of representations for geographic data
Summary
Spatial Data Models and Structure
Spaghetti model
Topological vector model
TIN (Triangular Irregular Network)

28
Possible Exam Questions
Q1.Differentiate the following: 5 Marks each
i.Raster and Vector data modelii.Data model and Data structureiii.Spaghetti and Topological data modeliv.Raster and Vector data model
Q2.Write a note on the following: 5 Marks each
i.TIN data modelii.Spaghetti data modeliii.Raster and Vector data model
Q3.Describe in detail with diagrams the “Spatial data models”. 15 Marks
02 Dec-14
29
References:
www.yahoo.com
www.esri.com
“Geographic Information System” by Stan Aronoff
(http://www.olemiss.edu/depts/geology/courses/ge470/RasterDataModel.htm#8b.1)
02 Dec-14


![LEC words for PER MS and QP 1.2 · Answer(a) [1] (b) the order of rotational symmetry. Answer(b) [1] 9 Rehana pays $284 in tax. This is 2 9 of the money she earns. How much does Rehana](https://img.dokumen.tips/doc/110x75/5f1784efb112c444cd78d29b/lec-words-for-per-ms-and-qp-12-answera-1-b-the-order-of-rotational-symmetry.jpg)