Embed Size (px)
Citation preview

DRAFTDRAFT
Investor PresentationOctober 2016

DRAFT
Disclaimer
2
This document has been prepared by Space2 S.p.A. (“Space2” or the “Company”) exclusively for use in thepresentation of the envisaged business combination between Space2 and the target company.This document does not constitute or form part of any offer or invitation to sell, or any solicitation to purchaseany shares or any other kind of financial instruments issued or to be issued by Space2 and/or the combined entityresulting from the envisaged business combination between Space2 and the target company.Not all the information contained and the opinions expressed in this document have been independently verified.In particular, this document contains forward-looking statements that are based on current estimates andassumptions made by the management of Space2 to the best of their knowledge. Such forward-lookingstatements are subject to risks and uncertainties, the non-occurrence or occurrence of which could cause theactual results including the financial condition and profitability of Space2 and the combined entity resulting fromthe envisaged business combination to differ materially from, or be more negative than, those expressed orimplied by such forward-looking statements. Consequently, Space2 and its management can give no assuranceregarding the future accuracy of the estimates of future performance set forth in this document or the actualoccurrence of the predicted developments.The data and information contained in this document are subject to variations and integrations. Although Space2reserves the right to make such variations and integrations when it deems necessary or appropriate, Space2assumes no affirmative disclosure obligation to make such variations and integration and no reliance should beplaced on the accuracy or completeness of the information contained in this document. No person accepts anyliability whatsoever for any loss howsoever arising from the use of this document or of its contents or otherwisearising in connection therewith.By accepting this document, you agree to be bound by the foregoing limitations.

DRAFTTable of Contents
1. Investment overview
2. Financials
3. Appendix
3

DRAFTAvio’s capital structure upon transaction closing
Access to broader space technologies and further
global presence
Vision, leadership and competence
Access to capital markets
Space2 investorsFree float
LeonardoAvio
Management
4
4%(1)28%(1)68%(1)
(1) Shareholding structure at Business Combination with the acquisition of 85.7% stake and assuming that (i) no Space2 shareholder exercises the Right to Withdrawal and (ii) Avio Management acquires 5.6% of the Avio share capital (“Base Case”)

DRAFT
5
1. Investment overview

DRAFT
Avio: a key player in EU Space Launchers
6
Vega
• 10 tons to Geostationary Orbit
• Large Telecom & Broadcasting Satellites
• Current flight rate : 6/year
• In operation since 1996
• 1,5 tons to Low Earth Orbit
• Small Earth observation Satellites
• Current flight rate : 3/year
• In operation since 2012
Ariane 5
Industrial partner (ca. 10% share(1)) Prime Contractor (ca. 65% share(1))
(1): Management estimate
DRAFT
Delivering satellites to different orbits for different applications
7
36k km
300 / 2000 km
20k km
GEO/GTO orbits 36,000 km
(Heavy launchers)
MEO orbits 22,000 km
(Medium launchers)
LEO orbits 300-1,500 km
(Light launchers)
Atmosphere
Altit
ude
(km
)
TelecomBroadcasting
Navigation
Satellite mass (kg)2000 kg 4000 kg 6000 kg1000 kg
Satellite internet constellations
Weather forecasting
DRAFT
It takes 5 min to get to Space, two hours to position satellites
8
First three stages:7.5km/s reached and out of atmoshere
Fourth stage first firing: orbital conditions reached
Fourth stage second firing: circular orbital reached
Fourth stage third firing: de-orbiting
Example of typical Low Earth Orbit mission
Propelled phase
Coasting phase
Earth’s atmosphere
800km
200km
5min 1hr 2hrs
Propulsion stages separations
Fairing separation
Upper stage maneuvers and satellite injection into orbit
DRAFT
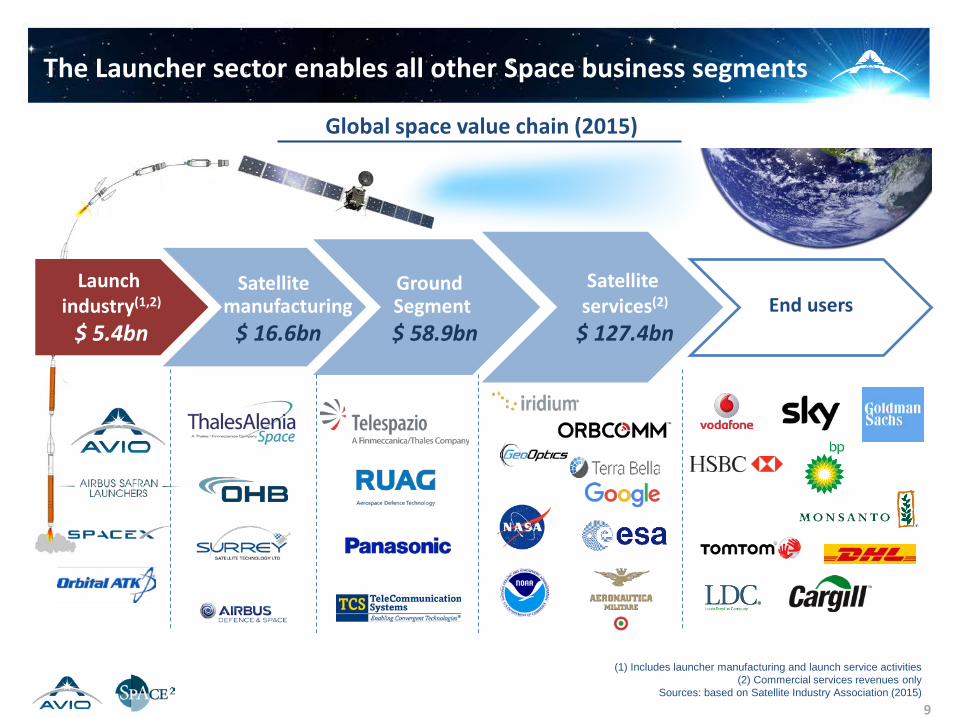
The Launcher sector enables all other Space business segments
Satellite manufacturing
$ 16.6bn
Satellite services(2)
$ 127.4bnEnd users
Global space value chain (2015)
Launch industry(1,2)
$ 5.4bn
(1) Includes launcher manufacturing and launch service activities(2) Commercial services revenues only
Sources: based on Satellite Industry Association (2015)
Ground Segment$ 58.9bn
9

DRAFTEnd-market demand is driven by traditional and innovative application domains , requiring different orbits
End
user
s
Our daily lifestyle hinges upon what happens in space
10
Broadband Data
Earth observation
TechnologyMeteorologyNavigation
• Mobile Data• Managed network
services (fleet management)
• Machine 2 machine
• Agriculture and urban planning
• Mining development
• Disaster management
To gain deeper insight of the
earth’s surface
To connect people and devices worldwide
• Weather forecast• Climate change /
environment analysis
To discover new worlds and the
cosmos
To understand and forecast the
weather
• In-orbit testing• Health
experiments
• Navigation• Positioning
To navigate people to their
destinations
Broadcasting & Telecom
• Satellite television / satellite radio
• Satellite broadband
• Mobile communication
GEO MEO LEO
Orb
its
To provide communication
servicesAppl
icat
ions

DRAFT
Source: Union of Concerned Scientists, Teal Database, Science and Technology Policy Institute, LCA Elaboration
Totalsatellites
The number of satellites to be launched will double in the next 5 years
The number of total satellites in orbit will be pushed by commercial exploitation of space, in particular with the deployment of new satellite constellations in LEO orbits
2010 - 2015 2016 - 2020
642 1,318≈ 2 X
Satellites to be launched by customer (2010 - 2020)
436 636
206 682≈ 3 X
≈ 1.5 X
Commercialcustomers
Institutionalcustomers
# of satellites
of w
hich
11
o/w 70% accessible market for
EU launchers

DRAFT
Sources: OECD: The Space Economy at a Glance 2014, LCA Elaboration
The average size of a satellite will become much smaller
Lower orbit serviced with
light launchers
Higher orbit reached by
heavy launchers
By mass (2010 - 2020)
0%
10%
20%
30%
40%
50%
60%
70%
80%
90%
100%
< 1,5 tons
> 1,5 tons
47%
53%
12
Satellite market% of
satellites
SatCom
SmallSat for E.O.
90%
10%

DRAFT
27
HIIA
Epsilon
Competitive landscape in the launch service business
EU fleet covers all relevant segments and provides extremely reliable services
GEO/GTO orbits
36,000 km
(Heavy launchers)
MEO orbits
22,000 km
(Medium launchers)
LEO orbits
300-1,500 km
(Light launchers)
2006-2015 launches 183
Falcon 9 Atlas 5
Delta 2
Minotaur
29
GLSV
PSLV
65287
Proton
Soyuz
Rockot Dnepr
136
CZ-3
CZ-4
CZ-2C
Global launch industry segmentation by orbit
(1) It does not take into considerations 15 Soyuz launches realised by Kourou Spaceport (EU)Source: spacelaunchreport.com (update 2015)
+++Reliability ++++ ++
(1)
13
Ariane 5
Vega
Closed market

DRAFT
2017 to 2019
Robust, fully contracted backlog
Backlog for Vega
2015 2016
Backlog for Ariane 5
(1) MPL: Multiple payload
Predictable production revenues for the next three and half years from backlog
MPL(1)
ECASingle
PLGTO
ESGalileoMEO
ECASingle
PL GTO
ECADouble
PLGTO
ESGalileoMEO
2 4
ECADouble PL
GTO
6
Flown Contracted14
2014
ECADouble
PLGTO
5
ECASingle
PL GTO
1
ECADouble
PLGTO
ESGalileoMEO
Total backlog : 9 Launchers
The signature of an additional order of 10 launchers is
expected beginning 2017
The signature of an additional order of 18 launchers is
expected beginning 2017 ECA
DoublePL
GTO
ECADouble
PLGTO
ECADouble
PLGTO
ECADouble
PLGTO
Total backlog :15
…

DRAFT
15
Vega E, to capture the full SSO market in single/double launch, with an increased versatility
Vega C , with its multi-satsdispenser for small satellites, and increased performance to capture radar satellites market segment
Ariane 6, in its two versions, to address all types of missions in MEO and GTO, also filling the gap left by Soyuz, with a competitive price
Future product roadmap and contracted developments

DRAFT
Today Avio has 3 main competency areas
16
Solid propulsion
Materials :Pre-preg and TP rubber
Propellant casting
Liquid propulsion System int. & Launch Ops
Insulated motor Case Mfg
Nozzles
Vulcain Lox TP MIRA TP andFiring Test
TP integration Mission simulation
Vinci Lox TP
Launcher integration
All system testing and verification

DRAFTAvio generates today 257M€ annual revenues for production and development across all product lines
17
€112M
Vega launcherAriane propulsion
Ariane 5 Ariane 6
Vulcain Vinci
Vega Vega C
Production (67%) Development (33%)
Turbopumps
≈48%
≈47%
≈4%
Rev257M€
Boosters
Tactical propulsionAster 30 Camm ER

DRAFT
18
Financials

DRAFT
Consistent financial track record in the last 10 years
Annual flights /production
volume
OrderBacklog
(production+development)
(M€)
Net revenues (M€)
179M€ 489M€329M€ 206M€Contracted developments
Growing flight rates
driving prod.
3.5 years backlog visibility
7% revenue
CAGR in 10 years
Stable funding
for devel.
5 56 6
76
5
7
4
6 6
1 1 1
3
2005 2006 2007 2008 2009 2010 2011 2012 2013 2014 2015
ArianeVega
19
A6 prel. A6/ VcVega Vega

DRAFTHighlights – Key Economics
20
€ - M % on Net Rev
€ - M % on Net Rev
€ - M % on Net Rev
NET REVENUES 232.1 100.0% 224.5 100.0% 257.4 100.0%
ADJUSTED EBITDA (1) 37.9 16.3% 39.4 17.6% 35.5 13.8%
ADJUSTED EBIT (2) 24.7 10.6% 26.3 11.7% 22.2 8.6%
ADJUSTED NET INCOME 27.6 11.9% 26.4 11.8% 17.6 6.8%
(1): Adjustments mainly relate to non recurring expenses and investors fees
(2): In addition to Adjstment to EBITDA include customer relationship assets amortization
Higher 2014 Adjusted EBITDA and EBIT driven by additional margins related to the completion of VEGA accompaniment contract 2011-14.
Higher Adjusted Net Income in 2014 compared to 2015 driven by above additional margins as well as 2015 interest on bank financing.
MAIN FIGURES CONSOLIDATEDFY 2013 ACTUAL FY 2014 ACTUAL FY 2015 ACTUAL

DRAFTHighlights – Net Invested Capital and Sources
21
FY 2013 FY 2014 FY 2015ACTUAL ACTUAL ACTUAL
€ - M € - M € - M
WORKING CAPITAL (1) (12.5) (45.2) (56.0)
DEFERRED TAX ASSETS 42.3 54.2 56.8
PROVISIONS FOR OBLIGATIONS AND RISKS (1) (28.8) (26.3) (25.7)
GOODWILL 221.0 221.0 221.0
OTHER FIXED ASSETS (2) 154.0 153.5 146.9
EXCEPTIONAL ITEMS (MAINLY TAX) (67.9) (16.9) (6.6)
NET INVESTED CAPITAL 308.1 340.4 336.4
NET FINANCIAL POSITION (3) 1,161.3 185.0 (27.6)
EQUITY (1,469.4) (525.3) (308.8)
TOTAL SOURCES (308.1) (340.4) (336.4)
(1): Excluding exceptional items (mainly tax)
(2): 2014 and 2015 include about €25.0M of other intangibles from PPA
(3): Including financial receivables Vs TC
MAIN FIGURES CONSOLIDATED

DRAFT
Light asset base due to Goodwill resulting to past LBO transaction (c. 65% of Net Invested Capital) and exclusive free use(comodato) of assets, not included in the Net Invested Capital, belonging to European Space Agency
Light asset base
High level of returns on capital employed
Net invested capital and ROCE Adjusted
22
20% 22% 19%ROCE Adj. (%)(1)
(1) Calculated as EBIT Adjusted on relevant net invested capital, i.e. net invested capital excluding € 221m of goodwill related to space business
Currently includes €96m financing at c. 4% annual interest rate connected to
past LBO capital structure
€m
Sources
Net debt c. € 40mEquity c. € 305m
345
124

DRAFTCash Flow and Evolution of Net Financial Position
23
FY 2014 FY 2015ACTUAL ACTUAL
€ - M € - M
NFP BOP 1,161.3 185.0
REPORTED EBITDA 33.0 27.9
CHANGE IN WORKING CAPITAL (1) 32.8 10.8
CAPEX (16.8) (13.6)
CHANGE IN PROVISIONS FOR OBLIGATIONS AND RISKS (1) (2.5) (0.6)
OPERATING CASH FLOW 46.5 24.5
CHANGE IN EXCEPTIONAL ITEMS (MAINLY TAX) (61.1) (10.8)
NET FINANCIAL EXPENSES (10.0) (3.3)
CURRENT INCOME TAXES (1.2) (1.1)
AVIO DIVIDENDS DISTRIBUTION (949.0) (220.0)
OTHER CHANGES IN RETAINED EARNINGS (1.4) (1.9)
NOT OPERATING CASH FLOW (1,022.8) (237.1)
NFP EOP 185.0 (27.6)
(1): Excluding exceptional items (mainly tax)
MAIN FIGURES CONSOLIDATED

DRAFT
24
Appendix

DRAFT
Current shareholding structures
Ordinary Shares: 400,000,000 Cinven: global Private Equity fund Leonardo: industrial minority partner Viasimo: investment vehicle of previous managers
Ordinary Shares: 30,000,000
Special Shares: 800,000
− No entitlement to ordinary dividends, no voting rights
− 4.5-to-1 conversion in ordinary shares at certain triggers
Market Warrants: 15,000,000
− Strike price: € 9.5− 1 warrant every 4 shares delivered to shareholders
at IPO – Currently listed− 1 warrant every 4 shares to be assigned @ BC
Sponsor Warrants: 1,600,000
− Strike price: € 13 – Cash exercise
25
81%14%
5% Cinven
Leonardo
Viasimo
97%3% Market investors
Space Holding

DRAFTImplied metrics of the transaction
Approach: Net Asset Value Approach: DCF and multiples
Reference valuation date: 1st January 2016 (“Locked Box mechanism”)
(1) Based on net debt as of 31-Dec-15 of € 34.0m, book value of financial receivables vs Termica Colleferro of € 6.4m, book value of minority interests of € 8.2m, book value of associates of € 5.2m, book value of provisions for risks and employee benefits € 38.3m, 50% of the book value of deferred tax
assets of € 28.4m, contractual leakages of € 7.3m26
Space2 NAV per share of € 10 per share at Business Combination
Valuation approach Valuation approach
Purchase Price: € 159.7m
Reference bridge to Enterprise Value(1): € 47.8m
Implied Enterprise Value: € 207.5m
Implied multiples on 2015 financials: 2015 adjusted EBITDA multiple: 5.8x 2015 adjusted EBIT multiple: 9.3x 2015 adjusted P/E multiple: 9.1x
Transaction data Transaction data

DRAFTKey transaction elements(1)
Total net cash contribution into Avio of c. € 66m
3 subsequent steps, all occurring by merger completion
Demerger
A
Acquisition
B
Merger
C
Partial demerger of cash not utilized for the acquisition into Space3, net of cash utilized for withdrawals
Space2, Leonardo and Management acquire respectively a 53%, 27% and 6% interest in Avio from financial investors (Cinven and Viasimo)
Merger by incorporation of Avio into Space2
Avio shareholders(2)
receive new Space2 shares in exchange for Avio shares
(1) Base Case(2) Excluding Space2 for its interest in Avio acquired under B
27

DRAFT6 Demerger(1)A
Space2 is equally split through a proportional demerger
Ordinary shares, special shares and market warrants will be split proportionally(3)
28
DEMERGER
(1) Base Case(2) Not including IPO costs and expenses incurred in up to Business Combination
(3) In case of withdrawal, ordinary shares and special shares will be split proportionally whereas market warrants will be split 1:1 (i.e. 50% / 50%)
Cash: € 308m(2)
NAV: € 10 p.s.
Cash: € 154m(2)
NAV: € 10 p.s.
3
Cash: € 154m(2)
NAV: € 10 p.s.

DRAFT6 Acquisition(1)
Purchase Price for 85.68% stake of Avio equal to c. € 136.8m (100% Purchase Price to c. € 159.7m)
Space2 acquires a 53% interest in Avio for a total acquisition cost of c. € 84.9m
Leonardo acquires a 27% interest in Avio for a total acquisition cost of c. € 42.9m
The Management acquires a 6% interest in Avio for a total acquisition cost of c. € 9.0m
Transfer of shares completed simultaneously with the execution of the Deed of Merger
(1) Base Case
29
B

DRAFT6 Merger(1)C
Merger by incorporation of Avio into Space2
The resulting company assumes the name of Avio
Tender offer threshold set at 25%
Avio price per share equal to € 0.3992, corresponding to a Purchase Price for 100% of € 159.7m
Space2 price per share equal to € 10.0
The exchange ratio of newly issued Space2 ordinary shares for Avio ordinary shares, is set as follows:
€ 0.3992 / € 10.0 equal to an exchange ratio of 0.0399x
30
(1) Base Case
€ 66m(1) additional cash for BP growth acceleration
68% 4%
28%
Resulting shareholders at Business Combination
Free float

DRAFT
Implied equity value ~ € 235m(1)
NAV ~ € 54m(2)
Alternative scenarios at business combination
Implied equity value ~ € 233m(1)
NAV ~ € 154m(2)
Scenario 1:No withdrawal
Scenario 2:Maximum withdrawal
(1) Estimated multiplying € 10 p.s. to the number of outstanding shares at Business Combination (including conversion of the first tranche of special shares)(2) Not including IPO costs and expenses incurred in up to Business Combination
31
3 3
Withdrawal price set equal to € 9.85 per share

DRAFTTransaction timeline
32
1st December
Within the end of February
Space2’s Shareholders Meeting to approve the Demerger, the Acquisition and the Merger
Fulfillment of all conditions precedent provided under SPA, including the authorization of the French Government
Upon listing of Space3 on the MIV, effectiveness of the Demerger After 5 days from the effective date of the Demerger and in any event
by February 28, 2017: closing date and execution of the deed of Merger
Upon obtainment of Consob’s nulla-osta, listing of Avio’s shares on the regulated market, possibly STAR segment
5th December –19th December Period for the exercise of the Withdrawal right by Space2 shareholders
Signing of the SPA and ancillary documents, calling of the general meeting of Space2
19th October
Oct
ober
Dece
mbe
rFe
brua
ry
2016
2017

DRAFTAvio's governance upon listing
• Governance continuity, independence and full transparency to benefit allstakeholders; simple majority to make all decisions
• Board of Directors to be made of 9 members, who will be in charge for 3years since listing
• 4 out 7 current board members will stay on and be joined by 1 furthermanagement representative; 4 additional independent directors
• Board members:• Giulio Ranzo (CEO)• Roberto Italia (Chairman)• Vittorio Rabajoli (InOrbit)• Stefano Ratti (Leonardo Finmeccanica)• Luigi Pasquali (Leonardo Finmeccanica)• Monica Auteri (Independent)• Giovanni Gorno Tempini (Independent)• Donatella Sciuto (Independent)• Maria Rosaria Bonifacio (Independent)
3

DRAFTAvio plays a pivotal role between market demand and product development
• Technology/productdevelopment
• Manufacturing
• Testing
• Procurement
• Systemintegration
• Testing,verification
• Commercialization
• Launch operations
Productdevelopment
and production
Commercialexploitation
Satellite services
Funding &product policy
• Satellite operations
Vega
Ariane
Avio at the heart of the EU launcher industry
Supplier Integrator
34
…OTHERS
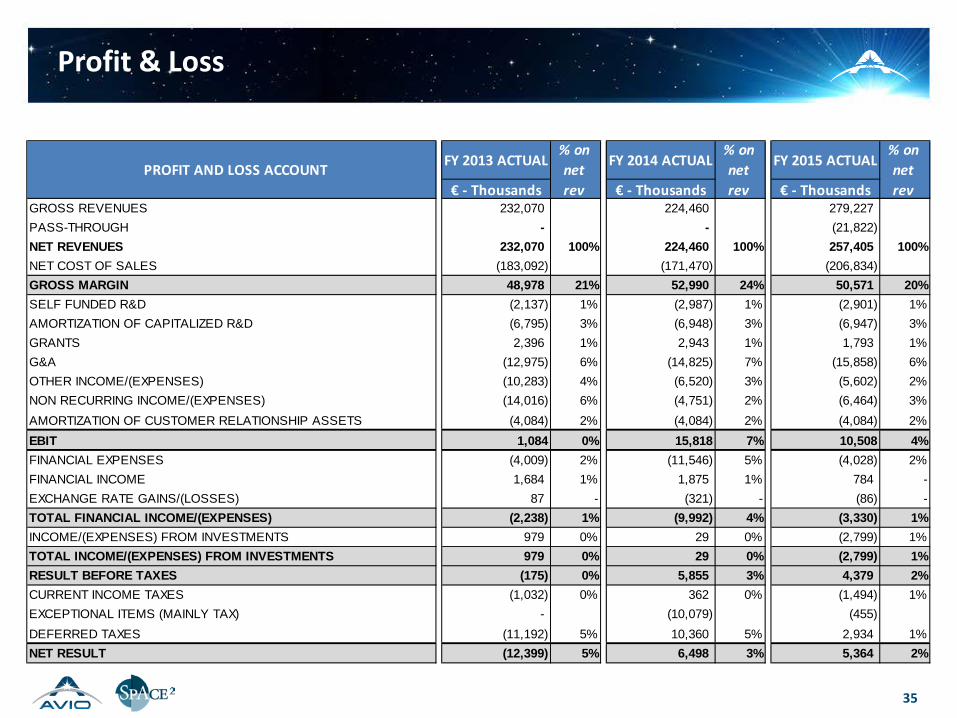
DRAFTProfit & Loss
35
FY 2013 ACTUAL FY 2014 ACTUAL FY 2015 ACTUAL
€ - Thousands € - Thousands € - ThousandsGROSS REVENUES 232,070 224,460 279,227 PASS-THROUGH - - (21,822)NET REVENUES 232,070 100% 224,460 100% 257,405 100%NET COST OF SALES (183,092) (171,470) (206,834)GROSS MARGIN 48,978 21% 52,990 24% 50,571 20%SELF FUNDED R&D (2,137) 1% (2,987) 1% (2,901) 1%AMORTIZATION OF CAPITALIZED R&D (6,795) 3% (6,948) 3% (6,947) 3%GRANTS 2,396 1% 2,943 1% 1,793 1%G&A (12,975) 6% (14,825) 7% (15,858) 6%OTHER INCOME/(EXPENSES) (10,283) 4% (6,520) 3% (5,602) 2%NON RECURRING INCOME/(EXPENSES) (14,016) 6% (4,751) 2% (6,464) 3%AMORTIZATION OF CUSTOMER RELATIONSHIP ASSETS (4,084) 2% (4,084) 2% (4,084) 2%EBIT 1,084 0% 15,818 7% 10,508 4%FINANCIAL EXPENSES (4,009) 2% (11,546) 5% (4,028) 2%FINANCIAL INCOME 1,684 1% 1,875 1% 784 -EXCHANGE RATE GAINS/(LOSSES) 87 - (321) - (86) -TOTAL FINANCIAL INCOME/(EXPENSES) (2,238) 1% (9,992) 4% (3,330) 1%INCOME/(EXPENSES) FROM INVESTMENTS 979 0% 29 0% (2,799) 1%TOTAL INCOME/(EXPENSES) FROM INVESTMENTS 979 0% 29 0% (2,799) 1%RESULT BEFORE TAXES (175) 0% 5,855 3% 4,379 2%CURRENT INCOME TAXES (1,032) 0% 362 0% (1,494) 1%EXCEPTIONAL ITEMS (MAINLY TAX) - (10,079) (455)DEFERRED TAXES (11,192) 5% 10,360 5% 2,934 1%NET RESULT (12,399) 5% 6,498 3% 5,364 2%
PROFIT AND LOSS ACCOUNT% on net rev
% on net rev
% on net rev

DRAFTAdj.EBITDA and Adj.EBIT
36
FY 2013 ACTUAL
FY 2014 ACTUAL
FY 2015 ACTUAL
€ - M € - M € - MEBIT 1.1 0% 15.8 7% 10.5 4%
AMORTIZATION OF CUSTOMER RELATIONSHIP ASSETS 4.1 2% 4.1 2% 4.1 2%
INVESTORS FEES 1.2 1% 1.2 1% 1.2 0%
NON RECURRING (INCOME)/EXPENSES 14.0 6% 4.8 2% 6.5 3%
OTHER MANAGEMENT ADJUSTMENTS 4.3 2% 0.5 0% - 0%
ADJUSTED EBIT 24.7 11% 26.3 12% 22.2 9%
ADJU
STEM
ENTS
ADJUSTED EBIT% on net rev
% on net rev
% on net rev
FY 2013 ACTUAL
FY 2014 ACTUAL
FY 2015 ACTUAL
€ - M € - M € - MEBIT 1.1 0% 15.8 7% 10.5 4%DEPRECIATION OF TANGIBLE ASSETS 5.6 2% 5.4 2% 5.6 2%AMORTIZATION OF CUSTOMER RELATIONSHIP ASSETS 4.1 2% 4.1 2% 4.1 2%AMORTIZATION OF CAPITALIZED R&D 6.8 3% 6.9 3% 6.9 3%AMORTIZATION OTHER INTANGIBLE ASSETS 0.8 0% 0.7 0% 0.8 0%
EBITDA 18.4 8% 33.0 15% 27.9 11%
INVESTORS FEES 1.2 1% 1.2 1% 1.2 0%
NON RECURRING (INCOME)/EXPENSES 14.0 6% 4.8 2% 6.5 3%
OTHER MANAGEMENT ADJUSTMENTS 4.3 2% 0.5 0% - 0%
ADJUSTED EBITDA 37.9 16% 39.4 18% 35.5 14%
ADJU
STEM
ENTS
ADJUSTED EBITDA% on net rev
% on net rev
% on net rev

DRAFTAdj.Net Income
37
FY 2013 ACTUAL
FY 2014 ACTUAL
FY 2015 ACTUAL
€ - M € - M € - MNET RESULT FROM CONTINUING OPERATIONS (12.4) 5% 7.8 3% 5.4 2%
AMORTIZATION OF CUSTOMER RELATIONSHIP ASSETS 4.1 2% 4.1 2% 4.1 2%INVESTORS FEES 1.2 1% 1.2 1% 1.2 0%NON RECURRING (INCOME)/EXPENSES 14.0 6% 4.8 2% 6.5 3%OTHER MANAGEMENT ADJUSTMENTS 4.3 2% 0.5 0% - 0%WRITE DOWN OF NON CONSOLIDATED INVESTMENTS - 0% - 0% 2.8 1%NON-RECURRING ACCRUALS FOR TAX RISKS 0.5 0% 8.7 4% 0.5 0%DEFERRED TAX ASSETS 12.3 5% (11.8) 5% (2.9) 1%INTERSTS EXPENSES ON SHAREHOLDERS LOAN 3.6 2% 11.1 5% - 0%TOAL ADJUSTING ITEMS 40.0 17% 18.5 8% 12.1 5%
ADJUSTED NET INCOME 27.6 12% 26.4 12% 17.5 7%
ADJUSTED NET INCOME% on net rev
% on net rev
% on net rev

DRAFT
31 DEC 2013 ACTUAL
31 DEC 2014 ACTUAL
31 DEC 2015ACTUAL
€'000 €'000 €'000WORK IN PROGRESS (1) 65,103 19,618 (12,292)TRADE PAYABLES (52,757) (51,641) (46,872)TRADE RECEIVABLES 10,792 6,927 8,344OTHER ASSETS 49,534 48,877 63,843OTHER LIABILITIES (85,036) (68,968) (69,034)WORKING CAPITAL (12,364) (45,186) (56,011)DEFERRED TAX ASSETS AND LIABILITIES 42,268 54,238 56,793EMPLOYEE LEAVING ENTITLEMENTS (TFR) (7,259) (6,671) (5,965)OTHER DEFINED BENEFIT PLANS (1,892) (2,152) (2,352)OTHER LONG TERM BENEFITS (2,181) (2,497) (2,485)TOTAL PROVISIONS FOR EMPLOYEE BENEFITS (11,332) (11,320) (10,802)RESERVE FOR COSTS OF VARIABLE SALARIES AND WAGES (1,986) (2,879) (2,992)RESERVE FOR PERSONNEL ESPENSES AND RESTRUCTURING (1,894) (574) (804)RESERVE FOR LEGAL AND ENVIROMENTAL RISKS (9,617) (9,136) (8,005)RESERVE FOR COMMERCIAL AND CONTRACTUAL RISKS (3,948) (2,355) (3,070)TOTAL PROVISIONS FOR RISKS (17,444) (14,944) (14,870)TOTAL PROVISIONS FOR OBLIGATIONS AND RISKS (28,776) (26,264) (25,672)OTHER ASSETS (EXCEPTIONAL TAX ITEMS) 878 12,888 6,000OTHER LIABILITIES (EXCEPTIONAL TAX ITEMS) (46,057) (4,459) 0TAX PROVISIONS (EXCEPTIONAL TAX ITEMS) (14,916) (19,216) (7,399)PROVISION FOR CASH SETTLED SHARE BASED PAYMENTS (7,881) (5,140) (5,178)GE CLAIM (1,000) 0EXCEPTIONAL ITEMS (67,976) (16,927) (6,577)TANGIBLE ASSETS 48,667 50,229 52,917GOODWILL 221,000 221,000 221,000CUSTOMER RELATIONSHIP ASSETS 32,670 28,587 24,503DEVELOPMENT INTANGIBLE ASSETS 63,399 65,266 62,853OTHER INTANGIBLE ASSETS 1,094 1,382 1,431INVESTMENTS 8,160 8,032 5,161FIXED ASSETS 374,990 374,496 367,865NET INVESTED CAPITAL 308,142 340,356 336,398
BALANCE SHEET
(1) WIP are composed of Inventories, Long-term contract WIP, Advance Payments from Customers and Advance Payments to Suppliers.
Balance Sheet 1/2
38

DRAFTBalance Sheet 2/2
39
31 DEC 2013 ACTUAL
31 DEC 2014 ACTUAL
31 DEC 2015ACTUAL
€'000 €'000 €'000CASH & CASH EQUIVALENTS 57,399 165,232 70,378FINANCIAL RECEIVABLES AND CURRENT FINANCIAL ASSETS 1,271,040 27,655 6,530FINANCIAL LOANS AND ACCRUED INTERESTS (167,613) (7,920) (104,478)ACCRUED INTEREST INCOME 452 0 0NET FINANCIAL POSITION 1,161,278 184,967 (27,570)SHARE CAPITAL (39,400) (40,000) (40,000)RETAINED EARNINGS (144,663) (471,243) (256,016)NET RESULT (1,276,669) (5,554) (4,589)EQUITY OF THE GROUP (1,460,732) (516,797) (300,605)MINORITY RETAINED EARNINGS (7,694) (7,582) (7,448)MINORITY NET RESULT (994) (944) (775)EQUITY OF MINORITY (8,688) (8,526) (8,223)TOTAL EQUITY (1,469,420) (525,323) (308,828)
TOTAL SOURCES (308,142) (340,356) (336,398)
BALANCE SHEET

DRAFTWorking Capital
40
31 DEC 2013 ACTUAL
31 DEC 2014 ACTUAL
31 DEC 2015 ACTUAL
€ - M € - M € - MINVENTORIES 27.0 26.1 42.5ADVANCES TO SUPPLIERS 37.3 42.4 58.4NET WORK IN PROGRESS (NET WIP) (0.6) (45.0) (108.3)OTHER ADVANCES FROM CUSTOMERS 1.4 (3.8) (4.9)
WORK IN PROGRESS 65.1 19.6 (12.3)
TRADE PAYABLES (52.8) (51.6) (46.9)TRADE RECEIVABLES 10.8 6.9 8.3OTHER ASSETS 49.5 48.9 63.8OTHER LIABILITIES (85.0) (69.0) (69.0)
OTHER WORKING CAPITAL ITEMS (77.5) (64.8) (43.7)
TOTAL WORKING CAPITAL (12.4) (45.2) (56.0)
MAIN FIGURES CONSOLIDATED

DRAFTCash Flow 1/2
41
CASH FLOW STATEMENTFY 2014 ACTUAL
FY 2015ACTUAL
€'000 €'000REPORTED EBITDA 32,975 27,907CHANGE IN WORK IN PROGRESS 45,485 31,910CHANGE IN TRADE PAYABLES (1,116) (4,769)CHANGE IN TRADE RECEIVABLES 3,865 (1,417)CHANGE IN OTHER ASSETS 657 (14,966)CHANGE IN OTHER LIABILITIES (16,068) 66CHANGE IN WORKING CAPITAL 32,822 10,825CHANGE IN EMPLOYEE LEAVING ENTITLEMENTS (TFR) (588) (706)CHANGE IN OTHER DEFINED BENEFIT PLANS 260 200CHANGE IN OTHER LONG TERM BENEFITS 316 (12)TOTAL PROVISIONS FOR EMPLOYEE BENEFITS (12) (518)CHANGE IN RESERVE FOR COSTS OF VARIABLE SALARIES AND WAGES 893 112CHANGE IN RESERVE FOR PERSONNEL ESPENSES AND RESTRUCTURING (1,320) 230CHANGE IN RESERVE FOR LEGAL AND ENVIROMENTAL RISKS (480) (1,131)CHANGE IN RESERVE FOR COMMERCIAL AND CONTRACTUAL RISKS (1,593) 715TOTAL PROVISIONS FOR RISKS (2,500) (74)TOTAL PROVISIONS FOR OBLIGATIONS AND RISKS (2,512) (592)OPERATING CASH FLOW BEFORE CAPEX 63,285 38,140CAPITAL EXPENDITURES IN TANGIBLE ASSETS (6,983) (8,272)GOODWILL - -CUSTOMER RELATIONSHIP ASSETS (1) (0)CAPITAL EXPENDITURES IN DEVELOPMENT INTANGIBLE ASSETS (8,815) (4,534)CAPITAL EXPENDITURES IN OTHER INTANGIBLE ASSETS (992) (833)DISPOSAL OF FIXED ASSETS - -CAPITAL EXPENDITURES (16,791) (13,639)OPERATING CASH FLOW 46,494 24,501

DRAFTCash Flow 2/2
42
CASH FLOW STATEMENTFY 2014 ACTUAL
FY 2015ACTUAL
€'000 €'000OPERATING CASH FLOW 46,494 24,501CHANGE IN OTHER ASSETS (EXCEPTIONAL TAX ITEMS) (12,010) 6,888CHANGE IN OTHER LIABILITIES (EXCEPTIONAL TAX ITEMS) (41,598) (4,459)CHANGE IN TAX PROVISIONS (EXCEPTIONAL TAX ITEMS) 4,300 (11,817)CHANGE IN PROVISION FOR CASH SETTLED SHARE BASED PAYMENTS (2,741) 38CHANGE IN LIABILITIES FOR GE CLAIM 1,000 (1,000)CHANGE IN EXCEPTIONAL ITEMS (MAINLY TAX) (10,079) (455)CHANGE IN EXCEPTIONAL ITEMS (61,128) (10,805)CHANGE IN PARTICIPATIONS 157 2,871FINANCIAL INCOME/(EXPENSES) (9,992) (3,330)CURRENT INCOME TAXES (1,248) (1,115)CHANGE IN RETAINED EARNINGS (950,594) (224,658)NOT OPERATING CASH FLOW (1,022,805) (237,038)
CHANGE IN NET FINANCIAL POSITION (976,311) (212,537)