Embed Size (px)
Citation preview

Case Studies
WIRC28th May 2016Pinkesh Billimoria

PremiseAsset
MethodEarningMethod
Market Method
Extent of control
Timing Basis
Context
Forward looking &Cash flows key
What is being valuedWhy it is being valuedSecure definition of “value”
Valuation is relative to aspecific point in time
Going concern vis-à-visliquidationPremium for control,efficiency and synergy
Valuation – A Perspective
2

Valuation in Real life
Time
Rev
enu
es /
Ear
nin
gs
Start-up or Idea
Companies
Rapid Expansion
High Growth Mature Growth Decline
Revenue/Current Operations
Operating History
Comparable Firms
Source of Value
Non-existent or low revenue/negative operating income
Revenue increasing/Income still low or negative
Revenue in high growth/Operating income also growing
Revenue growth slows/Operating income still growing
Revenue and operating income growth drop
None Very limited Some operating history
Operating history can be used in valuation
Substantial operating history
NoneSome, but in same stage of growth
More comparables, at different stages
Large number of comparables, at different stages
Declining number of comparables, mostly mature
Entirely future growth
Mostly future growth
Portion from existing assets/Growth still dominates
More from existing assets than growth
Entirely from existing assets
Earnings
Revenues
3

4
Valuation Methodologies
Asset basedAsset based Earnings basedEarnings based
Market basedMarket based
Value of Business /
Equity
Net Asset Value
• Market Price
• Comparable Companies Multiples
• Comparable Transaction Multiples
� More than one right way to value
� Approaches are not exclusive; but complement each other
• Discounted Cash Flow
• Earnings Capitalisation
• Royalty Relief method
• Contribution/ Excess
earnings method
• Incremental Cashflows
method

5
Valuation Conclusion
� Methods throw a range of values
� Consider relevance of each methodology depending upon the purpose &
premise of valuation – decide on primary and corroborative methods
� Selecting the final value / range of values
� Subjective weighting:
� In professional judgement the conclusion is based on experience and
judgment given the quality of information and the approaches applied
� Mathematical weighting
� In mathematical weighting specific weights are assigned to each
approach and the weighted average calculated
� Both methods require subjectivity since the weights selected in mathematical
weighting are subjective - Ultimately subjective judgement of the valuerFinal Recommendation – common sense and reasonableness
Factors affecting Valuation
� Deal Structure - Merger / Demerger / Slump Sale / Intangible
� Funding structure and Forex movements
� Tax and Transfer Pricing – tax breaks, amortisation rules, DTAA etc.
� RBI / FEMA Regulations – Valuation giving minimum / maximumprice.
� SEBI guidelines – Takeover / Preferential pricing, Takeover - Direct /Indirect, Delisting / Open offer / Reverse Book Building
� Synergies
� Premium / Discount
� DD Issues
� Accounting – different GAAPs
� Jurisdiction – different regulations, settlement mechanism
� Background – Company / Promoters / Top Management
6

7
Premiums & Discounts
• Lack of marketability
• Business dynamics
• Small size
• Growth & margin trends
• Holding company discount
• Percentage stake – control, minority
Adjusting the benchmark multiples critical

8
� List of other multiples that could be considered fo r the valuation / cross checks
� EV / Customer multiple – Telecom, Internet
� EV/ Rooms – Hotel
� EV / Subscriber – Television Channels
� Embedded Value / NBAP – Life Insurance
� % of AUM – Mutual Fund
Market Multiples – Generally Used
Industry Multiples

9
Case Study

10
Case Study –
A Valuation Working example

11
Case Study – Information ABC Limited
INR MillionFY 12 FY 13 FY 14 FY 15 FY 16
Extracted Profit and Loss AccountSales Units (Mio units) 37 38 36 33 32 Sales Price (INR per Unit) 72 97 118 121 119 Revenue 2,700 3,700 4,200 4,000 3,800 Adjusted EBIDTA 300 600 1,000 700 400 Reported PAT 100 300 700 300 75
Margins (%)EBIDTA 11.1% 16.2% 23.8% 17.5% 10.5%Reported PAT 3.7% 8.1% 16.7% 7.5% 2.0%
Extracted Balance SheetNet Fixed Assets (Inc CWIP)
200 263 309 345 333
Maintenace Capex 50 50 50 50 50 Expansion Capex 100 100 100 50 50 Total Capex 150 150 150 100 100
Inventory 450 430 550 560 950 Debtors 500 480 600 610 1,000 Creditors (300) (350) (400) (400) (700) Net Working Capital excluding cash 650 560 750 770 1,250 Cash 10 15 20 30 10 Debt 100 200 200 300 350 Net Assets 760 638 879 845 1,243
Number of Equity Shares 10 Million
BSECurrent Price 399 Trading % 15%
VWAP60 Days 280 6 Months 345 12 Months 283
NSE Current Price 400 Trading % 25%
VWAP60 Days 310 6 Months 360 12 Months 254

12
Case Study – Information ABC Limited
INR MillionFY 17 FY 18 FY 19 FY 20 FY 21
Extracted Profit and Loss AccountSales Units (Mio units) 35 39 43 47 52 Sales Price (INR per Unit) 135 129 123 123 129 Revenue 4,750 4,988 5,237 5,761 6,625 Adjusted EBIDTA 499 648 759 922 1,060 Reported PAT 241 342 416 517 614
Margins (%)EBIDTA 10.5% 13.0% 14.5% 16.0% 16.0%Reported PAT 5.1% 6.9% 7.9% 9.0% 9.3%
Depreciation 106 105 104 115 111 Interest 49 55 62 68 72
Extracted Balance SheetNet Fixed Assets (Inc CWIP)
325 319 314 311 345
Maintenace Capex 50 50 50 50 50 Expansion Capex 50 50 50 100 50 Total Capex 100 100 100 150 100
Inventory 950 998 1,047 1,152 1,325 Debtors 1,188 1,247 1,309 1,440 1,656 Creditors (713) (748) (786) (864) (994) Net Working Capital 1,425 1,496 1,571 1,728 1,987
Debt 350 400 450 500 550 Net Assets 1,400 1,415 1,435 1,539 1,783

13
Case Study – Information Industry / Peer Group Aggregate
INR MillionFY 12 FY 13 FY 14 FY 15 FY 16
Profit & Loss AccountsSales Units (Mio units) 430 450 500 550 600 Sales Price (INR per Unit) 70 103 116 132 133 Revenue 30,000 46,500 58,125 72,656 79,922 Adjusted EBIDTA 3,000 8,800 10,500 13,750 15,000 Reported PAT 1,000 4,000 6,000 6,500 7,000
Margins (%)EBIDTA 10.0% 18.9% 18.1% 18.9% 18.8%Reported PAT 3.3% 8.6% 10.3% 8.9% 8.8%
Working CapitalNet Working Capital 4,500 7,000 8,700 11,000 12,000
CapexMaintenace Capex 500 500 500 500 500 Expansion Capex 1,000 2,000 2,500 3,000 3,500 Total Capex 1,500 2,500 3,000 3,500 4,000
MultiplesEV / EBITDA Multiple 16.87 6.59 7.88 7.86 7.16 PE Multiple 48.48 11.29 11.14 11.08 8.87

14
Case Study – Analysis
FY 12 FY 13 FY 14 FY 15 FY 16 Average CAGR FY 17 FY 18 FY 19 FY 20 FY 21 Average CAGRSales Quantity (Mio Unit)Industry 430 450 500 550 600 506 8.7%ABC Ltd 37 38 36 33 32 35 -3.7% 35 39 43 47 52 43 10.0%
Sales Price (INR per Unit)Industry 70 103 116 132 133 111 17.5%ABC Ltd 72 97 118 121 119 105 13.1% 135 129 123 123 129 128 1.6%
Revenue (INR Million)Industry 30,000 46,500 58,125 72,656 79,922 57,441 27.8%ABC Ltd 2,700 3,700 4,200 4,000 3,800 3,680 8.9% 4,750 4,988 5,237 5,761 6,625 5,472 11.8%
EBITDA %Industry 10.0% 18.9% 18.1% 18.9% 18.8% 16.9%ABC Ltd 11.1% 16.2% 23.8% 17.5% 10.5% 15.8% 10.5% 13.0% 14.5% 16.0% 16.0% 14.0%
PAT %Industry 3.3% 8.6% 10.3% 8.9% 8.8% 8.0%ABC Ltd 3.7% 8.1% 16.7% 7.5% 2.0% 7.6% 5.1% 6.9% 7.9% 9.0% 9.3% 7.6%
Net Working Capital %Industry 15.0% 15.1% 15.0% 15.1% 15.0% 15.0%ABC Ltd 24.1% 15.1% 17.9% 19.3% 32.9% 21.8% 30.0% 30.0% 30.0% 30.0% 30.0% 30.0%
Capex %Industry 5.0% 5.4% 5.2% 4.8% 5.0% 5.1%ABC Ltd 5.6% 4.1% 3.6% 2.5% 2.6% 3.7% 2.1% 2.0% 1.9% 2.6% 1.5% 2.0%
15
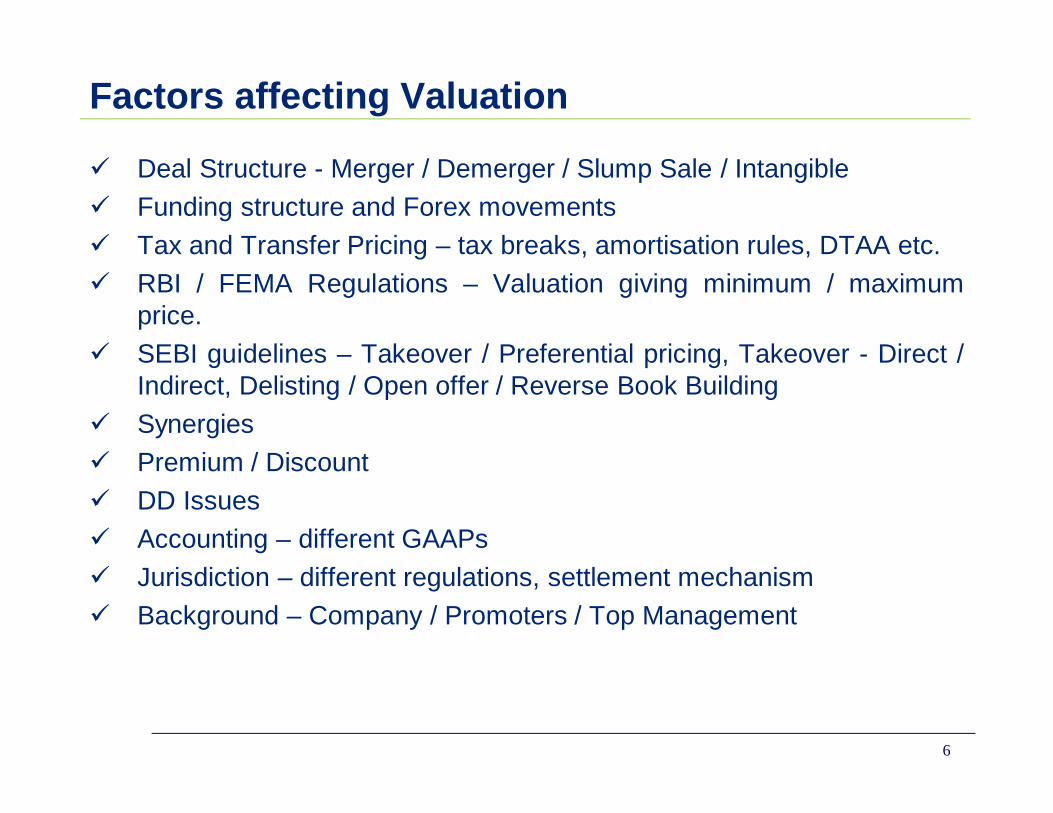
Case Study – NAV INR Million INR Million
ParticularsAssets
Fixed Assets 333 583 Inventory 950 950 Debtors 1,000 1,000 Cash and Bank Balances 10 10 Loans and Advances - 2,293 - 2,543 LiabilitiesLoans 350 350 Deferred Tax Liability (net) - - Current Liabilities 700 700 Provisions - 1,050 - 1,050
Net Assets 1,243 1,493 Adjusted for :
Revaluation Reserve - [..]Contingent Liabilities - [..] - [..]Surplus Asset - Fair Value (Net of Tax) + [..]Surplus Asset - Book Value - [..] + [..]
Adjusted Net Assets 1,243 1,493 Adjusted Value per Share 124 149
Based on the Audited Balance Sheet of ABC Ltd as at 31st March 2016
Replacement Value

16
Case Study – Comparable Companies Method
Relevant Maintainable Earnings INR MillionAdjusted EBIDTA
Reported PAT
Weights
FY 14 1,000 700 1.00 FY 15 700 300 1.00 FY 16 400 75 1.00 Weighted Average 700 358
Appropriate & Reasonable MultipleEBITDA Multiple
PE Multiple
Industry Multiples 7.00 9.00
Adjusted Multiples 5.25 6.75

17
Case Study – Comparable Companies Method
INR MillionEV / EBIDTA MultipleEBIDTA 700 EV / EBIDTA Multiple 5.25Enterprise Value 3,675 Debt (350) Cash 10 Surplus Assets - Contingent Liabilities - Other Adjustment - Equity Value 3,335 Value per Share 334
INR MillionPE MultiplePAT 358 PE Multiple 6.75Operating Enterprise Value 2,419Debt -Cash - Surplus Assets - Contingent Liabilities - Other Adjustment - Equity Value 2,419 Value per Share 242

18
Case Study – Comparable Transaction Multiple
Appropriate & Reasonable MultipleEBITDA Multiple
PE Multiple
Transaction Multiples 8.40 NA
Adjusted Multiples 6.30 NA
There were two transactions in the industry, the details of which are as follows:
Revenue(INR Million)
EBITDA %
PAT % EBITDA Multiple
PE Multiple
Jan 2014 12,500 18% 12% 7.20 NA
Nov 2015 14,000 22% 9% 8.40 NA

19
Case Study– Comparable Transaction Multiple
INR MillionEV / EBIDTA MultipleEBIDTA 700 EV / EBIDTA Multiple 6.30 Enterprise Value 4,410 Debt (350) Cash 10 Surplus Assets - Contingent Liabilities - Other Adjustment - Equity Value 4,070 Value per Share 407

INR MillionFY 17 FY 18 FY 19 FY 20 FY 21 Pepetuity
DCFProfit After Tax 241 342 416 517 614 Depreciation 106 105 104 115 111 Interest (Net of Tax ) 32 36 41 45 47 Inflows 379 483 560 677 773 Incremental Working Capital (175) (71) (75) (157) (259) Incremental Capital Expenditure (100) (100) (100) (150) (100) Free Cash Flows 104 312 385 370 413 413 Perpetuity Value 6,199 Terminal Growth Rate 5.0%Discount Rate 12.0% 0.89 0.80 0.71 0.64 0.57 0.57 Present Value of Free Cash Flows 93 249 274 235 235 3,518 Enterprise Value 4,603 Debt (350) Cash 10
Equity Value 4,263 Value per Share 426
20
Case Study– DCF
Sensitivity Analysis - Value per Share426 11.5% 12.0% 12.5%
4.0% 409 379 354 5.0% 464 426 394 6.0% 538 489 447
21
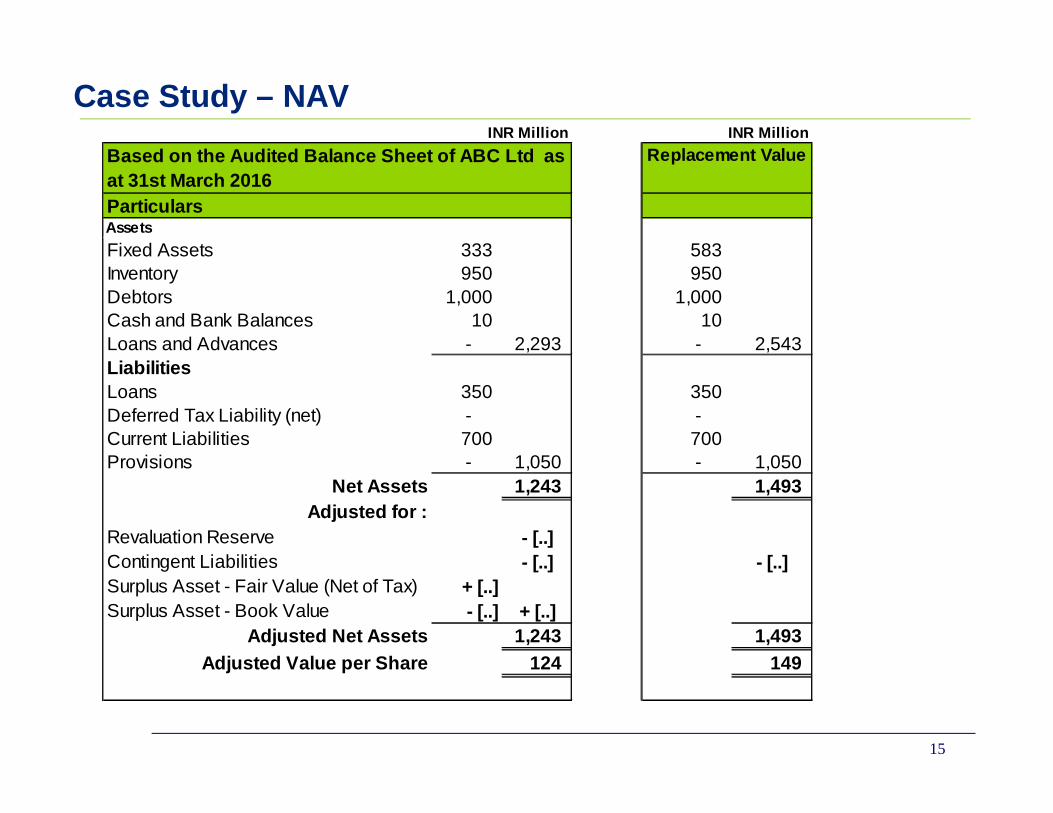
Case Study– Summary
Final Recommendation – common sense and reasonableness
Methodology Value Per Share (INR)
Weights
Net Asset Value 124 ?
Replacement Value 149 ?
Market Price 310 ?
Comparable Companies MultiplesEV / EBITDA Multiple 334 ?PE Multiple 242 ?
Comparable Transaction MultiplesEV / EBITDA Multiple 407 ?
Discounted Cash Flow Method 426 ?
FINAL

22
Practical Example


What could have possibly affected the valuation?
24
Variable Cost
Structure
Buyers Cost Structure
Proforma P&L
Management Remuneration
Product Positioning
Ayurvedic Medicine
v/s Hair Oil
Buy Sidev/s
Sell Side
Sustainable Margins
Cost of professional run business
Buyers characteristics
FMCG, Distribution channels, Lab Testing,
R&D, Marketing
Lean Model
Continuing Tax benefits

Some Pointers
25

26
Case Study -
Transaction

Proposal
27
A Ltd. B Ltd.
B Division
1. Demerger
C Ltd.
2. Merger
Subsidiary
Company Ownership Business
A Ltd. Listed • Large Conglomerate• Presence in several businesses• Trading, Manufacturing and Marketing
B Ltd. Listed • Large Conglomerate• Manufacturing, Retailing
B Division Segment • Manufacturing
C Ltd. 100% subsidiary of B Ltd.
• Marketing and Distribution of the products of B Division

Valuation Approach
28
Valuation Methodologies
A Ltd. B Division C Ltd.
Market Price Method
• Market price reflects revenues and profitability of several businesses
• Cannot split market capitalisation to reflect the value of the segment.
• If significant segment, one may derive from value of company / multiples.
Not applicable
Comparable Transaction Method
• Not much information available in public domain.• Transactions - non-control stake, strategic / financial investments,
synergies may not reflect in the price paid for the transaction.
Comparable Companies Multiples Method
• Multiples of companies comparable to each business
• Multiples of manufacturing companies applied to the division results
• Multiples adjusted to reflect growth, capacity expansion in recent past, newly product launches etc.
• Multiples of marketing and distributioncompanies
• Relative valuation difficult as each company / division in differentsegment, different risk reward profiles, governed by different laws
Valuation Approach
29
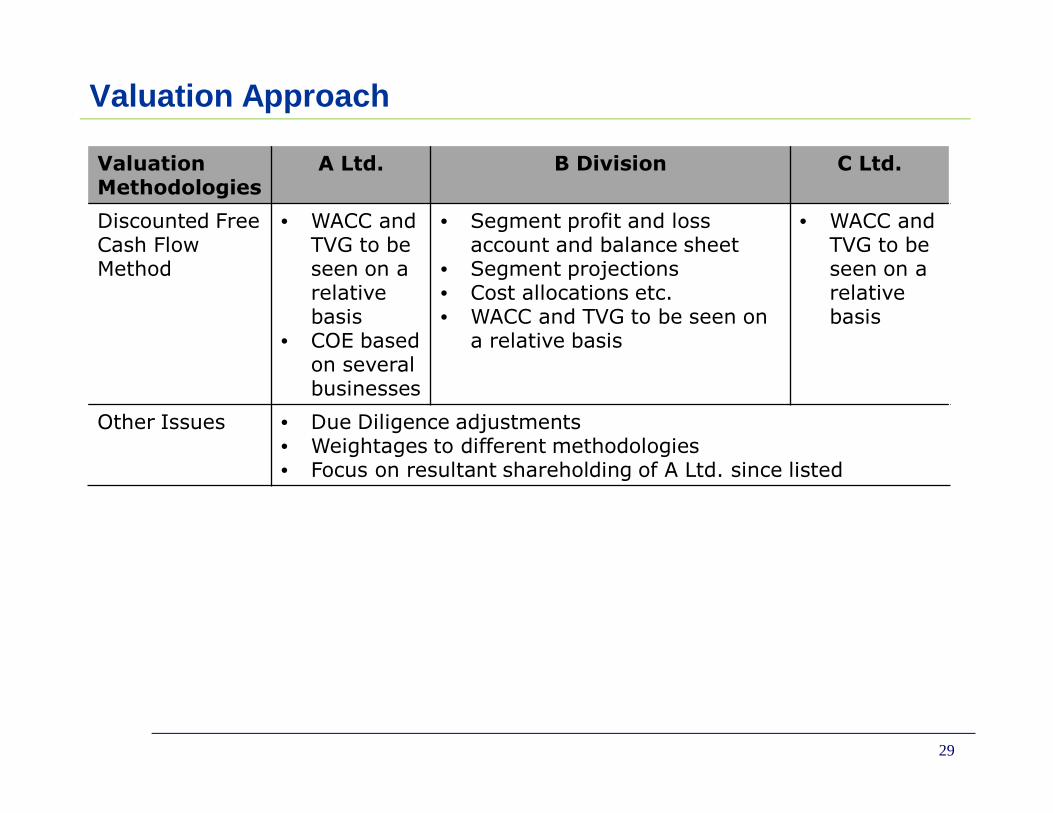
Valuation Methodologies
A Ltd. B Division C Ltd.
Discounted Free Cash Flow Method
• WACC and TVG to be seen on a relative basis
• COE based on several businesses
• Segment profit and loss account and balance sheet
• Segment projections• Cost allocations etc.• WACC and TVG to be seen on
a relative basis
• WACC and TVG to be seen on a relative basis
Other Issues • Due Diligence adjustments• Weightages to different methodologies• Focus on resultant shareholding of A Ltd. since listed

---------------------
THANK YOU
This document discusses various methods and process of valuation. The style contained herein is intended to make aware the valuationprocess in relation to general issues and concerns. The approach might be different in light of specific issues that are in nature different incontext and character.
Further, the information contained in this document is intended only to provide a perspective on valuation methods and the process followedin relation to such and related engagements. It should be in no way construed to be an opinion or advise of any character and is in no wayrepresented as such. The information provided herein should not be used and reproduced and should be considered privileged and only forthe intended recipients.