Embed Size (px)
Citation preview
Presentation to the
Oslo City Working Group Meeting Session 5: Canada’s Energy Statistics
John Appleby, Natural Resources Canada,
Ottawa, Canada
February 2, 2009

2
Outline
• Background/Context
• RESD and the Sector Models– Transportation– Residential– Commercial Institutional– Industrial
• Data/Products
3
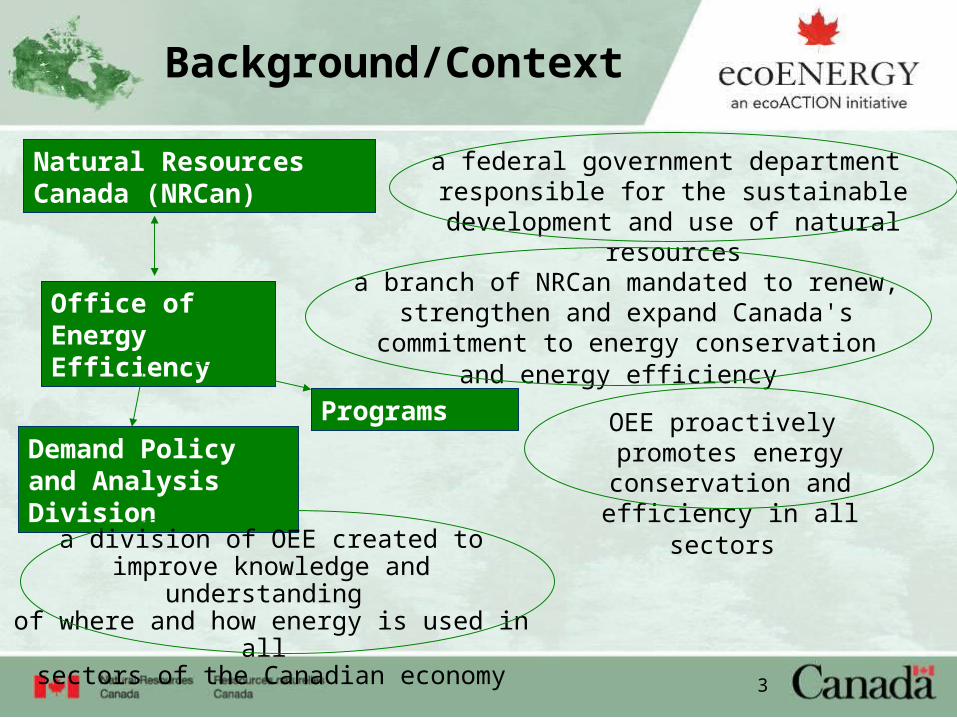
Background/Context
Natural Resources Canada (NRCan)
Office of Energy Efficiency
Demand Policy and Analysis Division
Programs
a federal government department responsible for the sustainable development
and use of natural resources
a branch of NRCan mandated to renew, strengthen and expand Canada's commitment to
energy conservation and energy efficiency
OEE proactively promotes energy conservation and efficiency in all sectors
a division of OEE created toimprove knowledge and understanding of where and how energy is used in all
sectors of the Canadian economy

4
Energy End-Use Models (OEE)
• Each model has the same general methodology• Utilize a variety of data sources and assumptions to provide a
detailed look of their respective sector. • These detailed data sources provide the breakdown of the
sector not provided by the RESD. • Since the RESD is the official energy balance of Canada, the
estimated detailed energy use across sectors are then calibrated to the Report on Energy Supply and Demand.
Five End-Use Models:– Transportation– Industrial– Residential– Commercial– Agriculture (No Break-down)
• Products – Energy Use Data Handbook– Energy Efficiency Trends in Canada
5
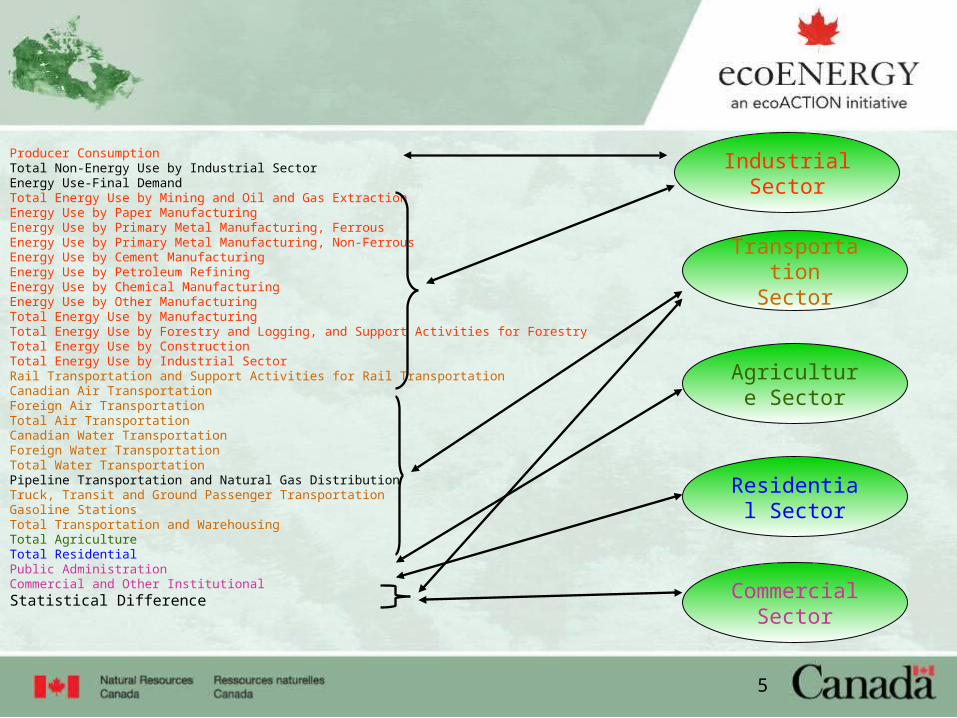
Producer ConsumptionTotal Non-Energy Use by Industrial SectorEnergy Use-Final DemandTotal Energy Use by Mining and Oil and Gas ExtractionEnergy Use by Paper ManufacturingEnergy Use by Primary Metal Manufacturing, FerrousEnergy Use by Primary Metal Manufacturing, Non-FerrousEnergy Use by Cement ManufacturingEnergy Use by Petroleum RefiningEnergy Use by Chemical ManufacturingEnergy Use by Other ManufacturingTotal Energy Use by ManufacturingTotal Energy Use by Forestry and Logging, and Support Activities for ForestryTotal Energy Use by ConstructionTotal Energy Use by Industrial SectorRail Transportation and Support Activities for Rail TransportationCanadian Air TransportationForeign Air TransportationTotal Air TransportationCanadian Water TransportationForeign Water TransportationTotal Water TransportationPipeline Transportation and Natural Gas DistributionTruck, Transit and Ground Passenger TransportationGasoline StationsTotal Transportation and WarehousingTotal AgricultureTotal ResidentialPublic AdministrationCommercial and Other Institutional
Statistical Difference
Industrial Sector
Transportation Sector
Agriculture Sector
Residential Sector
Commercial Sector

6
Transportation Sector Overview
Distance StockFuel
Consumption
Estimated Road Energy
Demand
GHG Emissions
STC Road Energy
Demand
STC Non- Road Energy
Demand
Off-Road
GHG Factors
Transportation Energy Demand
7
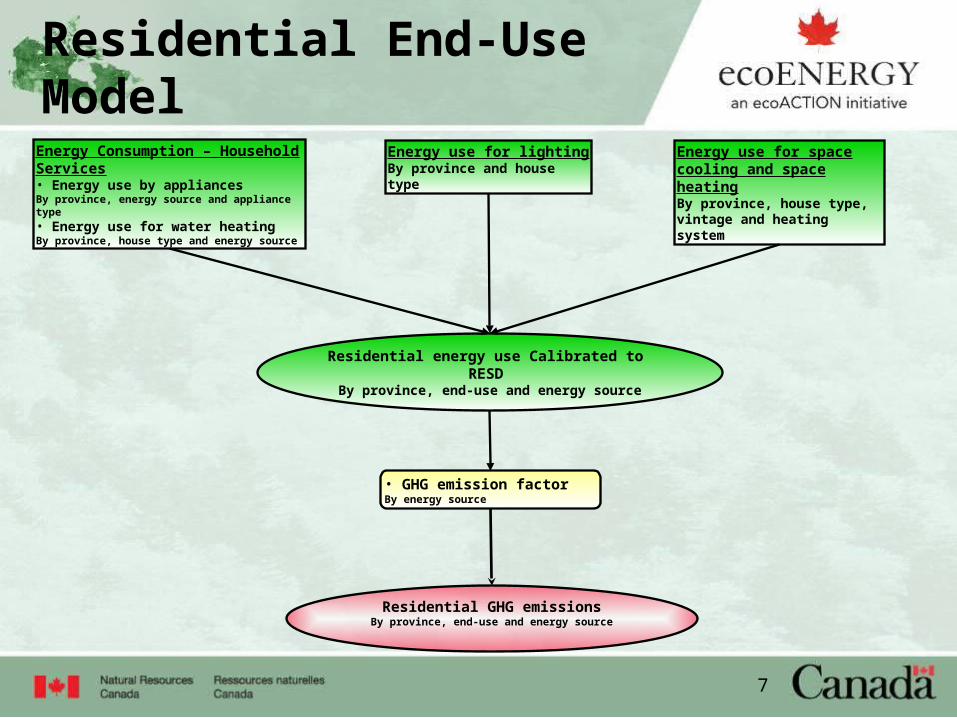
Energy use for space cooling and space heatingBy province, house type, vintage and heating system
Energy Consumption – Household Services• Energy use by appliancesBy province, energy source and appliance type• Energy use for water heatingBy province, house type and energy source
Residential energy use Calibrated to RESD
By province, end-use and energy source
Energy use for lightingBy province and house type
• GHG emission factorBy energy source
Residential GHG emissionsBy province, end-use and energy source
Residential End-Use Model

8
Industrial Sector Overview
CIEEDAC
RESD
Detailed Industries Energy Use
Aggregate Industries Energy
Use
Energy Use
Scaling and confidentiality
estimations

9
COMMERCIAL/INSTITUTIONAL END-USE DATABASE FLOWCHART
•FLOOR SPACE
•AVERAGE INTENSITY
•FUEL SHARES
•FUEL EFFICIENCY
Non Space conditioning energy use
•WATER HEATING•AUXILIARY EQUIPMENT
•AUXILIARY MOTORS•LIGHTING
•HEATING DEGREE DAY•COOLING DEGREE DAY
Space Conditioning energy use•SPACE COOLING•SPACE HEATING
TOTAL COMMERCIAL/INSTITUTIONAL ESTIMATED ENERGYENERGY DEMAND
EMISSION FACTORS EC
TOTAL COMMERCIAL/INSTITUTIONAL GHG EMISSIONS
TOTAL COMMERCIAL/INSTITUTIONAL ENERGY DEMAND
Calibration TO RESD
Heat Gains•HEATING HEAT GAIN INTENSITY•COOLING HEAT GAIN INTENSITY

10
• By region (7):– 1) Atlantic– 2) Quebec– 3) Ontario– 4) Manitoba– 5) Saskatchewan– 6) Alberta– 7) British Columbia &
Territories
• By end-use (6):– 1) Space heating – 2) Water heating– 3) Auxiliary equipment– 4) Auxiliary motors– 5) Lighting– 6) Space cooling
• By activity types (10):– 1) Wholesale Trade – 2) Retail Trade– 3) Transportation and
Warehousing– 4) Information and Cultural
Industries– 5) Offices– 6) Educational Services– 7) Health Care and Social
Assistance – 8) Arts, Entertainment and
Recreation– 9) Accommodation and Food
Services– 10) Other Services
• By fuel types (5):– 1) Electricity– 2) Natural gas– 3) Light fuel oil & Kerosene– 4) Heavy Fuel Oil– 5) Steam– 6) Other (Steam & Coal)
COMMERCIAL/INSTITUTIONAL SECTORBREAKDOWN

11
1990 2000 2001 2002 2003 2004 2005 2006
Total Growth 1990–2006
Total Energy Use (PJ)a 867.0 1,072.8 1,060.9 1,131.5 1,166.5 1,172.7 1,158.9 1,092.6 26.0%Energy Use by Energy Source (PJ) a
Electricity 390.1 453.0 445.2 476.8 474.4 483.4 485.9 475.8 22.0%Natural Gas 387.1 503.2 488.4 517.2 525.1 514.1 504.9 468.5 21.0%Light Fuel Oil and Kerosene 62.0 60.4 63.6 73.9 80.1 91.5 83.3 75.7 22.2%Heavy Fuel Oil 11.4 19.8 26.8 27.4 53.5 48.8 55.6 42.5 274.1%Steam 0.2 0.3 0.3 0.3 0.3 0.4 2.7 2.6 1175.7%Other1 16.3 36.1 36.6 35.9 32.9 34.5 26.5 27.5 69.1%
Energy Use by End-Use (PJ) b
Space Heating 471.1 579.1 549.7 583.7 617.2 618.1 592.5 537.4 14.1%Water Heating 68.2 89.6 92.2 93.4 98.9 103.0 99.4 95.2 39.7%Auxiliary Equipment 82.4 132.9 140.1 144.6 157.5 169.5 172.7 177.4 115.2%Auxiliary Motors 91.2 96.0 94.2 95.4 94.7 95.6 88.2 89.5 -1.9%Lighting 114.5 120.3 118.0 119.6 118.8 119.4 108.0 107.5 -6.2%Space Cooling 30.6 47.2 59.0 87.1 71.6 59.4 89.9 77.1 152.1%Street Lightingf 8.9 7.7 7.7 7.8 7.8 7.8 8.3 8.4 -6.1%
Energy Use by Activity Type 2 (PJ) b
Wholesale Trade 56.3 64.4 63.3 66.3 68.3 68.5 65.8 61.3 9.0%Retail Trade 143.7 174.5 172.6 184.2 190.1 194.4 191.0 179.2 24.8%Transportation and Warehousing 54.3 55.3 52.8 55.2 55.5 54.4 50.8 46.8 -13.7%Information and Cultural Industries 17.9 25.0 24.9 26.8 27.9 27.9 27.1 25.9 44.5%Offices3 273.1 358.7 356.5 381.9 394.9 395.4 402.4 381.2 39.6%Educational Services 119.3 147.5 146.5 156.2 161.9 162.5 159.2 149.9 25.6%Health Care and Social Assistance 84.9 104.1 103.0 110.5 112.7 113.3 110.0 103.2 21.6%Arts, Entertainment and Recreation 23.6 33.4 33.1 34.9 36.1 35.9 34.9 33.0 39.8%Accommodation and Food Services 66.4 80.9 79.7 85.9 88.8 90.3 88.1 83.9 26.3%Other Services 18.7 21.2 20.9 21.9 22.4 22.3 21.4 19.9 6.3%
Commercial/Institutional Secondary Energy Use by Energy Source,
End-Use and Activity Type
12
Products
• In 1991, Natural Resources Canada (NRCan) launched the National Energy Use Database (NEUD) initiative to help the department improve its knowledge of energy consumption and energy efficiency at the end-use level in Canada and to support NRCan's analytical expertise.
• The NEUD plays a number of crucial roles directly related to NRCan's ecoENERGY Efficiency initiatives; however, its most important role is to secure the development of a reliable, Canada-wide information base on energy consumption for all energy-consuming sectors.
• The new 2006 data are now available in our Comprehensive Energy Use Database, Energy Use Data Handbook Tables and Energy Efficiency Trends Analysis Tables.

14
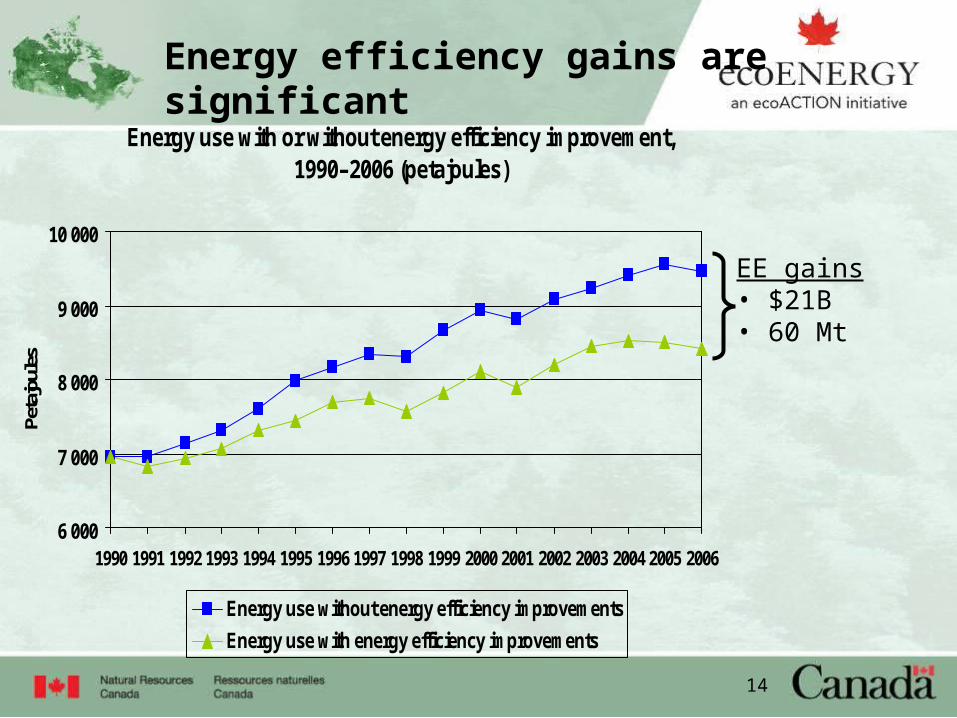
Energy efficiency gains are significant
Energy use with or without energy efficiency improvement, 1990–2006 (petajoules)
6 000
7 000
8 000
9 000
10 000
1990 1991 1992 1993 1994 1995 1996 1997 1998 1999 2000 2001 2002 2003 2004 2005 2006
Peta
joul
es
Energy use without energy efficiency improvements
Energy use with energy efficiency improvements
EE gains• $21B• 60 Mt
15
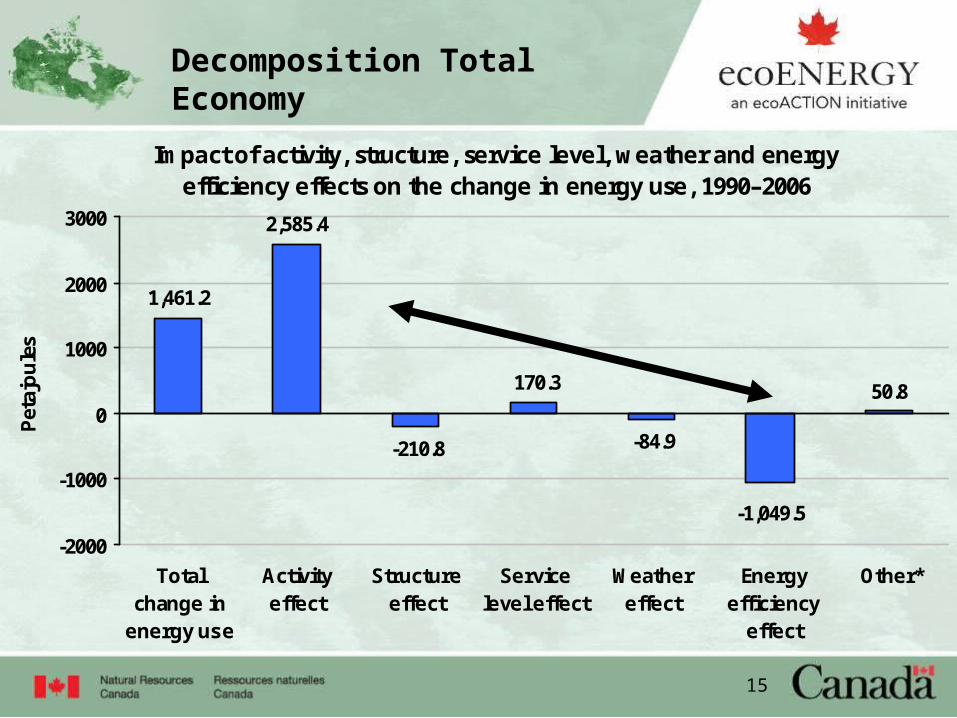
Impact of activity, structure, service level, weather and energy efficiency effects on the change in energy use, 1990–2006
-210.8
2,585.4
1,461.2
-84.9
-1,049.5
170.3 50.8
-2000
-1000
0
1000
2000
3000
Totalchange in
energy use
Activityeffect
Structureeffect
Servicelevel effect
Weathereffect
Energyefficiency
effect
Other*
Pet
ajo
ule
s
Decomposition Total Economy
16
Conclusion
• Links to more information:– Comprehensive Energy Use Database -
http://oee.nrcan.gc.ca/corporate/statistics/neud/dpa/home.cfm