Embed Size (px)
DESCRIPTION
Presentation to the National Health Portfolio Committee. Presented by Dr H N Manzini; HoD – Health & Social Development; 16 th March 2005. Presentation to the Portfolio Committee. Limpopo Department of Health and Social Development. Mandates. - PowerPoint PPT Presentation
Citation preview
1
Presentation to the National Health Portfolio Committee
Presented by Dr H N Manzini;
HoD – Health & Social Development; 16th March 2005

2
Presentation to the Portfolio Committee
Limpopo Department of Health and Social Development

3
Mandates
The Departmental operations are guided by the following Mandates.
- Applicable National & Provincial Legislations
– National Ten Points Plan
– Provincial Strategic Priorities
– Health Core Functions
The Strategic Plan is based on these principles.

4
National Ten Points Plan
1. Improve Governance and management of the NHS2. Promote healthy lifestyles3. Contribute towards human dignity by improving quality of care4. Improve the management of communicable and non-
communicable illnesses5. Strengthen Primary Health care, EMS and Hospital service
delivery systems 6. Strengthen support services7. Human Resource Planning, Development and Management8. Planning, Budgeting and Monitoring and Evaluation9. Prepare and implement legislation10. Strengthen International Relations

5
Provincial Priorities
• TB/STD/HIV/AIDS & other communicable diseases• Maternal, Child, Women, Youth & Adolescence Health• Integrated Poverty Alleviation• Health Promotion • District Health Development & Primary Health Care implementation• Hospital Revitalisation• Health Planning, Logistics & Support Services• Quality of Care• Mental, Chronic, Disabilities & Geriatric Health• Communication, Collaboration & Community
Participation• Development of a Medical School

6
Core Functions • Formulate and implement provincial health policies,
norms, standards and legislation • Provide regional and specialised hospital services as
well as academic Health Services, where relevant.• Render and co-ordinate Medical Emergency Services
(including ambulance service)• Render health services to the detained, arrested,
charged.• Screen applications for licensing and inspection of
private facilities. • Quality control of all health services and facilities.• Inter-provincial and inter sectoral co-ordination and
collaboration.• Co-ordinate the funding and financial management
(budgetary process) of the district health services

7
Core Functions • Provide technical and logistical support to health districts.• Render specific provincial services programmes, e.g. TB
programme.• Provide non-personal health services.• Provide and maintain equipment, vehicles and health care
services.• Effective consultation on health matters at the community
level.• Provide occupational health services.• Research on, and planning, co-ordination, monitoring and
evaluation of health services rendered in the Province.• Ensure that functions delegated by the National level are
carried out.• Render Medico-legal services.

8
Section A
Strategic Priorities and Objectives 2004/05

9
Programme 1: Health Administration
PRIORITIES• Improve governance and the management of the
Provincial Health System (PHS)• Strengthen admin support services• Human resource planning development and
management• Planning, budgeting and monitoring and evaluation • Prepare & implement legislation• Implementation of fraud prevention and risk
management plan;• Management of records and information systems

10
Strategic Objectives and Targets
• In the next five years Provincial Health Legislation will be aligned to the National Health Legislation.
• Achieve full implementation of supply chain management policy the end of 2005/06
• Outsourcing of the following: Renal dialysis, Concession of hospitals, Staff accommodation, Laundry services and EMS on a PPP basis by the end 2006/07.

11
Continue…
• Payment of creditors within 30 days by 2005/06• 100% of staff must have signed PI’s by 2005/06• Development of a full HR Strategy in the next by
the end of 2005/06• Approved organizational structures for the
Department during 2005/06• All institutions to have Governance Structures by
2005/06

12
Continue…
• 100% of all institutions in the Department have effective Risk management policies and practices by 2005/06
• Accurate information available and disseminated to correct stakeholders at all times by 2005/06
• 100% compliance with National Archives
guidelines by 2005/06

13
Programme 2:District Health Services
PRIORITIES• Integrated Primary Health Care• District Health Services and Devolution• Communicable Disease Control• Malaria programme• HIV & AIDS, STIs & TB • Decentralization of Hospital Management
• Strengthening of Partnerships with NPOs
14
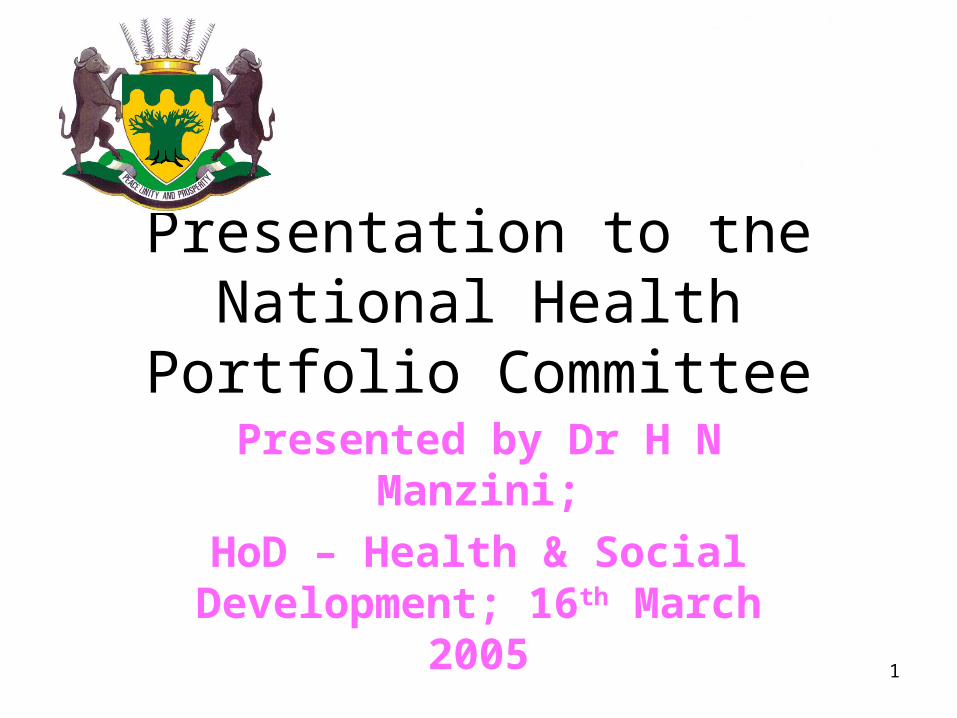
Strategic Objectives and Targets
• 100% provision of comprehensive primary health care package at all PHC facilities by 2006/07
• 100% access to primary health care services by 2007/08;• All designated PHC Facilities to render 24 hrs service by
2007/08• 100% implementation of devolution strategy by by 2005/06
• Service Level Agreement will be signed with District Municipalities for provision of Primary Health Care Services by 2005/06

15
Continue…
• 95% immunization coverage of children under 1year by 2007/08.
• >1% reduction mortality and morbidity through rapid response to outbreaks of diseases by 2006/07
• Reduce Malaria incidence by 10 % per year.

16
Continue…
• 85 % Access to Provision of comprehensive HIV&AIDS, care, treatment, management and support including ARV’s and nutritional supplements by 2007/08
Cure rate of new smear positive TB cases at first attempt increased to 85% by 2006/07
• Strengthen partnership with EU on PDPHC, HIV&AIDS by formalising LSAs with NPOs by 2005/06

17
Programme 3: Emergency Medical Services.
PRIORITIES• HR development• Improve access to EMS services
STRATEGIC OBJECTIVES AND TARGETS• Outsourcing of Emergency Medical
services Fleet by 2006/07

18
Programme 4: Provincial Hospitals Services.
PRIORITIES
• Revitalization of Hospitals.
• Implementation of Secondary Hospital Package.
• Decentralisation of Hospital management
• Specialised Hospital Services.
• Accreditation of facilities for teaching purposes.

19
STRATEGIC OBJECTIVES AND TARGETS
• 100% full decentralized Hospital Management by 2006/07
• Complete Revitalisation Projects by 2007/08
• 100% transformed nursing services by 2007/08
• 100% revenue collection targets achieved by 2005/06
20
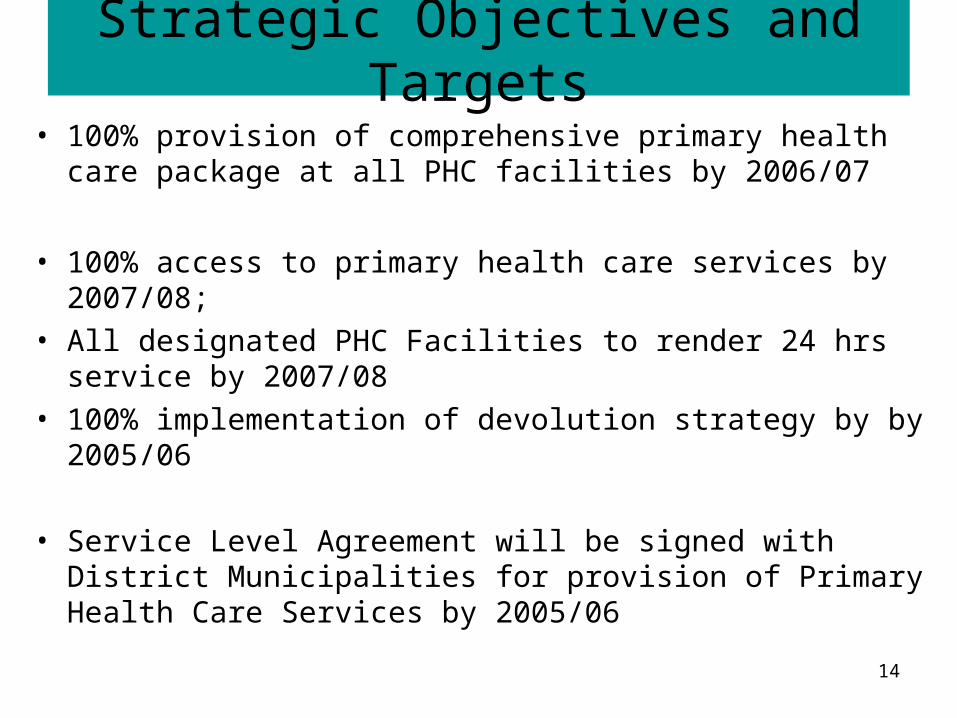
Programme 5:Central Hospitals - Provincial Tertiary Services.
PRIORITIES
• Revitalization of Hospitals
• Implementation of Tertiary Hospital Package
• Decentralisation of Hospital management
• Accreditation of facilities for teaching purposes
• Development of a medical school.

21
STRATEGIC OBJECTIVES AND TARGETS
• Reduce ALOS to 5% by 2007/08.• Usable bed utilization rate increased to 84% by
2007/08.• Reduce patient waiting time to 1hr by 2007/08.• Complete consolidation of developing tertiary services
package (MTS) by 2006/07;• Fast –track and consolidate efforts to develop
Academic Departments to support the Limpopo University Medical School between 2005/06 – 2007/08 (budgets & other resources)

22
Programme 6: Health Sciences and Training.
PRIORITIES
• Conduct research in nursing
• Train mid level workers
• Train nurses
• Provide bursaries
• Train Emergency Care Practitioners

23
STRATEGIC OBJECTIVES AND TARGETS
• 100% operational post basic diploma nursing program by 2006/07
• 80% student intake from rural and nodal communities by 2007/08.
• Initiate and improve partnerships with institutions of higher learning and other relevant institutions by end of 2006/07

24
Programme 7: Health Care Support Services.
PRIORITIES
• Supply of medicines to health facilities
• Monitor rational utilisation of drugs;
• Inspectorate Services.

25
STRATEGIC OBJECTIVES AND TARGETS
• Increase drug availability at the depot, hospitals, health centers and clinics to 95% by 2007/08.
• Pharmaceutical programme managed in line with national policy on an ongoing basis.
26
Programme 8: Health Facilities Management
PRIORITIES
• Upgrade and Building of PHC facilities
• Hospital revitalisation
• Maintenance of Health Facilities

27
STRATEGIC OBJECTIVES AND TARGETS
• Built 100 clinics in the next five years at the rate of 20 clinics per year
• All PHC facilities have clean water and sanitation by 2007/08
• All PHC facilities fully electrified by 2008/09

28
Section B
MTEF Budget
&
Expenditure Trends

29
New Equitable Share Formula
• The growth in the provincial equitable share primarily caters for the three-year wage agreement for public servants and further adjustments to the remuneration of educators.
• It also provides for funding of the primary health function in non-metropolitan municipalities, strengthening of school based education, and the expansion of developmental welfare services.
• The division of the equitable share allocation among provinces is done through an objective redistributive formula.
• The formula is reviewed and updated annually and takes recommendations of the Financial and Fiscal Commission into account.
• A broad-ranging review of the formula has been undertaken for the 2005 / 06 and MTEF.

30
New Equitable Share Formula cont..The formula consists of 4 main and 2 minor components
• Education = 51 % and uses census data for the school age cohort and official estimates of school enrolment weighted equally.
• Health = 26 % is based on estimated number of people with and without medical aid coverage and weighted at a 1 : 4 ratio.
• Institutional = 5 % allocated equally across provinces to cover core provincial administration costs.
• Basic = 14 % is calculated on the basis of the population share of each province.
• Poverty = 3 % reinforces the redistributive basis.• Economic = 1 % to cater for provincial revenue raising
powers that have not changed

31
Limpopo Provincial Equitable Share Allocations – over the MTEF
Limpopo 2005/06 Equitable 2006/07 2007/08Departments R ‘m % Share R ‘m % R ‘m %Health 4,431 24.11% 26% 4,735 23.65% 4,942 22.98%
Education 9,416 51.24% 51% 10,181 50.86% 10,894 50.66%
Other 4,529 24.65% 23% 5,102 25.49% 5,670 26.36%
Equitable Share 18,376 100.00% 100% 20,018 100.00% 21,506 100.00%Under funding against the new Equitable Share Formula
347 1.89% 470 2.35% 650 3.02%
The provincial allocation to Health is below the 26 % set in the formula and reducesover the MTEF period from the 24.11 % in 2005/06 to 22.98 % in the outer year.This indicates an under funding of the department against the formula
32
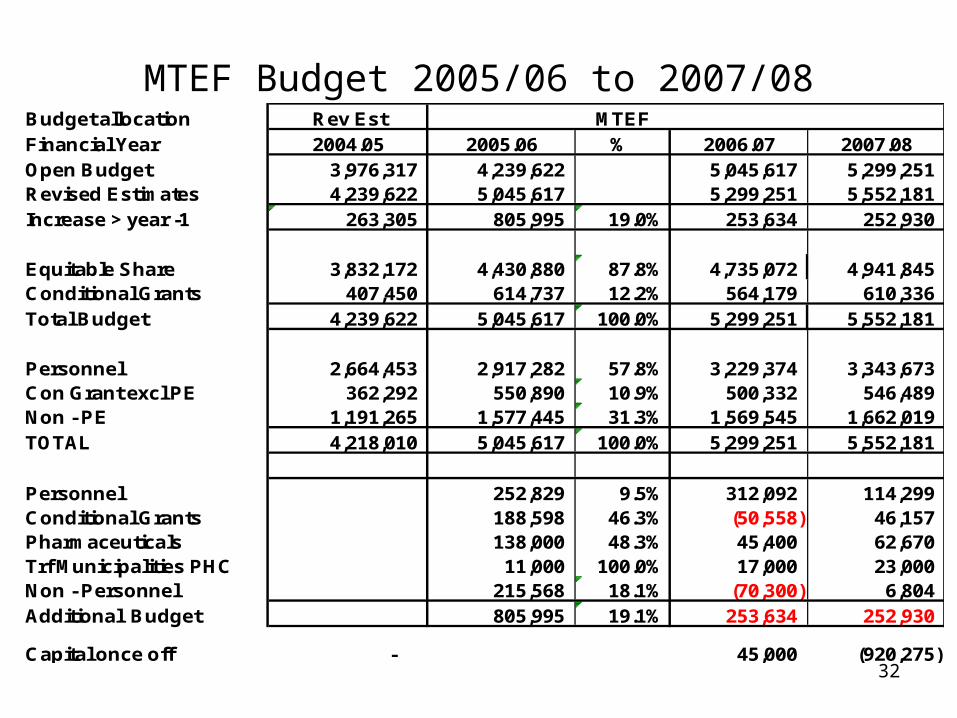
MTEF Budget 2005/06 to 2007/08Budget allocation Rev Est MTEFFinancial Year 2004.05 2005.06 % 2006.07 2007.08Open Budget 3,976,317 4,239,622 5,045,617 5,299,251 Revised Estimates 4,239,622 5,045,617 5,299,251 5,552,181 Increase > year -1 263,305 805,995 19.0% 253,634 252,930
Equitable Share 3,832,172 4,430,880 87.8% 4,735,072 4,941,845 Conditional Grants 407,450 614,737 12.2% 564,179 610,336 Total Budget 4,239,622 5,045,617 100.0% 5,299,251 5,552,181
Personnel 2,664,453 2,917,282 57.8% 3,229,374 3,343,673 Con Grant excl PE 362,292 550,890 10.9% 500,332 546,489 Non - PE 1,191,265 1,577,445 31.3% 1,569,545 1,662,019 TOTAL 4,218,010 5,045,617 100.0% 5,299,251 5,552,181
Personnel 252,829 9.5% 312,092 114,299 Conditional Grants 188,598 46.3% (50,558) 46,157 Pharmaceuticals 138,000 48.3% 45,400 62,670 Trf Municipalities PHC 11,000 100.0% 17,000 23,000 Non - Personnel 215,568 18.1% (70,300) 6,804 Additional Budget 805,995 19.1% 253,634 252,930
Capital once off - 45,000 (920,275)

33
MTEF Budget 2005/06 to 2007/08
• There is concern for Non PE in the outer years.• As can be seen the allocation for Non PE reduces in the
2006/07 year by R 70.299 m with once off costs of R65.2 m from the previous year.
• The 2007/08 year shown an increase above the previous year of R 6.803 m that leaves a almost no growth in the budget for Non PE for two years running.
• The rest of the budget is ring fenced and cannot be rerouted to fund Non Personnel Expenditure.
• The allocation for the purchase of drugs does show real growth and these funds are ring fenced.

34
Summary of Conditional Grant Allocation
2003/04 2004/05Year 1
2005 /06Year 2
2006 /07Year 3
2007 / 08
41,981 51,805 72,411 72,411 76,03228,962 77,430 125,899 175,861 184,65496,239 106,463 212,918 123,698 160,69013,337 15,388 17,457 18,505 19,430
158,155 20,320 22,344 - -54,287 46,878 71,182 71,579 71,6481,000 - - - -
58,888 83,066 92,526 102,125 97,8829. Colera/Malaria 6,100
452,849 407,450 614,737 564,179 610,336
1. Health Prof Train & Dev
Conditional Grants in R ' 000
5. Intergrated Nutrition Program6. National Tertiary Services
4. Hospital Man and Q'lity Imp
2. HIV & AIDS3. Hospital Revatalisation
7. Medico-Legal8. Provincial Infrastructure

35
MTEF Budget 2005/06 to 2007/08Budget Allocation of Non PE for 2005 / 06 Once OffBuildings Forensic 36,000 36,000 Ambulance FML 33,800 Accomodation PPP 79,900 Pharmaceuticals 138,000 Software - Medicine 9,000 9,000 Learnership 12,000 Laundry PPP 31,620 Medical Waste 54,000 Bursaries additional 8,000 GG conversions to mobile clinics 3,000 3,000 WHITOC Buildings 5,000 5,000 E M S Stations 4,800 Medical School 1,000 Repairs & Maint & Upgrade Clinics 20,000 GG Vehicle fleet 15,000 COSSASA 1,700 Centre of Excellence 12,500 12,500 Medico Legal 200 200 Trf - Municipalities PHC 11,000 Inflationery adjustment 2,328 Total 478,848 65,700

36
MTEF Budget 2005/06 to 2007/08- HealthBudget Allocation per Programme
Programme - Health 2004/05 2005/06 Move % Add 2006/07 % Add 2007/08
Administration 303,691 311,152 7,461 2.5% 301,098 -3.2% 314,413
District Health 2,162,783 2,348,512 185,729 8.6% 2,655,782 13.1% 2,734,830
Emergency Medical Ser 92,500 118,370 25,870 28.0% 114,860 -3.0% 116,349
Provincial Hospital 536,178 568,121 31,943 6.0% 599,029 5.4% 624,573
Central Hospital 408,647 466,213 57,566 14.1% 497,098 6.6% 529,586
Health Scienes and Train 141,623 209,935 68,312 48.2% 216,018 2.9% 226,649
Health Care Support 293,440 522,745 229,305 78.1% 528,020 1.0% 580,614
Health Facilities Man 300,760 500,569 199,809 66.4% 387,347 -22.6% 425,167
4,239,622 5,045,617 805,995 19.0% 5,299,251 5.0% 5,552,181
37
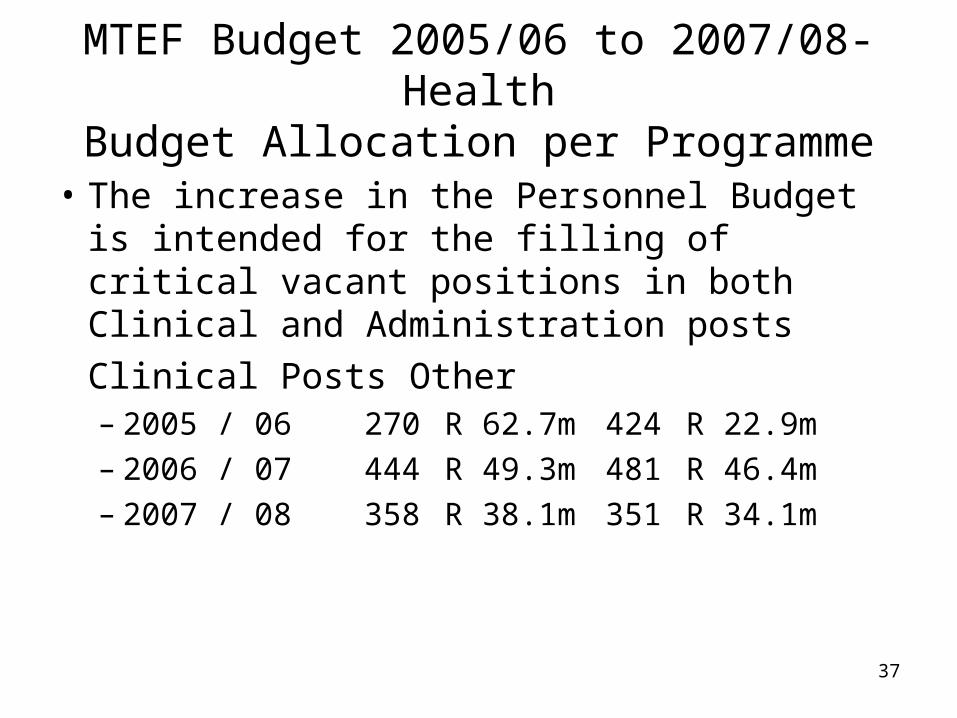
MTEF Budget 2005/06 to 2007/08- HealthBudget Allocation per Programme
• The increase in the Personnel Budget is intended for the filling of critical vacant positions in both Clinical and Administration posts
Clinical Posts Other– 2005 / 06 270 R 62.7m 424 R 22.9m– 2006 / 07 444 R 49.3m 481 R 46.4m – 2007 / 08 358 R 38.1m 351 R 34.1m
38
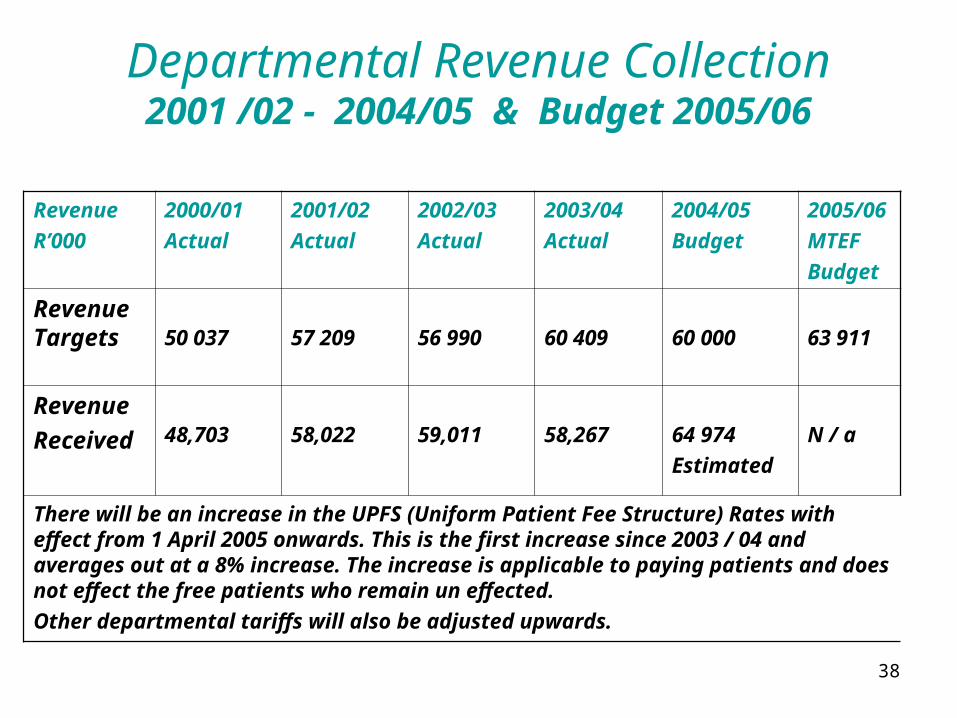
Departmental Revenue Collection2001 /02 - 2004/05 & Budget 2005/06
Revenue
R’000
2000/01
Actual
2001/02
Actual
2002/03
Actual
2003/04
Actual
2004/05
Budget
2005/06
MTEF
Budget
Revenue Targets 50 037 57 209 56 990 60 409 60 000 63 911
Revenue
Received 48,703 58,022 59,011 58,267 64 974
Estimated
N / a
There will be an increase in the UPFS (Uniform Patient Fee Structure) Rates with effect from 1 April 2005 onwards. This is the first increase since 2003 / 04 and averages out at a 8% increase. The increase is applicable to paying patients and does not effect the free patients who remain un effected.
Other departmental tariffs will also be adjusted upwards.

39
Expenditure Trends: 1995/96 – 2003/042004/05 Estimated and MTEF Budget
Financial Budget Expenditure Variance % of Budget % Budget
Year R 000 R 000 R 000 Spent Increase
1995 / 1996 1,543,756 1,166,382 377,374 75.55% - 1996 / 1997 2,053,046 1,999,305 53,741 97.38% 32.99%1997 / 1998 2,095,831 1,953,776 142,055 93.22% 2.08%1998 / 1999 1,906,185 2,056,569 (150,384) 107.89% -9.05%1999 / 2000 2,282,601 2,220,538 62,063 97.28% 19.75%2000 / 2001 2,550,064 2,565,894 (15,830) 100.62% 11.72%2001 / 2002 2,718,901 2,663,530 55,371 97.96% 6.62%2002 / 2003 3,145,774 3,166,277 (20,503) 100.65% 15.70%2003 / 2004 3,596,694 3,743,498 (146,804) 104.08% 14.33%2004 / 2005 4,239,622 4,190,622 49,000 98.84% 17.88%2005 / 2006 5,045,617 19.01%2006 / 2007 5,299,252 5.03%2007 / 2008 5,552,181 4.77%

40
Personnel v/s Non-Personnel trends
Personnel % of Non- PE % of TotalYear Costs Costs Costs Costs Expenditure
1995 / 96 827,245 70.9% 339,137 29.1% 1,166,382 1996 / 97 964,414 48.2% 1,034,891 51.8% 1,999,305 1997 / 98 1,089,839 55.8% 863,937 44.2% 1,953,776 1998 / 99 1,093,129 53.2% 963,440 46.8% 2,056,569 1999 / 00 1,504,640 67.8% 715,898 32.2% 2,220,538 2000 / 01 1,626,285 64.4% 897,693 35.6% 2,523,978 2001 / 02 1,737,625 65.2% 925,905 34.8% 2,663,530 2002 / 03 1,950,056 61.6% 1,216,221 38.4% 3,166,277 2003 / 04 2,375,460 63.5% 1,368,338 36.5% 3,743,798
2004 /05 2,625,453 62.7% 1,565,169 37.3% 4,190,622
2005/06 2,917,282 65.8% 1,513,598 34.2% 4,430,880 2006/07 3,229,374 68.2% 1,505,699 31.8% 4,735,073 2007/08 3,343,673 67.7% 1,598,172 32.3% 4,941,845
Estimated Expenditure
Budget over the MTEF

41
The End
‘Working as A Team has potential to assist in rolling back the frontiers of Ill – health and Poverty globally’