Embed Size (px)
Citation preview

Presentation
to the analysts
August 2017

GBL August 2017
1. H1 2017 - Highlights 2
2. H1 2017 - Financial performance 7
3. Dividend distribution & outlook 19
4. Appendix 22
2

GBL | August 2017 3
H1 2017 - Highlights
1. H1 2017 - Highlights 4. Appendix3. Dividend distribution & outlook2. H1 2017 - Financial Performance
Solid H1 2017 performance notably supported by the favourable evolution
of the macroeconomic environment giving momentum to the financial
markets
ANA increasing 6.5% over the period to €18.1bn
Net result of €474m
Cash earnings of €359m
LTV ratio of 0.8%
Gross dividend yield of 4.0%(1)
Continued execution of the portfolio diversification strategy
Strategic Investments
€15.7bn
88.1% of the portfolio value
Incubator Investments
€1.2bn
6.9% of the portfolio value
Sienna Capital
€0.9bn
5.0% of the portfolio value
TSR
0%
5%
10%
15%
20%
25%
30%
LTM 5 years
GBL BEL20 CAC DAX SMI
(1) LTM computation

GBL | August 2017 4
Over H1 2017, GBL has further implemented its asset rotation strategy…
4. Appendix2. H1 2017 - Financial Performance1. H1 2017 - Highlights
Equity investment in Parques Reunidos
• Acquisition of a 15% position in Parques
Reunidos announced on 12 April 2017,
representing a market value of €201m at
end of June 2017
• Reference operator of leisure parks in
Europe, North America and Asia, listed on
the Madrid stock exchange
• Representation of GBL in the Board of
Directors
Strengthening of the position
• Announcement by Burberry that GBL had
crossed the threshold of 3.0% of the voting
rights in the company on 28 February 2017
• Reinforcement of the shareholding in
Burberry, from 2.95% at end of December
2016 to 3.95% at end of June 2017,
representing a market value of €327m
Participation in the capital increase
• Participation in March 2017 in the capital
increase of Ontex aiming at refinancing the
company after the acquisition of the
« hygienic consumables » activity of
Hypermarcas
• Unchanged shareholding of 19.98%
following the transaction
• Representation of GBL in the Board of
Directors
3. Dividend distribution & outlook

GBL | August 2017 5
… and benefited from a solid momentum in terms of asset rotation at Sienna Capital level…
Expected performance of KCO III in
line with target returns
• At 30 June 2017, KCO III is fully
invested in primary and secondary
transactions and has distributed to its
investors a total amount of €84m,
representing approximately 18% of
capital called.
Sale of participations in Golden Goose
and ELITech
Golden Goose
• Sale to Carlyle of ECP III’s majority
stake in Golden Goose, an Italian
designer of contemporary footwear,
clothing and accessories
• Net consolidated capital gain on
disposal of €112m (GBL’s share)
ELITech
• ECP III reached an agreement with PAI
Partners for the sale of ELITech Group,
a manufacturer of specialty in-vitro
diagnostics equipment and reagents
• Net consolidated capital gain on
disposal, estimated to €102m (GBL’s
share) at 30 June 2017
Acquisition of Ipackchem
• Acquisition by Sagard 3 of a stake in
Ipackchem, one of the global leaders in
the manufacturing of “barrier”
packaging, whose products are mainly
used in the transport and storage of
aromas, fragrances and agrochemical
products for which permeability,
contamination and evaporation
constraints are critical
4. Appendix2. H1 2017 - Financial Performance1. H1 2017 - Highlights
Acquisition of Ivantis and Xeris
• Acquisition by MP II of a minority
stake in Ivantis Inc., a company
dedicated to the development of new
and innovative solutions for glaucoma
• Acquisition by MP II of a minority
stake in Xeris Pharmaceuticals Inc.:
biopharmaceutical company developing
injectable therapeutics for multiple
indications including diabetes
3. Dividend distribution & outlook
GBL | August 2017 6
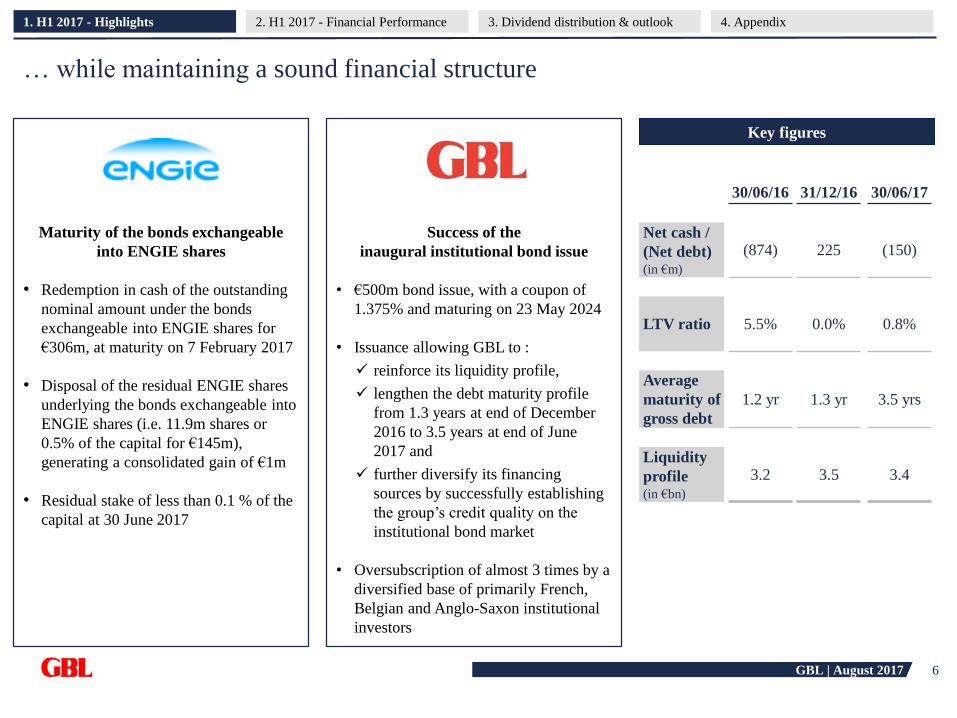
… while maintaining a sound financial structure
Success of the
inaugural institutional bond issue
• €500m bond issue, with a coupon of
1.375% and maturing on 23 May 2024
• Issuance allowing GBL to :
reinforce its liquidity profile,
lengthen the debt maturity profile
from 1.3 years at end of December
2016 to 3.5 years at end of June
2017 and
further diversify its financing
sources by successfully establishing
the group’s credit quality on the
institutional bond market
• Oversubscription of almost 3 times by a
diversified base of primarily French,
Belgian and Anglo-Saxon institutional
investors
Maturity of the bonds exchangeable
into ENGIE shares
• Redemption in cash of the outstanding
nominal amount under the bonds
exchangeable into ENGIE shares for
€306m, at maturity on 7 February 2017
• Disposal of the residual ENGIE shares
underlying the bonds exchangeable into
ENGIE shares (i.e. 11.9m shares or
0.5% of the capital for €145m),
generating a consolidated gain of €1m
• Residual stake of less than 0.1 % of the
capital at 30 June 2017
4. Appendix2. H1 2017 - Financial Performance1. H1 2017 - Highlights
Key figures
30/06/16 31/12/16 30/06/17
Net cash /
(Net debt)(in €m)
(874) 225 (150)
LTV ratio 5.5% 0.0% 0.8%
Average
maturity of
gross debt
1.2 yr 1.3 yr 3.5 yrs
Liquidity
profile(in €bn)
3.2 3.5 3.4
3. Dividend distribution & outlook

GBL August 2017
1. H1 2017 Highlights 2
2. H1 2017 Financial performance 7
3. Dividend distribution & outlook 19
4. Appendix 22
7

GBL | August 2017 8
KPI overview at end of June 2017
CommentsKPIs
1. H1 2017 - Highlights 4. Appendix2. H1 2017 - Financial Performance
Adjusted net assets at €18.1bn, an increase by 6.5% or €1.1bn on H1 2017
supported by the favourable evolution of the macroeconomic environment giving
momentum to the financial markets
Adjusted Net
Assets
1
Resilient cash
earnings
2Limited increase in the cash earnings compared to last year (€350m at 30 June
2016) notwithstanding the gradual exit from high-yielding assets of the energy
sector which will have a dilutive impact on the full year 2017
Loan To Value
3LTV maintained at a conservative level (0.0% at year-end 2016 and 5.5% at end
of June 2016)
+ 6.5%
€359m
0.8%
€474mConsolidated net
result back in
positive territory
Consolidated net result also impacted by exceptional items, i.e. mostly the capital
gain realized on disposal by ECP III of its stake in Golden Goose (€112m, group’s
share)
Liquidity profile €3.4bnSignificant liquidity profile allowing rapid implementation of investment
decisions
3. Dividend distribution & outlook

GBL | August 2017 9
0
20
40
60
80
100
73.46
(0.43)
3.252.04
112.804.00 0.93
92.82
112.17
(2.93)105.31
79.72
84.29 85.31
30/06/2016 Dividend
GBL
Sienna &
Others
ConsumersServicesIndustryEnergy31/12/2016 28/07/201730/06/2017
6.5% increase in adjusted net assets over H1 2017 (in €/share)
1. H1 2017 - Highlights 4. Appendix2. H1 2017 - Financial Performance
1
20.9%
24.3%
24.9% 24.4%
3. Dividend distribution & outlook

GBL | August 2017 10
ANA growth supported by the performance delivered by the new participations
Stock price
30/06/2017(1)
CHF 2,322
EUR 60.9
EUR 167.8
EUR 31.1
Gross
dividend
yield(1)(2)
3.4%
2.4%
1.1%
1.6%
Invested
capital
€2.2bn
€0.7bn
€1.3bn
€0.5bn
GBP 16.6 2.5% €0.3bn
TOTAL €5.1bn
+ 7.8%
+ 34.8%
+ 32.1%
+ 12.0%
+ 47.5%
TSR LTM
30/06/2017(1)
ANA
contribution
30/06/2017
€2.7bn
€1.2bn
€2.6bn
€0.5bn
€0.3bn
€7.5bn
EUR 16.4 1.6% €0.2bn+ 26.0% €0.2bn
New participations
since 2012
1. H1 2017 - Highlights 4. Appendix2. H1 2017 - Financial Performance
1
(1) Source: Bloomberg
Stock price
H1 2017 Δ(1)
+ 25.7%
+ 26.6%
+ 24.9%
+ 21.3%
+ 23.2%
+ 16.2%
(2) Gross dividend yield computed at 30 June 2017 on an LTM basis using the stock price at 30/06/2016 (with the exception of Parques Reunidos for which the dividend
considered for computation was paid in July 2017)
3. Dividend distribution & outlook

GBL | August 2017 11
By asset type By sector By geography
Significant portfolio rebalancing since the initiation of the new strategy in 2012
1. H1 2017 - Highlights 4. Appendix
Value/Yield
54%
Value/Growth
28%
Growth
15%
Sienna Capital 3%
€12.3bnEnergy &
Utilities
54%Industry
29%
Consumer
15%
Ergon & Sagard 3%
2011
2017
France
97%
Other
3%
2. H1 2017 - Financial Performance
1
France
35%
Switzerland
31%
Belgium
9%
Germany
15%
UK 2%
Spain
1%Other 6%
€12.3bn €12.3bn
€17.8bn
Energy 4%
Industry
41%
Consumer
34%
Services
15%
Sienna Capital
& Others 6%
€17.8bn
3. Dividend distribution & outlook
Value/Yield 4%
Value/
Growth
35%Growth
55%
Sienna Capital &
Others 6%
€17.8bn

GBL | August 2017 12
A rebalanced and diversified portfolio reflecting the asset rotation strategy
conducted since 2012Strategic Investments Incubator
Sienna
Capital
Sector Specialty
minerals
Cement &
aggregatesTIC
Sports
equipment
Wines &
Spirits
Materials
technologyOil & Gas
Hygienic
consum.
Luxury
fashion
Leisure
parks
Alternative
assets
Ranking in
their sector#1 #1 #1 #2 #2 Top 3 Top 5 Top 3 Top 10 Top 3 n.a.
GBL’s ranking
in the
shareholding(1)
#1 #2 #1 #1 #4 #1 #11 #1 #6 #2 n.a.
Date of first
investment1987 2005 2013 2015 2006 2013 1998 2015 2016 2017 2013
GBL %
ownership53.6% 9.4% 16.2% 7.5% 7.5% 17.0% 0.6% 19.98% 3.95% 15.2% 100%
Market cap
(€bn) (1) 6.1 30.5 16.6 35.1 31.1 6.8 107.5 2.6 8.3 1.3 n.a.
Value of GBL’s
stake (€bn)3.3 2.9 2.7 2.6 2.3 1.2 0.7 0.5 0.3 0.2 0.9
(1) Source: Bloomberg Note: figures are at 30/06/2017
1. H1 2017 - Highlights 4. Appendix2. H1 2017 - Financial Performance
1
3. Dividend distribution & outlook

GBL | August 2017 13
Strategic Investments IncubatorSienna
Capital
Value of GBL’s
stake(1) (€bn)3.3 2.9 2.7 2.6 2.3 1.2 0.7 0.5 0.3 0.2 0.9
Value of GBL’s
stake in # of
days of ADTV(2)
301 15 36 12 24 30 1 61 4 83 n.a.
Ratings
(S&P /
Moody’s)
BBB /
Baa2
BBB /
Baa2n.r. / A3 Unrated
BBB- /
Baa2Unrated A+ / Aa3 BB / Ba2 Unrated Unrated n.a.
Bloomberg
consensus
reco(3)
n.a.
(1) Figures at 30/06/2017
(2) 1-year average at 30/06/2017 in terms of ADTV (Average Daily Trading Volume)
(3) Consensus at 28/07/2017
1. H1 2017 - Highlights 4. Appendix
Portfolio assets with Investment Grade credit quality and strong liquidity
2. H1 2017 - Financial Performance
1
Buy
Hold Sell
3. Dividend distribution & outlook

GBL | August 2017 14
Cash earnings of €359m
H1
2016
H1
2017
Expenses1Net dividend contribution from the participationsCash
earnings
10.0 9.6(0.4)
(1.7) 359.1360.8
+ 2.7%
€ million
(1) Interests, other financial and other operating income and expenses
1. H1 2017 - Highlights 4. Appendix
361.2 (11.7) 349.5
2. H1 2017 - Financial Performance
2
Others
78
7375
19 18
39
13
23
5
0 0 0
18
107
8380
27
19 18
13
0
9
30
20
3. Dividend distribution & outlook

GBL | August 2017 15
Consolidated net result of €474m
1. H1 2017 - Highlights 4. Appendix2. H1 2017 - Financial Performance
2
• The consolidated net result at 30 June
2017 was impacted by exceptional
events, i.e. mostly the capital gain
realised on the disposal by Ergon
Capital Partners III of its stake in
Golden Goose (€112m, group’s share)
• The cash earnings are resilient,
displaying a small progression
compared to the first half of 2016
notwithstanding the gradual exit from
high-yielding assets of the energy
sector which will have a dilutive
impact on the full year 2017
Key Highlights€ million H1 2016 H1 2017 Δ
Cash earnings 349.5 359.1 9.6
Mark to market and other
non cash items41.9 3.9 (38.0)
Operating companies and
Sienna Capital130.2 200.9 70.7
Eliminations, capital gains,
depreciations and reversals(1,410.0) (89.6) 1,320.4
Consolidated net result (888.4) 474.3 1,362.7
3. Dividend distribution & outlook

GBL | August 2017 16
Sound financial position
1. H1 2017 - Highlights 4. Appendix2. H1 2017 - Financial Performance
EVOLUTION OVER THE LAST 12 MONTHS
3
3. Dividend distribution & outlook
Gross cash 1,263 1,207
Gross debt (2,136) (1,357)
LTV 5.5% 0.8%
Undrawn committed credit lines 1,950 2,150
Liquidity profile 3,213 3,357
(1) Other items primarily taking into account the reclassification of ENGIE shares as from 31/12/2016 from the portfolio value to the gross cash position (for a market value of €145m at 31/12/2016)
1,375
(1,150)
0.0%
2,150
3,525
(874)
(150)
1,351
(502)
91
159
459
(579)
359
(140)
(473)
(1.500)
(1.000)
(500)
0
500
Net debt
30/06/2016
Acquisitions Disposals Cash
Earnings
Other Net cash
31/12/2016
Acquisitions Disposals Cash
Earnings
Other Dividend
distribution
Net debt
30/06/2017
225(1)
(1)
(1,000)
(1,500)

GBL | August 2017 17
0.0% 0.0% 0.0% 0.0%
8.2%
0.2%
9.6%
5.9%
2.9%
1.5%
4.8% 4.8%
5.7%
0.0%0.8%
5.8%
2.8%
1.5%
4.7% 4.7%
5.5%
0.0% 0.8%0,0%
2,0%
4,0%
6,0%
8,0%
10,0%
12,0%
12/2007 12/2008 12/2009 12/2010 12/2011 12/2012 12/2013 12/2014 12/2015 12/2016 12/2017
12.0%
10.0%
8.0%
6.0%
4.0%
2.0%
0.0%
Prudent use of leverage
1. H1 2017 - Highlights 4. Appendix
• The evolution of the Loan To Value ratio reflects (i) the
implementation of GBL’s portfolio rotation strategy and
(ii) GBL’s formal policy of limited net indebtedness over
time.
• Over the long term, throughout the economic cycles, GBL
has constantly kept the Loan To Value ratio under control.
(1) Calculated (i) based on information disclosed in GBL’s annual and half-yearly reports and (ii) using (a) the portfolio value over the 10-year analysed period (blue line) and
(b) the adjusted portfolio value (i.e. increased by the value of the treasury shares underlying the bonds convertible into GBL shares issued in October 2013) since year-end
2013 (grey line)
• As part of its stringent financial discipline and with the aim
to keep close control over the LTV ratio, GBL reassesses on
a continuous basis its investment capacity by monitoring its
commitments under:
Its derivatives financial instruments (sales of put)
Sienna Capital on a 1-year rolling basis
HISTORICALLY LOW LOAN TO VALUE RATIO (1)
2. H1 2017 - Financial Performance
3
3. Dividend distribution & outlook
04/2011: acquisition
of Pargesa Holding
S.A.’s 25.6% stake in
Imerys in 03/2011
06/2013: €2bn
acquisition of 15% of
SGS from EXOR

GBL | August 2017 18
Well diversified financing mix and extended maturity profile
GROSS DEBT SPLIT AT 30/06/2017
1. H1 2017 - Highlights 4. Appendix
DEBT MATURITY AT 30/06/2017(2)
2. H1 2017 - Financial Performance
Undrawn
committed
credit
lines
€2,150m
Institutional
Bond
€500m
Retail
Bond
€350m
Convertible
Bonds
€450m
0
500
1.000
1.500
2.000
2017 2018 2019 2020 2021-22 2023 2024
• Weighted average maturity of the gross debt of 3.5 years at
30 June 2017 (1.3 year at 31 December 2016) following the
7-year inaugural institutional bond issuance of €500m in
May 2017
26%
Retail Bond
Dec. 2017
(4.00%)
37%
Institutional Bond
May 2024
(1.375%)
33%
Convertible
Bonds
Oct. 2018
(0.375%)
4%(1)
• Well-diversified funding mix
• All capital markets instruments (DCM / ECM):
- Unsecured
• All debt instruments :
- No financial covenants
(1) €57m bank debt maturing in 2023-26
(2) Excluding the €57m bank debt
3
3. Dividend distribution & outlook
2,000
1,500
1,000
500

GBL August 2017
1. H1 2017 Highlights 2
2. H1 2017 Financial performance 7
3. Dividend distribution & outlook 19
4. Appendix 22
19

GBL | August 2017 20
A constantly growing dividend throughout economic cycles
1. H1 2017 - Highlights 4. Appendix3. Dividend distribution & outlook2. H1 2017 - Financial Performance
0%
1%
2%
3%
4%
5%
6%
0,00
0,50
1,00
1,50
2,00
2,50
3,00
3,50
1997 1998 1999 2000 2001 2002 2003 2004 2005 2006 2007 2008 2009 2010 2011 2012 2013 2014 2015 2016 H1 2017
Gross dividend per share
ANA per share
Dividend yield
3.5
3.0
2.5
2.0
1.5
1.0
0.5
0.0
Div.
(€)ANA
(€)
140.0
120.0
100.0
80.0
60.0
40.0
20.0
0.0
CAGR (2006-2016) of 4.4%
CAGR (1997-2016) of 5.6%

GBL | August 2017 21
Outlook for 2017
Strategic Investments Incubator
2017 EBITDA
growth
(consensus) (1)
+ 12.9% + 5.0% + 3.8% + 23.1% + 5.8% + 9.2% + 11.3% + 20.0% + 4.8% + 8.7%
Consensus
Target Price and
vs stock price(1)
€ 75.5
+ 2.8%
CHF 59.6
+ 3.6%
CHF 2,153
+ 0.1%
€ 191.2
- 0.7%
€ 121.7
+ 3.2%
€ 59.3
- 10.4%
€ 49.8
+ 15.9%
€ 34.3
+ 18.2%
£ 16.89
- 1.6%
€ 17.4
+ 15.8 %
2017 DPS (2)
and
vs 2016 (%)
€ 1.87 (a)
+ 6.9%
CHF 2.00(a)
+ 33.0%
CHF 70 (a)
+ 2.9%
€ 2.00 (a)
+ 25.0 %
€ 2.03 (e)
+ 8.0%
€ 2.47 (e)
+ 3.8%
€ 1.35 (e)
+ 0.8%
€ 0.55 (a)
+ 19.6%
GBp 39.90
(e) + 7.0%
€ 0.25 (a)
n.a.
1. H1 2017 - Highlights 4. Appendix2. H1 2017 - Financial Performance
• During the first half of 2017, GBL has further reinvested the proceeds from disposals of the high-yielding assets of the
energy sector. Given the seasonality of the dividend contributions, the cash earnings related to the second half of 2017
will be negatively impacted by this asset rotation.
• In this context, and in the absence of major events, GBL anticipates to pay a 2017 dividend at least equivalent to that
relating to the 2016 financial year.
• The results at 30 September 2017 will be published on 2 November 2017.
(1) Source: Bloomberg at 28/07/2017
(2) Source: Bloomberg; (a) = actual / (e) = estimated
3. Dividend distribution & outlook

GBL August 2017
1. H1 2017 Highlights 2
2. H1 2017 Financial performance 7
3. Dividend distribution and Outlook 19
4. Appendix 22
22

GBL | August 2017 23
• 2nd largest listed
holding company in Europe
• Professional shareholder actively
involved in the governance and
strategic decision making of its
portfolio companies
• Friendly and long term
patrimonial investor
• Limited net indebtedness
KEY FIGURES
(1) At 30 June 2017
OVERVIEW
GBL | May 2017
40
1902Holding company established since over a century and listed since
60 years
€18.1bn (1) Adjusted Net Assets (“ANA”)
10Diversified portfolio composed primarily of disclosed investments in
10 listed companies, leaders in their sector
€13bn+Significant asset rotation achieved since 2012, with transactions of
disposals and acquisitions exceeding €13bn
€13.6bn (1) Market capitalisation
€3.4bn (1) Liquidity profile
Managed by ~40 professionals in Brussels, Luxembourg and
the Netherlands, including ~15 investment professionals
1. H1 2017 - Highlights 4. Appendix3. Dividend distribution & outlook2. H1 2017 - Financial Performance
An actively and conservatively managed listed investment vehicle

GBL | August 2017 24
A stable and solid family ownership
Simplified shareholding structure
Desmarais familyFrère family
Frère group
Parjointco50% 50%
56% (75%)
Power Corporation of
Canada group
% ownership
(% voting rights)
• The Frère and Desmarais families joined forces to
invest together in Europe in the early 1980s
– A shareholders’ agreement between the two
families was created in 1990 and has been
extended twice, once in 1996 and again in 2012
– 25 years of formal partnership
• Multi-generational collaboration
• The current agreement, effective until 2029 and
with the possibility of extension, establishes a parity
control in Pargesa and GBL
Swiss listed
company
4%
50% (52%)(1)
Comments
(1) Taking into account the treasury shares whose voting rights are suspended.
1. H1 2017 - Highlights 2. H1 2017 - Financial Performance 4. Appendix3. Dividend distribution & outlook

GBL | August 2017 25
• Active (not activist) board member
(capital structure, management,
strategy)
• Willing to tackle complex situations
– Example:
Key actor in the €40bn merger
between Lafarge and Holcim
Active2
4 key differentiating strengths
Long-term value added investor
• Equity investments of between €250m
and €2bn
• Minority or majority positions
• Public or private companies
• Across multiple sectors and geographies
• Ability to move quickly
Flexible mandate 4
• Small team
• Geographical focus (European-based
companies)
• Sector focus (Industrial, Consumer and
Services)
• Concentrated portfolio
Focused3
10-20 years
3-7 years
1-3 years
3-6 months
GBL
PE funds
Mutual funds
Hedge funds
• Long term investor
– Example:
• No / low debt
Patrimonial1
10-20 years
3-7 years
1-3 years
3-6 months
GBL
PE funds
Mutual funds
Hedge funds
(since
1987)
(1982-2006, i.e.
24 years)
1. H1 2017 - Highlights 2. H1 2017 - Financial Performance 4. Appendix3. Dividend distribution & outlook

GBL | August 2017 26
- €2.3bn €0.5bn €1.3bn
€1.4bn €1.4bn €0.8bn €0.7bn
€1.6bn
€2.5bn
2012 2013 2014 2015 2017
Acquisitions
€6.3bn
Disposals
€7.2bn
GBL | May 2017
2016
Asset rotation exceeding €13bn in aggregated value since 2012
€0.5bn
€0.6bn
1. H1 2017 - Highlights 2. H1 2017 - Financial Performance 4. Appendix3. Dividend distribution & outlook

GBL | August 2017 27
Identification of potential investment targets
Public companies in our preferred geographies:
~5,100 companies
Short-listed sectors:
-~2,600 companies
Compatible size:
-~2,350 companies
Investment Universe of roughly 150
companies
Non-controlled
Meeting GBL Criteria
25-30 companies
Focus on companies located in Belgium, Switzerland,
France, Germany, Spain, Italy, Austria and the UK
Excluded sectors : Utilities, Oil & Gas, Construction,
Financials, Real Estate, Telecom (fix et mobile) and
regulated, Biotech and Tech sectors
Excluding market capitalizations
< EUR 3.5bn or > EUR 30bn
Rule out companies held by a reference shareholder
(> 30% of capital / voting rights)
A restricted investment universe
1. H1 2017 - Highlights 2. H1 2017 - Financial Performance 4. Appendix3. Dividend distribution & outlook

GBL | August 2017 28
A role as an active and influential professional investor
1. H1 2017 - Highlights 2. H1 2017 - Financial Performance
Strategic Investments Incubator
Board presence6/17 2/12 3/10 1/16 2/14 2/11 1/12 1/10
-1/6
Audit Committee1/3 1/4 1/4 1/4 1/3 1/3 1/4
Nomination
and/or
Remuneration
Committee
2/5 1/5 1/3 1/5 1/4 1/4
Strategic
Committee 4/8 1/4 1/6
4. Appendix3. Dividend distribution & outlook

GBL | August 2017 29
Sienna Capital currently invested in six investment managers
1. H1 2017 - Highlights 2. H1 2017 - Financial Performance
Manager Strategy FundsYear of initial
investmentCommitment
Capital
invested
Remaining
callable
capital
Distribution
received to
date
Stake value
Implied
money
multiple
Private
EquityECP I, II, III 2005 €663m €484m €179m €473m €270m 1.5x
Private
EquitySagard I, II, 3 2002 €398m €262m €137m €194m €191m 1.5x
LBO DebtKCO III &
IV2013 €300m €151m €149m €25m €164m 1.2x
Healthcare
Growth
Capital
Mérieux
Participations
I & II
2014 €75m €39m €36m €0m €42m 1.1x
European
mid-cap
public
equities
PrimeStone 2015 €150m €150m - - €172m 1.1x
Long-term
capital to
closely held
businesses
BDTCP II 2015 €113m €48m €65m - €51m 1.1x
CUMULATIVE €1,699m €1,134m €565m €692m €891m 1.4x
4. Appendix3. Dividend distribution & outlook

GBL | August 2017 30
Sienna Capital – Profiles of the investments
Created in 2005, Ergon Capital Partners is as a private equity fund
operating in the mid-market segment. It invests between EUR 20m and
EUR 70m in companies operating in niche markets in the Benelux, Italy,
Spain, France, Germany and Switzerland, holding positions that are
dominant and sustainable over the long term.
Kartesia offers liquidity and credit solutions to mid-sized European
companies, while providing a higher stable return to its investors. More
generally, Kartesia wishes to facilitate the participation of institutional
investors and major individual investors in the European LBO debt
market, by offering them exposure to highly rated, resilient and
diversified credit through primary, secondary or rescue financing
operations carried out with duly selected mid-sized companies.
Created in 2002 on the initiative of Power Corporation of Canada, Sagard
invests in companies valued at more than EUR 100m that are leaders in
their markets, primarily in French-speaking European countries. Working
with company management, it supports them in their growth.
Established in 2009, Mérieux Développement is an investment manager
specialising in growth and venture capital investments in the healthcare
sector. Mérieux Développement works alongside entrepreneurs and
companies whose products and services can bring genuine advances to the
health of patients and consumers worldwide. Mérieux Développement is the
financial arm of Institut Mérieux, which employs 16,500 persons globally
and realized a turnover in excess of USD 3bn in 2015.
BDT Capital Partners was created in 2009 by Byron Trott, a longstanding
partner of Goldman Sachs, with the aim of meeting the strategic and
financial needs of families and/or company founders around the globe. BDT
Capital Partners successfully raised USD 3bn over 2 fundraisings in 2010
and 2012, and then a second fund in 2014, BDT Capital Partners Fund II
(“BDTC II”), amounting to USD 5bn. In 2015, BDTC II was reopened to
investors, in order to raise USD of new capital.
PrimeStone was established in 2014 by three former partners from the
Carlyle Group, specialising in buyouts, and who have worked and invested
together across Europe for more than 15 years. PrimeStone has a strategy of
constructive and active management in mid-sized listed European
companies that have significant value creation potential through strategic,
operational or financial improvement. PrimeStone creates value by taking a
long-term perspective, adopting an active approach and having a significant
influence over its underlying investments through a constructive dialogue
with boards and management teams.
1. H1 2017 - Highlights 2. H1 2017 - Financial Performance 4. Appendix3. Dividend distribution & outlook

GBL | August 2017 31
Profiles
Earlier in his career, Mr. Gallienne worked at the private equity firm Rhône Group in New York and London. In 2005, he founded
and was Managing Director of the private equity funds of Ergon Capital Partners in Brussels.
He has been a Director of Groupe Bruxelles Lambert since 2009 and Co-CEO since 2012.
He obtained an MBA from INSEAD in Fontainebleau.
Mr. Gallienne serves as a Director of Imerys, Pernod Ricard, SGS and adidas.
Ian Gallienne – Co-CEO
Mr. Lamarche began his career at Deloitte Haskins & Sells in Belgium and in the Netherlands. He joined Société Générale de
Belgique as an investment manager and management controller from 1989 to 1995. He moved to Compagnie Financière de Suez as
Advisor to the Chairman and Secretary of the Executive Committee (1995-1997) before becoming Deputy Director for Planning,
Control and Accounting. In 2000, Gérard Lamarche joined NALCO (American subsidiary of the Suez Group and world leader in
industrial water treatment) as Director, Senior Executive Vice President and CFO. In January 2003, he was appointed CFO of the
Suez group. In July 2008, in the context of the merger-takeover of Suez by Gaz de France, he became Executive Vice-President,
Chief Financial Officer of GDF SUEZ.
He has been a Director of Groupe Bruxelles Lambert since 2011 and Co-CEO since 2012.
Mr. Lamarche has a degree in Economics from the University of Louvain-La-Neuve and the INSEAD Institute of Management
(Advanced Management Program for Suez Group Executives).
Gérard Lamarche is on the board of several listed and non-listed companies in Europe including Total, SGS, LafargeHolcim and
Umicore.
Gérard Lamarche – Co-CEO
1. H1 2017 - Highlights 2. H1 2017 - Financial Performance 4. Appendix3. Dividend distribution & outlook

GBL | August 2017 32
Profiles
Mr. Likin started his career in Central Africa in the car distribution sector where he held various administrative and financial
positions at MIC. In 1997, he joined PwC where he became Senior Manager and was designated as C.P.A. by the Institut des
Réviseurs d’Entreprises. In 2007, he joined Ergon Capital Partners as Chief Financial Officer. Later, in June 2012, he was
appointed Group Controller of GBL. Since 1st August 2017, he assumes the CFO function.
Mr. Likin holds a M.Sc. in Commercial Engineering and certificates in Tax Administration from the Solvay Brussels School of
Economics & Management (ULB).
Xavier Likin – CFO
Hans D’Haese started his career in the banking sector at Générale de Banque (now BNP Paribas Fortis), where he held various
commercial positions. He moved on to Crédit Lyonnais Belgium (now Deutsche Bank) working mainly in fixed income and after a
couple of years he joined de Buck Vermogensbankiers in Ghent where he managed for eight years the buy-side research department.
After 12 years of experience as a sell-side equity analyst for Benelux holding and portfolio companies at Bank Degroof Petercam,
he joined GBL in December 2016, where he is in charge of investor relations.
Hans D’Haese graduated in Business Management from the Ghent Odysee University-College.
Hans D’Haese – IR
1. H1 2017 - Highlights 2. H1 2017 - Financial Performance 4. Appendix
Colin Hall – Head of Investments
Mr. Hall began his career in 1995 in the merchant banking group of Morgan Stanley. In 1997, he joined Rhône Group, a private
equity firm, where he held various management positions for 10 years in New York and London. In 2009, he was the co-founder of
a hedge fund, sponsored by Tiger Management (New York), where he worked until 2011. In 2012 he joined, as CEO, Sienna
Capital, a 100% subsidiary of Groupe Bruxelles Lambert, which regroups its alternative investments (private equity, debt or specific
thematic funds). In 2016, he was also appointed to the role of Head of Investments at GBL.
He holds a BA from Amherst College and an MBA from the Stanford University Graduate School of Business.
Mr. Hall is on the Board of Directors of Umicore, Parques Reunidos and Imerys.
3. Dividend distribution & outlook

GBL | August 2017 33
This presentation has been prepared by Groupe Bruxelles Lambert (“GBL”) exclusively for information purposes. This presentation is incompletewithout reference to, and should be viewed solely in conjunction with, the oral briefing provided by GBL.
This document should not be construed as an offer, invitation to offer, or solicitation, or any advice or recommendation to buy, subscribe for, issue orsell any financial instrument, investment or derivative thereof referred to in this document or as any form of commitment to enter into any transaction inrelation to the subject matter of this document.
This presentation has not been reviewed or registered with any public authority or stock exchange. Persons into whose possession this presentationcome are required to inform themselves about and to comply with all applicable laws and regulations in force in any jurisdiction in or from which itinvests or receives or possesses this presentation.
Prospective investors are required to make their own independent investigations and appraisals of GBL before taking any investment decision withrespect to securities of GBL.
GBL does not make any representation or warranty (expressed or implied) as to the accuracy or completeness of the information contained in thisdocument and as to the accuracy of the projections, estimates, assumptions and figures contained in this document. By receipt of this document, therecipient agrees that GBL (or either of its shareholders, directors or employees) shall have no liability for any misstatement or omission or fact or anyopinion expressed herein, nor for the consequences of any reliance upon any statement, conclusion or opinion contained herein. All value indicationsincluded in this document are derived from the financial markets as of the date of this report. It is therefore obvious that a modification of the conditionsprevailing in the financial markets will have an effect on the figures present hereafter.
This document is the exclusive property of GBL. Recipient of this presentation may not reproduce, redistribute or pass on, in whole or in part, thispresentation to any person.
By using or retaining a copy hereof, user and/or retainer hereby acknowledge, agree and accept that they have read this disclaimer and agreed to bebound by it.
Disclaimer
1. H1 2017 - Highlights 2. H1 2017 - Financial Performance 4. Appendix3. Dividend distribution & outlook