Embed Size (px)
Citation preview

1 Thanyani A Maremba
Presentation to
“Seminar for innovative approaches to turn statistics into knowledge”
Using OLAP cubes as a method of information
delivery in Statistics South Africa household surveys
Thanyani Maremba
Statistics South Africa
Methodology and Evaluation
Cape Town
09 December 2010

2 Thanyani A Maremba
Overview
Introduction
Organisational problem
Proposed solution – Generic view of multi-dimensional data
– Creation of data marts
• Response mart;
• Slippage rate mart;
• Unemployment rate mart;
• Sample account mart and;
• In-coming and Out-going Quality
Implementation and results
Target audience
Potential areas of application
Future improvements
Conclusions
Acknowledgements
3 Thanyani A Maremba
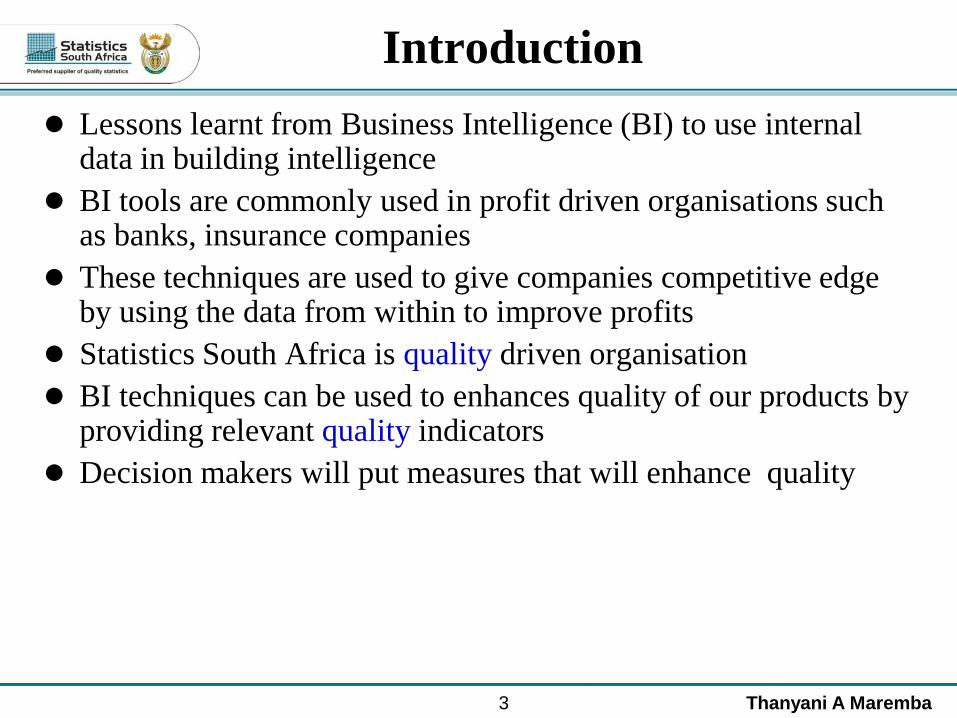
Introduction
Lessons learnt from Business Intelligence (BI) to use internal data in building intelligence
BI tools are commonly used in profit driven organisations such as banks, insurance companies
These techniques are used to give companies competitive edge by using the data from within to improve profits
Statistics South Africa is quality driven organisation
BI techniques can be used to enhances quality of our products by providing relevant quality indicators
Decision makers will put measures that will enhance quality

4 Thanyani A Maremba
Introduction (Cont)
We apply this principle in one of Stats SA survey that is Quarterly
Labour Force Survey (QLFS)
We identify data needs from the regular requests by the
management such as slippage rates, response rates, imputation
rates etc).
We create data marts from the series of surveys or by quarters in
the case of QLFS with specific topics such as slippage rates
The data marts are created with imbedded multi-dimensional
structures (they are updated by appending every new quarter' data)
To view this multi-dimensional data sets we implement the view
using Online Analytical Processing (OLAP).

5 Thanyani A Maremba
Organisational problem
Emphasis in Stats SA survey is on the publication targeted to
the public
Survey quality indicators such as response rates, slippage rates
as well as measures of precision are produced with particular
publication
The challenge is to study how surveys are performing
overtime
We currently do not have quality indicators available to share
with the relevant users in a single view for previous surveys

6 Thanyani A Maremba
Organisational problem (cont)
To meet the request for the required indicators overtime we generate adhoc reports using SAS to extract data from various sources on the server and tabulate it according to the request
The process of generating those reports is time consuming
Survey methodologists can save time spent in generating reports by implementing the proposed OLAP system

7 Thanyani A Maremba
Proposed solution
Generic view of multi-dimensional hierarchical data structure

8 Thanyani A Maremba
Proposed solution (cont)
Creation of data marts (cont)
– Response mart;
enonresponsresponse
responseRRUnweighted *100_
enonresponsresponsew
responsewRRWeighted
i
i*100_
9 Thanyani A Maremba
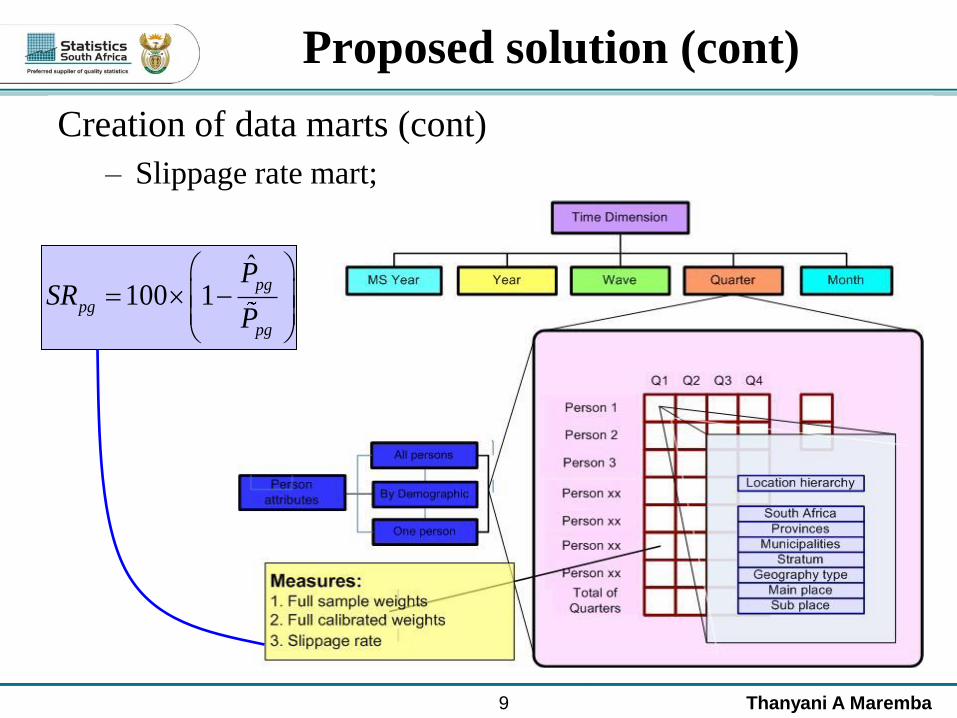
Proposed solution (cont)
Creation of data marts (cont)
– Slippage rate mart;
ˆ100 1
pg
pg
pg
PSR
P
10 Thanyani A Maremba
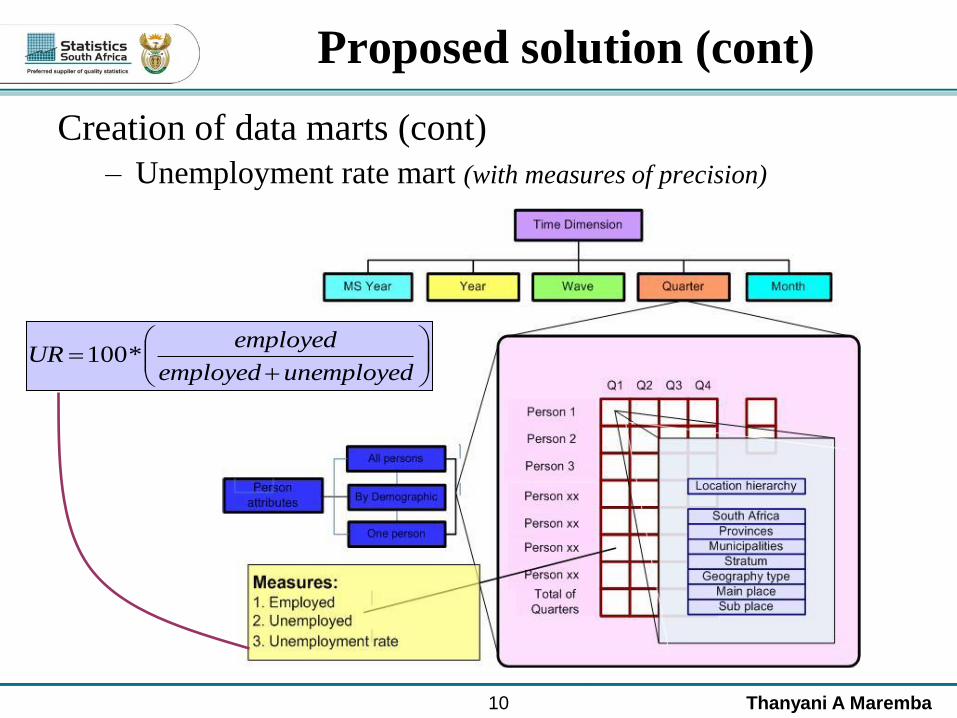
Proposed solution (cont)
Creation of data marts (cont)
– Unemployment rate mart (with measures of precision)
unemployedemployed
employedUR *100

11 Thanyani A Maremba
Proposed solution (cont)
Creation of data marts (cont)
– Sample account mart;
This is an Example of a
data mart which is not
presummarised

12 Thanyani A Maremba
Proposed solution (cont)
Creation of data marts (cont)
– In-coming and Out-going Quality
B
b
bb
B
b
bb
cw
dw
QualityIn
1
1100
B
b
bb
B
b
bb
cw
dw
QualityOut
1
1
1
100
B
b
b
B
b
b
N
n
RateonVerificati
1
1100

13 Thanyani A Maremba
Implementation and results
Creation of Cube: SAS OLAP Cube studio
– Cube designer wizard
– Viewing a cube in:
• SAS Enterprise guide
• MS Excel
• SAS Web OLAP Viewer for Java
• SAS Web OLAP Viewer for .NET

14 Thanyani A Maremba
Implementation and results (cont)
Cube creation: SAS OLAP Cube studio
– Naming and describing the cube

15 Thanyani A Maremba
Implementation and results (cont)
Cube creation: SAS OLAP Cube studio
– Selecting input dataset
16 Thanyani A Maremba
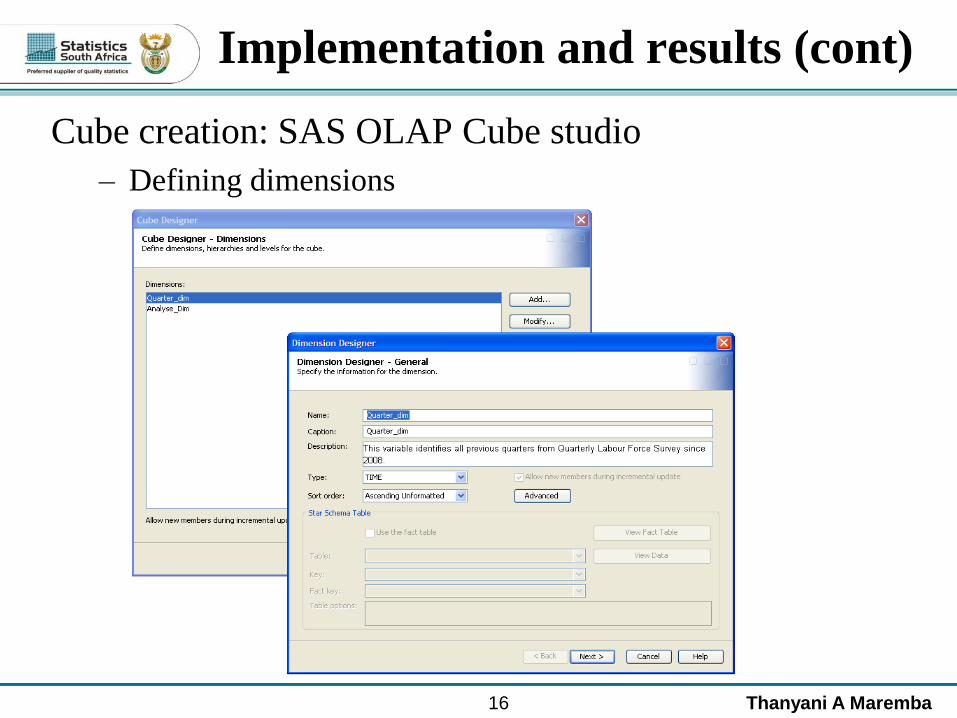
Implementation and results (cont)
Cube creation: SAS OLAP Cube studio
– Defining dimensions

17 Thanyani A Maremba
Implementation and results (cont)
Cube creation: SAS OLAP Cube studio
– Defining measures

18 Thanyani A Maremba
Implementation and results (cont)
Cube creation: SAS OLAP Cube studio
– Review the cube definition

19 Thanyani A Maremba
Implementation and results (cont)
Viewing cubes: SAS Enterprise Guide (Table form)
Editing and Imputation system: Source1 = 02
Weighting System: Source1 = 01
This table accounts for all persons records
through the above systems from Q1 2008 to date
Note: Actual figure not displayed due to
confidentiality

20 Thanyani A Maremba
Implementation and results (cont)
Viewing cubes: SAS Enterprise Guide (Graph form)
Editing and Imputation system: Source1 = 02
Weighting System: Source1 = 01
This graph accounts for all persons records
through the above systems from Q1 2008 to date

21 Thanyani A Maremba
Implementation and results (cont)
Viewing cubes: MS Excel (Table and Graph)
• This trend confirms that people with ages (15 to 34) are hard to count
• This is more prevalent with males than females
• This is not the findings of this data set only, it is knowledge gained from historical data
Note: Data for this cube was simulated due to confidentiality

22 Thanyani A Maremba
Implementation and results (cont)
Viewing cubes: MS Excel (Table and Graph)
• Based on the first three quarters of 2008 we observe the similar pattern
• There are several queries that can be done on the cube to reveal more patterns in the
underlying data set over time
Note: Data for this cube was simulated due to confidentiality

23 Thanyani A Maremba
Target audience
Methodologists and Survey Statisticians
Team leaders in surveys
Quality Assurers
Decision makers in head office and provinces

24 Thanyani A Maremba
Potential areas of application
Other household surveys
Business surveys
Corporate services
Data processing
Listing
Survey evaluation
Field operations
Census
Stats SA has other systems that provide regular reporting facility
and are used in survey areas for example, RTMS succeeded by
ITS, and other daily web reports from surveys
There is also electronic products section which deals with final
published data and preparing it to be used by external
stakeholders
In light of what we have we look at how OLAP system can be
used to analyse quality indicators for other areas in the
organisation and these areas are listed below.
25 Thanyani A Maremba
Future improvements
Interacting with the Geodatabase in reporting geography
dimensions.
Explore other methods of viewing multi-dimensional data.
To optimally use the technology we have in Stats SA.
To investigate more about doing analysis and reporting
efficiently

26 Thanyani A Maremba
Conclusions
We can simply turn statistical data into knowledge by simply
organising it in a multi dimensional structure
A cube can be viewed by multiple users without interfering
with the data
Third party option of using MS Excel to view cubes allows
non-SAS users to do independent analysis
The responsibility of educating users to analyse quality
indicators lies in the hand of the methodologists

27 Thanyani A Maremba
Acknowledgements
The organisers of the conference
The methodology team
ADAPT team

28 Thanyani A Maremba
Thank you