Embed Size (px)
Citation preview

Presentation to ECE Cabinet May 24, 2012
Darlene C. RagozzineDeb Flis
Margaret Gustafson
1
CT Charts-A-Course (CCAC)State Professional Development and Program Improvement System
C - CoordinatedC - Comprehensive
A - AccountableC - Collaboration

Passed in 2004 by the Higher Education and Employment Advancement Committee made CCAC … a state-wide coordinated child day care and early childhood education training system (A) for child day care centers, group day care homes and family day care homes that provide child day care services, and (B) that makes available to such providers and their staff, within available appropriations, scholarship assistance, career counseling and training, advancement in career ladders, as defined in section 1 of public act 03-142, through seamless articulation of levels of training, program accreditation support and other initiatives recommended by the Departments of Social Services, Education and Higher Education.
2
Public Act No. 04-212 AN ACT CONCERNING WORKFORCE
DEVELOPMENT
.

CONNECTICUT CHARTS-A-COURSE (CCAC)
Funded through the Department of Social Services (DSS) in collaboration with Connecticut State Colleges and Universities (ConnSCU) Board of Regents for Higher Education.
The goal of Connecticut Charts-A-Course (CCAC) is to help increase the quality of the early care and education workforce and the programs in which they work; by providing scholarships and access to training and higher education for staff at all levels, program accreditation support, and a career ladder specific to the field with articulated pathways toward degrees and credentials within higher education.
3
CONNECTICUT CHARTS-A-COURSEFunding Allocation: SFY 2010-2012
$2,645,687
Annually supports these major components:
Scholarship Assistance Program
Professional Registry
6 Regional Accreditation Facilitation Projects (AFP)
Training Program in Child Development (TPCD)
$TART Education Bonus Program
Program Leadership Education and Training
Career Counseling (English and Spanish)
4

EARLY CHILDHOOD PROFESSIONAL DEVELOPMENT AND PROGRAM IMPROVEMENT SYSTEM COMPONENTS
SYSTEMS COMPONENTS
5

OVERVIEW OF PROGRAM
6
Funding for Workforce
Scholarship Assistance Program
$TART Education Bonus
Program Accreditation Support
Core Professional Knowledge
Core Areas of Knowledge
Training
Program in
Child Development
Career Ladder
Qualifications and Credentials
Training Program in Child Development
(TPCD)
Pathways Exams
Program Leadership Education and
Training
Articulation Agreement
12 Credit Standardization
Quality Assurance
Early Childhood Professional Registry
Trainer & Training Approval Board
Quality Assurance System for Training
Train the Trainers
Head Teacher Approval for
Licensing
Program Compliance Reports
Access and Outreach
Workshops & Conferences
Training Partners
Higher Education Directory & Career
Guide
Toll Free & Web Career Counseling
Individual Education Plans
Resume Builder
NAEYC Program Calculator

ACCESS AND OUTREACHTraining Partners
7
NAEYC Program Accreditation
Early Learning Guidelines
Emergency Management Preparedness
Children with Disabilities
SERC/AFP
SERC/619B
Approved (TAB) Private Trainers
Two and Four Institutions of Higher Education
All Our Kin
Regional AFP Projects
Approved (TAB) Private Trainers
Regional AFP Projects Public and Private Center-based Programs
Infant-Toddler Center-based and Home-based
Public and Private
Center-based and Home-based
Public and Private
Center-based and Home-based
Public and Private
Public School Preschool

EARLY CHILDHOOD EDUCATION CABINET COMMITTEES
ECE Cabinet Committees
Data
Workforce and Program Improvement
Workforce
CKCs
Higher Education
RFPs
Early Learning Development
Standards
Curriculum
TQRIS
Co-Chair
8

PROFESSIONAL REGISTRY
Web-enable data management system tracks completed education and career ladder advancement of program staff, and monitors supply and demand of the publicly funded early childhood workforce in CT.
Currently mandated for publicly funded program staff. Current total enrollment 12,000( No Fee) represents approximately 53% of estimated 20,691 early care and education workforce in CT.
Provides comprehensive reports to state agencies partners, program directors and policy makers, and local communities for planning purposes.
www.ccacregistry.org9

PARTICIPANT RECORD LINKED TO EMPLOYER RECORD AND PROGRAM
Participant Reports, Resume
Builder Program Standards Compliance
Training Approval/ Access to
Curriculum
Scholarship Processing,
Lottery
Research and Reporting
Consultant Registry
Head Teacher Approval
NAEYC Candidacy
Calculator and Scheduler
TPCD Tracking
MedicationAdministrati
on
Birth to Three

11
2009N=7,160 2010
N=9,143 2011N=10,923
0
2,000
4,000
6,000
8,000
10,000
12,000
2,912 4,818 6,079
4,2484,325
4,844
REGISTRY RATE OF ENROLLMENT 52% of early childhood workforce
(20,691 estimated total)
Publicly Funded Partic-ipants
Non-Publicly Funded Partic-ipants

QUALIFICATIONS OF TEACHERS IN PUBLICLY FUNDED CENTERSComparison 2008-2012
12
Level on CC AC Career Ladder
1-6 % 7-8 % 9-10 % 11-15 % N=
Entry Level Mid -Level AS Degree BS Degree or +
December 2008 397 25%
296 19%
408 26% 492 31%
1,593
December 2009 308 18%
373 22%
409 24% 625 36%
1,715
December 2010 250 14%
340 20%
432 25% 702 41%
1,724
June 2011 228 13%
327 19%
430 26% 715 42%
1,705
May 2012 237 14%
281 16%
417 25% 757 45%
1,692
• Teachers with Bachelor’s Degrees continue to increase as a direct result of scholarship requests. The 45% is still short of the 2015 requirement.
• Percentage of teachers in publicly funded programs at or above the current state standard level 7 (CDA plus 12 ECE credits) increased from 76% in 2008 to 86% in 2012.
Source: CT Early Childhood Professional Registry

13
Workforce Compensation Summary Data
Prepared byCT Charts-A-
CourseRegistry Data
May 2012

TEACHER AVERAGE SALARYwww.ctcharts.org
14
Teacher TeacherNon Publicly Funded Publicly Funded
$-
$5,000.00
$10,000.00
$15,000.00
$20,000.00
$25,000.00
$30,000.00
$35,000.00 $27,467.00
$33,121.00
231 1171
Average Salary
# Reporting

SCHOLARSHIP ASSISTANCE PROGRAM
Provides funding for tuition, fees, and books to individuals :currently working in the field of early care and educationenrolled in the CCAC Registrymeet scholarship priorities and wish to increase their education, training, and credentials in
early childhood education
Scholarship lotteries conducted August 2010
and December 2011.
15

CAREER ADVISING FUNCTIONALITY
Four regionally assigned career advisors (one bilingual English/Spanish)
All scholarship requests (lottery) processed through the Registry. Each reviewed by a career advisor to validate the request is part of the individual’s planned program of study toward a degree and/or credential or professional development for licensing
www.ctcharts.org
http://ctearlychildhoodcareerdev.info
16

REPORTED IN RBA 2012SCHOLARSHIP FUNDING LEVEL $1,664,318
17
CDA Pathways Credit Associate Degree Bachelor degree or higher
0
100
200
300
400
500
600
700
152
44
413
238211 228
667
520
380
288
408 389
Distribution of Scholarship Funding
FY 2009N=847
FY 2010N=1,626
FY 2011N=1,465

DISTRIBUTION OF SCHOLARSHIP FUNDINGLOTTERY COMPARISON 2010-11
PROGRAM SETTING
18
Center Family Other$0
$100,000
$200,000
$300,000
$400,000
$500,000
$600,000
$700,000
281219.2
123159
1697
606471.279999995
54052.631472.99
Lottery 1 Lottery 2

DISTRIBUTION OF SCHOLARSHIP FUNDINGLOTTERY COMPARISON 2010-11
PROGRAM TYPE
19
Lottery 1 Lottery 20%
10%
20%
30%
40%
50%
60%
70%
80%
90%
16%
54%
84%
46%
Publicly Funded Programs Non Publicly Funded Programs
20
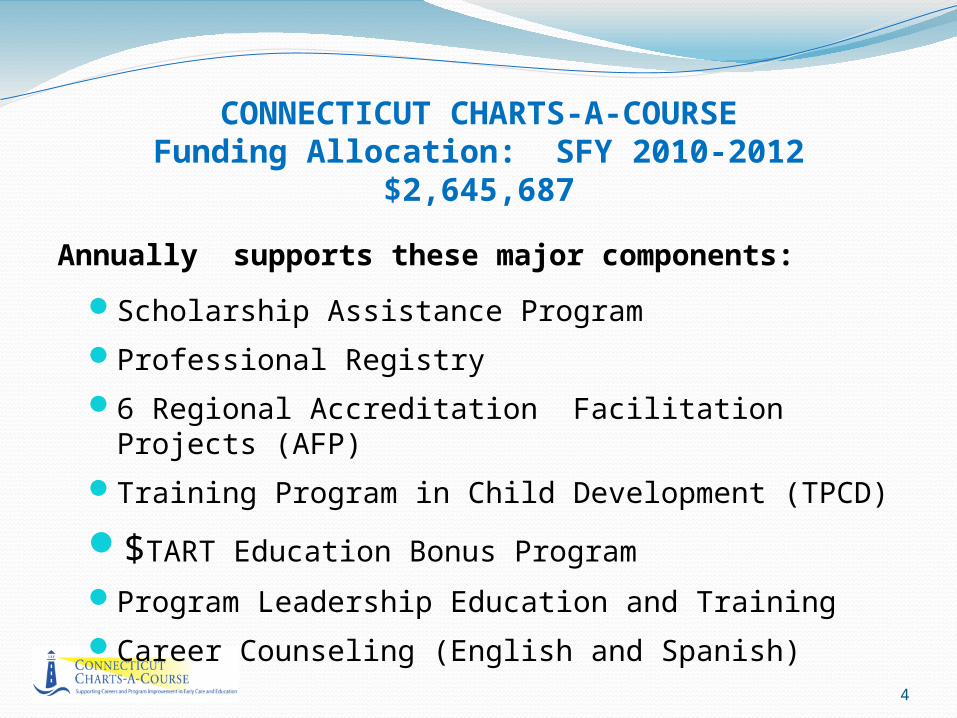
Lottery 1 Lottery 20
200
400
600
800
1000
1200
1400
711
1274
346305
534
754
APPLICANTS AND AWARDS
# Lottery Applicants # Individuals Awarded Scholarships# Scholarship Awards
Avg. Scholar-ship Award =
$720
Avg. Scholar-ship Award =
$1,127

21
College Credit Tuition/Fees Continuing Ed0%
20%
40%
60%
80%
100%
120%
88%
12%
98%
2%
SCHOLARSHIP AWARDS: TUITION/FEES vs CONTINUING EDUCATION
Lottery 1 Lottery 2

22
0
20
40
60
80
100
120
140
86
105
2026
5950
0
124
145
0
5867
37
SCHOLARSHIP AWARDS BY DEGREE GOAL
Lottery 1 Lottery 2
Credit-based Scholarships

REPORTED IN RBA 2012 TRAINING PROGRAM IN CHILD DEVELOPMENT
23
FY 0708N=146
FY 0809N=208
FY 0911N=143
0%
10%
20%
30%
40%
50%
60%
70%
43%
66% 69%
TPCD CDA Performance Rates
Performance Rate
* CDA data is current as of 11-1-2011

TRAINING PROGRAM IN CHILD DEVELOPMENT
Nationally approved entry level non-credit content toward Child Development Associate credential (CDA).
Program enhanced by $TART Education Bonus program: TPCD participants achieve financial awards for CDA completion as well as successful completion of Pathways Exams for college credit.
$TART continues to yield positive outcomes in completion rates.
Through 09-11 there were 164 participants:95% are assistant teachers in publicly funded programs143 completed the TPCD through Module IVTo date 69% of those who completed Module IV have obtained a
CDA credential and 55% of them have also taken the Pathways Exams.
24

PROGRAM LEADERSHIP INITIATIVEEDUCATION, TRAINING AND SUPPORT
Fully-funded credit-coursework and professional development opportunities for current leaders in CT programs for young children.
Core based on the five CT Director Credential competency areas: Administration and Supervision, Leadership, Finance, Personnel, and Families and Community.
Continued demand for credit-coursework attributed to (1) DPH regulation for child care center directors, (2) NAEYC Accreditation education requirements, (3) leadership turnover, and (4) awareness of the need for specialized education.
FY 2011 participants: 74% reported never having taken this course content prior to that point in their careers; 67% had a baccalaureate degree or higher, with an additional 23% having already earned an associate’s degree. All participants previously had classroom teaching experience.
Offerings fill the gap between early childhood teacher preparation degree programs and leadership role content needs.
25

PROGRAM LEADERSHIP INITIATIVETOTAL STUDENTS BY COMPETENCY AREA THRU FY11
26
Thru FY08 Thru FY09 Thru FY10 Thru FY110
200
400
600
800
1000
1200
398 434 455560
7191 103
138
69
113132
176
10
3454
95
18
54
Personnel
Family and Community Involvement in Early Childhood Programs
Finance in Programs for Young Children
Leadership in Programs for Young Children
Administration and Su-pervision

PROGRAM LEADERSHIP INITIATIVETOTAL STUDENT PROGRESS IN TOTAL
THRU FY11 FOR ALL CLASSES
27
Thru FY09 Thru FY10 Thru FY110
200
400
600
800
1000
1200
672 762
1023
Number of Students Completing CCAC Program Leadership Courses

ACCREDITATION FACILITATION PROJECTSTATEWIDE PROGRAM IMPROVEMENT SUPPORTVIA OFFICE +6 REGIONAL FACILITATION OFFICES
North Central: HAEYC (Sandy Fowler & Wendy McGrath)South Central: Gateway ( Carol Annette)South East: LEARN (Michele Pearson)North East: EASTCONN (Debra Stipe)Northwest: Education Connection (Kristen Kennen)Southwest: Education Connection (Donna Delohery)
28

NAEYC PROGRAM ACCREDITATION
29
CT in ranked third in the country for most NAEYC Accredited centers behind California and Massachusetts and first in per capita state.

30
20092010
2011
390
400
410
420
430
440
450
460
435
413
454
NUMBER OF NAEYC-ACCREDITED PROGRAMS IN CT

ACCESS AND OUTREACH RESOURCES AND TOOLS
Pilot project between NAEYC and CCAC Accreditation Facilitation Project
“ Program Calculator and Classroom Scheduler” as Registry tool to manage verified information needed for the reporting of staff qualifications to NAEYC as part of program accreditation
Streamlines the documentation process for both the program and NAEYC; provides more robust data for CT
Registry becomes a resource and planning tool for program improvement
Provides a web-enabled tool to help programs establish readiness for accreditation in the area of staff qualifications.
Here’s how it works…
31