Embed Size (px)
Citation preview

Managing the Balance Sheet under Solvency II Anton Wouters, Head of LDI & FM
October 2011

2
Agenda
● Solvency II in a nutshell
● BNPP IP Approach: Asset allocation optimization under Solvency 2 framework
● Managing the risk in the return portfolio
● Conclusion

3
Solvency II in a nutshell
4 4
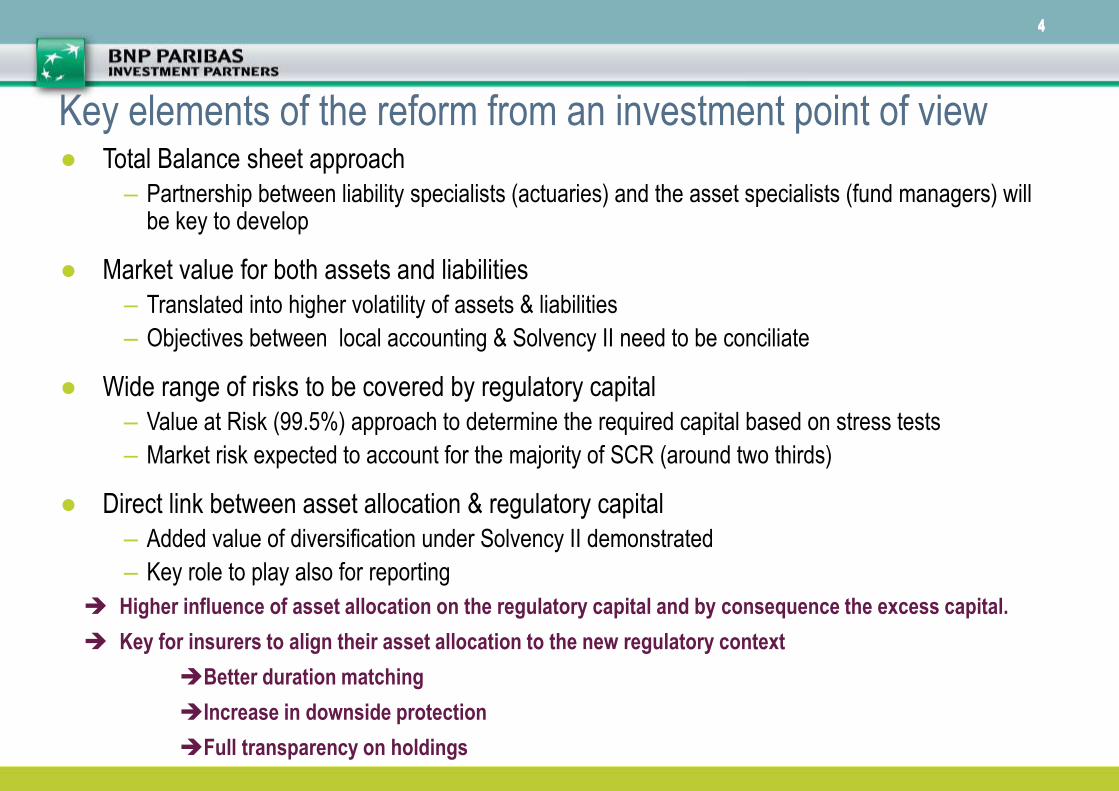
● Total Balance sheet approach
– Partnership between liability specialists (actuaries) and the asset specialists (fund managers) will be key to develop
● Market value for both assets and liabilities
– Translated into higher volatility of assets & liabilities
– Objectives between local accounting & Solvency II need to be conciliate
● Wide range of risks to be covered by regulatory capital
– Value at Risk (99.5%) approach to determine the required capital based on stress tests
– Market risk expected to account for the majority of SCR (around two thirds)
● Direct link between asset allocation & regulatory capital
– Added value of diversification under Solvency II demonstrated
– Key role to play also for reporting
Key elements of the reform from an investment point of view
Higher influence of asset allocation on the regulatory capital and by consequence the excess capital.
Key for insurers to align their asset allocation to the new regulatory context
Better duration matching
Increase in downside protection
Full transparency on holdings

5
BNPP IP approach: Asset Allocation Optimization under Solvency 2
framework

6
1. Understand the client specific situation
2. Split the existing portfolio in two parts:
- A portfolio hedging/matching the liabilities
- A return portfolio facing the surplus
3. Optimize the hedging/matching portfolio to minimize the capital requirement
4. Optimize the return portfolio based on an accounting objective
5. Manage dynamically the risk of the return portfolio based on a prudential objective
An approach based on 5 steps

7
Optimization of the hedging/matching portfolio
Technical
provisions
Best
Estimate
Risk Margin
SCR Su
rplu
s
Assets facing
technical
provisions:
Hedging
Portfolio
Assets facing
Surplus:
Return Portfolio
“Excess capital”
● The objective is to get a liability hedging portfolio matching the sensitivities of the liability structure/stream based on the Solvency II valuation methodology
● Compared to Solvency I portfolio, this will require:
Investments in swaps to better match the sensitivities of the liabilities
Investments in credits to replicate the illiquidity premium of the liabilities
● When liabilities contain optionality from profit sharing policy, need to carry out ad hoc study to determine what is hedgeable through options/swaptions, and what are the costs related to the hedge-program
This step requires a detailed understanding of the liability structure
Minimize capital requirement from
matching portfolio to reserve
regulatory capital for return
portfolio
Solvency II

8
Optimization of the hedging portfolio under Solvency II
Return
Portfolio
Optimized Matching
Portfolio with
minimized
regulatory capital
requirement
Assets Liabilities
Total: 100
Liabilities (policies): 1110 Basic Reserve: 1010
Profit Sharing Option: 100
Profit Sharing Option: 100
Swap*: 0
Surplus: 100 Excess C:46
Regulatory C: 54
To match the sensibilities of the liabilities, the matching portfolio will invest in
swaps and options to free the regulatory capital requirement for the return portfolio
*The value of a swap equal 0 when you enter into such OTC contract. Then the value will evolve based on the mark to market
Equities Global, EM, SmCap
Fixed Income Gov, Inv Grd, HY, EMD
Fixed Income : 1000 Long duration, credit

9 9
Return portfolio: the attractiveness of the different asset classes
● Solvency II SCR is somewhat consistent with a VAR (99.5) based on historical data’s – Using one or the other metric gives broadly comparable results
● Nevertheless, ranking the different asset classes can not be done solely based on a risk measure (SCR or VAR) but by comparing their expected return with their capital charge – Choice of expected return is key
Impact of expected excess returns in evaluating the attractiveness of asset classes can be high
Black and white conclusions on asset classes attractiveness under S2 have to be mitigated
Especially at the level of the entire portfolio
Blue bar: excess return based on
historical return
Pink bar: excess return based on
expected return from our “smart
benchmark”

10
Manage dynamically the risk of the return portfolio to protect the initial excess capital
● The surplus (SCR + excess capital) strategic asset allocation is based on a medium term
horizon. As a consequence, such allocation is not protected against short term market
fluctuations and their negative impact on the excess capital.
This raises prudency or solvency concerns (decreasing excess capital)
● Our solution is to manage dynamically the risk of the return portfolio to take into account a
prudential indicator i.e. the initial level of excess capital .
● Such approach is the optimal response to meet short term regulatory constraints (maintain a
large excess capital at each moment) while building a return portfolio able to meet long term
shareholders return requirement.
● Such statement of dynamic allocation has been promoted by the Edhec research in the
context of a chair sponsored by BNPP IP regarding the pension fund industry.

11
Managing the risk in the return portfolio
11 | 28/11/2011 |

12
Assumption for the allocation of the return portfolio *
Underlying Currency Exposure
Euro Zone Government Bonds EUR 10.0%
EMU Inflation Linked Bonds EUR 5.0%
Global Bonds ex EMU EUR 5.0%
Euro zone Corporate Investment
Grade Bonds EUR 15.0%
US high yield bonds USD 10.0%
Total Fixed Income 45%
MSCI US USD 15.0%
MSCI Europe EUR 25.0%
MSCI Japan JPY 5.0%
Total Equities 45%
Europe real estate EUR 5.0%
Global Commodities USD 5.0%
Others 10%
● Portfolio currency: Euro
● Currency risk: covered
● 1 day lag for implementation
* Portfolio doesn’t represent a typical Insurers investment portfolio. For illustration purposes only.
12 | 28/11/2011 |

13 13
Strategies to meet the prudential objective Different ways to protect the excess capital
Ex ante
protection
Ex Post
protection
Strategy
Option strategies (consisting
in buying puts and selling
calls with low/zero net
premium
Dynamic risk management
consisting in adjusting the risk of
the portfolio in order to protect
the excess capital
Advantages/Disadvantages
Initial SCR saving (e.g. of 50% in case of a portfolio made of 100% equity and a put of 80%)
Reduction of max drawdown for surplus and excess capital
Opportunity costs due to loss of upside linked to the sale of the call
A way to turn equity more solvency II friendly
No initial SCR saving
Protection of the excess capital
Reduction of max drawdown for surplus
Opportunity costs due to lower participation to upside
Such protection mechanisms constitute optimal solutions to meet short term regulatory constraints while
building a return portfolio enabling to meet long term shareholders return requirement
14
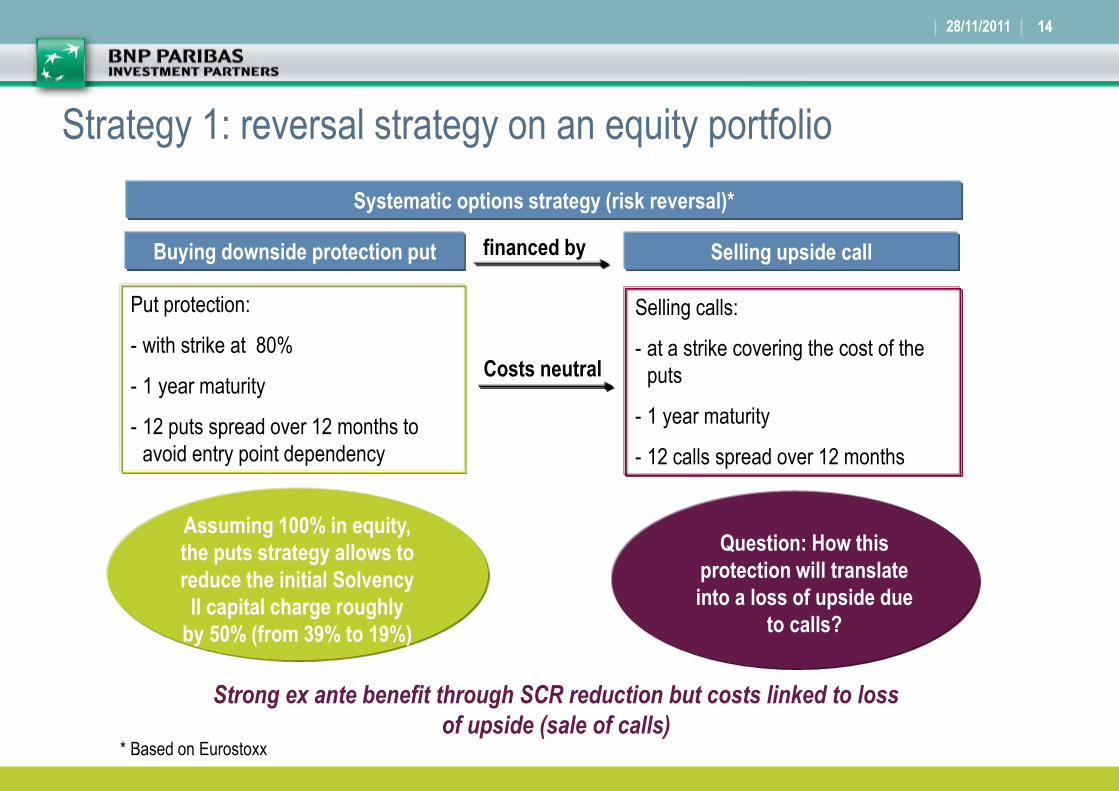
Strategy 1: reversal strategy on an equity portfolio
14 | 28/11/2011 |
Systematic options strategy (risk reversal)*
Buying downside protection put Selling upside call financed by
Put protection:
- with strike at 80%
- 1 year maturity
- 12 puts spread over 12 months to
avoid entry point dependency
Selling calls:
- at a strike covering the cost of the
puts
- 1 year maturity
- 12 calls spread over 12 months
Costs neutral
Assuming 100% in equity,
the puts strategy allows to
reduce the initial Solvency
II capital charge roughly
by 50% (from 39% to 19%)
Question: How this
protection will translate
into a loss of upside due
to calls?
Strong ex ante benefit through SCR reduction but costs linked to loss
of upside (sale of calls) * Based on Eurostoxx
15
0
20
40
60
80
100
120
140
160
2001 2002 2003 2004 2005 2006 2007 2008 2009 2010 2011
Surplus.of.static.allocationSurplus.of.static.allocation.with.risk.reversalFree.capital.of.static.allocationFree.capital.of.static.allocation.with.risk.reversal
0.0%
5.0%
10.0%
15.0%
20.0%
25.0%
30.0%
35.0%
40.0%
45.0%
2001 2002 2003 2004 2005 2006 2007 2008 2009 2010 2011
SCR of static allocationwith risk reversalSCR of static allocation
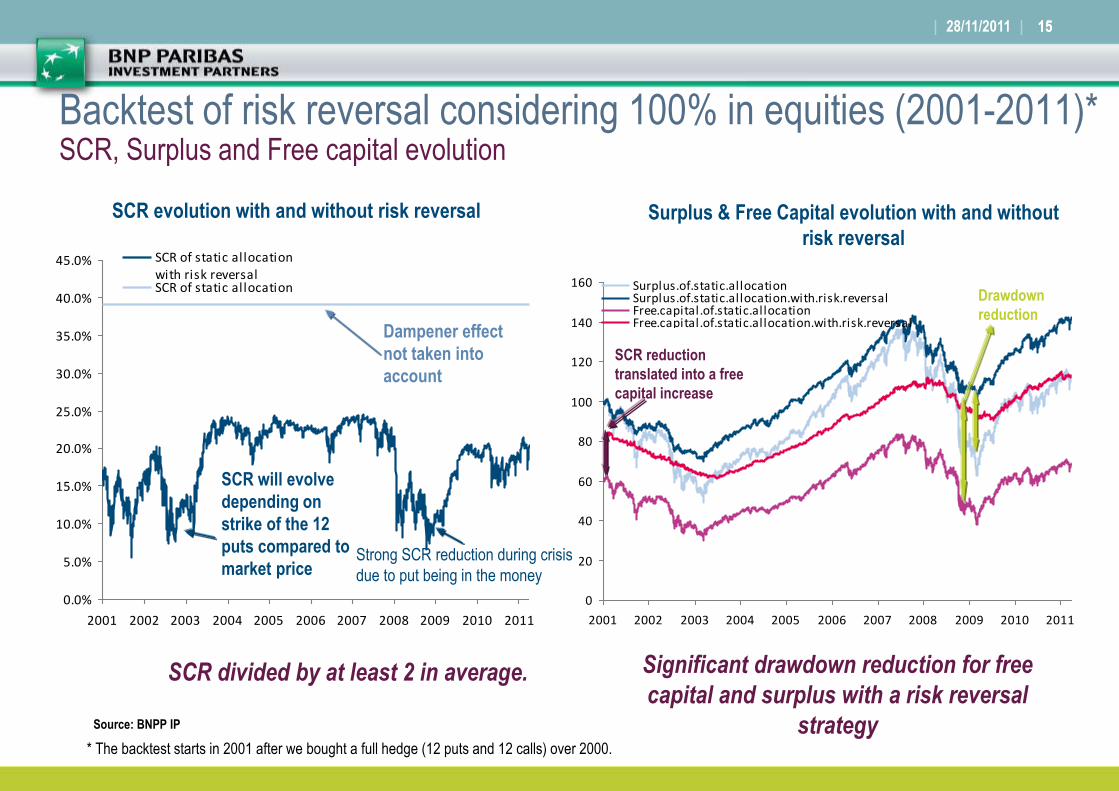
Backtest of risk reversal considering 100% in equities (2001-2011)* SCR, Surplus and Free capital evolution
15 | 28/11/2011 |
* The backtest starts in 2001 after we bought a full hedge (12 puts and 12 calls) over 2000.
SCR divided by at least 2 in average.
Dampener effect
not taken into
account
SCR will evolve
depending on
strike of the 12
puts compared to
market price
SCR evolution with and without risk reversal Surplus & Free Capital evolution with and without
risk reversal
Source: BNPP IP
SCR reduction
translated into a free
capital increase
Drawdown
reduction
Significant drawdown reduction for free
capital and surplus with a risk reversal
strategy
Strong SCR reduction during crisis
due to put being in the money

16 16
● Allocation of the surplus to risky assets is adjusted to protect the initial level of free capital (which is not ensured through a risk reversal strategy)
● The algorithm consists in:
defining the level of initial free capital to protect
de-risking the portfolio based on development of the free capital
increasing the level of free capital to be protected when surplus reached the highest NAV (ratchet)
● Deleveraging optimized by deleveraging the assets with the largest contributions to the SCR
● To avoid too much trading, we define a trading range above the free capital:
the trading range is defined based on the cushion between the surplus and the free capital to be protected
when the cushion is below 100% of the SCR, we de-risk
when the cushion is above 122.5% of the SCR, we increase the risk
● Daily risk monitoring
Strategy 2: Dynamic Risk Management overlay
| 28/11/2011 |

17
0.00%
20.00%
40.00%
60.00%
80.00%
100.00%
120.00%
140.00%
160.00%
180.00%
2001 2002 2003 2004 2005 2006 2007 2008 2009 2010 2011
Surplus of flexible allocation
Surplus of static allocation
Free capital of flexible allocation
Free capital of static allocation
Guarantee
0%
5%
10%
15%
20%
25%
30%
2001 2002 2003 2004 2005 2006 2007 2008 2009 2010 2011
SCR of the static allocation
SCR of flexible allocation
Backtest for risk overlay based on diversified allocation (2001-2011) SCR, Surplus and Free capital evolution
17 | 28/11/2011 |
SCR evolution without and with a risk overlay Evolution of surplus and free capital without and
with a risk overlay
SCR will evolve
depending on the
NAV & weight of
risky assets in
the allocation
Dampener effect not
taken into account
SCR reduction of 22% in average due to
NAV reduction but no upfront SCR saving
as it’s the case with a risk reversal
Strong Protection of free capital and
reduction of drawdown for surplus
Free
capital
protection
Drawdown reduction
for surplus
Source: BNPP IP
No initial SCR saving
and free capital
improvement as with
risk reversal
18
0%
5%
10%
15%
20%
25%
30%
2001 2002 2003 2004 2005 2006 2007 2008 2009 2010 2011
SCR of the static allocation
SCR of the static allocation with risk reversalSCR of flexible allocation
SCR of flexible allocation with risk reversal
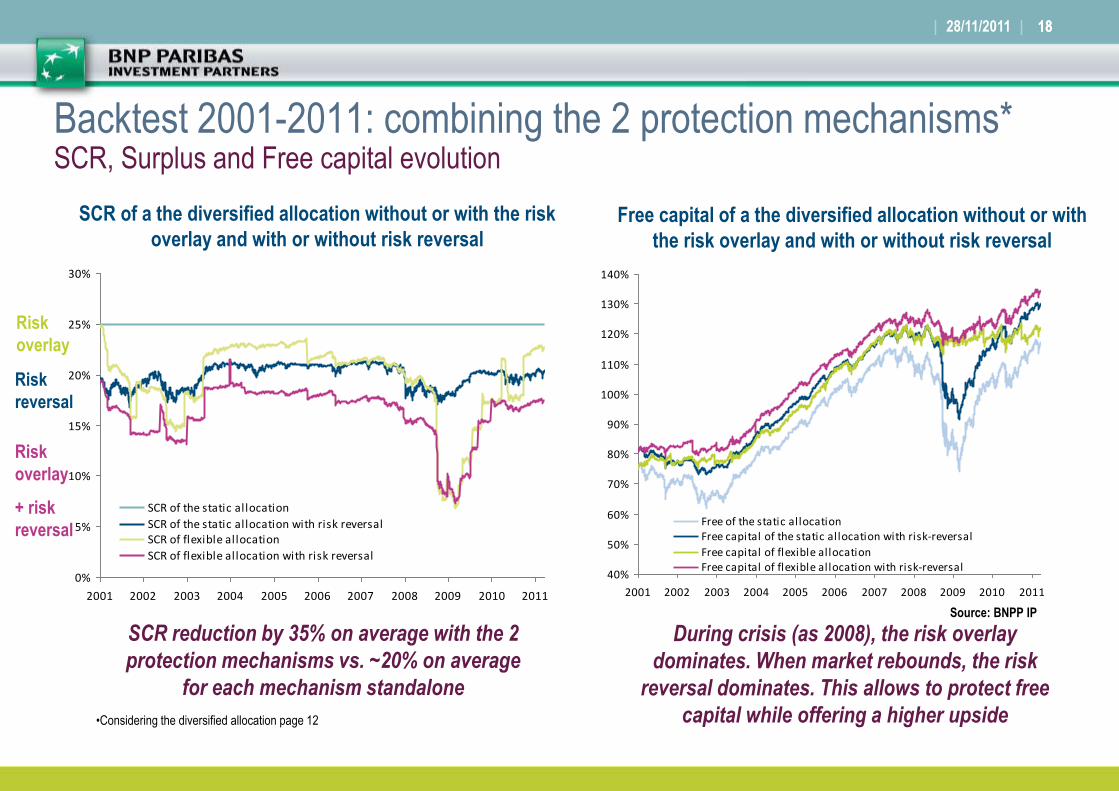
Backtest 2001-2011: combining the 2 protection mechanisms* SCR, Surplus and Free capital evolution
18 | 28/11/2011 |
SCR of a the diversified allocation without or with the risk
overlay and with or without risk reversal Free capital of a the diversified allocation without or with
the risk overlay and with or without risk reversal
•Considering the diversified allocation page 12
Risk
reversal
Risk
overlay
Risk
overlay
+ risk
reversal
SCR reduction by 35% on average with the 2
protection mechanisms vs. ~20% on average
for each mechanism standalone
During crisis (as 2008), the risk overlay
dominates. When market rebounds, the risk
reversal dominates. This allows to protect free
capital while offering a higher upside
Source: BNPP IP
40%
50%
60%
70%
80%
90%
100%
110%
120%
130%
140%
2001 2002 2003 2004 2005 2006 2007 2008 2009 2010 2011
Free of the static allocationFree capital of the static allocation with risk-reversal
Free capital of flexible allocationFree capital of flexible allocation with risk-reversal

19
Strong added value of combining the two protection mechanisms
● Clear benefit of the risk reversal and the risk overlay on the portfolio over the last 10 years
– Reduction of the initial SCR thanks to the risk reversal
– Clear protection of the free capital thanks to the risk overlay (when the puts of the risk reversal are
not yet at or in the money ) translated into a reduction of maximum drawdown of free capital
– Increase of initial and final free capital
– Significant reduction of the maximum drawdown of the surplus and reduction of average SCR thanks
to the two protection mechanisms
– Strong volatility reduction and excess return increase
● Over the last decade, the backtest is very appealing. That’s why we have adjusted the
peculiarities of this decade by introducing a cost linked to the upside loss in good market
circumstances. Despite such adjustment, this solution with two protection mechanisms stays
very interesting from a risk reward prospective
19 | 28/11/2011 |

20
Conclusion

21
Conclusion ● The objective of this analysis was to demonstrate the benefit of different protection
mechanisms for the investment portfolio based on a number of assumptions/parameters
● These protection mechanisms are being constructed as overlays:
– existing portfolio’s will not be effected
– are tailor-made to the requirement of the client (protection levels, risk monitoring frequency)
– have successfully been implemented
● In constructing portfolios
– Provide transparency (in products, solutions and reporting)
– Think top/ down
– Avoiding all risky assets could be too simplistic
– Provide solutions in the spirit of the regulation : protect capital in worse case scenarios while
creating value for insurance companies’ stakeholders
21 | 28/11/2011 |

22
Disclaimer This material is issued and has been prepared by BNP Paribas Asset Management S.A.S. (BNPP AM)* a member of BNP Paribas Investment Partners (BNPP IP)**.
This material is produced for information purposes only and does not constitute:an offer to buy nor a solicitation to sell, nor shall it form the basis of or be relied upon in connection with any contract or commitment
whatsoever or any investment advice .
This material makes reference to certain financial instruments (the “Financial Instrument(s)”) authorised and regulated in its/their jurisdiction(s) of incorporation.
No action has been taken which would permit the public offering of the Financial Instrument(s) in any other jurisdiction, except as indicated in the most recent prospectus, offering document or any other information material,
as applicable, of the relevant Financial Instrument(s) where such action would be required, in particular, in the United States, to US persons (as such term is defined in Regulation S of the United States Securities Act of
1933). Prior to any subscription in a country in which such Financial Instrument(s) is/are registered, investors should verify any legal constraints or restrictions there may be in connection with the subscription, purchase,
possession or sale of the Financial Instrument(s).
Investors considering subscribing for the Financial Instrument(s) should read carefully the most recent prospectus, offering document or other information material and consult the Financial Instrument(s)’ most recent
financial reports. The prospectus, offering document or other information of the Financial Instrument(s) are available from your local BNPP IP correspondents, if any, or from the entities marketing the Financial Instrument(s).
Opinions included in this material constitute the judgment of BNPP AM at the time specified and may be subject to change without notice. BNPP AM is not obliged to update or alter the information or opinions contained
within this material. Investors should consult their own legal and tax advisors in respect of legal, accounting, domicile and tax advice prior to investing in the Financial Instrument(s) in order to make an independent
determination of the suitability and consequences of an investment therein, if permitted. Please note that different types of investments, if contained within this material, involve varying degrees of risk and there can be no
assurance that any specific investment may either be suitable, appropriate or profitable for a client or prospective client’s investment portfolio.
Given the economic and market risks, there can be no assurance that the Financial Instrument(s) will achieve its/their investment objectives. Returns may be affected by, amongst other things, investment strategies or
objectives of the Financial Instrument(s) and material market and economic conditions, including interest rates, market terms and general market conditions. The different strategies applied to the Financial Instruments may
have a significant effect on the results portrayed in this material. Past performance is not a guide to future performance and the value of the investments in Financial Instrument(s) may go down as well as up. Investors may
not get back the amount they originally invested.
The performance data, as applicable, reflected in this material, do not take into account the commissions, costs incurred on the issue and redemption and taxes.
*BNPP AM is an investment manager registered with the “Autorité des marchés financiers” in France under number 96-02, a simplified joint stock company with a capital of 64,931,168 euros with its registered office at 1,
boulevard Haussmann 75009 Paris, France, RCS Paris 319 378 832. www.bnpparibas-am.com.]
** “BNP Paribas Investment Partners” is the global brand name of the BNP Paribas group’s asset management services. The individual asset management entities within BNP Paribas Investment Partners if specified
herein, are specified for information only and do not necessarily carry on business in your jurisdiction. For further information, please contact your locally licensed Investment Partner.
22 | 04/04/2011 |