Embed Size (px)
Citation preview

PRESENTATION SLIDES
Dash for Cash: Monthly Market Impact of Institutional Liquidity Needs*
Erkko Etula, Goldman, Sachs & Co.Kalle Rinne, Luxembourg School of FinanceMatti Suominen, Aalto University School of BusinessLauri Vaittinen, Mandatum Life
Disclaimer:The views expressed in this paper are those of the authors and do not reflect the positions of Goldman, Sachs & Co or Mandatum Life.
*Paper is forthcoming in the Review of Financial Studies

Results in a nutshell• We document a strong market level return reversal four days before month
end at T-4 (in stocks and bonds), the last day of the month which guarantees cash for month-end distributions (e.g. pension payments)
• Evidence that links these return reversals to institutions’ month end cash needs and institutions’ trading
• Historically, institutions may have lost 30bn a year due to bad timing of their month end liquidity related trades
• Return reversals around T-4 have become stronger over time with the growth of institutional asset management industry and are stronger in countries with larger mutual fund industry
• The strength of the reversals around T-4 are related to availability of funding liquidity to hedge funds and affect mutual fund alphas

Outline
• Introduction • Direct evidence from institutions’ role• Indirect evidence from institutions’ role• Other results • Mutual fund alphas• Conclusions

Turn-of-the-month effect: Excess stock returns
0,01
0,1
1
10
100
1000
1926
1929
1932
1935
1938
1941
1944
1947
1950
1953
1956
1959
1962
1965
1968
1971
1974
1977
1980
1983
1986
1989
1992
1995
1998
2001
2004
2007
2010
2013
From T-3 to T+3
On other days
Historically all returns in the US stock market have accrued during just seven days around the turn of the month T. Why?

Turn-of-the-month effect: Excess stock returns
0,01
0,1
1
10
100
100019
2619
2919
3219
3519
3819
4119
4419
4719
5019
5319
5619
5919
6219
6519
6819
7119
7419
7719
8019
8319
8619
8919
9219
9519
9820
0120
0420
0720
1020
13
From T-3 to T+3From T-8 to T-4From T+4 to T+8On other days
High returns at month end and beginning of the month are preceded by extremely poor returns from T-8 to T-4. Why?

Similar effects all around the world: Annualized returns around the turn of the month international evidence

Daily returns around the turn of the month
-0,2%
-0,1%
0,0%
0,1%
0,2%
0,3%
-9 -8 -7 -6 -5 -4 -3 -2 -1 0 1 2 3 4 5 6 7 8 9 10
Daily returns of CRSP VW index (1926-1986)
Ariel (1987) and Lakonishok and Smidt (1988) were first to find that stock market (index) returns are high around turn-of-the-month, from the last day of the month (T=0) to the third day of the month.

Daily returns around the turn of the monthUsing more recent sample, McConnell and Xu (2008) found that market returns are also abnormally high on three days before turn-of-the-month period.
-0,2%
-0,1%
0,0%
0,1%
0,2%
0,3%
-9 -8 -7 -6 -5 -4 -3 -2 -1 0 1 2 3 4 5 6 7 8 9 10
Daily returns of CRSP VW index (1987-2013)

Similar patterns in bonds
Yields of constant maturity Treasury bonds
-3
-2
-1
0
1
2
3
4
T-9
T-8
T-7
T-6
T-5
T-4
T-3
T-2
T-1 T
T+1
T+2
T+3
T+4
T+5
T+6
T+7
T+8
T+9
T+10
basi
s poi
nts
10-year Treasury Note
3-year Treasury Note
52-week Treasury Bill
In addition to dividend yields, we find also bond yields peak few days prior to month end, leading to high bond returns at month-end and beginning of month.

Monthly payment cycle
• The origin of these turn of the month return patterns, we believe, lies in the monthly payment cycle, see also Ogden (1990)
• A disproportionate share of monthly payments takes place precisely at the turn of the month
0%
10%
20%
30%
40%
50%
T-9
T-8
T-7
T-6
T-5
T-4
T-3
T-2
T-1 T
T+1
T+2
T+3
T+4
T+5
T+6
T+7
T+8
T+9
T+10
Month-end liquidity needs: pension payment dates
The figure is very similar for example for corporate dividends

More evidence on importance of month end payment cycle: Bank deposits around the turn of the month
-6,0%
-3,0%
0,0%
3,0%
6,0%
9,0%
T-9
T-8
T-7
T-6
T-5
T-4
T-3
T-2
T-1 T
T+1
T+2
T+3
T+4
T+5
T+6
T+7
T+8
T+9
T+10
A. Checkable depositsB. Saving deposits
-3,0%
-2,0%
-1,0%
0,0%
1,0%
2,0%
T-9
T-8
T-7
T-6
T-5
T-4
T-3
T-2
T-1 T
T+1
T+2
T+3
T+4
T+5
T+6
T+7
T+8
T+9
T+10
B. Saving deposits

Monthly payment cycle (our explanation to observed return patterns)• The month end payment cycle for pension funds (and
other institutions with month end cash cycle) implies
• At T-4 or earlier:– Pension funds and other institutions liquidate part of
their stock holdings to guarantee cash at the end of month
• At T+1 or later:– The recipients of cash payments re-invest part of cash
(as previously argued in Ogden, 1990)
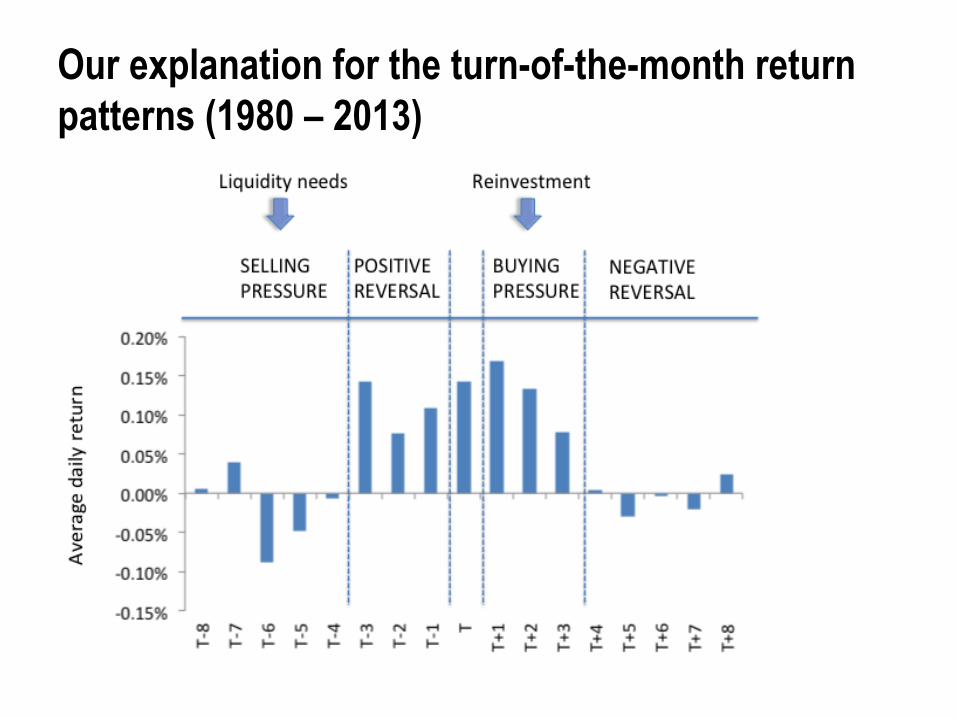
Our explanation for the turn-of-the-month return patterns (1980 – 2013).

First prediction: We expect return reversals around T-4 and T+3. In US the reversals are high especially after July 1995, the start of the 3-day settlement convention
CountrySamplestarts
Correlation of
T-8 to T-4 and T-3 to T-
1 returns
Correlation of
T to T+3 and T+4 to T+8
returns
Daily return auto-
correlation
Weekly return auto-
correlation
US, CRSP VW Index Jul-95 -0.39 -0.06 -0.04 -0.06US, CRSP VW Index Jan-80 -0.32 -0.03 0.01 -0.02
Other industrialized countries(average)
-0.24 -0.12 0.03 -0.02
Correlation of T-8 to T-4 and T-3 to T-1 returns is negative in all countries and significant in 22 countries out of 25
Correlation of T to T+3 and T+4 to T+8 returns is significantly negative in 12 countries out of 25 and insignificant in other countries

Placebo test for 5d/3d correlation
-0,5
-0,4
-0,3
-0,2
-0,1
0
0,1
0,2
T-9 T-8 T-7 T-6 T-5 T-4 T-3 T-2 T-1 T T+1 T+2 T+3 T+4 T+5 T+6 T+7 T+8 T+9 T+10
The 5d past return and 3d forward return correlation is most negativearound T-4. This implies that short-term market price pressure is highestaround T-4, consistent with our month end liquidity need hypothesis.

Second prediction: In our international sample in 2014 several countries changed simultaneously to T-2 settlement. In those countries correlation of T-3 and T-2 returns became more negative compared to other countries
Third prediction: Reversals at T-4 are larger if last day of the month is Friday (as then cycles for pension and salary payments coinside). We find support for this prediction as well.

Related literature• Turn-of-the-month literature, see e.g. Ariel (1987) and
Lakonishok and Smidt (1988), Ogden (1990)
• Literature on short-term reversals associated with costsof immediacy, see e.g. Grossman and Miller (1988) andCampbell, Grossman and Wang (1993)
• Our contributions: • Link the two literatures• Show reversals in market return around T-4 (and T+3)• Link the end of the month reversals and returns to
institutional trading

Outline
• Introduction • Direct evidence from institutions’ role• Indirect evidence from institutions’ role• Other results• Mutual fund alphas• Conclusions

Direct evidence from a subset of the market: Institutions buy ratios around the turn of the month (ANcerno sample)
-4,0%
-3,0%
-2,0%
-1,0%
0,0%
1,0%
2,0%
3,0%
** *** *** *** * *** *** ** ** ***
T-9 T-8 T-7 T-6 T-5 T-4 T-3 10H
T-3 11H
T-3 12H
T-3 13H
T-3 14H
T-3 15H
T-3 16H
T-2 T-1 T T+1 T+2 T+3 T+4 T+5 T+6 T+7 T+8 T+9 T+10
Ancerno institutions’ highest selling at T-4 and morning of T-3. These are the two times when we expect highest selling. Institutions with payments at T (T+1) must sell at T-4 (T-3) to get liquidity for the payments.

Systematic patterns in institutions’ trading
-0,0015%
-0,0010%
-0,0005%
0,0000%
0,0005%
0,0010%
0,0015%
-10 -9 -8 -7 -6 -5 -4 -3 -2 -1 0 1 2 3 4 5 6 7 8 9 10
Identify as “liquidity demanders” those of Ancerno institutions that in the previous year were statistically significant sellers on days T-5 to T-3
Liquidity demanders
Others
Liquidity demanders sell systematically at T-4 and T-3 year after year. Same institutions buy at the beginning of the month.
Sign
ed a
bnor
mal
vol
ume
as %
of m
arke
t vol
ume

Institutions’ trade imbalance and returns from T-3 to T-1This table shows the results from a regression in which the US equity market indexreturns from T-3 to T-1 are regressed on the T-8 to T-4 returns to the same index, andon the Ancerno institutional investors’ cumulative net selling from T-5 to T-4.Sample from January 1999 to December 2013.
y = returns T-3 to T-1
Market return T-8 to T-4 -0.352 -0.344(-2.51) (-2.71)
Institutional investors’ 117.25 111.09
selling T-5 to T-4 (2.53) (3.49)
Intercept 0.003 0.000 -0.001(2.39) (-0.09) (-0.52)
R2 0.184 0.084 0.259

Outline
• Introduction • Direct evidence from institutions’ role• Indirect evidence from institutions’ role• Other results on reversals• Mutual fund alphas• Conclusions

The effect of mutual fund holdings on the turn of the month patternsThis figure shows value- and equal-weighted returns from T-8 until T-4 in deciles of stocks sorted by our estimates ofthe mutual funds’ total ownership percentages of stocks in the previous month. Our sample consists of all CRSP stocksowned by at least one mutual fund (in Thomson Reuters Mutual Fund Holdings database). Sample period is fromJanuary 1980 until December 2013. 10 = highest ownership decile.
-15%
-10%
-5%
0%
5%
10%
15%
1 2 3 4 5 6 7 8 9 10
Returns from T-8 to T-4 in deciles of stocks sorted by the mutual funds' ownership percentage
Valueweighted
Equallyweighted

The effect of mutual fund holdings on the turn of the month patternsThis figure shows value- and equal-weighted returns from T-3 to T-1 in deciles of stocks sorted by our estimates of themutual funds’ total ownership percentages of stocks in the previous month. Our sample consists of all CRSP stocksowned by at least one mutual fund (in Thomson Reuters Mutual Fund Holdings database). Sample period is fromJanuary 1980 until December 2013. 10 = highest ownership decile.
0%
5%
10%
15%
20%
25%
30%
35%
40%
1 2 3 4 5 6 7 8 9 10
Returns from T-3 to T-1 in deciles of stocks sorted by the mutual funds' ownership percentage
Valueweighted
Equallyweighted

The effect of mutual fund holdings on the turn of the month patternsThis figure shows the correlation of T-8 to T-4 and T-3 to T-1 returns in deciles of stocks sorted by our estimates of themutual funds’ total ownership percentages of stocks in the previous month. Our sample consists of all CRSP stocksowned by at least one mutual fund (in Thomson Reuters Mutual Fund Holdings database). Sample period is fromJanuary 1980 until December 2013. 10 = highest ownership decile.
-35% -30% -25% -20% -15% -10% -5% 0% 5%
10% 15%
1 2 3 4 5 6 7 8 9 10
Correlation of T-8 to T-4 and T-3 to T-1 returns in decile portfolios of stocks based on mutual funds' ownership percentage
Valueweighted
Equallyweighted

Mutual funds and the correlation of T-8 to T-4 and T-3 to T-1 returnsThis table shows the results from a regression in which the US equity market index returns from T-3 to T-1are regressed on the T-8 to T-4 returns to the same index, and on the mutual fund industry’s assets undermanagement, and its interaction with the T-8 to T-4 index returns. Mutual fund industry’s assets undermanagement is the sum of all equity mutual funds’ assets under management normalized by the US totalstock market capitalization. The sample period is from 1991 to 2013.
y = returns T-3 - T-1Market return T-8 - T-4 0.535
(1.99)Mutual fund industry AUM -0.002
(-0.17)
Interaction of mutual fund industry AUM and market return T-8 - T-4 -3.289
(-2.43)Intercept 0.004
(1.38)R2 0.184

Mutual funds and the correlation of T-8 to T-4 and T-3 to T-1 returns across countriesThis figure shows the mutual funds’ domestic stock holdings as a percentage of total marketcapitalization of the country and the correlation of T-8 to T-4 and T-3 to T-1 returns. Our sampleincludes countries for which the relevant data are available from OECD’s Institutional Investor assetsdataset. Total market capitalization data are from World Bank. * denotes countries in which OECDdata includes also stocks issued by non-residents.
-60%
-40%
-20%
0%
20%
40%
60%
Aus
tria
USA
*Fr
ance
Ger
man
yC
anad
aSw
itzer
land
Aus
tralia
Sout
h K
orea
Finl
and
Japa
n* UK
Nor
way
Bel
gium
Swed
enN
ethe
rland
sIta
lyPo
rtuga
lSp
ain
Isra
el
Mutual funds' stock holdings as a percentage of market capitalization
Correlation of T-8 - T-4 and T-3 - T-1 returns

Impact of past mutual fund outflow on returns around the turn of the month (T-8 to T-4)

Impact of past mutual fund outflow on returns around the turn of the month (T-3 to T-1)

Outline
• Introduction • Direct evidence from institutions’ role• Indirect evidence from institutions’ role• Other results • Mutual fund alphas• Conclusions

Why not enough supply of liquidity around the turn of the month
• Hedge funds and mutual funds are less willing to supply liquidity near the month end (prior to reporting of their monthly returns).
• Hedge Funds redemption dates also at month end.

Mutual funds’ market betas around the turn of the monthThis table shows mutual funds’ market betas on various days around the turn of the month relative to their market betas onall other days. The betas are averages from regressions where mutual funds’ daily returns are regressed on daily S&P 500index returns, dummies for days corresponding to their location relative to the turn of the month, and their interactions.
Coefficient t-stat
Interactions of time period dummies and daily S&P500 returns
T-5 -0.024 (-15.67)T-4 -0.017 (-10.16)T-3 -0.053 (-31.50)T-2 0.016 (10.62)T-1 -0.021 (-16.40)T -0.075 (-43.62)
T+1 0.012 (10.03)T+2 0.052 (22.61)T+3 0.033 (17.64)T+4 -0.001 (-0.74)T+5 -0.012 (-8.10)
Daily S&P500 return 0.978 (220.10)Intercept 0.000 (-8.74)Time period dummies YesNumber of funds 3619

Some additional support for funds’ risk reduction near month end: Mutual funds’ cross-sectional return volatility relative to the funds’ average daily cross-sectional return volatility on different trading days of the month
-0,08%
-0,04%
0,00%
0,04%
0,08%
T+1
T+3
T+5
T+7
T+9
T+11
T+13
T+15
T+17
T+19
T+21
T+23

Hedge funds’ market betas around the turn of the monthMarket betas of most hedge funds follow the same turn-of-the-month pattern as mutual funds (also lowest beta at T-3). These patterns are stronger for funds with less frequent redemption cycles
So, on average most hedge funds are plagued by month-end cash (and agency) concerns as mutual funds and instead of supplying liquidity at T-4, they demand liquidity at T-4Hedge funds do however on average provide liquidity at times when funding liquidity is good TED spread is low. They demand liquidity only when TED spread is highManaged futures and global macro hedge funds systematically supply liquidity at T-4

Effect of the cost of leverage (arbitrage capital) on turn of the month reversal
y = Return T-3 - T-1Return T-8 - T-4 -0.068
(-1.17)TED spread 0.004
(1.37)Interaction of TED spread and the T-8 - T-4 return
-0.148(-5.79)
Intercept 0.002(1.15)
R2 0.273
This table shows the results from a regression in which the T-3 to T-1 stockmarket returns are regressed on the T-8 to T-4 market returns, a measure ofcost of leverage (TED spread), and its interaction with the T-8 to T-4 returns.The sample period is from 1991 to 2013.

Relation between T-8 to T-4 and T-3 to T-1 returns (black dots high TED spread)
-10%
0%
10%
20%
-20% -10% 0% 10%
T-3
to T-1
retu
rn
T-8 to T-4 return
Including high TED spread observations
Excluding high TED spread observations

• During the Lehman crisis, large outflows from mutual funds. Little arbitrage capital: High TED Spread.
• Cumulative returns exceptionally low T-8 to T-4: -35%.• Cumulative returns exceptionally high T-3 to T: +30%
Example: Lehman crisis
-0,15
-0,10
-0,05
0,00
0,05
0,10
0,15
-50%
-25%
0%
25%
50%
huht
i.08
touk
o.08
kesä
.08
hein
ä.08
elo.
08
syys
.08
loka
.08
mar
ras.0
8
joul
u.08
tam
mi.0
9
helm
i.09
maa
lis.0
9
huht
i.09
touk
o.09
TED Spread (%)
Mutual Fund flows (USD Trillion)
Cumulative equity return from T-8 to T-4
Cumulative equity return from T-3 to T-1

Stock characteristics, funding liquidity and return reversals around the turn of the month
• Sophisticated investors try to minimize the effect of their liquidity needs
We find that correlation around T-3 is the most negative for liquid large-cap stocks

Outline
• Introduction • Direct evidence from institutions’ role• Indirect evidence from institutions’
role• Other results on reversals• Mutual fund alphas• Conclusions

Exposure to month-end return reversals predicts mutual fund performance
This figure shows mutual funds’ four factor alphas conditional on fund-specific trailing two-year correlations between the funds’ T-8 to T-4 and T-3 to T-1 returns. Funds’ whose investors demand turn of the month liquidity suffer from poor returns.
-3,00%
-2,00%
-1,00%
0,00%
1,00%
2,00%
3,00%
1 2 3 4 5 6 7 8 9 10


Outline
• Introduction • Direct evidence from institutions’ role• Indirect evidence from institutions’
role• Other results on reversals• Mutual fund alphas• Conclusions

Conclusions• We document a strong return reversal around the last settlement day
of the month, T-4, which guarantees cash for month-end distributions
• We present strong evidence that links the return reversals around T-4to institutions’ trading
• The return reversals around T-4 have become stronger over time with the growth of institutional asset management industry and are stronger in countries with larger mutual fund industry
• The reversals around T-4 are related to availability of funding liquidity and affect mutual fund alphas