Embed Size (px)
Citation preview

Watershed Monitoring Programs
Presented for the
Indiana Watersheds Webinar Series
December 11, 2013
Indiana Department of Environmental Management
Office of Water Quality
Watershed Assessment and Planning Branch

Presentation
• Water Quality Monitoring Strategy
• Summarize Monitoring Programs
– Site selection
– Parameters
– Frequency
– Assessment of designated uses
• Where are we in 2014?

Strategy • Plan to gather quality scientific data to
monitor and assess Indiana’s water resources
• Protection of human health and fulfill Clean Water Act in reporting on quality of rivers and streams, lakes and reservoirs, ground water and wetlands
• Provide information to other program areas, public and governmental agencies

Monitoring Objectives • Support public health advisories
• Water quality assessments and list of impaired waters in Integrated Report to U.S. Environmental Protection Agency
• Trends and trophic status of Indiana’s lakes
• Develop or refine water quality criteria
• Total Maximum Daily Loads
• Support watershed planning and identify successful restoration efforts

Monitoring Objectives continued...
• Determine ambient ground water quality and extent of contaminated areas
• Support source water protection
• National Pollutant Discharge Elimination System (NPDES) permits
• Develop environmental indicators
• Respond to citizen complaints

Targeted Monitoring • Targeted sites based on previous
sample collections or special design requirements
• Utilized to provide local water quality information, look for watershed improvements and address contaminants of concern or previous impairments
• Data collected include chemical, physical and biological parameters

Fixed Stations
• Began in 1957 (49 sites), now 163 fixed locations on rivers and streams
• Water chemistry, bacteria (E. coli), field analytical data collected monthly
• Recreational Use, Drinking Water Use, Aquatic Life Use
• Long-term data set to reveal water quality trends
www.idem.IN.gov/4677.htm

Recreational Use • Bacteria (E. coli) Human Health
• Violation if five samples equally spaced over a 30-day period have a geometric mean >125 colony forming units (cfu) per 100 mL
• Where there are at least 10 grab samples (no five equally spaced over 30-day period), violation where more than 10% of the samples is >576 cfu/100 mL or more than one sample is >2,400 cfu/100 mL

Drinking Water Use • Community water supply has drinking water intake
• Dissolved metals, pesticides, PCBs, free cyanide, total dissolved solids, specific conductance, sulfate, chloride, Nitrate-N+ Nitrite-N
• For any one pollutant (grab or composite sample), not supporting if more than one exceedance of the acute or chronic criteria within a three-year period
• Taste and odor requiring additional treatment

Aquatic Life Use • Data sets must consist of three or more measurements
• Water Quality Standards
[327 Indiana Administrative Code (IAC) 2-1-6]
– Dissolved metals, pesticides, polyaromatic hydrocarbons (PAH), free cyanide, ammonia, dissolved oxygen, pH, sulfates and chlorides
• Not supporting aquatic life use if more than one exceedance of the acute or chronic criteria
Resource for IAC www.IN.gov/legislative/iac/
Resource for assessing designated uses www.watersheds.IN.gov/2639.htm

Fish Consumption • Began in the late 1970s with sites
targeted on rivers and lakes
• Analysis includes select metals, pesticides and organic compounds
• Not supporting if mercury in trophic level weighted arithmetic mean concentration value >0.3 mg/kg wet weight and/or PCBs in fish tissue sample >0.02 mg/kg
• Fish Consumption Advisory
www.IN.gov/isdh/23650.htm

Blue-Green Algae • Taste and odor, skin and eye irritant,
nausea, tingling fingers and toes
• Monthly from June-September (increase frequency with high densities of blue-green algae and/or microcystin toxin)
• Drinking Water Use
– Not supporting if the public water supply received a pesticide (algaecide) application permit for algae to prevent taste and odor problems
• Advisory process: www.idem.IN.gov/algae/
State Park Beaches
Potato Creek
Pokagon
Chain O’ Lakes
Salamonie
Mississinewa
Cecil Harden
Brookville
Whitewater
Monroe
Hardy Lake

Lake Water Quality • Random sampling of 600
targeted sites each year by Indiana University School of Public Environmental Affairs
• Analysis includes select physical, chemical and biological (plankton) samples
• Aquatic Life Use and Recreational Use (Aesthetics)
• Indiana Clean Lakes Program
www.indiana.edu/~clp/

Aquatic Life Use: Lakes and Reservoirs
• Temperature and pH
– Thermal modifications caused adverse effect on aquatic life and/or pH not between 6.0 and 9.0 standard units
• Indiana Department of Natural Resources information on trout stocking
– www.IN.gov/dnr/fishwild/3622.htm
– Not supporting if native cisco population gone or lake unable to support stocked trout

Recreational Use: Lake and Reservoir Aesthetics
• Natural Lakes
– Fully supporting if no more than 10% of all total phosphorus values >54 μg/L and their associated chlorophyll a values <20 μg/L
• Reservoirs
– Fully supporting if no more than 10% of all total phosphorus values >51 μg/L and their associated chlorophyll a values <25 μg/L

Lake and Reservoir Trophic Status • Assess trends in trophic scores for publicly owned lakes and
reservoirs to fulfill Clean Water Act Section 314
• Indiana Trophic State Index (TSI)
– Nutrients, ammonia, dissolved oxygen, light transmission and penetration in the water column and plankton densities
• Classify lakes according to TSI (range 0-75)
– 0-15, highest quality (oligotrophic)
– 16-30, intermediate quality (mesotrophic)
– 31-45, low quality (eutrophic)
– 46-60, lowest quality (hypereutrophic)

Probabilistic Monitoring • Randomly generated sites in
rotating basins
• Characterize water quality for basin of interest and site-specific assessments
• Monitor trends in water quality over time within each basin and basin-to-basin comparisons
• Data collected include chemical, physical and biological parameters

Probabilistic Monitoring 1996-2011
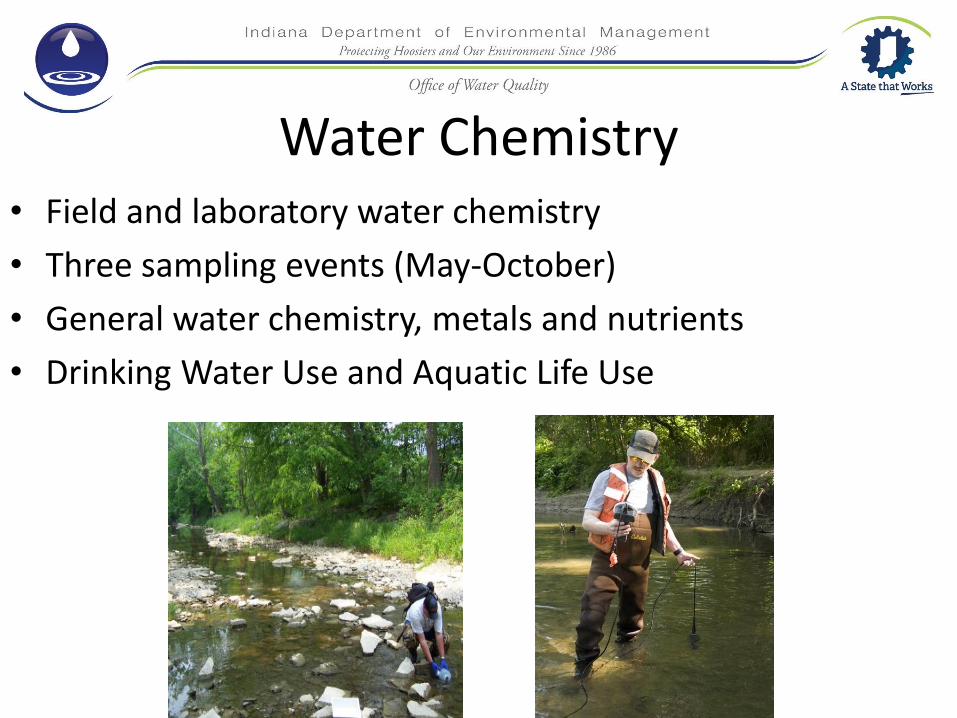
Water Chemistry • Field and laboratory water chemistry
• Three sampling events (May-October)
• General water chemistry, metals and nutrients
• Drinking Water Use and Aquatic Life Use
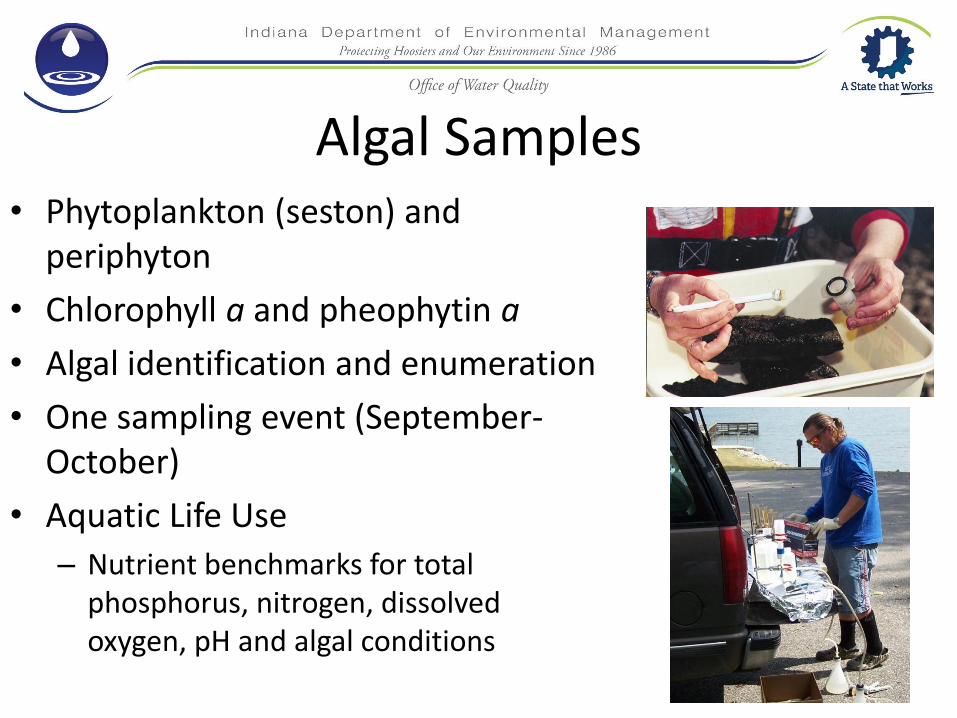
Algal Samples • Phytoplankton (seston) and
periphyton
• Chlorophyll a and pheophytin a
• Algal identification and enumeration
• One sampling event (September-October)
• Aquatic Life Use
– Nutrient benchmarks for total phosphorus, nitrogen, dissolved oxygen, pH and algal conditions

Bacteriological • Ambient E. coli concentrations
as well as field chemistry
• Sampling once each week for five consecutive weeks (April-October)
• Human Health Recreational Use and Aquatic Life Use
– Violation if five sample geometric mean >125 colony forming units (cfu) per 100 mL

Aquatic Life Use: Rivers and Streams
• Well-balanced aquatic community [327 IAC 2-1-9(60)]
– Diverse in species composition
– Several different trophic levels
– Not primarily composed of pollution tolerant species
• Fish and macroinvertebrate communities
– Impaired when Index of Biotic Integrity <36
– Range = 0 (no fish or macroinvertebrates) to 60 (excellent assemblage of species)
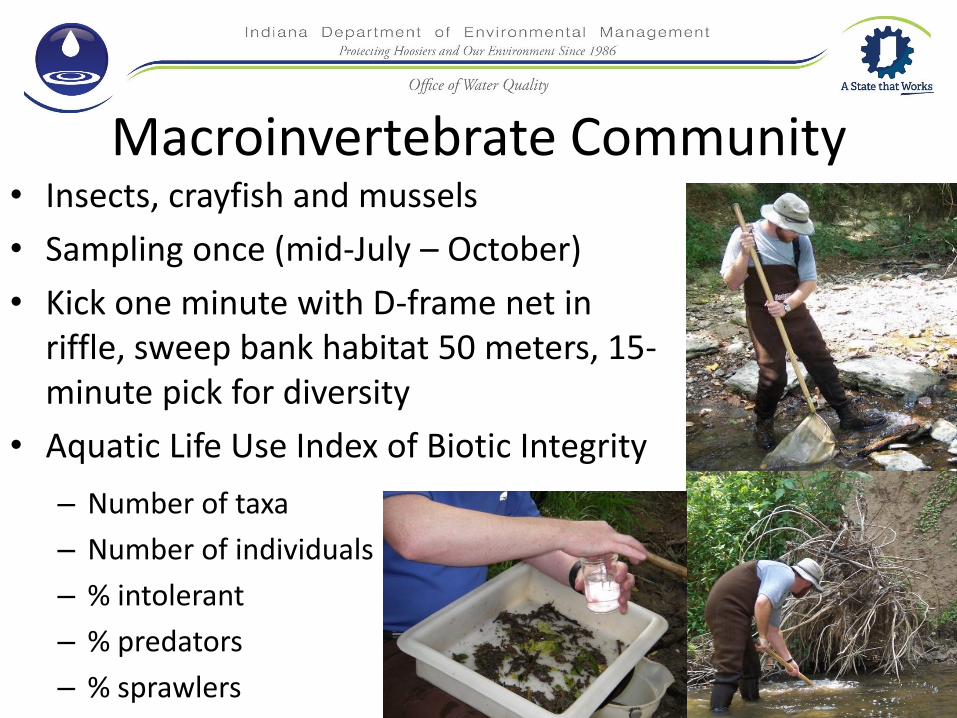
Macroinvertebrate Community • Insects, crayfish and mussels
• Sampling once (mid-July – October)
• Kick one minute with D-frame net in riffle, sweep bank habitat 50 meters, 15-minute pick for diversity
• Aquatic Life Use Index of Biotic Integrity
– Number of taxa
– Number of individuals
– % intolerant
– % predators
– % sprawlers

Fish Community • Sampling once (mid July-October)
• Electrofishing 50-500 meters
• Aquatic Life Use Index of Biotic Integrity
– Dependent on watershed location
and stream size
• Number of species
• Number of sensitive species
• % omnivore individuals
• % simple lithophilic individuals
• Total number of individuals
• % individuals with deformities, eroded fins, lesions and tumors

Habitat Evaluations • Qualitative Habitat Evaluation Index
(QHEI)…Ohio EPA 2006
– Substrate composition
– Instream cover
– Channel morphology
– Riparian zone and bank erosion
– Pool/glide and riffle/run quality
– Gradient
• Completed for sampling areas after macroinvertebrate and fish collections
• Score ranges from 0-100
(<51 considered poor for biology)
Impairment Cause/Source • Cause:
– Parameter violating Water Quality Standard and/or Impaired Biological Community (IBC)
• Source:
– Unknown pending further investigation
– Best professional judgment based on type of chemical violation and looking at point sources, aerial photos, riparian land use, and in-stream habitat

Extent of Impairment • Best professional judgment
based on
– Permitted facility locations
– Agricultural practices
– Land use characteristics
– Tributary influences

Turkey Creek Assessment

Turkey Creek Impairment

Total Maximum Daily Loads • Identify sources of impairments,
recommend limits for pollutants and suggest actions to improve water quality
• Targeted watersheds based on type and number of impairments as well as active groups to implement recommendations
• Generally, 20-40 sites sampled multiple times for general chemistry and nutrients, bacteria, or both depending on previous impairments
• Human Health Recreational Use, Drinking Water Use and Aquatic Life Use
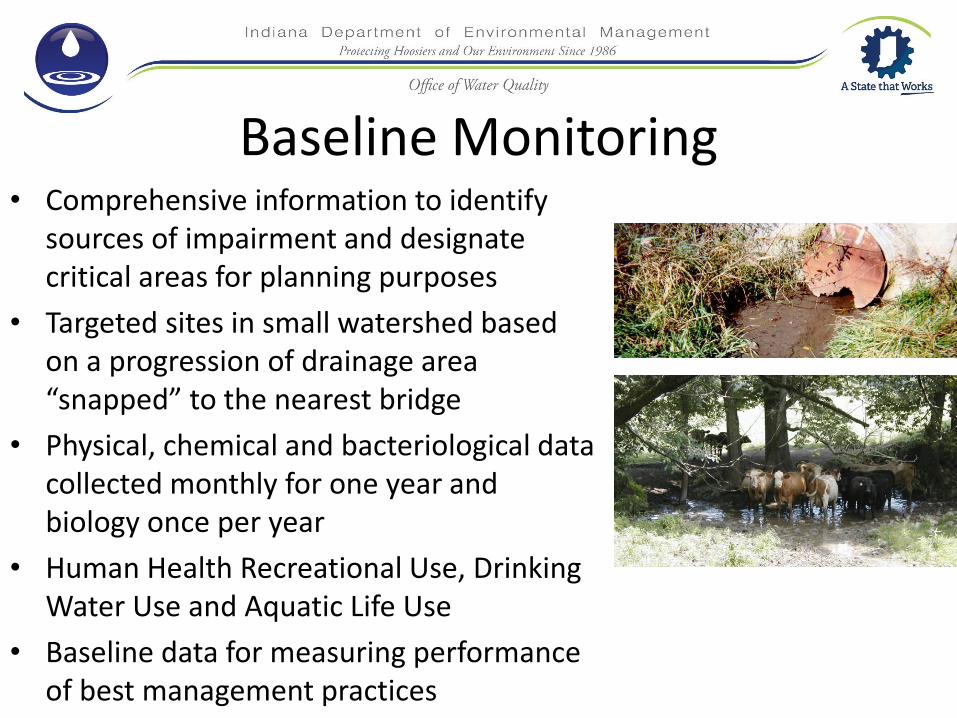
Baseline Monitoring • Comprehensive information to identify
sources of impairment and designate critical areas for planning purposes
• Targeted sites in small watershed based on a progression of drainage area “snapped” to the nearest bridge
• Physical, chemical and bacteriological data collected monthly for one year and biology once per year
• Human Health Recreational Use, Drinking Water Use and Aquatic Life Use
• Baseline data for measuring performance of best management practices

Hydrograph Control Release Facilities • Some issues with discharge from lagoons
– Improper design and location
– Poor construction
– Poorly operated or installed equipment
– Inadequate maintenance
• Evaluate placement and accuracy of flow measuring equipment in stream
• Calibration and operation of flow measuring equipment in the plant facility
• Assist facility managers in operating flow measuring devices

Watershed Improvements • Must identify changes in water quality
to receive federal Clean Water Act funds
• Targeted monitoring of waters previously impaired (best management practices and sufficient recovery time)
• Sampling sites and parameters monitored vary based on original impairment (up to 20 sites)
• Human Health Recreational Use, Drinking Water Use and Aquatic Life Use

Hoosier Riverwatch Program • Volunteer Stream Monitoring Program
• Train participants in water monitoring methods
• Provide support and equipment opportunities to certified volunteer monitors
• Workshops located throughout the state
• Participants decide their monitoring goals and location
• Online database

Summary • Monitoring Strategy Objectives
• Sampling Programs
– Site selection
– Parameters
– Frequency
– Assessment for designated uses
• Where are we in 2014?

Monitoring 2014 • Fixed Stations = Continue monthly sampling at 163 sites
• Fish Tissue = Lower Wabash River Basin, Kankakee & Iroquois River Basins, Targeted Lakes
• Blue-Green Algae = May drop some lakes and add others
• Lake Water Quality = Continue random sampling of lakes
• Probabilistic = Whitewater River Watershed
• TMDL/Baseline = Southern Whitewater River Watershed and Mississinewa River Watershed
• Hydrograph Control Release Facilities = Continue as needed
• Watershed Improvements = Yet to be determined

Questions?
Stacey Sobat, Environmental Manager
Office of Water Quality
Watershed Assessment and Planning Branch
www.idem.IN.gov/5512.htm
Probabilistic Monitoring Section
Stacey Sobat, (317)308-3191, [email protected]


