Embed Size (px)
Citation preview

Q3 2018 Results
October 31, 2018

2
Forward Looking Statements
This presentation contains forward-looking statements as defined in the Private Securities Litigation Reform Act of 1995, as amended.
Forward-looking statements are statements that are not historical facts. These statements include projections and estimates and their
underlying assumptions, statements regarding plans, objectives, intentions and expectations with respect to future financial results,
events, operations, services, product development and potential, and statements regarding future performance. Forward-looking
statements are generally identified by the words “expects”, “anticipates”, “believes”, “intends”, “estimates”, “plans” and similar
expressions. Although Sanofi’s management believes that the expectations reflected in such forward-looking statements are
reasonable, investors are cautioned that forward-looking information and statements are subject to various risks and uncertainties,
many of which are difficult to predict and generally beyond the control of Sanofi, that could cause actual results and developments to
differ materially from those expressed in, or implied or projected by, the forward-looking information and statements. These risks and
uncertainties include among other things, the uncertainties inherent in research and development, future clinical data and analysis,
including post marketing, decisions by regulatory authorities, such as the FDA or the EMA, regarding whether and when to approve
any drug, device or biological application that may be filed for any such product candidates as well as their decisions regarding
labelling and other matters that could affect the availability or commercial potential of such product candidates, the absence of
guarantee that the product candidates if approved will be commercially successful, the future approval and commercial success of
therapeutic alternatives, Sanofi’s ability to benefit from external growth opportunities, to complete related transactions and/or obtain
regulatory clearances, risks associated with intellectual property and any related pending or future litigation and the ultimate outcome
of such litigation, trends in exchange rates and prevailing interest rates, volatile economic conditions, the impact of cost containment
initiatives and subsequent changes thereto, the average number of shares outstanding as well as those discussed or identified in the
public filings with the SEC and the AMF made by Sanofi, including those listed under “Risk Factors” and “Cautionary Statement
Regarding Forward-Looking Statements” in Sanofi’s annual report on Form 20-F for the year ended December 31, 2017. Other than
as required by applicable law, Sanofi does not undertake any obligation to update or revise any forward-looking information or
statements.
3
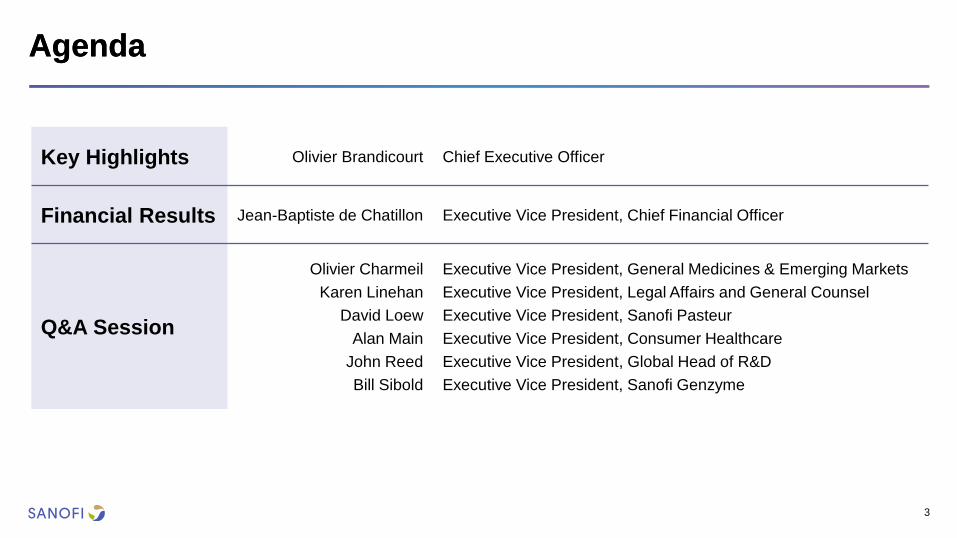
Agenda Agenda
Key Highlights Olivier Brandicourt Chief Executive Officer
Financial Results Jean-Baptiste de Chatillon Executive Vice President, Chief Financial Officer
Q&A Session
Olivier Charmeil
Karen Linehan
David Loew
Alan Main
John Reed
Bill Sibold
Executive Vice President, General Medicines & Emerging Markets
Executive Vice President, Legal Affairs and General Counsel
Executive Vice President, Sanofi Pasteur
Executive Vice President, Consumer Healthcare
Executive Vice President, Global Head of R&D
Executive Vice President, Sanofi Genzyme

Key highlights
Olivier Brandicourt Chief Executive Officer

5
Sanofi entered a new growth phase with strong results in Q3 2018
Company sales Business EPS
Q3 2018
€1.84
Q3 2017
€1.70
+11.2% at CER
€9,392m
Q3 2017
€9,056m
Q3 2018
+6.3% at CER(1)
CER: Constant Exchange Rates
(1) Q3 2018 sales increased +3.4% at CER/CS; Constant Structure adjusting for Bioverativ acquisition
6
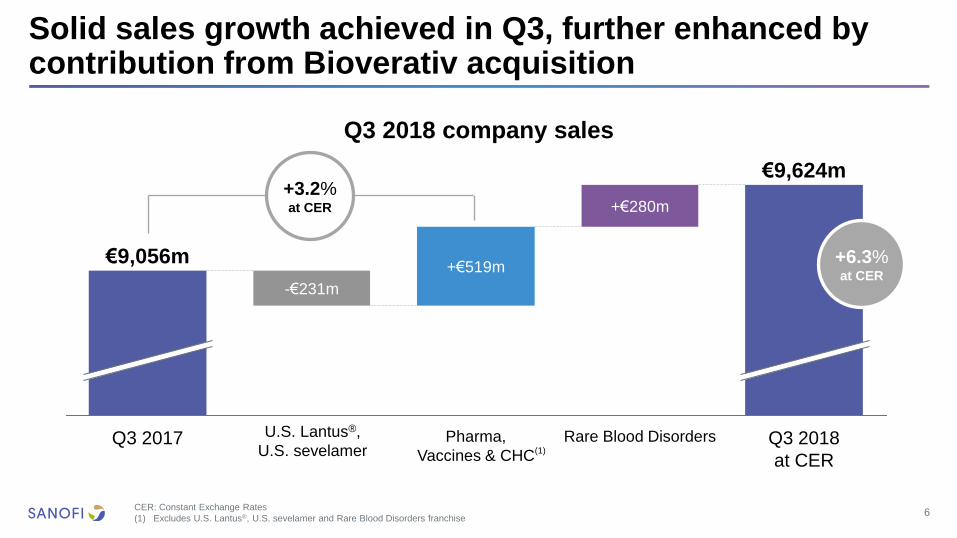
Solid sales growth achieved in Q3, further enhanced by contribution from Bioverativ acquisition
Q3 2018 company sales
+€280m
Pharma,
Vaccines & CHC
+€519m €9,056m
Q3 2017
-€231m
Q3 2018
at CER
€9,624m
Rare Blood Disorders
+6.3% at CER
CER: Constant Exchange Rates
(1) Excludes U.S. Lantus®, U.S. sevelamer and Rare Blood Disorders franchise
U.S. Lantus®,
U.S. sevelamer (1)
+3.2% at CER

7
Q3 2018 sales performance driven by Specialty Care, Vaccines and CHC
Q3 2018 sales by Global Business Unit Growth
at CER/CS(1)
(1) Growth at Constant Exchange Rates and Constant Structure adjusting for Bioverativ
acquisition (consolidated from March 9, 2018)
(2) Does not include Emerging Markets sales; Includes Bioverativ Products
(3) Consumer Healthcare includes sales in Emerging Markets
(4) Includes Emerging Markets sales for Diabetes & Cardiovascular and Specialty Care
(5) Emerging Markets: World excluding U.S., Canada, Western & Eastern Europe
(except Eurasia), Japan, South Korea, Australia, New Zealand and Puerto Rico
(6) Excluding global Consumer Healthcare sales and Vaccines
(7) At CER growth was +36.1%, including €282m in sales from Rare Blood Disorders
(8) Does not include Emerging Markets sales
Company Sales
Diabetes & Cardiovascular
Sanofi Genzyme (Specialty Care)
Sanofi Pasteur (Vaccines)
General Medicines & Emerging Markets (4,5,6)
(8)
(2)
(3) Consumer Healthcare
(7)
€9,392m
+3.4%
€1,146m
-12.1%
€1,904m
+14.9%
€2,069m
+8.2%
€3,160m
+0.6%
€1,113m
+4.1%
8
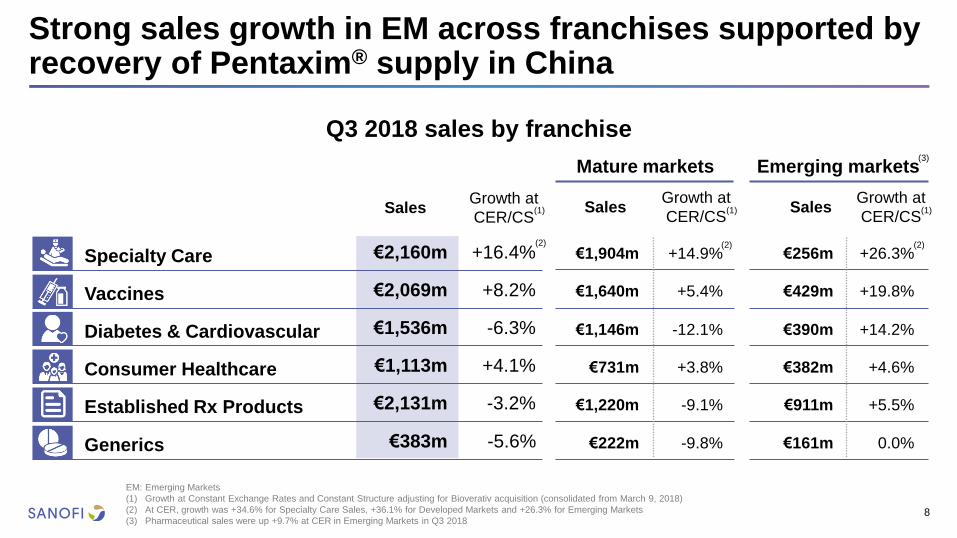
Strong sales growth in EM across franchises supported by recovery of Pentaxim® supply in China
Q3 2018 sales by franchise
EM: Emerging Markets
(1) Growth at Constant Exchange Rates and Constant Structure adjusting for Bioverativ acquisition (consolidated from March 9, 2018)
(2) At CER, growth was +34.6% for Specialty Care Sales, +36.1% for Developed Markets and +26.3% for Emerging Markets
(3) Pharmaceutical sales were up +9.7% at CER in Emerging Markets in Q3 2018
Mature markets Emerging markets
Growth at
CER/CS Sales Growth at
CER/CS Sales
Specialty Care
Diabetes & Cardiovascular
Sales Growth at
CER/CS
Vaccines
Established Rx Products
Generics
Consumer Healthcare
(2) (2) (2)
(1) (1) (1)
(3)
+16.4% €2,160m
+26.3% +14.9% €1,904m
€256m
-6.3% €1,536m
+14.2% -12.1% €1,146m
€390m
+8.2% €2,069m
+19.8% +5.4% €1,640m
€429m
-3.2% €2,131m
+5.5% -9.1% €1,220m
€911m
-5.6% €383m
0.0% -9.8% €222m
€161m
+4.1% €1,113m
+4.6% +3.8% €731m
€382m

9
Double-digit growth in Specialty Care reflected solid contributions from all franchises
AD: Atopic Dermatitis; EM: Emerging Markets
(1) Source: Internal data
(2) At CER, growth was 34.6%
Sales by franchise (% growth at CER)
Specialty Care sales increased 16.4%(2) at CER/CS
€726m +9.3%
€525m +7.3%
€380m +4.7%
€282m
€247m
Rare Blood Disorders Eloctate® increased U.S. share to 18%(1) driven by differentiated clinical profile
Immunology Successful U.S. Dupixent® launch and global rollout in AD
Oncology Growth of legacy oncology portfolio supported by EM performance (+14%)
Multiple Sclerosis Strong Aubagio® sales in all geographies drove double-digit growth (+13%)
Rare Diseases Solid growth in Pompe (+13.7%), Gaucher (+8.1%) and Fabry (+12.0%)

10
Dupixent® is core driver of growing Immunology franchise
All growth at CER; SC: sub-cutaneous; AD: Atopic Dermatitis; CRSwNP: Chronic Rhinosinusitis
with Nasal Polyps; NBRx: New to Brand Prescriptions, TRx: Total Prescriptions
(1) IQVIA NPA Market Dynamics, National Prescription Audit, data through September 2018
(2) Including the UK, Luxembourg, Korea, and Taiwan
(3) Source: IQVIA NPA Market Dynamics, data through September 2018
(4) U.S. subcutaneous utilization represents 45% of total patients in the IL-6 market
(IQVIA custom report, Y-o-Y June 2018)
(5) Source: IQVIA NPA Weekly; rolling 4-week average as of September 29, 2018
Q1 Q4 Q3
2017
Q2
2018
Q3
U.S. sales
Non U.S. sales
€75m
€118m €107m
€176m
Quarterly sales evolution
€225m
• Strong Q3 U.S. performance metrics for Dupixent®
• 16% sequential increase in TRx(1)
• Rx trends ahead of other biologic launches in dermatology
• Trade inventory steady at ~4 weeks
• 13 countries launched; 4 country launches in Q3(2)
• Submitted sBLA to FDA for adolescent AD and
positive results in two Phase 3 trials in CRSwNP
• Kevzara® launch continues to progress
• 42% NBRx share in the SC IL-6 market(3,4)
• TRx demand in the SC IL-6 market +31% year/year(5)

Three important regulatory approvals in Specialty Care
11
FDA approved for treatment of
moderate-to-severe asthma
• ~900,000 U.S. uncontrolled moderate-to-severe asthma patients
• ~80% of asthma patients suffer from type 2 co-morbidities(1)
Immunology
Only FDA approved treatment for
advanced CSCC
• EMA decision expected in H1 2019
• ~7,000 patients die annually in the
U.S. from CSCC
Oncology
First therapeutic approved in EU for
treatment of aTTP
• FDA action date Feb 6, 2019
• aTTP mortality rate of up to 20%
with current standard of care(2)
Rare Blood Disorders
CSCC: Cutaneous Squamous Cell Carcinoma; aTTP: Acquired Thrombotic Thrombocytopenic Purpura; EMA: European Medicines Agency
(1) Based upon Quest study in population of moderate/severe asthmatics
(2) Benhamou, Y. et al., Haematologica 2012

12
Strong Vaccines performance reflects Pentaxim® supply recovery in China and flu differentiation strategy
Q3 2018 Vaccines sales evolution
• PPH franchise grew 20% as supply constraint in
China resolved
• Slightly faster than expected supply recovery of Pentaxim®
• Flu vaccine sales increased 2.8% to €985m reflecting
performance of Flublok® and Vaxigrip® QIV
• European sales growth of 10% to €219m
• Positive initial Phase 3 results for MenQuadTT®
presented at IPNC
• H2 growth expected to be mid-to-high single digits
All growth at CER; IPNC: International Pathogenic Neisseria Conference PPH: Polio/Pertussis/Hib
Q3 2018
at CER
€2,073m
Q3 2017
€1,916m
8.2% at CER
Pediatric
Combination
Others Flu
Vaccines
€88m
€27m
€42m

13
Quality of access to Praluent® expected to improve in 2019; Global Diabetes benefited from growing non-U.S. sales
93% 96%
72% 79%
15%
74% 81%
68% 75%
2018 2019
All growth at CER; UM: Utilization Management Source: MMIT / Total may not sum due to rounding
(1) As of July 1st 2018
(2) Number of Medicare Part D lives: 40.8m in 2018 and 2019; Commercial lives: 187m in 2018 and 2019
(3) Expected coverage as per individual account information
(4) Pending plan decisions
74% 74%
2018 2019
• Praluent® sales up 64% to €68m
• U.S. TRx share gain largely due to ESI exclusive coverage(1)
• Improved quality of access for significantly higher rebates
• 39% of lives representing 52% of sales in the U.S.
Commercial channel now benefit from simplified UM criteria
• Global Diabetes down 9% as anticipated
• Non-U.S. sales +4.7%, ~60% of franchise; U.S. sales -24%
• Admelog® sales of €26m due to access in Managed Medicaid
• Glargine expected to maintain broad payer coverage
in 2019 across Commercial and Medicare lives
74% 74%
U.S. payer coverage(2,3)
(% of lives covered)
Commercial Medicare
7%(4)

14
Consumer Healthcare franchise delivers balanced growth as sales increased in all geographies
Q3 2018 CHC sales by geography
• CHC sales increased 4.1% to €1,113m
• Growth demonstrated in all four strategic
growth categories(1)
• Emerging Markets sales up 4.6%
• Growth primarily driven by LatAm and AME regions
• Mature Markets sales increased 3.8%
All growth at CER ; LatAm: Latin America; AME: Africa and Middle East
CHC: Consumer Healthcare
(1) Allergy, Cough & Cold; Pain; Digestive; Nutritionals
€251m +2.9%
€151m +6.1%
€329m +3.4%
€382m +4.6%
Emerging Markets
U.S.
Other
Europe

15
€2,334m €861m
EUROPE
+1.9 %
€1,028m ASIA(2)
+10.3%
ROW(3)
+9.4%
€604m LATAM
+12.6%
€3,668m U.S.
+5.5%
€601m AME(5)
+8.1%
€267m EURASIA(4)
+8.9%
All growth at CER unless specified otherwise
(1) World excluding U.S., Canada, Europe, Japan, South Korea, Australia, New Zealand
and Puerto Rico
(2) Includes China
(3) RoW: Japan, South Korea, Canada, Australia, New Zealand and Puerto Rico
(4) Eurasia: Russia, Ukraine, Georgia, Belarus, Armenia and Turkey
(5) AME: Africa and Middle East
Geographic breakdown of Q3 2018 sales
€644m CHINA
+17.7%
of which
Strong Emerging Markets(1) growth of +10.4%(2) in Q3 2018

16
New organization to provide greater focus on operations in mature markets and across emerging markets(1)
PCP: Primary Care Physicians; EP: Established Products
(1) New organization to be implemented in January 2019 subject to the completion of legal and social consultation process as applicable
Primary Care (in Mature Markets)
Dieter Weinand
Specialty Care (in Mature Markets)
Bill Sibold
China &
Emerging Markets
Olivier Charmeil
Vaccines
David Loew
Consumer
Healthcare
Alan Main
• Rare Diseases
• Multiple Sclerosis
• Oncology
• Immunology
• Rare Blood Disorders
(in Mature Markets)
• CHC products • Diabetes
• Cardiovascular
• Established products
(in Mature Markets)
• Diabetes &
Cardiovascular
• Specialty Care
• Established products
(in China and
Emerging Markets)
• Human vaccines
• Opportunity to enhance PCP support by leveraging EP “go-to-market” strategy
• Potential efficiencies arising from reduced number of GBUs in mature markets

17
Several potentially significant approvals for new drugs and additional indications over the next 12 months
Q4 Q1 Q2 Q3 Q4
Potential approvals(1)
Dupixent®(2) in Asthma in Adults and Adolescents (EU)
Cablivi® in acquired Thrombotic Thrombocytopenic Purpura (U.S.)
Dupixent®(2,3) in Atopic Dermatitis in 12-17 years (U.S.)
ZynquistaTM(4) (sotagliflozin) in Type 1 Diabetes
Cemiplimab(2,5) in locally advanced CSCC (EU)
Praluent®(2) ODYSSEY OUTCOMES label update (U.S.)
Expected pivotal trial read-outs
Isatuximab in Relapsed-Refractory Multiple Myeloma (ICARIA)
Dupixent®(2) in Atopic Dermatitis in 6-11 years
Sutimlimab in Cold Agglutinin Disease
Expected proof of concept
study read-outs
SP0232(6) in RSV (prophylaxis)
SERD in metastatic Breast Cancer
Maytansin-loaded anti-CEACAM5 ADC mAb in Solid Tumors
BIVV001 in Hemophilia A
Anti-IL33(2) mAb in asthma
(1) Unless specified otherwise, table indicates first potential approval in the U.S. or EU
(2) In collaboration with Regeneron
(3) Breakthrough designation granted, priority review pending
(4) In collaboration with Lexicon
(5) Also known as SAR439684 and REGN2810
(6) Also known as MEDI8897, in collaboration with MedImmune
ADC: Antibody Drug Conjugate; CSCC: Cutaneous Squamous Cell Carcinoma; RSV: Respiratory Syncytial Virus; SERD: Selective Estrogen Receptor Degrader
2018 2019

Financial results
Jean-Baptiste de Chatillon Executive Vice President,
Chief Financial Officer

19
Currency impact on sales and EPS significantly diminished in Q3 as U.S. dollar strengthened
Currency impact
Company sales(1) Business EPS
-2.6%
-€232m
-€0
.08
Q4 Q3
2017
(1) Main currency impact on Company Sales in Q3 2018: US Dollar (+€38m), Brazilian Real (-€52m), Russian Ruble (-€14m), Japanese Yen (+€2m), Argentine Peso (-€96m)
and Turkish Lira (-€50m)
Q1
2018
-€0.05
Q2
-3.0%
Q3 Q4 Q3
2017
Q1
2018
Q2 Q3
20
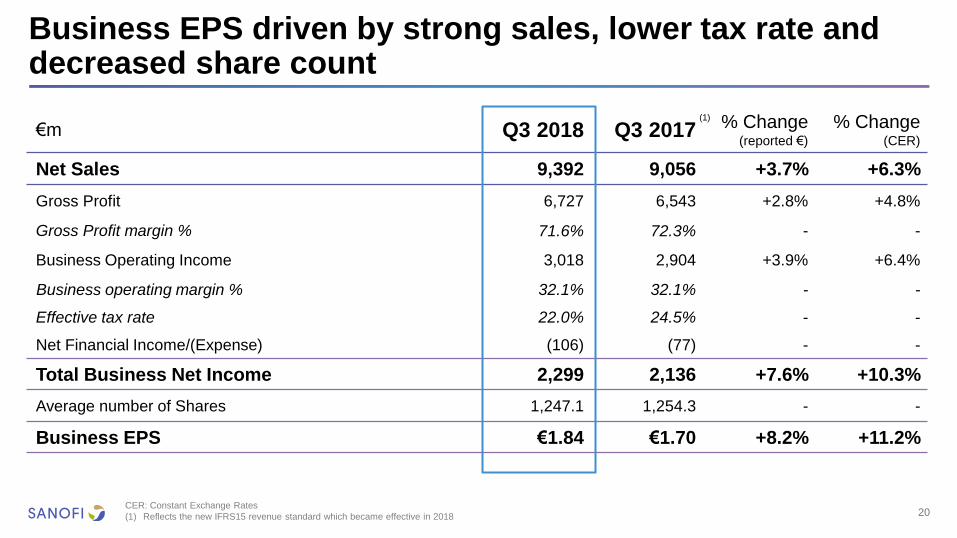
Business EPS driven by strong sales, lower tax rate and decreased share count
CER: Constant Exchange Rates
(1) Reflects the new IFRS15 revenue standard which became effective in 2018
€m Q3 2018 Q3 2017 % Change (reported €)
% Change (CER)
Net Sales 9,392 9,056 +3.7% +6.3%
Gross Profit 6,727 6,543 +2.8% +4.8%
Gross Profit margin % 71.6% 72.3% - -
Business Operating Income 3,018 2,904 +3.9% +6.4%
Business operating margin % 32.1% 32.1% - -
Effective tax rate 22.0% 24.5% - -
Net Financial Income/(Expense) (106) (77) - -
Total Business Net Income 2,299 2,136 +7.6% +10.3%
Average number of Shares 1,247.1 1,254.3 - -
Business EPS €1.84 €1.70 +8.2% +11.2%
(1)

Higher Opex from acquisitions and high comparison base in OOI offset by increase in profit from associates
CER: Constant Exchange Rates; OOI: Other current operating income/expenses
(1) Reflects the new IFRS15 revenue standard which became effective in 2018
€m Q3 2018 Q3 2017 % Change (CER)
Net Sales 9,392 9,056 +6.3%
Other revenues 352 340 +2.6%
Gross Profit 6,727 6,543 +4.8%
Gross margin % 71.6% 72.3%
R&D (1,461) (1,341) +9.5%
SG&A (2,301) (2,319) +1.6%
Other current operating income & expenses (74) 16 -
Share of profit/loss from associates 153 35 -
Minority interests (26) (30) -
Business Operating Income 3,018 2,904 +6.4%
Business operating margin 32.1% 32.1%
21
(1)

22
Gross margin declined due to product mix while investments in late stage pipeline accelerated
CER: Constant Exchange Rates
(1) Gross Margin is calculated as the ratio of Gross Profit to Company sales
(excluding Other revenues)
(2) Gross Margin at CER was 71.2%
(3) Reflects the new IFRS15 revenue standard which became effective in 2018
(4) Operating Expense growth at CER ex-acquisitions was +1.3% (SG&A -0.6%; R&D +4.5%)
SG&A
R&D
Q3 2018 Q3 2017
€1,461m +9.5% at CER
€2,301m +1.6% at CER
€3,762m +4.5% at CER(4) €3,660m
€1,341m
€2,319m
71.7%
Q3 2018 Q3 2017
71.6%(2) 72.3%
Gross margin ratio(1) Operating expenses
(3) (3)

23
Restructuring
costs &
similar items
€683m
Acquisitions
& Licences
€13,091m
Free
cash flow
€3,221m
Net Debt
December
31, 2017
€5,161m
Net Debt
September
30, 2018
€517m
Other
€18,705m
Dividend
€3,773m
Proceeds
from disposal
of assets
€2,123m
Net Share
repurchase
& share
issuance
€824m
(1) Credit ratings reaffirmed: Moody’s A1/stable, S&P AA/stable, Scope AA/stable as of September 30, 2018
(2) Excluding restructuring costs & similar items
(3) Including derivatives related to the financial debt: +€57m at December31 2017 and +€92m at September 30 2018
Net debt evolution in 9M 2018(1)
(2)
(3) (3)

24
FY 2018 financial guidance confirms return to growth
Business EPS
Approximately -6%(3)
based on October 2018 average exchange rates
+4% to +5% at CER(1,2)
FY 2018
FX impact on Business EPS
(1) Compared to FY2017 and barring major unforeseen adverse events
(2) FY 2017 Business EPS was €5.52 when applying the new IFRS15 revenue standard which became effective in 2018
(3) Difference between variation on a reported basis and variation at CER

Key highlights
Olivier Brandicourt Chief Executive Officer

New product sales contribution exceeded impact from U.S. LoEs in Q3 2018
Q1 Q2
2018
Q3
€325m
-€306m -€357m
€231m
€405m
€319m
New Products(1)
(1) New products launched since 2015
(2) At CER
Products with U.S. loss of exclusivity
• Lantus®
• sevelamer
Incremental sales year/year(2)
LoEs: Losses of Exclusivity

27
Executing our strategic transformation
• Strong Q3 performance confirms return to growth
• Three important new regulatory approvals in Specialty Care
• Refocus of GBU structure

Finance appendices

29
2018 Currency Sensitivity and Q3 2018 Currency Exposure
2018 Business EPS Currency Sensitivity
Currency Exposure on Q3 2018 Sales Currency Average Rates
Q3 2017 Q3 2018 % change
EUR/USD 1.17 1.16 -0.9%
EUR/JPY 130.38 129.66 -0.6%
EUR/CNY 7.84 7.92 +1.1%
EUR/BRL 3.71 4.60 +24.0%
EUR/RUB 69.28 76.28 +10.1%
Currency Variation Business EPS Sensitivity
U.S. Dollar + 0.05 USD/EUR - EUR 0.10
Japanese Yen + 5 JPY/EUR - EUR 0.01
Chinese Yuan + 0.2 CNY/EUR - EUR 0.02
Brazilian Real + 0.4 BRL/EUR - EUR 0.02
Russian Ruble + 10 RUB/EUR - EUR 0.03
€ 22.2%
US $ 40.1% Chinese Yuan
6.8%
Japanese Yen 4.2%
Brazilian Real 2.3%
British £ 2.0%
Russian Ruble 1.4%
Australian $ 1.4%
Canadian $ 1.5%
Mexican Peso 1.7%
Others 16.4%

Business Net Income Statement – Q3 2018
*** Net of tax.
*** Determined on the basis of Business income before tax, associates, and non-controlling interests.
*** Based on an average number of shares outstanding of 1,247.1 million in the third quarter of 2018 and 1,254.3 million in the third quarter of 2017. (1) Includes the effects of first-time application of IFRS 15 on revenue recognition. (2) Others include the cost of Global Support Functions (Medical Affairs, External Affairs, Finance, Human Resources, Information Solution & Technologies,
Sanofi Business Services, etc…). 30
Third Quarter 2018 Pharmaceuticals Consumer Healthcare Vaccines Others(2) Total Group
€ million Q3 2018 Q3 2017(1) Change Q3 2018 Q3 2017(1) Change Q3 2018 Q3 2017(1) Change Q3 2018 Q3 2017(1) Change Q3 2018 Q3 2017(1) Change
Net sales 6,210 6,016 3.2% 1,113 1,124 (1.0%) 2,069 1,916 8.0% - - 9,392 9,056 3.7%
Other revenues 51 73 (30.1%) - - - 301 268 12.3% - (1) (100.0%) 352 340 3.5%
Cost of Sales (1,688) (1,587) 6.4% (370) (371) (0.3%) (920) (834) 10.3% (39) (61) (36.1%) (3,017) (2,853) 5.7%
As % of net sales (27.2%) (26.4%) (33.2%) (33.0%) (44.5%) (43.5%) (32.1%) (31.5%)
Gross Profit 4,573 4,502 1.6% 743 753 (1.3%) 1,450 1,350 7.4% (39) (62) 6,727 6,543 2.8%
As % of net sales 73.6% 74.8% 66.8% 67.0% 70.1% 70.5% 71.6% 72.3%
Research and development expenses (1,148) (990) 16.0% (37) (30) 23.3% (125) (131) (4.6%) (151) (190) (20.5%) (1,461) (1,341) 8.9%
As % of net sales (18.5%) (16.5%) (3.3%) (2.7%) (6.0%) (6.8%) (15.6%) (14.8%)
Selling and general expenses (1,298) (1,319) (1.6%) (337) (359) (6.1%) (174) (168) 3.6% (492) (473) 4.0% (2,301) (2,319) (0.8%)
As % of net sales (20.9%) (21.9%) (30.3%) (31.9%) (8.4%) (8.8%) (24.5%) (25.6%)
Other current operating income/expenses (46) 12 3 35 (3) (8) (28) (23) (74) 16
Share of profit/loss of associates* and joint-ventures 155 32 1 - (3) 3 - - 153 35
Net income attributable to non controlling interests (23) (30) (3) (1) - 1 - - (26) (30)
Business operating income 2,213 2,207 0.3% 370 398 (7.0%) 1,145 1,047 9.4% (710) (748) (5.1%) 3,018 2,904 3.9%
As % of net sales 35.6% 36.7% 33.2% 35.4% 55.3% 54.6% 32.1% 32.1%
Financial income & expenses (106) (77)
Income tax expenses (613) (691)
Tax rate** 22.0% 24.5%
Business net income 2,299 2,136 7.6%
As % of net sales 24.5% 23.6%
Business earnings/share (in €)*** 1.84 1.70 8.2%

Business Net Income Statement – 9M 2018
*** Net of tax.
*** Determined on the basis of Business income before tax, associates, and non-controlling interests.
*** Based on an average number of shares outstanding of 1,247.6 million in the nine first months of 2018 and 1,258.3 million in the nine first months of 2017. (1) Includes the effects of first-time application of IFRS 15 on revenue recognition. (2) Others include the cost of Global Support Functions (Medical Affairs, External Affairs, Finance, Human Resources, Information Solution & Technologies,
Sanofi Business Services, etc…). 31
Nine Months 2018 Pharmaceuticals Consumer Healthcare Vaccines Others (2) Total Group
€ million 9M 2018 9M 2017(1) Change 9M 2018 9M 2017(1) Change 9M 2018 9M 2017(1) Change 9M 2018 9M 2017(1) Change 9M 2018 9M 2017(1) Change
Net sales 18,409 19,054 (3.4%) 3,466 3,610 (4.0%) 3,591 3,716 (3.4%) - - 25,466 26,380 (3.5%)
Other revenues 185 221 (16.3%) - - - 700 638 9.7% - - 885 859 3.0%
Cost of Sales (4,918) (5,006) (1.8%) (1,133) (1,189) (4.7%) (1,988) (1,957) 1.6% (144) (196) (26.5%) (8,183) (8,348) (2.0%)
As % of net sales (26.7%) (26.3%) (32.7%) (32.9%) (55.4%) (52.7%) (32.1%) (31.6%)
Gross Profit 13,676 14,269 (4.2%) 2,333 2,421 (3.6%) 2,303 2,397 (3.9%) (144) (196) 18,168 18,891 (3.8%)
As % of net sales 74.3% 74.9% 67.3% 67.1% 64.1% 64.5% 71.3% 71.6%
Research and development expenses (3,261) (2,989) 9.1% (95) (82) 15.9% (393) (391) 0.5% (467) (546) (14.5%) (4,216) (4,008) 5.2%
As % of net sales (17.7%) (15.7%) (2.7%) (2.3%) (10.9%) (10.5%) (16.6%) (15.2%)
Selling and general expenses (3,946) (4,126) (4.4%) (1,125) (1,239) (9.2%) (500) (531) (5.8%) (1,539) (1,477) 4.2% (7,110) (7,373) (3.6%)
As % of net sales (21.4%) (21.7%) (32.5%) (34.3%) (13.9%) (14.3%) (27.9%) (27.9%)
Other current operating income/expenses 86 53 85 92 (3) (7) (84) (20) 84 118
Share of profit/loss of associates* and joint-ventures 305 103 1 - (4) 2 - - 302 105
Net income attributable to non controlling interests (75) (84) (9) (12) - 1 - - (84) (95)
Business operating income 6,785 7,226 (6.1%) 1,190 1,180 0.8% 1,403 1,471 (4.6%) (2,234) (2,239) (0.2%) 7,144 7,638 (6.5%)
As % of net sales 36.9% 37.9% 34.3% 32.7% 39.1% 39.6% 28.1% 29.0%
Financial income & expenses (211) (200)
Income tax expenses (1,478) (1,820)
Tax rate** 22.0% 24.5%
Business net income 5,455 5,618 (2.9%)
As % of net sales 21.4% 21.3%
Business earnings/share (in €)*** 4.37 4.46 (2.0%)

Consolidated Income Statements
32
(1) Includes the effects of first-time application of IFRS 15 on revenue recognition. (2) In 2017, net gain resulting from the divestment of the Animal Health business presented separately in accordance with IFRS 5,
Non current assets held-for-sale and discontinued operations.
€ million Q3 2018 Q3 2017 (1) 9M 2018 9M 2017 (1)
Net sales 9,392 9,056 25,466 26,380
Other revenues 352 340 885 859
Cost of sales (3,032) (2,853) (8,297) (8,524)
Gross profit 6,712 6,543 18,054 18,715
Research and development expenses (1,461) (1,341) (4,216) (4,008)
Selling and general expenses (2,310) (2,319) (7,129) (7,373)
Other operating income 78 54 401 227
Other operating expenses (152) (38) (317) (109)
Amortization of intangible assets (537) (434) (1,536) (1,424)
Impairment of intangible assets (191) (19) (292) (31)
Fair value remeasurement of contingent consideration 107 (74) 117 (174)
Restructuring costs and similar items (108) (249) (715) (613)
Other gains and losses, and litigation 576 (147) 509 (154)
Operating income 2,714 1,976 4,876 5,056
Financial expenses (130) (103) (332) (321)
Financial income 24 26 121 121
Income before tax and associates and joint ventures 2,608 1,899 4,665 4,856
Income tax expense (427) (411) (724) (1,023)
Share of profit/(loss) of associates and joint ventures 123 37 198 64
Net income excluding the exchanged/held-for-exchange Animal Health business 2,304 1,525 4,139 3,897
Net income/(loss) of the exchanged/held-for-exchange Animal Health business(2) (4) 63 (4) 4,484
Net income 2,300 1,588 4,135 8,381
Net income attributable to non-controlling interests 26 27 83 91
Net income attributable to equity holders of Sanofi 2,274 1,561 4,052 8,290
Average number of shares outstanding (million) 1,247.1 1,254.3 1,247.6 1,258.3
Earnings per share excluding the exchanged/held-for-exchange Animal Health business (in euros) 1.83 1.19 3.25 3.02
IFRS Earnings per share (in euros) 1.82 1.24 3.25 6.59

Reconciliation of Consolidated Net Income Attributable to Equity Holders of Sanofi to Business Net Income – Q3 2018
33
(1) Includes the effects of first-time application of IFRS 15 on revenue recognition. (2) Of which related to amortization expense generated by the remeasurement
of intangible assets as part of business combinations: €503 million in the third quarter of 2018 and €400 million in the third quarter of 2017.
(3) In 2018, separation costs for the European Generics business divestiture.
(4) In 2018, adjustments made to our preliminary analysis of the direct and indirect impacts of US tax reform. In 2017, relates to French 3% tax on dividends.
(5) In 2017, net gain resulting from divestment of the Animal Health business presented separately in accordance with IFRS 5, Non current assets held-for-sale and discontinued operations.
(6) Based on an average number of shares outstanding of 1,247.1 million in the third quarter of 2018 and 1,254.3 million in the third quarter of 2017.
€ million Q3 2018 Q3 2017(1) Change
Net income attributable to equity holders of Sanofi 2,274 1,561 45.7%
Amortization of intangible assets(2) 537 434
Impairment of intangible assets 191 19
Fair value remeasurement of contingent consideration (107) 74
Expenses arising from the impact of acquisitions on inventories 15 -
Other expenses related to business combinations 9 -
Restructuring costs and similar items 108 249
Other gains and losses, and litigation (3) (576) 147
Tax effect of the items listed above: (147) (280)
Amortization and impairment of intangible assets (176) (128)
Fair value remeasurement of contingent consideration 24 (2)
Expenses arising from the impact of acquisitions on inventories (4) -
Restructuring costs and similar items (32) (90)
Other tax effects 41 (60)
Other tax items(4) (39) -
Share of items listed above attributable to non-controlling interests - (3)
Restructuring costs of associates and joint ventures, and expenses arising from the impact of acquisitions on associates and joint ventures 30 (2)
Animal Health items (5) 4 (63)
Business net income 2,299 2,136 7.6%
IFRS earnings per share (6) (in euros) 1.82 1.24

Reconciliation of Consolidated Net Income Attributable to Equity Holders of Sanofi to Business Net Income – 9M 2018
34
(1) Includes the effects of first-time application of IFRS 15 on revenue recognition. (2) Of which related to amortization expense generated by the remeasurement of
ntangible assets as part of business combination: €1,437 million in the nine first months of 2018 and €1,319 million in the nine first months of 2017.
(3) In 2018, separation costs for the European Generics business divestiture.
(4) In 2018, adjustments made to our preliminary analysis of the direct and indirect impacts of US tax reform. In 2017, relates to French 3% tax on dividends.
(5) In 2017, net gain resulting from the divestment of the Animal Health business presented separately in accordance with IFRS 5, Non current assets hel-for-sale and discontinued operations.
(6) Based on an average number of shares outstanding of 1,247.6 million in the nine first months of 2018 and 1,258.3 million in the nine first months of 2017.
€ million 9M 2018 9M 2017(1) Change
Net income attributable to equity holders of Sanofi 4,052 8,290 (51.1%)
Amortization of intangible assets(2) 1,536 1,424
Impairment of intangible assets 292 31
Fair value remeasurement of contingent consideration (117) 174
Expenses arising from the impact of acquisitions on inventories 114 176
Other expenses related to business combinations 19 -
Restructuring costs and similar items 715 613
Other gains and losses, and litigation (3) (509) 154
Tax effect of the items listed above: (622) (908)
Amortization and impairment of intangible assets (451) (477)
Fair value remeasurement of contingent consideration 35 (33)
Expenses arising from the impact of acquisitions on inventories (27) (56)
Restructuring costs and similar items (215) (216)
Other tax effects 36 (126)
Other tax items(4) (132) 111
Share of items listed above attributable to non-controlling interests (1) (4)
Restructuring costs of associates and joint ventures, and expenses arising from the impact of acquisitions on associates and joint ventures 104 41
Animal Health items (5) 4 (4,484)
Business net income 5,455 5,618 (2.9%)
IFRS earnings per share (6) (in euros) 3.25 6.59

Research & Development appendices
isatuximab Anti-CD38 mAb
3L Relapsing Refractory MM (ICARIA)
36
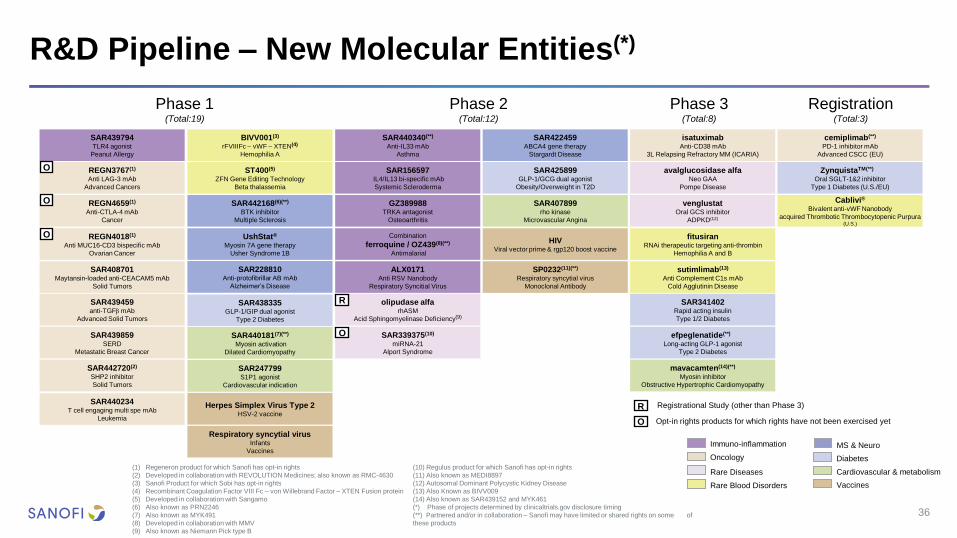
R&D Pipeline – New Molecular Entities(*)
Phase 1 (Total:19)
Phase 2 (Total:12)
Phase 3 (Total:8)
Registration (Total:3)
SAR247799 S1P1 agonist
Cardiovascular indication
UshStat® Myosin 7A gene therapy
Usher Syndrome 1B
Herpes Simplex Virus Type 2 HSV-2 vaccine
SAR422459 ABCA4 gene therapy
Stargardt Disease
efpeglenatide(**)n
Long-acting GLP-1 agonist
Type 2 Diabetes
SAR440340(**)
Anti-IL33 mAb
Asthma
HIV Viral vector prime & rgp120 boost vaccine
olipudase alfa rhASM
Acid Sphingomyelinase Deficiency(9)
avalglucosidase alfa Neo GAA
Pompe Disease
Respiratory syncytial virus Infants
Vaccines
Combination
ferroquine / OZ439(8)(**) Antimalarial
SAR425899 GLP-1/GCG dual agonist
Obesity/Overweight in T2D
SAR156597 IL4/IL13 bi-specific mAb
Systemic Scleroderma
SAR439794 TLR4 agonist
Peanut Allergy
SAR440181(7)(**) Myosin activation
Dilated Cardiomyopathy
SP0232(11)(**) Respiratory syncytial virus
Monoclonal Antibody
SAR341402 Rapid acting insulin
Type 1/2 Diabetes
SAR439459 anti-TGFb mAb
Advanced Solid Tumors
GZ389988 TRKA antagonist
Osteoarthritis
SAR407899 rho kinase
Microvascular Angina
SAR408701 Maytansin-loaded anti-CEACAM5 mAb
Solid Tumors
fitusiran RNAi therapeutic targeting anti-thrombin
Hemophilia A and B
Registrational Study (other than Phase 3)
SAR438335 GLP-1/GIP dual agonist
Type 2 Diabetes
cemiplimab(**)
PD-1 inhibitor mAb
Advanced CSCC (EU)
REGN3767(1)
Anti LAG-3 mAb
Advanced Cancers
(1) Regeneron product for which Sanofi has opt-in rights
(2) Developed in collaboration with REVOLUTION Medicines; also known as RMC-4630
(3) Sanofi Product for which Sobi has opt-in rights
(4) Recombinant Coagulation Factor VIII Fc – von Willebrand Factor – XTEN Fusion protein
(5) Developed in collaboration with Sangamo
(6) Also known as PRN2246
(7) Also known as MYK491
(8) Developed in collaboration with MMV
(9) Also known as Niemann Pick type B
(10) Regulus product for which Sanofi has opt-in rights
(11) Also known as MEDI8897
(12) Autosomal Dominant Polycystic Kidney Disease
(13) Also Known as BIVV009
(14) Also known as SAR439152 and MYK461
(*) Phase of projects determined by clinicaltrials.gov disclosure timing
(**) Partnered and/or in collaboration – Sanofi may have limited or shared rights on some of
these products
SAR339375(10)
miRNA-21
Alport Syndrome
R
SAR439859 SERD
Metastatic Breast Cancer
Opt-in rights products for which rights have not been exercised yet O
O
O
R
SAR442168(6)(**)
BTK inhibitor
Multiple Sclerosis
sutimlimab(13) Anti Complement C1s mAb
Cold Agglutinin Disease
Rare Blood Disorders
Rare Diseases
Immuno-inflammation
Diabetes
MS & Neuro
Vaccines
Oncology
Cardiovascular & metabolism
BIVV001(3) rFVIIIFc – vWF – XTEN(4)
Hemophilia A
mavacamten(14)(**)
Myosin inhibitor
Obstructive Hypertrophic Cardiomyopathy
ALX0171 Anti RSV Nanobody
Respiratory Syncitial Virus
Cablivi® Bivalent anti-vWF Nanobody
acquired Thrombotic Thrombocytopenic Purpura (U.S.)
REGN4659(1)
Anti-CTLA-4 mAb
Cancer
O
REGN4018(1)
Anti MUC16-CD3 bispecific mAb
Ovarian Cancer
O
ST400(5) ZFN Gene Editing Technology
Beta thalassemia
ZynquistaTM(**) n Oral SGLT-1&2 inhibitor
Type 1 Diabetes (U.S./EU)
venglustat
Oral GCS inhibitor
ADPKD(12)
SAR442720(2) SHP2 inhibitor
Solid Tumors
SAR440234 T cell engaging multi spe mAb
Leukemia
SAR228810 Anti-protofibrillar AB mAb
Alzheimer’s Disease

(1) Regeneron product for which Sanofi has opt-in rights
(2) Also known as BIVV009
(3) Also known as SAR439152 and MYK461
(4) Transplant ineligible
(5) U.S. filing pending acceptance by FDA
(*) Phase of projects determined by clinicaltrials.gov disclosure timing
(**) Partnered and/or in collaboration - Sanofi may have limited or shared rights on some of these products
Dupixent®(**) dupilumab
Atopic Dermatitis 6 months - 5 years old
cemiplimab(**)
PD-1 inhibitor mAb
2L Cervical Cancer
cemiplimab(**)
PD-1 inhibitor mAb
1L NSCLC
37
Phase 1 (Total:6)
Phase 2 (Total:17)
Phase 3 (Total:23)
Registration (Total:6)
PR5i DTP-HepB-Polio-Hib
Pediatric hexavalent vaccines (U.S.)
VaxiGrip® QIV IM Quadrivalent inactivated
Influenza vaccine 6 - 35 months
Additional Indications(*)
Adacel+ Tdap booster
Rabies VRVg Purified vero rabies vaccine
Shan 6 DTP-HepB-Polio-Hib
Pediatric hexavalent vaccine
dupilumab(**) Anti-IL4Rα mAb
Asthma 6 - 11 years old
Dupixent®(**) dupilumab
Atopic Dermatitis 6 – 11 years old
Dupixent®(**)
dupilumab
Atopic Dermatitis 12 – 17 years old (U.S.(5)/EU)
dupilumab(**) Anti-IL4Rα mAb
Nasal Polyposis
Pediatric pentavalent vaccine DTP-Polio-Hib
Japan
Fluzone® QIV HD Quadrivalent inactivated
Influenza vaccine - High dose
Men Quad TT Advanced generation meningococcal
ACYW conjugate vaccine
ZynquistaTM(**) n Oral SGLT-1&2 inhibitor
Type 2 Diabetes
isatuximab + cemiplimab(**) Anti-CD38 mAb + PD-1 inhibitor mAb
Relapsing Refractory MM
ZynquistaTM(**)
Oral SGLT-1&2 inhibitor
Worsening Heart Failure in Diabetes
venglustat
Oral GCS inhibitor
Fabry Disease
dupilumab(**) Anti-IL4Rα mAb
Eosinophilic Esophagitis
venglustat
Oral GCS inhibitor
Gaucher Type 3
SAR439459 + cemiplimab(**) Anti-TGFb mAb + PD-1 inhibitor mAb
Advanced Solid Tumors
sarilumab(**) Anti-IL6R mAb
Polyarticular Juvenile Idiopathic Arthritis
Praluent®(**) alirocumab
CV events reduction (U.S./EU)
Aubagio® teriflunomide
Relapsing Multiple Sclerosis - Pediatric
sarilumab(**) Anti-IL6R mAb
Systemic Juvenile Arthritis
isatuximab
Anti-CD38 mAb
1L Newly Diagnosed MM Ti(4) (IMROZ)
cemiplimab(**) + REGN3767(1)
PD-1 inhibitor mAb + anti LAG-3 mAb
Advanced Cancers
O
isatuximab Anti-CD38 mAb
1-3L Relapsing Refractory MM (IKEMA)
Lemtrada® alemtuzumab
Relapsing Remitting Multiple Sclerosis - Pediatric
SAR439859 SERD + Palbociclib
Metastatic Breast Cancer
Registrational study (other than Phase 3) R
Opt-in rights products for which rights have not been exercised yet O
R
sutimlimab(2) Anti Complement C1s mAb
Immune Thrombocytopenia
isatuximab + cemiplimab(**) Anti-CD38 mAb + PD-1 inhibitor mAb
Advanced Malignancies
cemiplimab(**)
PD-1 inhibitor mAb
Advanced Basal Cell Carcinoma
R Fluzone® 0.5 mL QIV Quadrivalent inactivated
Influenza vaccine 6 months+
mavacamten(3)(**)
Myosin inhibitor
Non-Obstructive Hypertrophic Cardiomyopathy
SAR440340(**) Anti-IL33 mAb
COPD
Cerdelga®
eliglustat
Gaucher Type 1, switch from ERT - Pediatric
cemiplimab(**) + ipilimumab PD-1 inhibitor mAb + CTLA4 mAb
1L NSCLC <50% PDL1 +
Praluent®(**) alirocumab
LDL-C reduction - Pediatric
cemiplimab(**) + REGN4018(1)
PD-1 inhibitor mAb + Anti-MUC16-CD3 bispecific
mAb - Ovarian Cancer
O
cemiplimab(**) + REGN4659(1)
PD-1 inhibitor mAb + Anti-CTLA-4 mAb
NSCLC
O
dupilumab(**) Anti-IL4Rα mAb
Grass Immunotherapy
dupilumab(**) Anti-IL4Rα mAb
Asthma 12y+ (EU)
Diabetes
MS & Neuro
Vaccines
Cardiovascular & metabolism
cemiplimab(**)
PD-1 inhibitor mAb
2L NSCLC
venglustat
Oral GCS inhibitor
Gaucher related Parkinson’s Disease
isatuximab + atezolizumab(**) Anti-CD38 mAb + PD-L1 inhibitor mAb
Advanced Malignancies
cemiplimab(**) + ipilimumab
PD-1 inhibitor mAb + CTLA4 mAb
1L NSCLC ≥ 50% PDL1 +
isatuximab
Anti-CD38 mAb
Newly Diagnosed MM Te
Rare Blood Disorders
Rare Diseases
Immuno-inflammation
Oncology
sarilumab(**) Anti-IL6R mAb
Giant Cell Arteritis
sarilumab(**) Anti-IL6R mAb
Polymyalgia Rheumatica
dupilumab (**)+ AR101-CODIT
Anti-IL4Rα mAb Peanut Allergy - Pediatric

fitusiran RNAi therapeutic targeting anti-
thrombin Hemophilia A/B
Expected Submission Timeline(1)
38
2022 and beyond(2) 2019(2) 2020(2)
(1) Excluding Phase 1
(2) Projects within a specified year are not arranged by submission timing
(3) Submission strategy for the U.S. under evaluation
(4) Acid Sphingomyelinase Deficiency
(5) Also known as BIVV009; Currently operating as separate entities. Reported dates are
based on prior Bioverativ disclosure of study completion date
(6) Autosomal Dominant Polycystic Kidney Disease
(7) Also known as MEDI8897
(8) Gaucher Related Parkinson’s Disease
(**) Partnered and/or in collaboration – Sanofi may have limited or shared rights on some of
these products
NM
Es
Ad
dit
ion
al
Ind
icati
on
s Dupixent®(**)
dupilumab AD 6 months - 5 years old
GZ389988 TRKA antagonist
Osteoarthritis
SAR425899
GLP-1/GCG dual agonist
Obesity/Overweight in T2D
isatuximab anti-CD38 mAb
3L RRMM (ICARIA)
HIV Viral vector prime & rgp120 boost
vaccine
SAR156597 IL4/IL13 bi-specific mAb Systemic Scleroderma
efpeglenatide(**)
Long acting GLP1-R agonist Type 2 Diabetes
cemiplimab(**) PD-1 inhibitor mAb
1L NSCLC
cemiplimab(**) PD-1 inhibitor mAb 2L Cervical Cancer
Men Quad TT Adv. generation meningococcal
U.S.: 2y+ & EU: Toddlers+
SP0232 mAbs(7)(**) Respiratory syncytial virus
SAR422459 ABCA4 gene therapy
Stargardt Disease
avalglucosidase alfa Neo GAA
Pompe Disease
SAR407899 rho kinase
Microvascular Angina
dupilumab(**)
Anti-IL4Ra mAb Nasal Polyposis Adult
sarilumab(**) Anti-IL6R mAb
Polyarticular Juvenile Idiopathic Arthritis
Rabies VRVg Purified vero rabies vaccine
venglustat
Oral GCS inhibitor Fabry Disease
cemiplimab(**) PD-1 inhibitor mAb
Advanced BCC
Shan 6 DTP-HepB-Polio-Hib
Pediatric hexavalent vaccine
dupilumab(**) Anti-IL4Rα mAb
Asthma 6 - 11 years old
venglustat
Oral GCS inhibitor Gaucher Type 3
Dupixent®(**) dupilumab
AD 6 - 11 years old -
dupilumab(**) Anti-IL4Ra mAb
Eosinophilic Esophagitis
Fluzone® QIV HD Quadrivalent inactivated
Influenza vaccine - High dose
Adacel+ Tdap booster
ZynquistaTM(**)n
Oral SGLT-1&2 inhibitor Type 2 Diabetes
olipudase alfa rhASM
ASD(4)
Combination
ferroquine / OZ439(**) Antimalarial
venglustat
Oral GCS inhibitor GrPD(8)
Aubagio® teriflunomide
Relapsing MS – Ped.
sarilumab(**) Anti-IL6R mAb
Systemic Juvenile Arthritis
SAR341402
Rapid acting insulin Type 1/2 Diabetes - EU(3)
Pediatric pentavalent vaccine
DTP-Polio-Hib (Japan)
isatuximab
Anti-CD38 mAb (IMROZ)
1L Newly Diagnosed MM Ti
isatuximab
Anti-CD38 mAb
1-3L RRMM (IKEMA)
2021(2)
ZynquistaTM(**)
Oral SGLT-1&2 inhibitor
Worsening Heart Failure in
Diabetes
SAR440340(**)
Anti-IL33 mAb
Asthma
sutimlimab(5) Anti Complement C1s mAb
Cold Agglutinin Disease
SAR440340(**) Anti-IL33 mAb
COPD
venglustat
Oral GCS inhibitor
ADPKD(6)
Praluent®(**) alirocumab
LDL-C reduction - Pediatric
Cerdelga®
eliglustat Gaucher Type 1, switch from ERT –
Pediatric EU
ALX0171 Anti RSV Nanobody
Respiratory Syncitial Virus
Rare Blood Disorders
Rare Diseases
Immuno-inflammation
Diabetes
MS & Neuro
Vaccines
Oncology
Cardiovascular & metabolism
Pentacel® vIPV DTaP-IPV/Hib
isatuximab
Anti-CD38 mAb
Newly Diagnosed MM Te
sarilumab(**) Anti-IL6R mAb
Giant Cell Arteritis
sarilumab(**) Anti-IL6R mAb
Polymyalgia Rheumatica
SAR228810 Anti-protofibrillar AB mAb
Alzheimer’s Disease.
dupilumab (**)+ AR101-CODIT
Anti-IL4Rα mAb Peanut Allergy - Pediatric

Phase 1
39
Additions
Pipeline Movements Since Q2 2018
Removals
(**) Partnered and/or in collaboration – Sanofi may have limited or shared rights on some of these products
(1) U.S. filing pending acceptance by FDA
Phase 2
Phase 3
Registration
SAR442720(**) SHP2 inhibitor
Solid Tumors
SAR440234 T cell engaging multi spe mAb
Leukemia
isatuximab
Anti-CD38 mAb
Newly Diagnosed MM Te
isatuximab + atezolizumab(**) Anti-CD38 mAb + PD-L1 inhibitor mAb
Advanced Malignancies
sarilumab(**) Anti-IL6R mAb
Giant Cell Arteritis
sarilumab(**) Anti-IL6R mAb
Polymyalgia Rheumatica
Dupixent®(**)
dupilumab
Atopic Dermatitis 12 – 17 years old (U.S.(1)/EU)
dupilumab(**) Anti-IL4Rα mAb
Eosinophilic Esophagitis
dupilumab(**)+ AR101-CODIT
Anti-IL4Rα mAb Peanut Allergy - Pediatric

40
R&D Pipeline Summary – Total Projects(1)
Phase 1 Phase 2 Phase 3 Registration TOTAL
Immuno-inflammation 1 10 7 2 20
Oncology 13 5 8 1 27
Rare Diseases 0 4 3 0 7
Rare Blood Disorders 3 0 2 1 6
Multiple Sclerosis and
Neurology 3 2 2 0 7
Diabetes 1 1 4 1 7
Cardiovascular Disease 2 2 2 1 7
Vaccines 2 5 3 3 13
TOTAL 25
29 31 9
54 40
Total Projects 94
(1) Includes 6 Phase 1 products and 1 Phase 2 product for which Sanofi has Opt-in rights but has not yet exercised these rights

41
Expected R&D Milestones
Products Expected milestones Timing
Fluzone® QIV HD Phase 3 results for prevention of Influenza Q4 2018
efpeglenatide Start of Phase 3 in Type 2 Diabetes as add-on to basal insulins Q4 2018
Dupixent® U.S. FDA filing in Atopic Dermatitis in Adolescent patients Q4 2018
isatuximab Phase 3 results in Multiple Myeloma in combination with PomDex (ICARIA) Q1 2019
dupilumab U.S. sBLA filing in Nasal Polyposis Q1 2019
dupilumab Start of Phase 2b/3 trial in Chronic Obstructive Pulmonary Disease Q1 2019
Dupixent® EU regulatory decision in Asthma in Adult/Adolescent patients Q1 2019
Dupixent® U.S. regulatory decision in Atopic Dermatitis in Adolescent patients Q1 2019
ZynquistaTM (sotagliflozin) EU regulatory decision expected in Type 1 Diabetes Q1 2019
ZynquistaTM (sotagliflozin) U.S. regulatory decision expected in Type 1 Diabetes Q1 2019
Praluent® EU regulatory decision in CV events reduction ODYSSEY OUTCOMES Q1 2019
Cablivi® (caplacizumab) U.S. regulatory decision in acquired Thrombotic Thrombocytopenic Purpura Q1 2019
Praluent® U.S. regulatory decision in CV events reduction ODYSSEY OUTCOMES Q2 2019
cemiplimab EU regulatory decision expected in Advanced Cutaneous Squamous Cell Carcinoma Q2 2019
BIVV001 Expected proof of concept study read-out in Hemophilia A H1 2019
Dupixent® EU regulatory decision in Atopic Dermatitis in Adolescent patients Q3 2019
sutimlimab Expected pivotal trial read-out in Cold Agglutinin Disease H2 2019