Embed Size (px)
Citation preview
FY 2017FINANCIAL RESULTS
March 1st, 2018
1. Highlights
2. FY Financial Performance Analysis
3. Appendix
2
FY 2017 Results
Verallia FY 2017 Financial Results 01/03/2018

A very good financial performance throughout the year:
Revenue: €2,473.7 million, +4.5% (reported and at constant foreign exchange rates)
Adjusted EBITDA: €504.1 million, up 7.9% (+8.2% at constant foreign exchange rates)
Adjusted EBITDA margin at 20.4%, up by 70 bps
Strong operating cash-flow generation: €357.8 million, up €115.1 million vs 2016
Continuous deleveraging, with a net debt of €1,848.9 million, 3.7x Adjusted EBITDA at December
31, 2017, vs 4.2x at December 31, 2016
Good level of liquidity available, after early repayment of €100 million of the Term Loan B facility:
€220 million of cash on hand as well as an undrawn RCF of €250 million.
2017 HIGHLIGHTS
Verallia FY 2017 Financial Results 01/03/2018 3

4
1. Highlights
2. FY Financial Performance Analysis
3. Appendix
FY 2017 Results
Verallia FY 2017 Financial Results 01/03/2018

GROUP REVENUE UP 4.5%
Overall insignificant impact of foreign exchange rates variations:
Weakening of the Argentinean peso and Ukrainian hryvnia offset by the appreciation of the Brazilian real and Russian ruble.
Revenue increase driven by volumes (mainly wine and beer), and a slightly better mix in both regions.
(In M€)
Verallia FY 2017 Financial Results 01/03/2018 5

Current exchange rates
Constant exchange rates
2,100.2
2,177.1
FY 2016 FY 2017
2,100.2
2,169.8
FY 2016 FY 2017
EUROPE REPORTED REVENUE UP 3.7%
Positive impact of foreign exchange
rates variation (+0.4%), mainly due to
the appreciation of the Russian ruble.
At constant exchange rates, revenue
increase of 3.3% supported by:
Higher volumes in most countries,
notably in France and Iberia
A slightly better mix.
(In M€)
Verallia FY 2017 Financial Results 01/03/2018 6
Current exchange rates
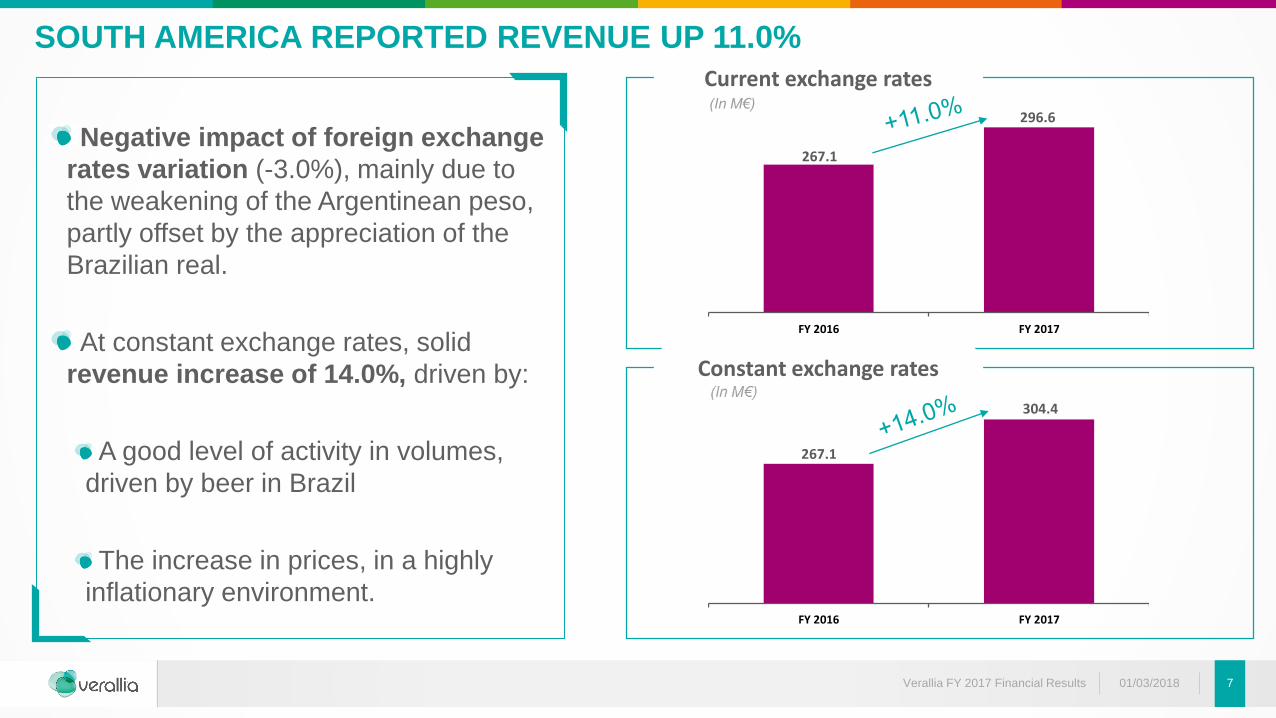
267.1
296.6
FY 2016 FY 2017
267.1
304.4
FY 2016 FY 2017
SOUTH AMERICA REPORTED REVENUE UP 11.0%
Negative impact of foreign exchange
rates variation (-3.0%), mainly due to
the weakening of the Argentinean peso,
partly offset by the appreciation of the
Brazilian real.
At constant exchange rates, solid
revenue increase of 14.0%, driven by:
A good level of activity in volumes,
driven by beer in Brazil
The increase in prices, in a highly
inflationary environment.
Constant exchange rates
(In M€)
Verallia FY 2017 Financial Results 01/03/2018 7
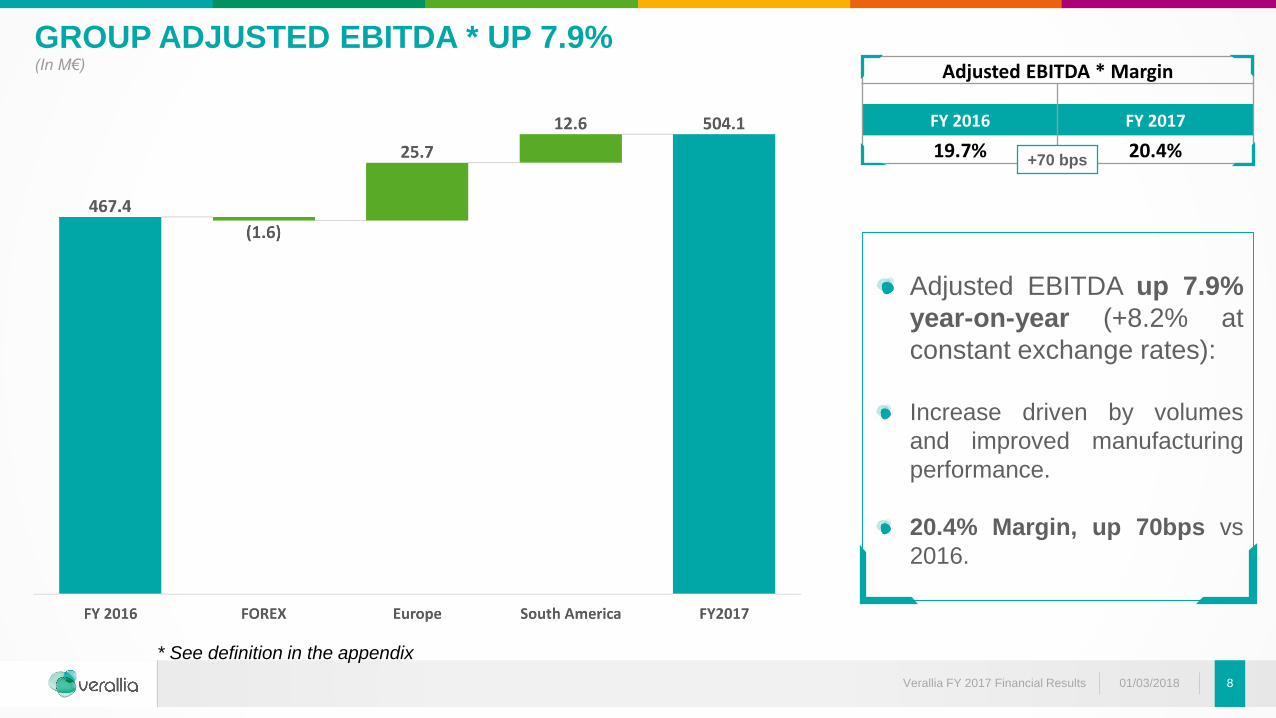
GROUP ADJUSTED EBITDA * UP 7.9% (In M€)
Verallia FY 2017 Financial Results 01/03/2018 8
Adjusted EBITDA up 7.9%
year-on-year (+8.2% at
constant exchange rates):
Increase driven by volumes
and improved manufacturing
performance.
20.4% Margin, up 70bps vs
2016.
Adjusted EBITDA * Margin
FY 2016 FY 2017
19.7% 20.4%+70 bps
* See definition in the appendix

393.2
420.4
FY 2016 FY 2017
393.2
418.9
FY 2016 FY 2017
EUROPE ADJUSTED EBITDA UP 6.9%
Constant exchange rates
Current exchange rates(In M€)
Verallia FY 2017 Financial Results 01/03/2018 9
Adjusted EBITDA Margin
FY 2016 FY 2017
18.7% 19.3%+60 bps
Robust 6.5% increase of Adjusted EBITDA at constant exchange rates, driven by:
Higher volumes,
An improved manufacturing performance.
Selling prices overall stable. (In M€)

74.2
83.7
FY 2016 FY 2017
74.2
86.8
FY 2016 FY 2017
SOUTH AMERICA ADJUSTED EBITDA UP 12.8%
Constant exchange rates
Current exchange rates(In M€)
Verallia FY 2017 Financial Results 01/03/2018 10
Adjusted EBITDA Margin
FY 2016 FY 2017
27.8% 28.2%+40 bps
Strong 17.0% increase of Adjusted EBITDA at constant exchange rates, driven by:
A high level of activity in volumes,
The pass-through of local inflation into sales prices.
(In M€)

LOWER RECURRING CAPEX THAN IN 2016
FY 2016 FY 2017
234.6
4.3
Recurring capex Strategic investments
Recurring Capex % of revenue
9.9%
Recurring Capex % of revenue
8.3%
(In M€)
Major recurring capex include significant furnace repairs in Europe: France (Vauxrot and
Cognac), Spain (Azuqueca and Zaragossa), Italy (Dego) and Germany (Wirges).
Strategic investments mainly consist in the start of a greenfield project in Brazil (future
relocation of our Sao Paolo plant in Jacutinga, Minas Gerais) as well as the acquisition of
Charentaise de Décor in France for an amount of €4.7 million.
Verallia FY 2017 Financial Results 01/03/2018 11
206.1
34.3
Recurring capex Strategic investments
240.4238.9
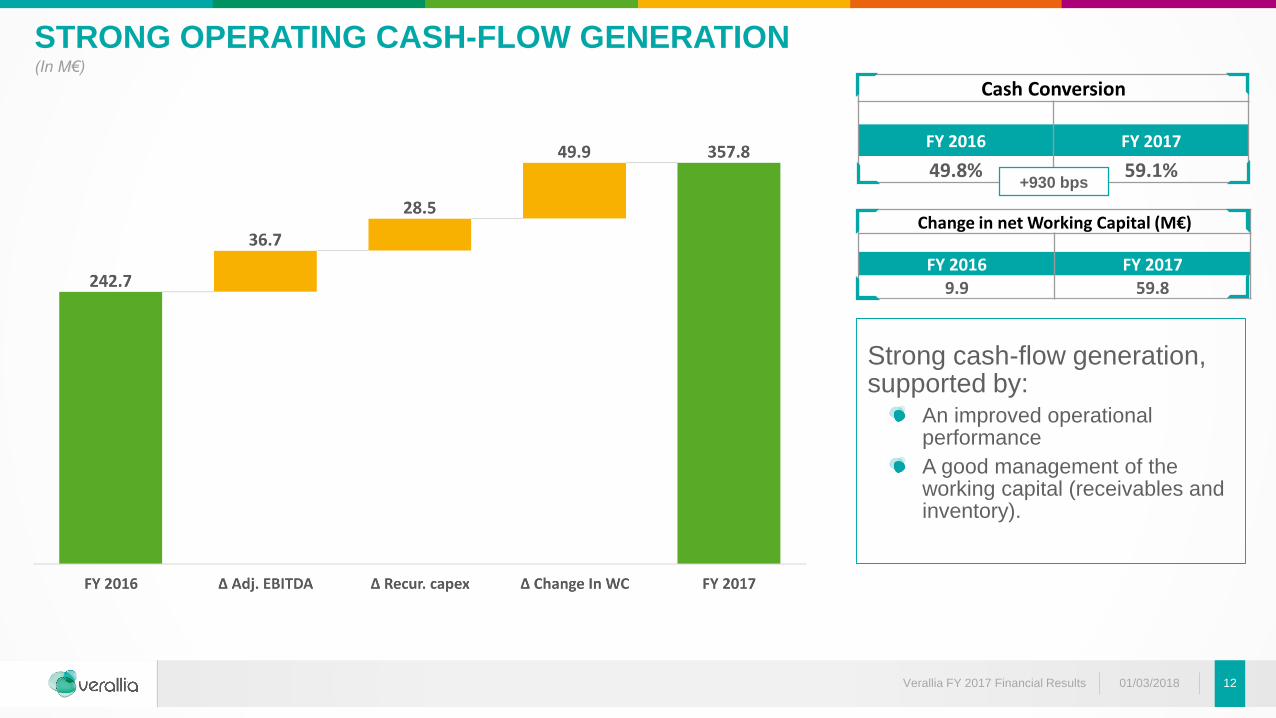
Change in net Working Capital (M€)
FY 2016 FY 20179.9 59.8
Strong cash-flow generation, supported by:
An improved operational performance
A good management of the working capital (receivables and inventory).
Cash Conversion
FY 2016 FY 2017
49.8% 59.1%
STRONG OPERATING CASH-FLOW GENERATION(In M€)
Verallia FY 2017 Financial Results 01/03/2018 12
+930 bps
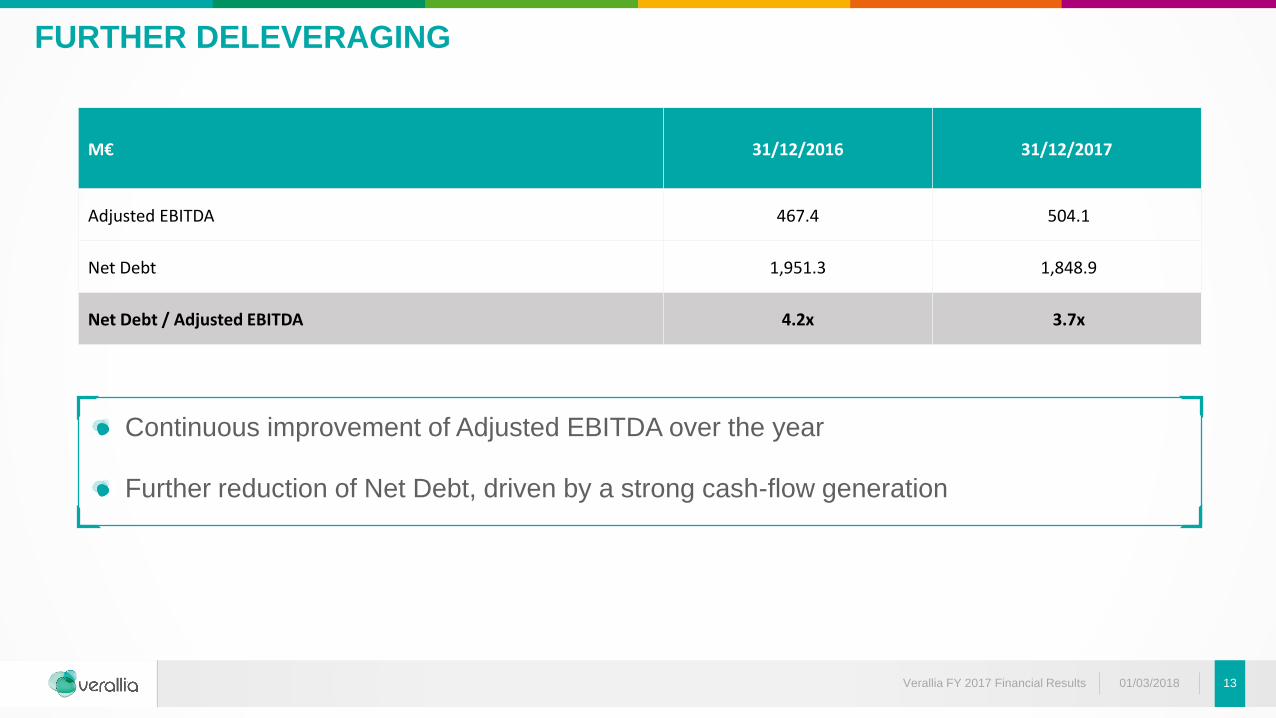
FURTHER DELEVERAGING
M€ 31/12/2016 31/12/2017
Adjusted EBITDA 467.4 504.1
Net Debt 1,951.3 1,848.9
Net Debt / Adjusted EBITDA 4.2x 3.7x
Verallia FY 2017 Financial Results 01/03/2018 13
Continuous improvement of Adjusted EBITDA over the year
Further reduction of Net Debt, driven by a strong cash-flow generation

FINANCING AT DECEMBER 31, 2017
M€Nominal amount or maximum amount
drawableNominal rate Final maturity
Amount drawn at December 31, 2017
Senior Secured Notes 500.0 5.125% 8/1/2022 502.7
Senior Notes 225.0 7.25% 8/1/2023 228.8
Revolving Credit Facility 250.0 Euribor +3.00% 10/29/2021 0.3
Term Loan B 1,275.0 Euribor +2.75% 10/29/2022 1,269.8
Other debt including recourse factoring 67.4
Total borrowings 2,069.0
Cash (220.1)
Net Debt 1,848.9
Verallia FY 2017 Financial Results 01/03/2018 14
On November 3rd: early €100m repayment of the TLB

OUTLOOK FOR 2018
Dynamic european markets driven by positive macroeconomics
Good activity expected in South America in a challenging context
Further growth in Revenue (at constant foreign exchange rates)
Further Adjusted EBITDA improvement (at constant foreign exchange rates)
Recurring capex around €200 million (8% of revenue).
Verallia FY 2017 Financial Results 01/03/2018 15
16
1. Highlights
2. FY Financial Performance Analysis
3. Appendix
FY 2017 Results
Verallia FY 2017 Financial Results 01/03/2018

UPDATED ADJUSTED EBITDA: RECONCILIATION TO NET INCOME (*)
01/03/2018 17
NET INCOME FY 2016 FY 2017
Net Income (5.8) 26.5
• Finance costs - net 139.8 113.0
• Income tax (22.9) 20.7
• Depreciation and amortization 280.4 290.1
• Impairment of fixed assets - 35.4
• Restructuring costs 4.4 2.8
• Acquisition & other transaction related costs 4.8 3.0
• Carve-out costs 8.5 0.1
• Share in profit from associates net of dividend received 2.4 0.2
• Share-based compensation 2.1 3.2
• Gains or losses on disposals (0.4) 0.7
• Other exceptional items 54.1 8.4
Adjusted EBITDA 467.4 504.1
Verallia FY 2017 Financial Results
(*) As published in our FY 2017 audited consolidated financial statements

CAPITALISATION AT HORIZON HOLDINGS I S.A.S.
01/03/2018 18
Existing interest
M€ Amount X Adjusted EBITDA Maturity Margin / Coupon Floor
December 2017 Adjusted EBITDA 504.1
Cash (220) (0.4) X
Revolving Credit Facility - - Oct-21 E + 300 bps 0.00%
Term Loan B 1,275 2.5 X Oct-22 E + 275 bps 0.00%
Senior Secured Notes 500 1.0 X Aug-22 5.125%
Net Senior Secured Debt (excluding factoring and others) (1) 1,555 3.1 X
Recourse factoring and others (2) 69 0.1 X
Net Senior Secured Debt (1) 1,624 3.2 X
Senior Notes 225 0.5 X Aug-23 7.25%
Total Net Debt (1) 1,849 3.7 X
(1) Represents information on a consolidated basis at Horizon Holdings I level
(2) Includes mainly interests, third party debt and finance leases.
Verallia FY 2017 Financial Results
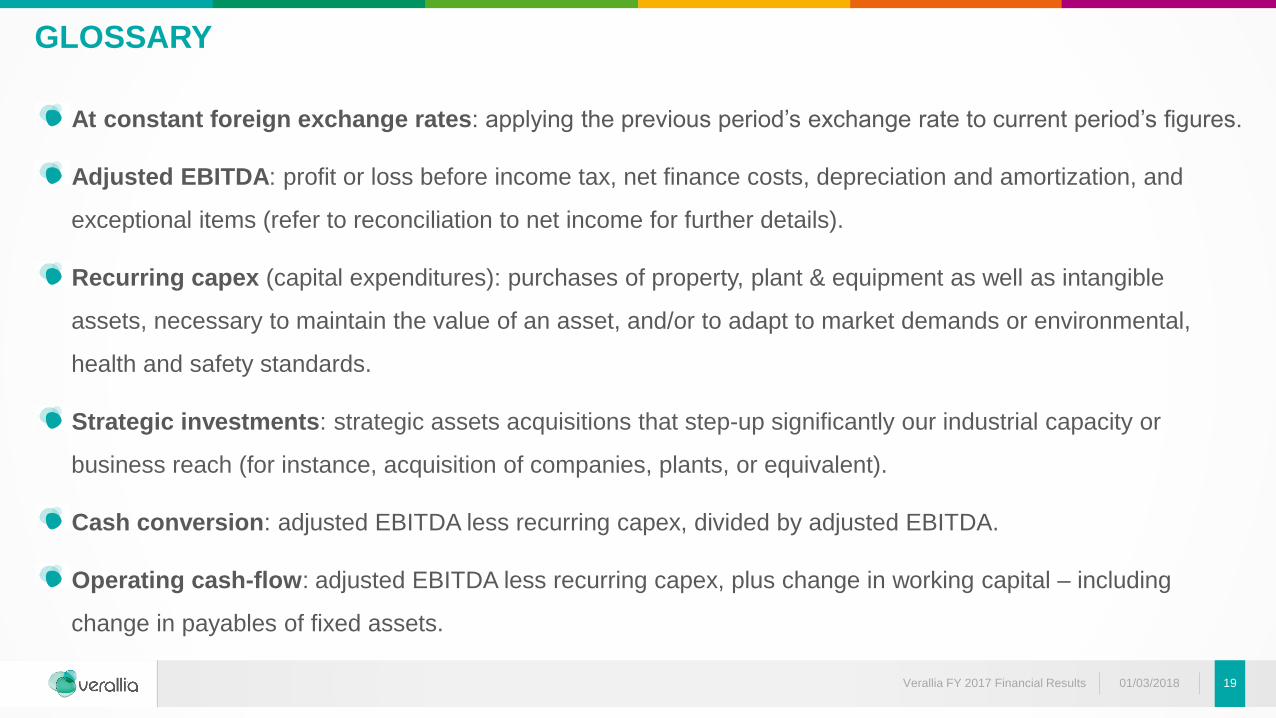
GLOSSARY
At constant foreign exchange rates: applying the previous period’s exchange rate to current period’s figures.
Adjusted EBITDA: profit or loss before income tax, net finance costs, depreciation and amortization, and
exceptional items (refer to reconciliation to net income for further details).
Recurring capex (capital expenditures): purchases of property, plant & equipment as well as intangible
assets, necessary to maintain the value of an asset, and/or to adapt to market demands or environmental,
health and safety standards.
Strategic investments: strategic assets acquisitions that step-up significantly our industrial capacity or
business reach (for instance, acquisition of companies, plants, or equivalent).
Cash conversion: adjusted EBITDA less recurring capex, divided by adjusted EBITDA.
Operating cash-flow: adjusted EBITDA less recurring capex, plus change in working capital – including
change in payables of fixed assets.
1901/03/2018Verallia FY 2017 Financial Results

DISCLAIMERThe presentation shall mean and include the information contained herein (unless otherwise indicated), the slides, the oral presentation of the slides by the Group (as defined here in) or any person on its behalf, any question-and-answer that follows the oral presentation, hard copies of this
document and any materials distributed in connection with the presentation. This presentation has been prepared by Verallia (and together with its subsidiaries, the “Group”) pertaining to the release of its quarterly financial statements. By attending this presentation or otherwise viewing this
presentation, or having access to the corresponding information, you (the “Recipient”) agree to be bound by the following conditions. This presentation and its contents are strictly confidential and may not be distributed, published or reproduced, in whole or in part, by any mean or in any form. Any
failure to comply with these restrictions may constitute a violation of applicable securities laws.
This presentation does not constitute or form part of, and should not be construed as, an offer or invitation to subscribe for or purchase any securities of Horizon Holdings I S.A.S. or Verallia Packaging S.A.S. (together, “Horizon”), nor should it or any part of it form the basis of, or be relied on in
connection with, any contract to purchase or subscribe for any securities of Horizon. Any offer of securities of Horizon, if and when made, will be made by means of an offering memorandum. Any person considering the purchase of any securities of Horizon must inform himself independently
based solely on such offering memorandum (including any supplement thereto). This presentation is made available to you solely for your information and is not to be used as a basis for investment decision in securities of Horizon. The presentation does not constitute investment, legal,
accounting, regulatory, taxation or other advice. No public offering of the securities is being made in the United States or in other jurisdictions where it would be prohibited.
This presentation may contain projections and forward-looking statements. These projections have been prepared, and forward-looking statements been made, in good faith and on the basis of recent available information and reasonable assumptions. There can be no assurance that the Group’s
expectations, beliefs or projections will ever be achieved. Numerous inherent risks and uncertainties, which are difficult to predict and are generally beyond our control, could cause the Group’s actual results to differ, as the case may be materially, from those expressed in, or implied by, such
projections and forward-looking statements. All projections and forward-looking statements apply only as of the date hereof and we undertake no obligation to update or revise this information, whether as a result of new information, future events or otherwise. The information contained herein is
provided as at the date of this presentation and is subject to change without notice and will not be updated to reflect material developments that may occur after the date of this presentation. Statements contained in this presentation regarding past trends or events should not be taken as a
representation that such trends or events will continue in the future.
No representation or warranty, express or implied, is or will be made as to and no reliance should be placed on, the fairness, completeness or correctness of the information contained herein. Without prejudice to the foregoing, the information in this presentation is being provided on a non-
reliance basis, and neither the Group nor any of its equity holders or any of its or their advisors or their respective affiliates owe or assume any duty, liability or responsibility (in negligence or otherwise) to the Recipient or any other person who has access to this presentation or the corresponding
information (or any part of it) for any information or opinion contained in it (including inter alia projections and forward-looking statements), or any omission from it, nor do they accept any liability whatsoever for any loss howsoever arising, directly or indirectly, from any use of or reliance on this or
its contents or otherwise arising in connection herewith. As a result, the Recipient should conduct and will be solely responsible for its own independent investigation and analysis of the Group after giving effect to the acquisition of Verallia.
The Recipient understands that in order to be eligible to view this presentation, the Recipient must be (i) outside the United States in accordance with Regulation S (“Regulation S”) under the Securities Act of 1933, as amended (the “Securities Act”) or (ii) a qualified institutional buyers (“QIB”) in
accordance with Rule 144A (“Rule 144A”) of the Securities Act, and by accepting the presentation, the Recipient warrants that it is (i) outside the United States in accordance with Regulation S or (ii) a QIB. The Recipient further understands that in order to be eligible to view the presentation, the
Recipient must be a person: (i) who has professional experience in matters relating to investments being defined in Article 19(5) of the United Kingdom Financial Services and Markets Act 2000 (Financial Promotion) Order 2005 (as amended) (the “Order”), (ii) who falls within Article 49(2)(a)-(d) of
the Order, (iii) who is outside the United Kingdom, or (iv) to whom an invitation or inducement to engage in an investment activity (within the meaning of section 21 of the United Kingdom Financial Services and Markets Act 2005) in connection with the issue or sale of any securities may otherwise
be lawfully communicated or caused to be communicated (all such persons together being referred to as “Relevant Persons”), and by accepting this presentation, the Recipient warrants that it is a Relevant Person. In relation to each Member State of the European Economic Area that has
implemented Directive 2003/71/EC, as amended (the “Prospectus Directive”), this presentation and any related presentation may only be distributed to and accessed by (a) legal entities which are qualified investors as defined in the Prospectus Directive or (b) in any other circumstances falling
within Article 3(2) of the Prospectus Directive, provided that no such offer of securities of Horizon shall result in a requirement for the publication by Horizon or any other person of a prospectus pursuant to Article 3 of the Prospectus Directive.
Certain financial data included in the presentation consists of “non-IFRS financial measures.” These non-IFRS financial measures may not be comparable to similarly titled measures presented by other companies, nor should they be construed as an alternative to other financial measures
determined in accordance with IFRS. You are cautioned not to place undue reliance on any non-IFRS financial measures and ratios included herein.
01/03/2018Verallia FY 2017 Financial Results 20


![Unleashing the benefits of GPU Computing with ARM Mali – … · 2016-12-13 · Filter Speed-up [1] MotionBlur 3.5x Cloud 4.2x Labyrinth 3.8x TitleReflection 7.3x WhirlPinch 3.6x](https://img.dokumen.tips/doc/110x75/5f6418070ebb2567aa60cfa4/unleashing-the-benefits-of-gpu-computing-with-arm-mali-a-2016-12-13-filter-speed-up.jpg)
