Embed Size (px)
Citation preview

Zuers, April 6th - 9th, 2011Raiffeisen Centrobank Institutional Investors' Conference
PETROLRaiffeisen Centrobank Institutional Investors’ Conference

2
Zuers, April 6th - 9th, 2011Raiffeisen Centrobank Institutional Investors' Conference
Contents
1. Introduction2. Business Activities3. Investor Information
Appendix

3
Zuers, April 6th - 9th, 2011Raiffeisen Centrobank Institutional Investors' Conference
1. Introduction

4
Zuers, April 6th - 9th, 2011Raiffeisen Centrobank Institutional Investors' Conference
The Petrol Group� The leading Slovenian energy company.
� The principal strategic supplier of oil products and other energyproducts in Slovenia.
� Main activities: oil, gas and merchandise trading in Slovenia and in SE Europe and other energy and environmental activities.
� The Petrol Group: 32 companies, 10 countries, retail network of441 service stations as per 31.12.2010.
� The largest company and the largest group in terms of turnover in 2010 in Slovenia.
� Fourth largest company in terms of market capitalisation on theLjubljana Stock Exchange.

5
Zuers, April 6th - 9th, 2011Raiffeisen Centrobank Institutional Investors' Conference
The Petrol Group� Parent Company
Petrol d.d., Ljubljana
� Subsidiaries in SloveniaPetrol Maloprodaja Slovenija d.o.o., LjubljanaPetrol Skladiščenje d.o.o., LjubljanaPetrol Tehnologija d.o.o., LjubljanaPetrol Energetika d.o.o., Ravne na KoroškemPetrol VNC d.o.o., LjubljanaOgrevanje Piran d.o.o., Portorož
� Subsidiaries abroadAUSTRIA: Petrol-Trade Handelsges.m.b.H., ViennaCYPRUS: Cypet Oils Ltd., Limassol
Cypet-Trade Ltd., LimassolCROATIA: Petrol Hrvatska d.o.o., Zagreb
Euro - Petrol d.o.o., RijekaPetrol-Jadranplin d.o.o., ŠibenikPetrol-Butan d.o.o., Osijek
BOSNIA AND HERZEGOVINA: Petrol BH Oil Company d.o.o., Sarajevo
SERBIA: Petrol d.o.o., Beograd Petrol Gas Group d.o.o., Novi SadRodgas AD, Bačka Topola
MONTENEGRO: Petrol - Invest d.o.o., CetinjeMACEDONIA: Petrol – Energetika DOOEL, Skopje
� Joint VenturesInstalacija d.o.o., Koper, SloveniaGeoenergo d.o.o., Lendava, SloveniaSoenergetika d.o.o., Kranj, SloveniaPetrol – Bonus d.o.o., Cetinje, MontenegroPetrol – Oti – Slovenija L.L.C., Priština, KosovoPetrol Slovenia Tirana Wholesale SH.A., Tirana, AlbaniaPetrol Slovenia Tirana Distribution SH.P.K., Tirana, Albania
� Affiliated companiesAquasystems d.o.o., Maribor, SloveniaGeoplin d.o.o., Ljubljana, SloveniaMarche Gostinstvo d.o.o., Logatec, SloveniaIstrabenz d.d., Koper, SloveniaBio goriva d.o.o., Rače, Slovenia
6
Zuers, April 6th - 9th, 2011Raiffeisen Centrobank Institutional Investors' Conference
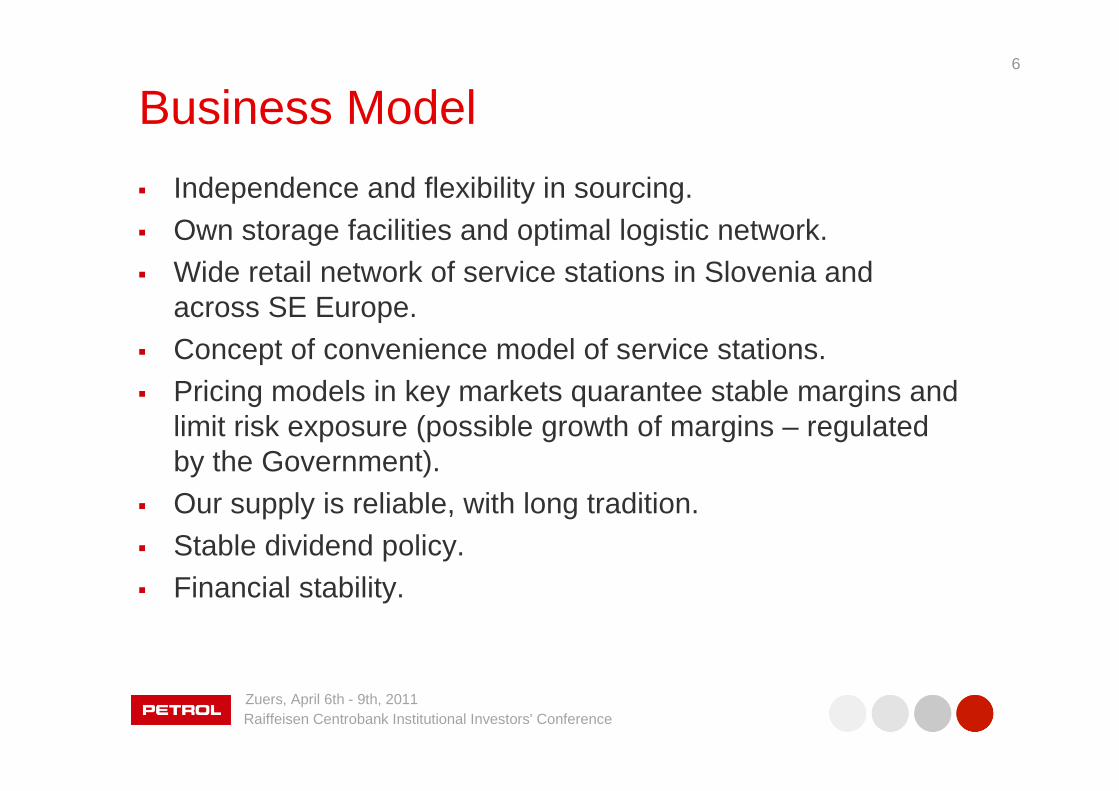
Business Model
� Independence and flexibility in sourcing.� Own storage facilities and optimal logistic network.� Wide retail network of service stations in Slovenia and
across SE Europe.� Concept of convenience model of service stations. � Pricing models in key markets quarantee stable margins and
limit risk exposure (possible growth of margins – regulatedby the Government).
� Our supply is reliable, with long tradition.� Stable dividend policy. � Financial stability.
7
Zuers, April 6th - 9th, 2011Raiffeisen Centrobank Institutional Investors' Conference
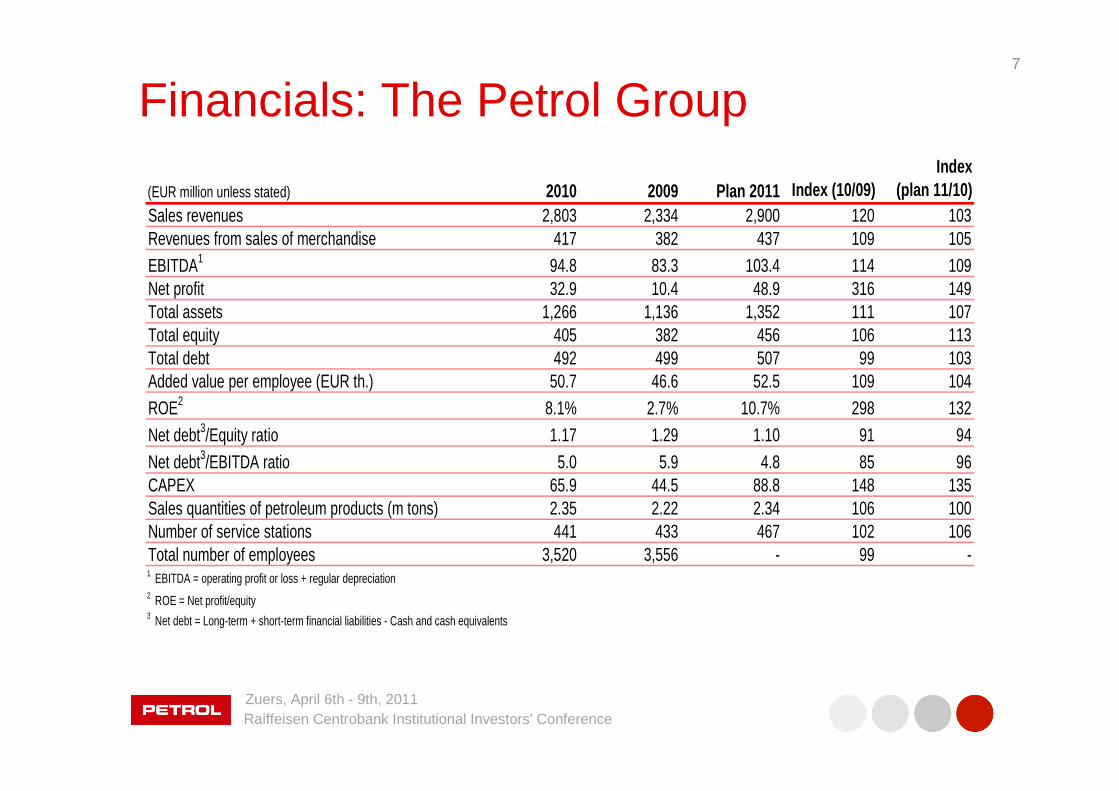
Financials: The Petrol Group
(EUR million unless stated) 2010 2009 Plan 2011 Index (10/09)Index
(plan 11/10)Sales revenues 2,803 2,334 2,900 120 103Revenues from sales of merchandise 417 382 437 109 105EBITDA1 94.8 83.3 103.4 114 109Net profit 32.9 10.4 48.9 316 149Total assets 1,266 1,136 1,352 111 107Total equity 405 382 456 106 113Total debt 492 499 507 99 103Added value per employee (EUR th.) 50.7 46.6 52.5 109 104ROE2 8.1% 2.7% 10.7% 298 132Net debt3/Equity ratio 1.17 1.29 1.10 91 94Net debt3/EBITDA ratio 5.0 5.9 4.8 85 96CAPEX 65.9 44.5 88.8 148 135Sales quantities of petroleum products (m tons) 2.35 2.22 2.34 106 100Number of service stations 441 433 467 102 106Total number of employees 3,520 3,556 - 99 -1 EBITDA = operating profit or loss + regular depreciation2 ROE = Net profit/equity3 Net debt = Long-term + short-term financial liabilities - Cash and cash equivalents
8
Zuers, April 6th - 9th, 2011Raiffeisen Centrobank Institutional Investors' Conference
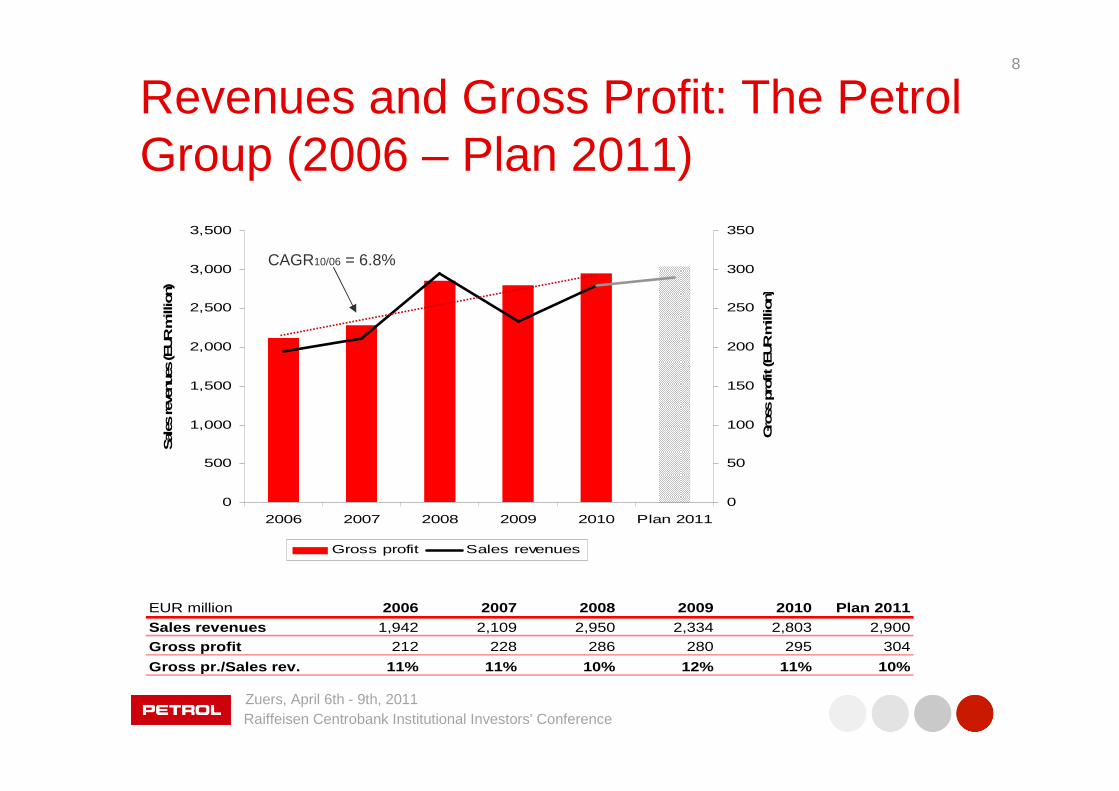
Revenues and Gross Profit: The Petrol Group (2006 – Plan 2011)
EUR million 2006 2007 2008 2009 2010 Plan 2011Sales revenues 1,942 2,109 2,950 2,334 2,803 2,900
Gross profit 212 228 286 280 295 304
Gross pr./Sales rev. 11% 11% 10% 12% 11% 10%
0
500
1,000
1,500
2,000
2,500
3,000
3,500
2006 2007 2008 2009 2010 Plan 2011
Sales
rev
enue
s (E
UR m
illion)
0
50
100
150
200
250
300
350
Gro
ss p
rofit (EUR m
illion)
Gross profit Sales revenues
CAGR10/06 = 6.8%
9
Zuers, April 6th - 9th, 2011Raiffeisen Centrobank Institutional Investors' Conference
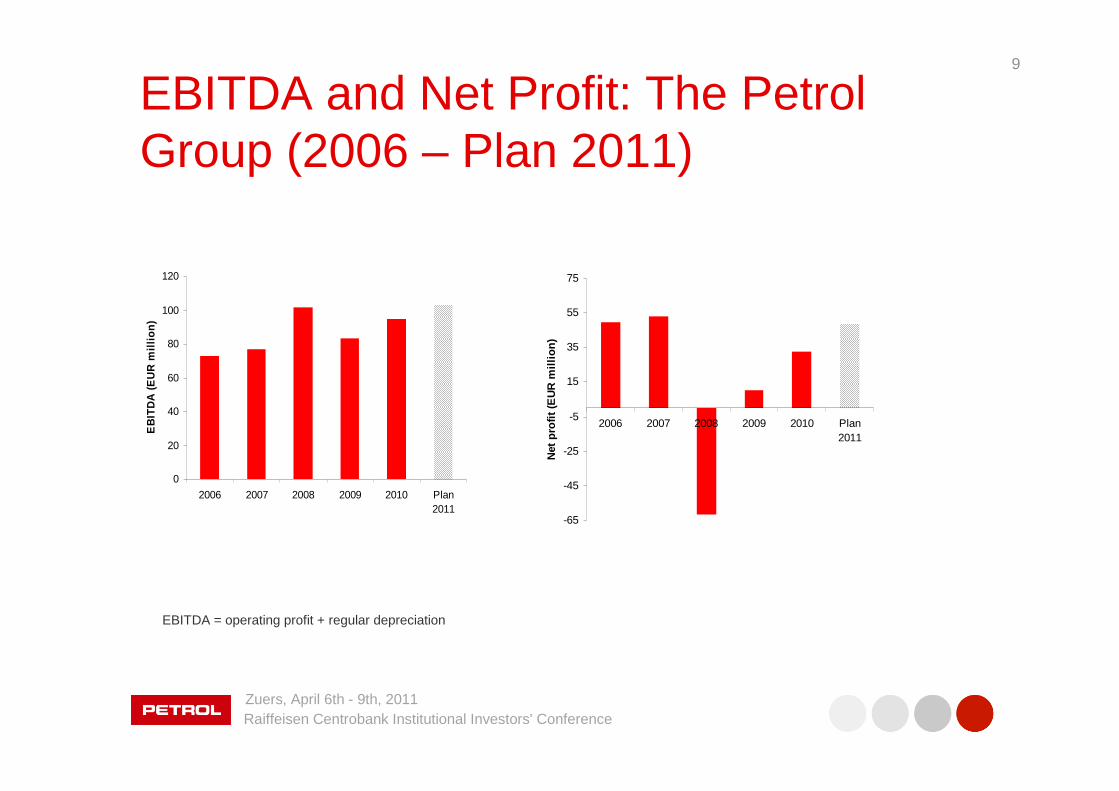
EBITDA and Net Profit: The Petrol Group (2006 – Plan 2011)
EBITDA = operating profit + regular depreciation
0
20
40
60
80
100
120
2006 2007 2008 2009 2010 Plan2011
EB
ITD
A (
EU
R m
illio
n)
-65
-45
-25
-5
15
35
55
75
2006 2007 2008 2009 2010 Plan2011
Net
pro
fit (
EU
R m
illio
n)

10
Zuers, April 6th - 9th, 2011Raiffeisen Centrobank Institutional Investors' Conference
Balance Debt Profile: The Petrol Group(2006 – Plan 2011)
Gearing ratio = Net debt / (Net debt + Equity and provisions) Net debt = Total debt – Cash and cash equivalents
388394
462425411
456
491520
409
156
475500
27%
52%
57%
47%
56%54%
0%
5%
10%
15%
20%
25%
30%
35%
40%
45%
50%
55%
60%
31.12.06 31.12.07 31.12.08 31.12.09 31.12.10 Plan 2011
Gea
ring
ratio
0
100
200
300
400
500
600
Equ
ity a
nd p
rovi
sion
s, N
et d
ebt (
EU
R m
illio
n)
Equity and provisions Net debt Gearing ratio

11
Zuers, April 6th - 9th, 2011Raiffeisen Centrobank Institutional Investors' Conference
Strategy 2010 - 2014� Mission: by providing a comprehensive range of energy and
environmental products and services, to secure reliable, economical and environmentally friendly supply to our customers in Slovenia and on the markets of SE Europe.
� Vision: to become a market player committed to meeting the highest quality and development standards relating to the comprehensive supply of energy products and the “convenience”model of service stations in SE Europe, ensuring above-average satisfaction of our customers.
� Key business areas: oil trading activity on the Slovenian market and on the markets of SE Europe (Croatia, Bosnia and Herzegovina, Serbia, Montenegro, Kosovo), and energy activity (gas, heat, electricity and environmental solutions).
12
Zuers, April 6th - 9th, 2011Raiffeisen Centrobank Institutional Investors' Conference
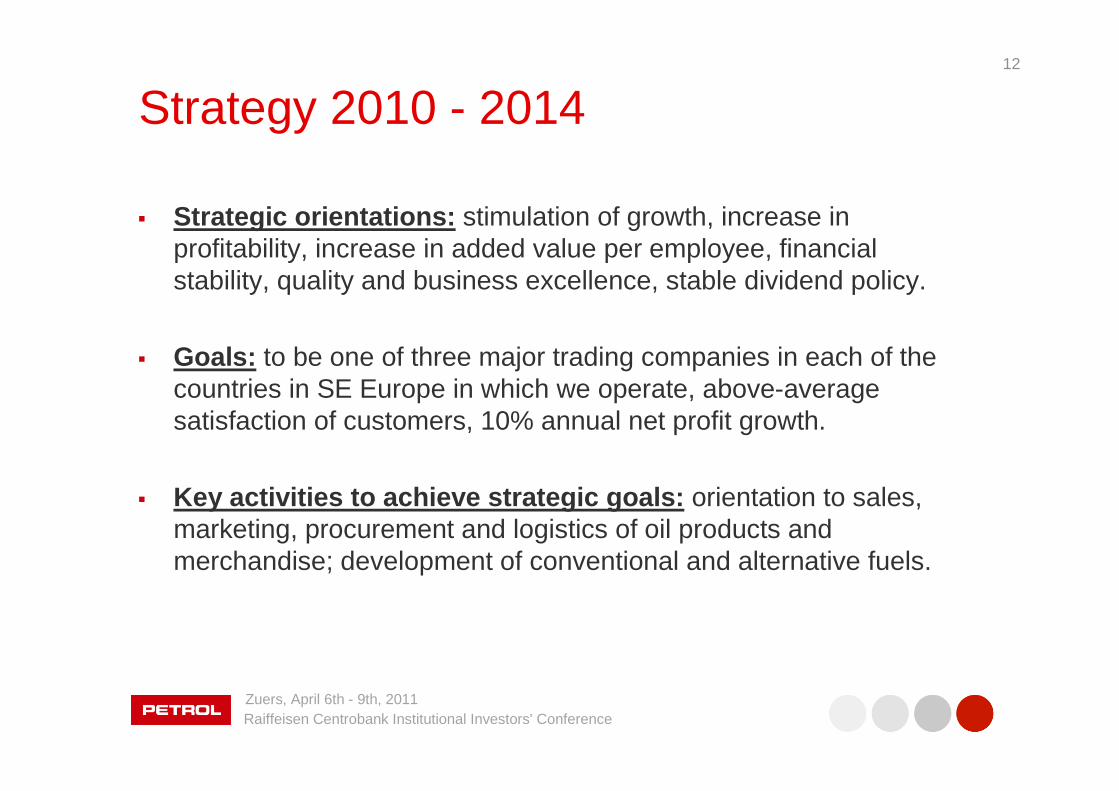
Strategy 2010 - 2014
� Strategic orientations: stimulation of growth, increase in profitability, increase in added value per employee, financial stability, quality and business excellence, stable dividend policy.
� Goals: to be one of three major trading companies in each of the countries in SE Europe in which we operate, above-average satisfaction of customers, 10% annual net profit growth.
� Key activities to achieve strategic goals: orientation to sales, marketing, procurement and logistics of oil products and merchandise; development of conventional and alternative fuels.

13
Zuers, April 6th - 9th, 2011Raiffeisen Centrobank Institutional Investors' Conference
Plan 2011 and Strategy 2014
(EUR million unless stated) Plan 2011 Strategy 2014Index
(strategy 14/plan 11)
Sales revenues 2,900 3,500 121EBITDA1 103 167 162
Net profit 48.9 73.1 149Added value per employee (EUR th.) 53 57 108ROE (%) 10.7 13.2 123
Net debt/Equity ratio 1.1 0.8 73Net debt/EBITDA ratio 4.8 3.0 63
Sales quantities of petroleum products (m tons) 2.34 2.8 120Number of service stations 467 570 122
Revenues from sales of merchandise 437 503 115Sales quantities of natural gas (m m3) 108 148 137Sales quantities of electricity (m kWh) 1,011 2,150 213
CAPEX2 88.8 428 -1 EBITDA = operating profit or loss + regular depreciation2 CAPEX in Strategy 2014 is for period 2010 - 2014

14
Zuers, April 6th - 9th, 2011Raiffeisen Centrobank Institutional Investors' Conference
2. Business Activities

15
Zuers, April 6th - 9th, 2011Raiffeisen Centrobank Institutional Investors' Conference
Retail Network of the Petrol Group31.12.2010 – Strategy 2014
31.12.2010 Strategy 2014

16
Zuers, April 6th - 9th, 2011Raiffeisen Centrobank Institutional Investors' Conference
Petroleum Activity in 2010� No. of service stations as per 31.12.2010: 441 (Slovenia 313,
Croatia 79, Bosnia and Herzegovina 38, Serbia 5, Montenegro3, Kosovo 3)
� Sales revenues from the petroleum activity: 2,688 million EUR(Index10/09 = 120)
� Sales quantities of petroleum products (74% in Slovenia andEU, 26% in SE Europe): 2.35 million tons (Index10/09 = 105)
� Revenues from sales of merchandise: 417 million EUR(Index10/09 = 109)
� Revenues from services: 29 million EUR (Index10/09 = 96)
� Market share: Slovenia 60%, Croatia 10%, Bosnia andHerzegovina 6%

17
Zuers, April 6th - 9th, 2011Raiffeisen Centrobank Institutional Investors' Conference
Energy Activity
Key processes on energy field
� Sales and distribution of natural
gas
� Sales and distribution of LPG
� Production, sales, distribution and
trading of electricity
� Production, sales and distribution of
heat
� Other energy services (efficient energy
consumption and renewable energy
projects, solar power stations)
� Environmental activities (wastewater
treatment plants, energy use of waste)
NATURAL GAS
salesdistribution
LPG
salesdistribution
ELECTRICITY
production sales
distribution trading
HEAT POWER
production sales
distribution
TOTAL ENERGY MANAGEMENT
OTHER ENERGYSERVICES
ENVIRONMENTAL ACTIVITIES
18
Zuers, April 6th - 9th, 2011Raiffeisen Centrobank Institutional Investors' Conference
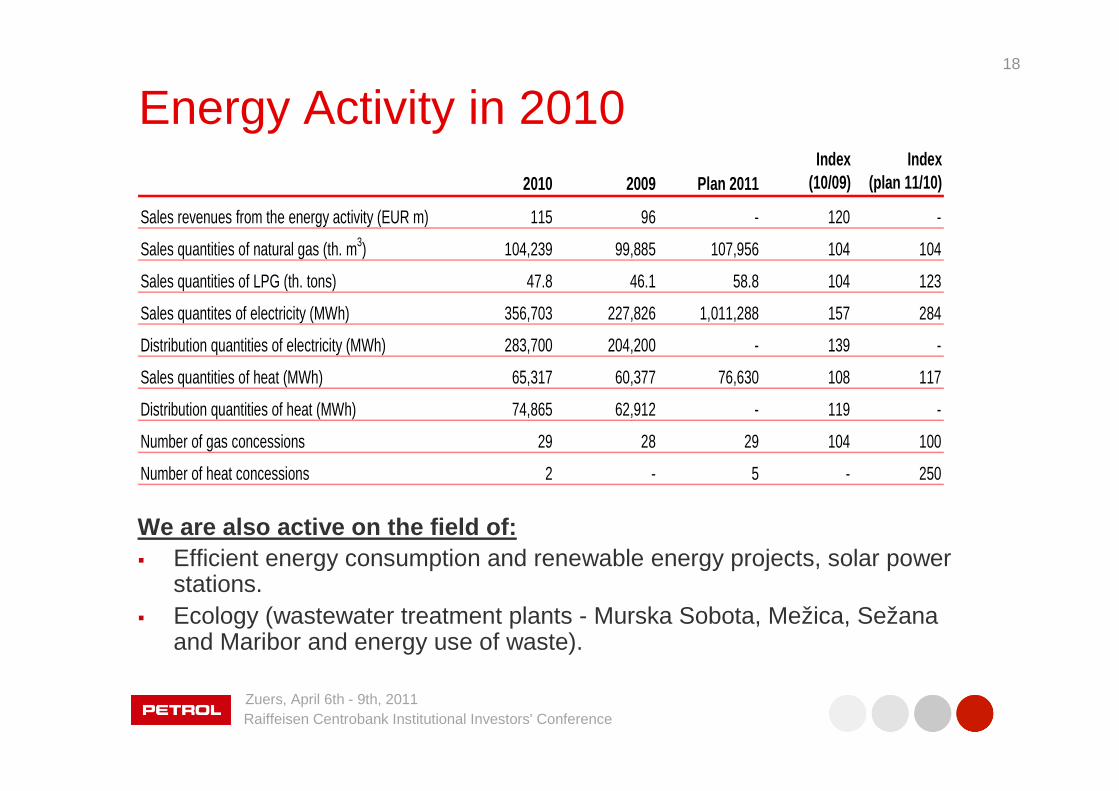
Energy Activity in 2010
We are also active on the field of:� Efficient energy consumption and renewable energy projects, solar power
stations.� Ecology (wastewater treatment plants - Murska Sobota, Mežica, Sežana
and Maribor and energy use of waste).
2010 2009 Plan 2011Index
(10/09)Index
(plan 11/10)
Sales revenues from the energy activity (EUR m) 115 96 - 120 -
Sales quantities of natural gas (th. m3) 104,239 99,885 107,956 104 104
Sales quantities of LPG (th. tons) 47.8 46.1 58.8 104 123
Sales quantites of electricity (MWh) 356,703 227,826 1,011,288 157 284
Distribution quantities of electricity (MWh) 283,700 204,200 - 139 -
Sales quantities of heat (MWh) 65,317 60,377 76,630 108 117
Distribution quantities of heat (MWh) 74,865 62,912 - 119 -
Number of gas concessions 29 28 29 104 100
Number of heat concessions 2 - 5 - 250

19
Zuers, April 6th - 9th, 2011Raiffeisen Centrobank Institutional Investors' Conference
Structure of Investments and EBITDA in 2010CAPEX = 65.9 million EUR EBITDA = 9 4.8 million EUR
12%
16%
72%
15%
36%
28%
21%
Petroleum activity in the Slovene market Petroleum activity in the markets of SE Europe
Energy activity Other

20
Zuers, April 6th - 9th, 2011Raiffeisen Centrobank Institutional Investors' Conference
3. Investor Information

21
Zuers, April 6th - 9th, 2011Raiffeisen Centrobank Institutional Investors' Conference
Shareholders Structure as at 15 March 2011
Others32%
Other institutional investors
22% Insurers1%
Banks15%
Treasury shares1% Slovene Indemnity
Fund20%
Kapitalska družba Group
9%
10 top shareholders of Petrol d.d., Ljubljana
Shareholder Share in %
1 SLOVENSKA ODŠKODNINSKA DRUŽBA, D.D. 19.75%
2 KAPITALSKA DRUŽBA, D.D. 8.27%
3 NLB d.d. 6.06%
4 ISTRABENZ D.D. 4.05%
5 GB d.d., Kranj 4.04%
6 ZVON ENA HOLDING, D.D. 3.79%
7 VIZIJA HOLDING, K.D.D. 3.44%
8 VIZIJA HOLDING ENA, K.D.D. 3.05%
9 NFD 1 DELNIŠKI INVESTICIJSKI SKLAD D.D. 2.96%
10 HYPO BANK D.D. 2.09%
11 OTHERS 42.51%
Sum 100.00%

22
Zuers, April 6th - 9th, 2011Raiffeisen Centrobank Institutional Investors' Conference
Petrol (PETG) on the Stock Exchange – Ratios I.Share price and transactions with Petrol share
200
240
280
320
360
400
4.1.
2010
25.1
.201
0
16.2
.201
0
9.3.
2010
30.3
.201
0
22.4
.201
0
14.5
.201
0
4.6.
2010
28.6
.201
0
19.7
.201
0
9.8.
2010
30.8
.201
0
20.9
.201
0
11.1
0.20
10
2.11
.201
0
23.1
1.20
10
14.1
2.20
10
6.1.
2011
27.1
.201
1
18.2
.201
1
11.3
.201
1
Sha
re p
rice
(EU
R)
0
500
1,000
1,500
2,000
2,500
Tra
nsac
tions
Share price Transactions
2009 2010 3. Jan. - 15. Mar. 2011
Number of shares 2,086,301 2,086,301 2,086,301
Average market capitalisation (EUR) 607,927,248 569,163,776 532,841,275
Capital yield (average y/y) -46.19% -6.38% -6.38%
Dividend yield 2.02% 2.16% -
Total yield -44.16% -4.21% -6.38%
23
Zuers, April 6th - 9th, 2011Raiffeisen Centrobank Institutional Investors' Conference
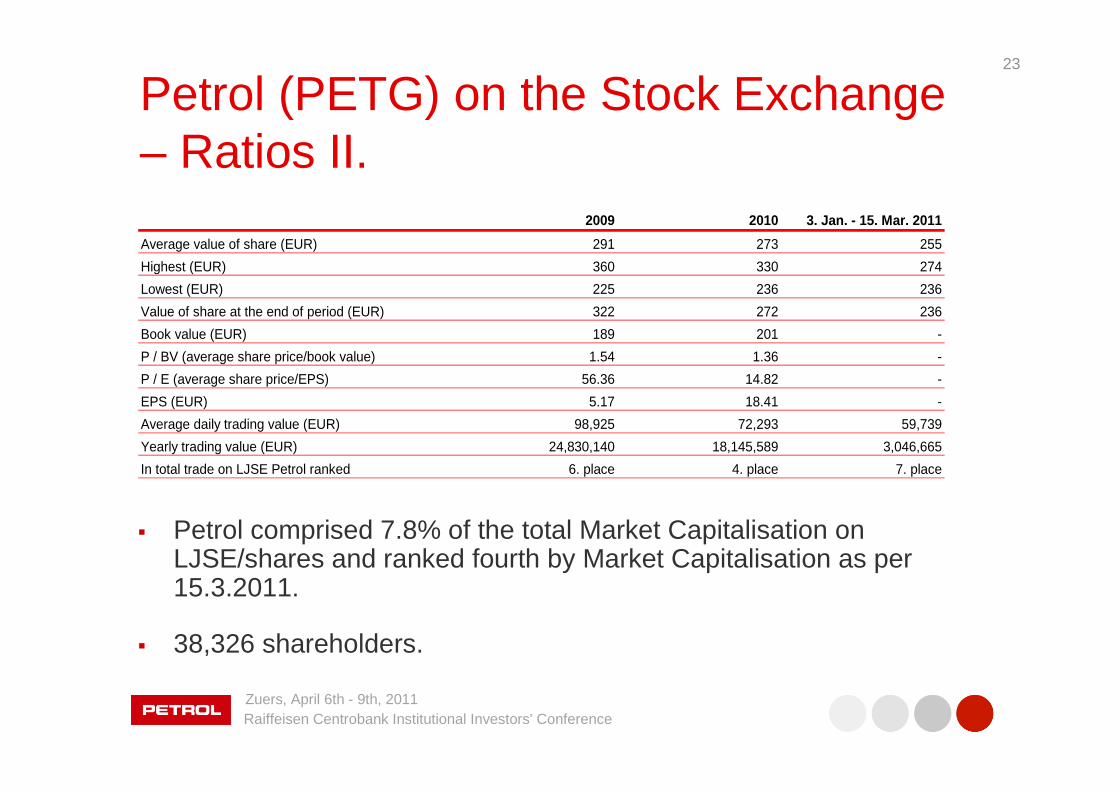
Petrol (PETG) on the Stock Exchange – Ratios II.
� Petrol comprised 7.8% of the total Market Capitalisation on LJSE/shares and ranked fourth by Market Capitalisation as per15.3.2011.
� 38,326 shareholders.
2009 2010 3. Jan. - 15. Mar. 2011
Average value of share (EUR) 291 273 255
Highest (EUR) 360 330 274
Lowest (EUR) 225 236 236
Value of share at the end of period (EUR) 322 272 236
Book value (EUR) 189 201 -
P / BV (average share price/book value) 1.54 1.36 -
P / E (average share price/EPS) 56.36 14.82 -
EPS (EUR) 5.17 18.41 -
Average daily trading value (EUR) 98,925 72,293 59,739
Yearly trading value (EUR) 24,830,140 18,145,589 3,046,665
In total trade on LJSE Petrol ranked 6. place 4. place 7. place

24
Zuers, April 6th - 9th, 2011Raiffeisen Centrobank Institutional Investors' Conference
Appendix: Slovenian Pricing Model� Legal basis: Regulation on Oil Product Prices(Official Gazette RS No. 76/2010); valid until8.10.2011.
� The regulation provides measures andmechanisms for defining the highest level ofnet selling prices.
� The conversion of selling prices is carried outeach 14 days (on Mondays) in accordancewith the shown formula.
� The established model selling price, valid asfrom Tuesday, is based on averagequotations and EUR/USD exchange ratevalid in the past 14-day period.
� Margin (M) is fixed and amounts to:� Motor gasoline: 8.363 €cent/litre,� Diesel: 7.841 €cent/litre,� Gasoil 0.1: 5.162 €cent/litre.
Formula for the calculation of net selling prices:
Mrn
eCIFMedHP
n
iii
t ++
⋅
⋅=
∑=
10001 ρ
where it means:
Pt: model price of oil derivative in EUR/l
ρ: density of oil derivativer: contribution for merchandise reserve in EUR/lM: profit margin of distributorsi: daily datat: 14-days interval of current periodn = 14e: 1 USD = x EURCIF Med H: exchange quotation of derivative
25
Zuers, April 6th - 9th, 2011Raiffeisen Centrobank Institutional Investors' Conference
Contact Persons
Janez Živko, MBA
Member of the Management Board, CFO
� Tel: +386 1 471 4415
� Fax: +386 1 471 4660
� E-mail: [email protected]
Barbara Jama Živali č, M.Sc.
Head of Investor Relations
� Tel: +386 1 471 4880
� Fax: +386 1 471 4158
� E-mail: [email protected]