Embed Size (px)
Citation preview

www.free-ppt -templates.com Presentation on 07.06.2016
AP HRDI , Bapatla
Dr. J. Sesha Srinivas
Sr. Scientist , EPTRI
Environment Protection Training & Research Institute (EPTRI)
91/4, Gachibowli, Hyderabad -32, Telangana
[email protected], 040-23180106
www.free-ppt -templates.com
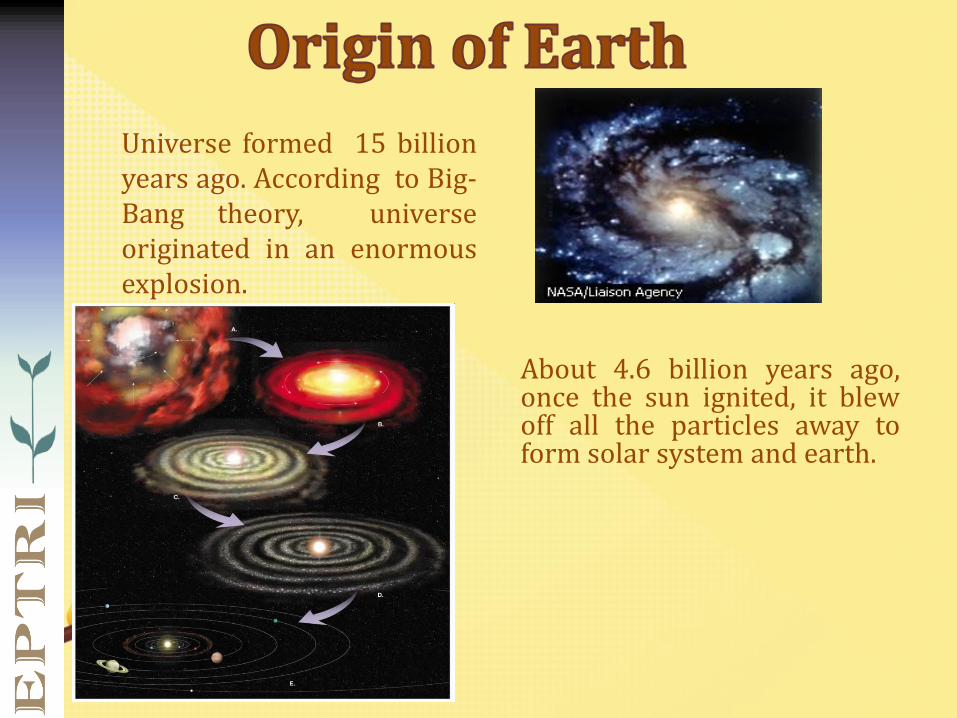
About 4.6 billion years ago,once the sun ignited, it blewoff all the particles away toform solar system and earth.
Universe formed 15 billionyears ago. According to Big-Bang theory, universeoriginated in an enormousexplosion.

www.free-ppt -templates.com
Formation of Earth’s Oceans
(4 bybp):
Rain
Condensation
water vapor from volcano

www.free-ppt -templates.com
Life began~ 3.5 bya Organic molecules (C H O N P S) swimming in
shallow seas
Stage 1: Abiotic synthesis of organic molecules such as
proteins, amino acids and nucleotides
Stage 2: Joining of small molecules (monomers) into large
molecules
Stage 3: Origin of self-replicating molecules that eventually
made inheritance possible
Stage 4: Packaging these molecules into pre-cells, droplets of
molecules with membranes that maintained an internal
chemistry
www.free-ppt -templates.com
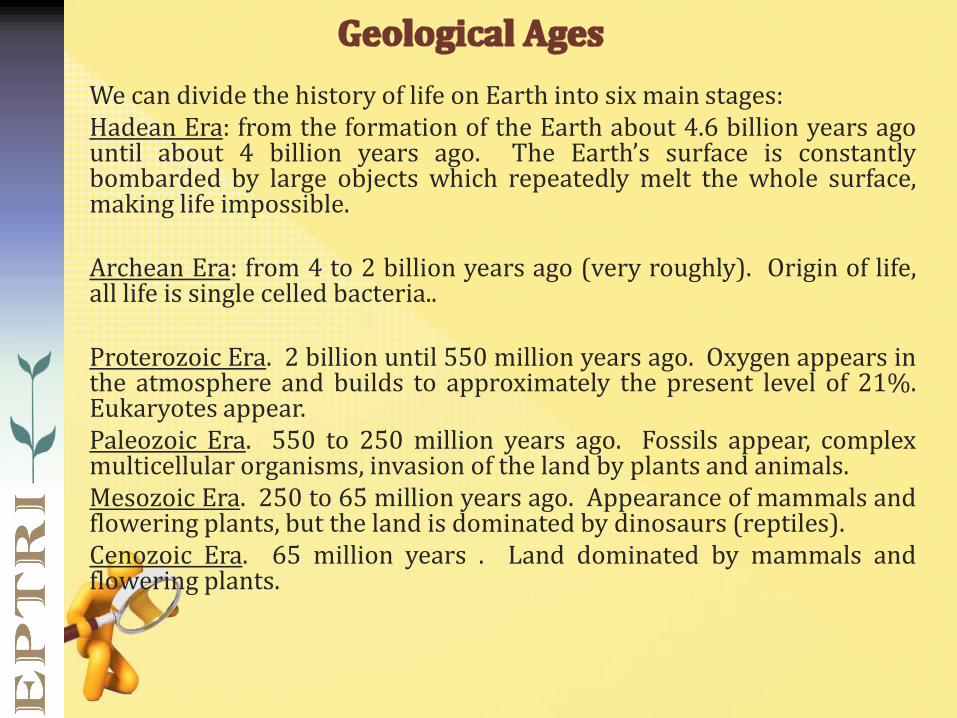
We can divide the history of life on Earth into six main stages:Hadean Era: from the formation of the Earth about 4.6 billion years agountil about 4 billion years ago. The Earth’s surface is constantlybombarded by large objects which repeatedly melt the whole surface,making life impossible.
Archean Era: from 4 to 2 billion years ago (very roughly). Origin of life,all life is single celled bacteria..
Proterozoic Era. 2 billion until 550 million years ago. Oxygen appears inthe atmosphere and builds to approximately the present level of 21%.Eukaryotes appear.Paleozoic Era. 550 to 250 million years ago. Fossils appear, complexmulticellular organisms, invasion of the land by plants and animals.Mesozoic Era. 250 to 65 million years ago. Appearance of mammals andflowering plants, but the land is dominated by dinosaurs (reptiles).Cenozoic Era. 65 million years . Land dominated by mammals andflowering plants.

www.free-ppt -templates.com
• Darwin convinced that the Earth was old and continually changing
– He concluded that living things also change, or
evolve over generations
– He also stated that living species descended
from earlier life-forms: descent with modification

www.free-ppt -templates.com
– Molecular biology - protein “clocks”
Human Rhesus monkey Mouse Chicken Frog Lamprey
Last
common
ancestor
lived
26 million
years
ago (MYA),
based on
fossil
evidence
80 MYA
275 MYA
330 MYA
450 MYA

www.free-ppt -templates.com
• Village lifedominated –families were nearly self-sufficient
• Most villagers were farmers
www.free-ppt -templates.com
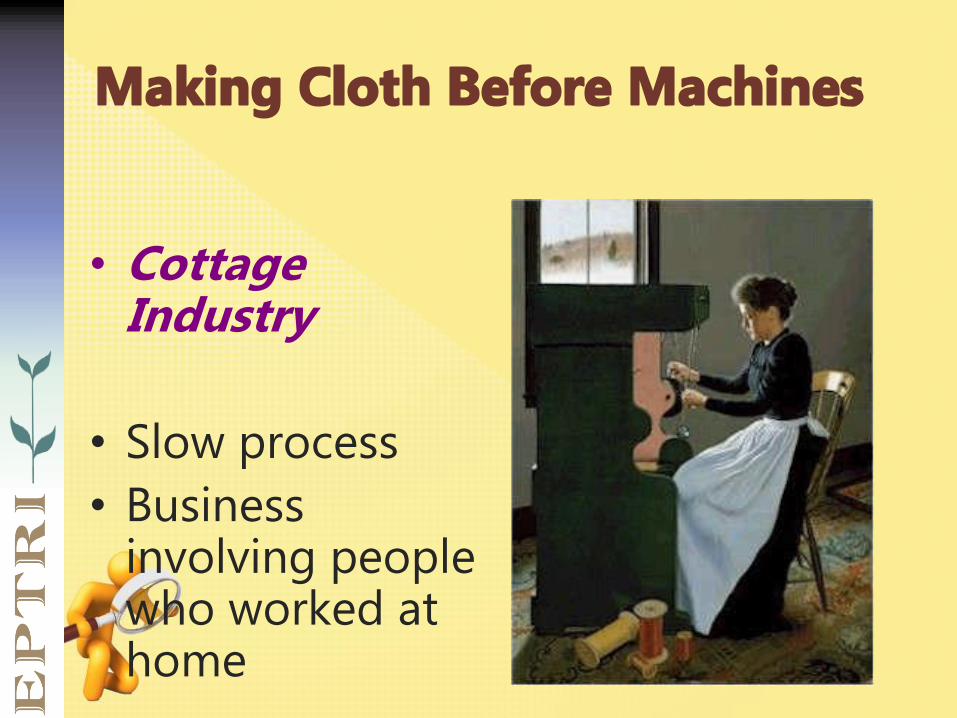
• Cottage Industry
• Slow process
• Business involving people who worked at home

www.free-ppt -templates.com • Agricultural Revolution – improved the quality and
quantity of food – Farmers mixed different kinds of soil or tried new crop rotation
to get higher yields– This led to a surplus of food = fewer people died from hunger
= rapid growth in population
• New technologies and new sources of energy and materials (e.g., James Watt’s steam engine became a key source of power)

www.free-ppt -templates.com
• The Industrial Revolution was a period from the 18th to the 19th century where major changes in agriculture, manufacturing, mining, transportation, and technology had a profound effect on the socioeconomic and cultural conditions of the times
• Industrialization: a shift from anagricultural (farming) economy to onebased on industry (manufacturing)

www.free-ppt -templates.com
Observed Changes to
the Climate and their
Causes

www.free-ppt -templates.com

www.free-ppt -templates.com
• Changes in land use (e.g. farming, building cities)
• Storage and use of water (dams, reservoirs, irrigation)
• Combustion of fossil fuels
Generation of heat
Generation of particulate pollution (e.g., soot, smoke)
Generation of gaseous pollution particulates (e.g., sulfur dioxide, nitrogen dioxide; get oxidized to form sulfate, nitrate)
Generates carbon dioxide
• Generation of other greenhouse gases
Methane, Nitrous oxide, Chlorofluorocarbons, etc.
Especially via biomass burning, landfills, rice paddies agriculture, animal husbandry, fossil fuel use, and industry

www.free-ppt -templates.com
• Carbon dioxide 1
• Methane 21
• Nitrous oxide 310
• HFC 1300
• Carbon Tetra fluoride 6500
• Sulfur hexa fluoride 23900

www.free-ppt -templates.com
One third of the world’s population is now subject to water scarcity
The population facing water scarcity will more than double over the next 30 years
Climatechange isprojected todecreasewateravailability inmany arid andsemi-aridregions

www.free-ppt -templates.com
Climate change will exacerbate the loss of biodiversity
Estimated 10-15% of the world’s species could become extinct over the next 30 years
Biodiversity underlies all ecological goods and services

www.free-ppt -templates.com
Variations of the Earth’s surface temperature
Updated from Karl and Trenberth 2003.

www.free-ppt -templates.com
www.stuffintheair.com/global-energy-balance.html
www.free-ppt -templates.com
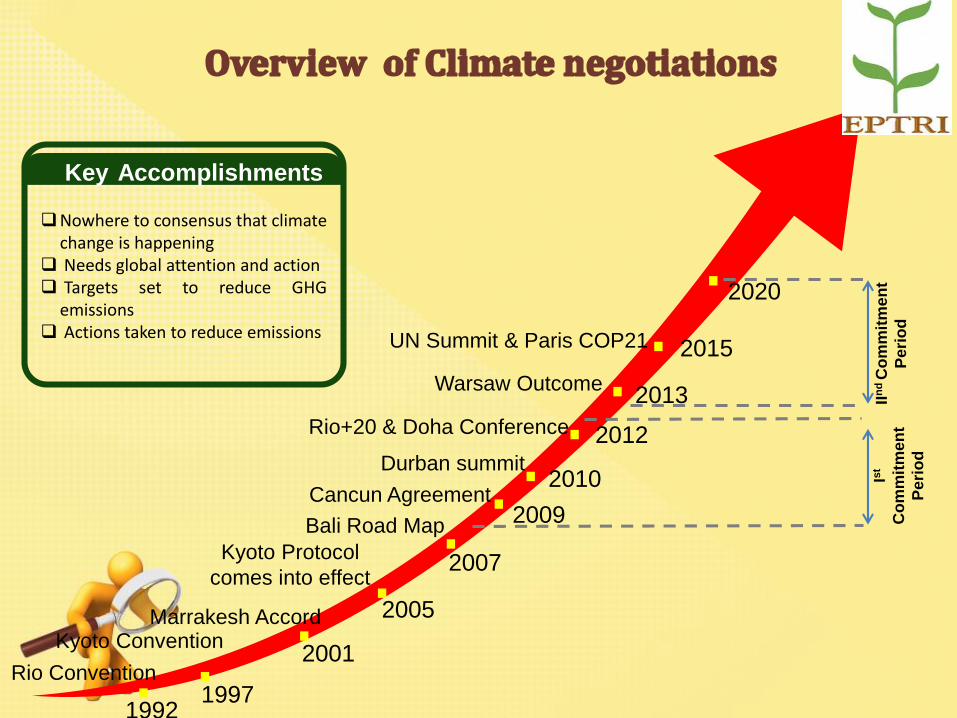
Rio Convention. .Kyoto Convention .Marrakesh Accord
19921997
2001
.Kyoto Protocol
comes into effect
2005
.2007
2009
2010
2012
2013
2015
. ....
Bali Road Map
Cancun Agreement
Durban summit
Rio+20 & Doha Conference
Warsaw Outcome
UN Summit & Paris COP21
.2020
IIn
dC
om
mit
men
t
Pe
rio
d
Ist
Co
mm
itm
en
t
Pe
rio
d
Nowhere to consensus that climatechange is happening
Needs global attention and action Targets set to reduce GHG
emissions Actions taken to reduce emissions
Key Accomplishments

www.free-ppt -templates.com
• Average surface temperature has already increased by
0.85 degree Celsius over the period from 1880 to 2012
• Existing levels of three key GHGs – carbon dioxide,methane and nitrous oxide – are highest in at least800,000 years
• Global mean sea level rose by 19 cm from 1901-2010
• Period from 1983 to 2012 was the warmest 30-year periodin the last 1,400 years
• Green house gas need to be cut by 40-70% by 2050 fromthe year 2010 level
• Fossil fuels should be phased out completely in powergeneration by 2100
• GHG emissions should be zero by 2100 to keep temp risebelow 2 degree Celsius above pre industrial level.

www.free-ppt -templates.com
• To Reduce the Emission Intensity of its GDP by 33 to 35percent by 2030 from 2005 level.
• To achieve about 40 percent cumulative electric powerinstalled capacity from non fuel based energy sources by2030.
• Ambitious target for renewable & electricity to all:– 175 GW Renewable energy target by 2022– 100 GW of Solar, 60 GW of Wind, 10 GW of biomass and 5– GW of small hydel.
• To create an additional carbon sink of 2.5 to 3 billion tonnesof Co2 equivalent through additional forest and tree cover by2030.
• Laid emphasis on: Sustainable Development
Climate Justice
Lifestyles22

www.free-ppt -templates.com
Initiatives of the GoI
Mitigation Initiatives
• Renewable Energy target 175 GW & National Solar
Mission from 20 to 100 GW
• Kochi Airport world first airport powered by solar energy
• Solar powered toll plazas
• Delhi Metro & other MRTS
• Swachh Bharat Mission
• 100 smart cities
• Atal Mission for Rejuvenation & UrbanTransformation (AMRUT)
• Launched Green Highways Policy- develop 140,000 km long tree-line
along highways
• National Air Quality Index launched.

www.free-ppt -templates.com
24
Adaptation Strategies
• Paramparagat KrishiVikasYojana - organic farming
• Pradhan Mantri Krishi SinchayeeYojana - efficient irrigation.
• Neeranchal - watershed development.
• National Initiative on Climate Resilient Agriculture (NICRA)
• Bureau for Water Use Efficiency
Initiatives of the Government (contd.)

www.free-ppt -templates.com
25
National Solar Mission
National Mission for Enhanced Energy Efficiency
National Mission on Sustainable Habitat
National Water Mission
National Mission for Sustaining the HimalayanEcosystem
National Mission for a “Green India”
National Mission for Sustainable Agriculture
National Mission on Strategic Knowledge for ClimateChange
Climate-Smart Cities27/11/2015

www.free-ppt -templates.com
Content:
Domestic Initiatives: National Action Plan on Climate
Change (NAPCC)
Status of State Action Plan on Climate Change (SAPCC)
Operationalization of SAPCC

www.free-ppt -templates.com
SAPCC process and Key Sectors identified
Agriculture and AlliedForestry & biodiversityEnergyHealthIndustries (Mining)Rural developmentTourismTransportationUrban development
www.justclimateaction.org
SAPCC is a hallmark documentwhich projects states outlooktill 2022 on climate.
It identifies these as thesectors which need mitigationand more over adaptationmeasures.
Draft SAPCC
Projections and budget
estimation for the
interventions
Review of the sectoral
policies and programmes
Stakeholders consultation
Finalize SAPCC
State steering committee approval
Adaption of SAPCC

www.free-ppt -templates.com
0 0.1 0.2 0.3 0.4 0.5
West Godavari
Krishna
Srikakulam
East Godavari
Nellore
Visakhapatnam
Chittoor
Vizainagaram
Guntur
Kadapa
Prakasam
Anantapur
Kurnool
0.489
0.466
0.452
0.453
0.455
0.467
0.449
0.423
0.425
0.406
0.389
0.379
0.357
Key determinants used for the
calculation of the adaptive capacity
are :
• Economic status • Demographic
status • Infrastructure status
• Education status • Health status

www.free-ppt -templates.com
0.00 0.10 0.20 0.30 0.40 0.50 0.60 0.70 0.80 0.90 1.00
West Godavari
Krishna
East Godavari
Nellore
Visakhapatnam
Chittoor
Vizainagaram
Guntur
Kadapa
Prakasam
Anantapur
Kurnool
0.00
0.08
0.13
0.49
0.18
0.96
0.20
0.21
0.71
0.70
1.00
0.67

www.free-ppt -templates.com
• In Coastal AP region, the annualtemperature range varied from 1.0° to1.5°C for 2020s.
• In 2050s, the variation of temperature isfrom 2.6° to 3.1°C
• During 2080s, the variation oftemperature is 3.5° to 4.0°C over Coastal
AP.

www.free-ppt -templates.com • There is an overall rise of rainfall from 0.2 to 0.4 mm/day over
CAP except some parts of Srikakulam and Vizayanagaram whereit is decreased upto 0.6 mm/day for 2020s.
• The rainfall departure is ranged between -0.5 to 1.5 mm/dayduring 2050s except some parts of Prakasam and Gunturdistricts.
• In 2080s, the rainfall is enhanced over all the parts of districtsclose to Bay of Bengal upto 2.1 mm/day. Thus there is overallincrease of rainfall for 2050s, 2080s when compared with theprojections of 2020s.
• Over Rayalaseema region, there is decrease of rainfall (-0.2mm/day) in Kadapa, Kurnool and Chittoor districts for2020s, while considerable enhancement of rainfall(0.5mm/day) is observed in projected periods of 2050s.

www.free-ppt -templates.com • The projected rainfall quantities are 1.0 mm/day,
2.0 mm/day and 1.5 mm/day for 2020s, 2050s and2080s in north Coastal AP respectively. But there isa reduction of rainfall upto 0.5mm/day over partsof SPS Nellore and Prakasam districts in all threeprojections.
• Over Rayalaseema region, Ananthapur and partsof adjoining Kadapa and Kurnool districts it islikely to go up to 0.5 mm/day.

www.free-ppt -templates.com
Critical Sectoral Issues Key Interventions
7. Urban Development
Drainage of cities not adequate to accommodate the
precipitations during incidents of heavy rains
Demand on water resources due to the growth in the
urban population and therefore increased pressure on
the water supply infrastructure
Generation of large quantity of sewage
Generation of huge quantum of solid waste
Increased private transportation leading to huge
pressure on the road infrastructure and increased
emissions in urban areas
Safe water supply as per norms to the entire urban
population
100% coverage of sewerage and sanitation for the
urban population
Study and remodel existing water supply, sanitation
and sewerage systems to reduce climate change
vulnerability
Protection and restoration of existing water bodies in
urban areas, creation of new water bodies
Scientific management of municipal solid waste in all
municipalities and corporations
Restoring efficiency of drainage network of all
municipalities to enable quick evacuation of water
and to avoid flooding
Mandatory rainwater harvesting in Government
buildings, larger homes and apartment blocks,
commercial establishments, offices, schools/colleges,
academic/research establishments and industrial
units
Incentives for rooftop solar power generation and
provision of grid connectivity
Rail based MRTS in emerging cities and expansion of
existing MRTS
Provision of safe footpaths, cycle tracks etc to
promote non-motorised transport

www.free-ppt -templates.com
34
Improvements in energy efficiency in buildings (ECBC)
Modal Shift to Public Transport
Rapid public transit: 45 minutes maximum intra-city traveltime for all citizens
With target of a 50% share for mass public transport by2030
Recycling of Material and Urban Solid Waste Management
Bio chemical conversion, waste water use, sewageutilization and recycling options
Urban Lung-Spaces (Parks ) within 15-minutes walkingdistance
Climate-Smart Cities27/11/2015

www.free-ppt -templates.com
• Urbanization: the movement of people to
cities
• Changes in farming, soaring population, and
an increase in demand for workers led
people to move from farms to the cities to
work in factories
• Small towns near natural resources and
cities near factories boomed instantly
Urbanization
Migration to Cities

www.free-ppt -templates.com
36
• Economy as the Engine of Development
• Energy as the fuel for Development
• Equity for ‘Inclusive Cities’
• Environment for ‘Green-Cities’
• Entropy as Waste Generation & Pollution
Climate-Smart Cities27/11/2015

www.free-ppt -templates.com
Engines of Economic Growth
Present and Future Share of GDP
High Concentration of Human Capital
High Exposure , sensitivity, Impacts and
Vulnerability
Recurring Disasters batter some states once
in a year by Cyclones, Floods, Droughts and
Earthquakes
Deaths due to Heat waves
Increasing Pressures on the existing
Resources

www.free-ppt -templates.com
Urban population constitutes 31.6% of totalpopulation
By the year 2026, about 40% of population will live inurban areas
Indian cities contribute to 63% of country’s GDP andwill account for 70% of net new jobs created betweennow and 2030
The cost of delivering basic services is 30 to 40percent cheaper in concentrated urban centers, thanin sparsely populated rural areas
However, such massive urbanization poses a majorchallenge of Urban Entropy
Climate-Smart Cities27/11/2015

www.free-ppt -templates.com
39
URBAN HEAT ISLAND (UHI) EFFECT
Climate-Smart Cities27/11/2015

www.free-ppt -templates.com
• City Profile
• City Assets
• Hazard Mapping and Analysis
• Vulnerability Assessment
• Risk Assessment
• Risk Atlas
• Capacity Assessment
Climate-Smart Cities27/11/2015

www.free-ppt -templates.com
41
• Cyclone adaptation and mitigation measures• Flood adaptation and mitigation measures• Rock fall/Landslide adaption and mitigation measures• Flood Banks with retaining walls• Heat wave adaptation and mitigation measures• Epidemics adaptation and mitigation measures• Climate change adaptation measures• IT and Database Development
• Mainstreaming CCA and DRR in city development planning
Climate-Smart Cities27/11/2015

www.free-ppt -templates.com
42
Shift to Renewable Energy Sources
Enhanced Energy Efficiency
Green Building Design
Mass Rapid Pubic Transport
Grid-connected Smart Meters
Utility Services like Water Supply & Sanitation
Innovative Technologies in Solid Waste Management
Integrated Intelligent Traffic Management Systems
Environmental & City-Heritage Conservation
Climate-Smart Cities27/11/2015

www.free-ppt -templates.com
i. adequate water supply,
ii. assured electricity supply,
iii. sanitation, including solid waste management,
iv. efficient urban mobility and public transport,
v. affordable housing, especially for the poor,
vi. robust IT connectivity and digitalization,
vii. good governance, especially e-Governance and citizen participation,
viii. sustainable environment,
ix. safety and security of citizens, particularly women, children and the
elderly, and
x. health and education

www.free-ppt -templates.com
Resilience is the ability of a
system, community, or society
exposed to hazards to resist,
absorb, accommodate to, and
recover from the effects of a
hazard in a timely and efficient
manner.
Resilience in the context of
cities translates into a new
paradigm for urbanization, and
forms base for a new
understanding how to manage
hazards and urban
development.
Planned City: Resilient CityWhat makes a resilient city?
Broadly, it is a proactive city with high
levels of emergency preparedness, it is a
planned city with environmental
sustainability embedded through robust
processes of integrated planning,
a connected city with access to urban
services network, and importantly, a well
governed city with strong institutional
coordination and command systems.

www.free-ppt -templates.com • In India 59% of the land mass is susceptible to
seismic hazard,
• 5% is prone to floods, 8% is prone to cyclones and 70% of the total cultivable area is vulnerable to drought (Natural Hazard and Disaster Management, 2006).
• According to the latest analysis in IPCC Assessment Report (AR5) floods and droughts are likely to increase in India with extreme precipitation in lesser number of rainy days.
• A warmer planet will affect India severely – and its poor would be the worst impacted.

www.free-ppt -templates.com
The Chennai floods in
2015
Srinagar floods in 2014
are grim reminders of the
need to factor in extreme
events that are predicted
to increase with climate
change
while Delhi’s smog
highlights the perils of
pollution

www.free-ppt -templates.com

www.free-ppt -templates.com

www.free-ppt -templates.com

www.free-ppt -templates.com

www.free-ppt -templates.com
www.free-ppt -templates.com
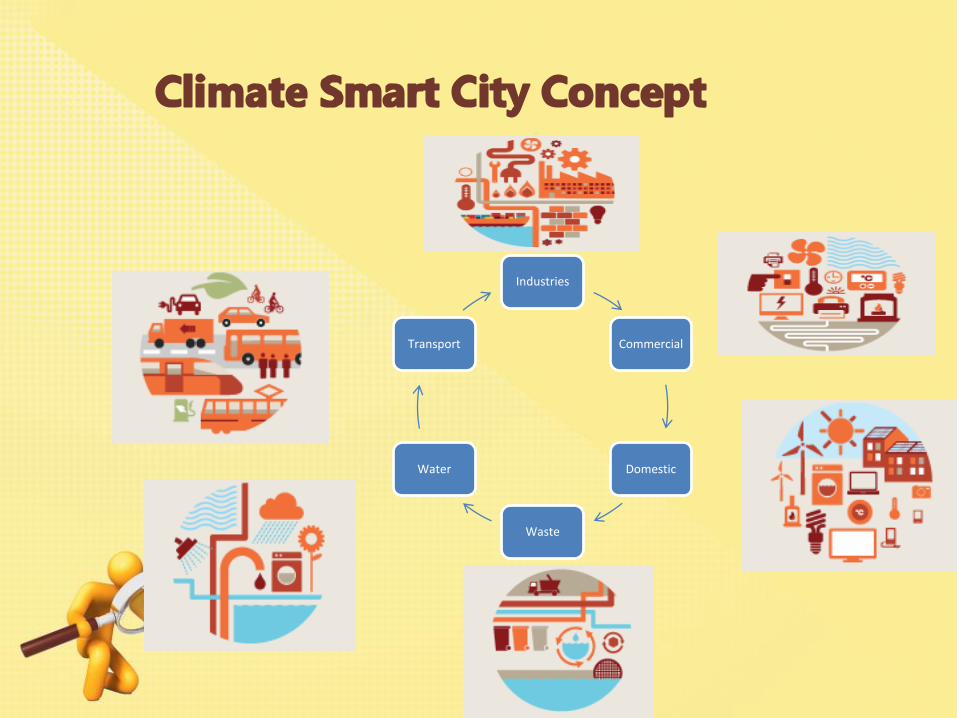
Industries
Commercial
Domestic
Waste
Water
Transport

www.free-ppt -templates.com
Vizag-CSC Mission Guidelines
CSC
Smart Metering
Pedestrian Friendly
parking
Intelligent traffic
management
Energy efficient
street lightning
Innovative use of open
spaces
Visibility improvement
plansSafety plans for the
vulnerable groups
80% green energy
efficient buildings
Non Vehicle street zones
Assured Electricity
Supply (10% from solar
source)
Sanitation(SWM)
Rain W3ater harvesting

www.free-ppt -templates.com
1
• Providing climate related Action plans for development
2• Provision for Climate Finance
3
• Capacity Building and Outreach

www.free-ppt -templates.com
Climate Smart Cities -AP
The strategic components of Area-based development in the Smart Cities
Mission are city improvement (retrofitting), city renewal (redevelopment)
and city extension (greenfield development) plus a Pan-city initiative in
which Smart Solutions are applied covering larger parts of the city.
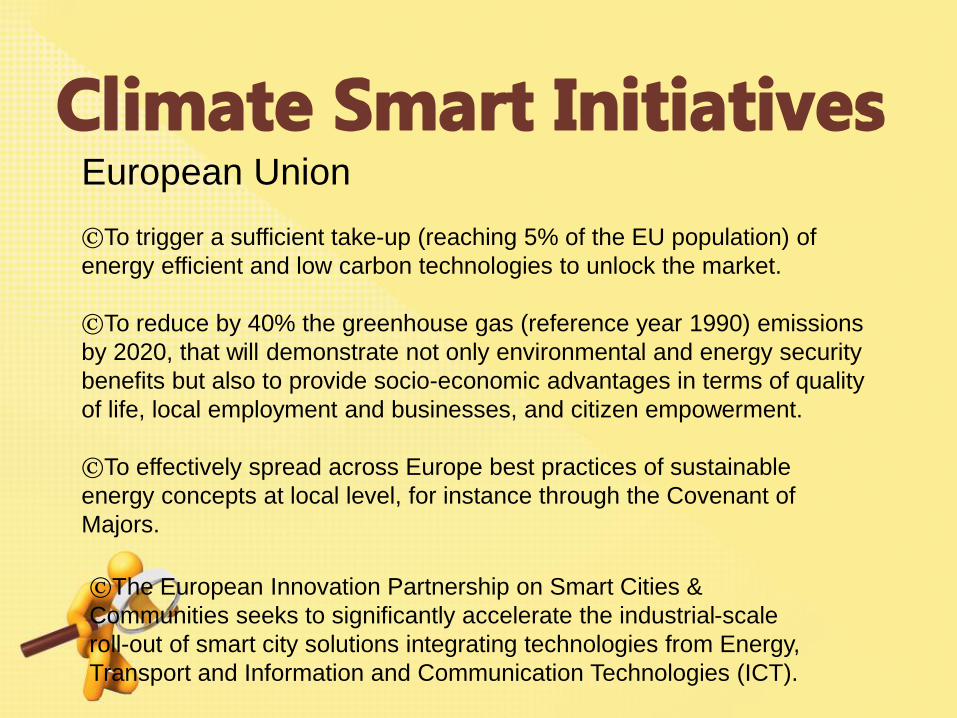
www.free-ppt -templates.com European Union
©To trigger a sufficient take-up (reaching 5% of the EU population) of
energy efficient and low carbon technologies to unlock the market.
©To reduce by 40% the greenhouse gas (reference year 1990) emissions
by 2020, that will demonstrate not only environmental and energy security
benefits but also to provide socio-economic advantages in terms of quality
of life, local employment and businesses, and citizen empowerment.
©To effectively spread across Europe best practices of sustainable
energy concepts at local level, for instance through the Covenant of
Majors.
©The European Innovation Partnership on Smart Cities &
Communities seeks to significantly accelerate the industrial-scale
roll-out of smart city solutions integrating technologies from Energy,
Transport and Information and Communication Technologies (ICT).

www.free-ppt -templates.com

www.free-ppt -templates.com

www.free-ppt -templates.com

www.free-ppt -templates.com
Smart Cities revolve around ICT use for
better energy efficiency, but they also
serve for local revitalizationclean energy
sources, storage batteries • Advanced
Metering Structure (AMI), Energy
Management Systems (EMS), Intelligent
Transport Systems (ITS)… • Electric
Vehicles (EV) and related infrastructure
•fostering energy security and
efficiency
• boosting local development
economically and socially
• enhancing regional and global
competition

www.free-ppt -templates.com The city of Malmö, Sweden is on a
mission to reduce it’s impact on the
environment.
Eurocities have launched the
Green Digital Charter, an initiative
that the City of Malmö have signed
Staffan Fredlund Phone +46 (0) 703
790927 E-mail [email protected]
Climate responsiveness and
ecological sustainability are set
out as explicit political goals
leading to economic growth.

www.free-ppt -templates.com
Sweden has one of the highest per capita electricity consumption rates in
the world (15,000 kWh per person per year) due to the relatively high
heating costs caused by the cold climate. Yet the country emits very little
carbon dioxide

www.free-ppt -templates.com
Waste to Wealth By DWAKRA Mahila Groups Through SWACHH BHARATH INICIATIVE

www.free-ppt -templates.com

www.free-ppt -templates.com
• Government of Andhra Pradesh (erstwhile) has appointed EPTRI
as Nodal Agency for Climate Change (CC) and Clean
Development Mechanism (CDM) vide G.O. Ms. No. 101, Dated:
19.11.2001
• Government of Te;angana appointed EPTRI as Nodal Agency for
Climate Change (CC) and Clean Development Mechanism (CDM)
vide G.O. Ms. No.6, Dated: 17.03.2016
• EPTRI prepared SAPCC for undivided A.P. and submitted the
report to MoEF & CC in March,2012.The National Steering
Committee approved the SAPCC in April, 2013
• EPTRI has prepared SAPCC for Telangana

www.free-ppt -templates.com
Green Climate Fund (GCF)
Adaptation Fund under the UNFCCC
National Clean Energy Fund (NCEF), MoP GoI
Climate Change Action Programme, MoEFCC, GoI
National Adaptation Fund with MoEFCC, GoI
Climate Finance
1. GCF
2. AF
3. NCEF4. CCAP
5. NAF

www.free-ppt -templates.com
http://www.climatesmartcities.org/our-
approach

www.free-ppt -templates.com http://www.smartfusion.eu/
http:http://www.ppmc-
transport.org/smartfusion-smart-urban-
freight-solutions
http://www.ppmc-transport.org/integrated-
urban-intelligence-in-toyota-city-japan/
https://www.greenbiz.com
http://energyblog.nationalgeographic.com/2
012/07/03/europes-first-carbon-neutral-
neighborhood-western-harbour/
http://www.climateactionprogramme.org/ne
ws

www.free-ppt -templates.com
AgMIP Sentinel Sites
Resilient Agricultural Households through Adaptation to Climate Change in Mahbubnagar district,
Telangana (RAH-ACT)
• Mahabubnagar district is one of the most drought prone areas in Telangana and classified as rain shadow district (SAPCC, TS)
• Unfavourable weather conditions are the major concern to the farmers in the district.
22 Feb 2016 RAH-ACT Proposal 69

www.free-ppt -templates.com
AgMIP Sentinel Sites
Project Objective
To enhance the livelihoods (income and nutrition) of the farming
community in targeted villages of Mahbubnagar district, Telangana
through climate resilient agricultural interventions
Promoting and implementing science based suitable adaptation
strategies such as developing farm ponds, micro-irrigation for
food and commercial crops, inter-cropping etc. for resilience of
agricultural households to climate variability and change
Developing and implementing an information system for
providing seasonal climate forecast and weather based agro
advisories for farmers
Enhancing the capacities of stakeholders for implementing and
sustaining the climate change adaptation strategies
Improving the alternate livelihoods options such as livestock
rearing, vermicomposting etc
22 Feb 2016 RAH-ACT Proposal 70

www.free-ppt -templates.com
AgMIP Sentinel Sites
Agronomic Measures
• Promotion of pulses, oilseeds, millets (short to early)
• Fodder crops/trees bund plantation
• Intercropping with pulses/castor
• Boundary plantation
• Tank silt application
• Alternate furrow /strategic irrigation
Soil and Water Conservation
• Farm pond with micro irrigation for life saving irrigation
• Bore-well recharge structures
• Micro-irrigation for food and commercial crops
Integrated Farming Systems
• Backyard poultry’
• Small ruminants
• Fodder crops/ fodder tress bunds plantation
• Vermicomposting
22 Feb 2016 RAH-ACT Proposal

www.free-ppt -templates.com
0
10
20
30
40
50
60
Date
2-1
9-0
0 1
5:3
5
2-2
6-0
0 2
3:5
0
5-6
-00 6
:45
5-6
-00 9
:00
5-7
-00 2
2:5
0
5-8
-00 0
:00
5-8
-00 0
:30
5-1
0-0
0 1
5:5
0
6-2
-00 2
1:4
5
6-6
-00 0
:15
6-6
-00 1
:15
6-7
-00 1
8:1
0
6-1
2-0
0 2
:18
6-1
2-0
0 4
:12
6-7
-00 6
:30
6-2
0-0
0 9
:40
6-3
0-0
0 8
:40
7-2
-00 1
9:3
0
8-7
-00 0
:00
8-9
-00 0
:00
8-9
-00 0
:00
8-9
-00 0
:00
8-9
-00 0
:00
8-1
8-0
0 0
:00
8-2
3-0
0 0
:00
8-2
3-0
0 0
:00
8-2
3-0
0 0
:00
8-2
3-0
0 0
:00
8-2
3-0
0 0
:00
8-2
3-0
0 0
:00
8-2
3-0
0 0
:00
8-2
3-0
0 0
:00
8-2
3-0
0 0
:00
8-2
3-0
0 9
:30
9-2
-00 1
4:2
0
9-1
8-0
0 7
:15
10-7
-00 1
8:1
3
10-1
9-0
0 6
:20
11-2
-00 5
:55
Rain fall Intensity in mm/hrIMD, Hyderabad Station - 2000
>20 mm/hr - 23 events
>40 mm/hr – 4 events
0
10
20
30
40
50
60
Date
3-1
0-0
5 3
:30
4-2
6-0
5 4
:15
5-2
-05 1
8:1
05-2
3-0
5 3
:40
6-1
5-0
5 2
2:3
06-2
4-0
5 1
6:1
06-2
7-0
5 2
3:1
56-2
8-0
5 1
9:2
56-2
9-0
5 1
6:4
06-3
0-0
5 1
6:5
07-8
-05 3
:05
7-8
-05 4
:00
7-8
-05 1
2:2
57-8
-05 1
4:3
07-9
-05 4
:05
7-9
-05 6
:00
7-9
-05 7
:20
7-9
-05 9
:00
7-9
-05 1
0:0
07-9
-05 0
:00
7-9
-05 1
4:0
07-1
5-0
5 1
6:3
07-1
5-0
5 1
7:4
57-1
9-0
5 1
4:3
07-2
1-0
5 2
3:2
07-2
1-0
5 2
3:4
57-2
2-0
5 1
5:3
57-2
4-0
5 1
:30
7-2
4-0
5 3
:45
8-1
-05 1
6:4
08-9
-05 1
6:4
58-1
2-0
5 1
4:2
58-1
2-0
5 1
5:2
08-1
5-0
5 1
8:1
58-1
6-0
5 1
5:0
08-1
9-0
5 2
3:4
58-2
1-0
5 1
6:1
09-2
-05 1
1:0
09-2
-05 1
8:0
09-2
-05 2
0:0
09-7
-05 2
:30
9-7
-05 1
6:1
59-9
-05 1
6:4
59-2
5-0
5 4
:45
10-1
5-0
5 0
:35
10-1
7-0
5 1
5:4
010-2
4-0
5 1
8:3
510-2
5-0
5 2
2:0
010-2
6-0
5 0
:40
10-2
8-0
5 2
0:1
510-2
8-0
5 2
2:4
510-2
9-0
5 7
:00
10-2
9-0
5 7
:30
10-2
9-0
5 8
:00
Rain fall Intensity in mm/hrIMD, Hyderabad Station -2005
>20 mm/hr - 28 events
>40 mm/hr – 6 events
0
10
20
30
40
50
60
70
80
90
Date
2/1
1/0
8 9
:00
2/1
3/0
8 7
:30
3/2
1/0
8 1
4:3
0
3/2
2/0
8 1
7:0
0
3/2
3/0
8 1
2:0
0
3/2
3/0
8 1
6:1
5
3/2
3/0
8 2
0:4
5
3/2
3/0
8 2
3:1
5
6/2
6/0
8 2
3:0
0
7/2
4/0
8 0
:30
7/2
7/0
8 2
0:3
0
8/1
/08 2
0:1
5
8/2
/08 2
0:3
0
8/8
/08 1
9:0
0
8/8
/08 1
9:4
5
8/9
/08 3
:15
8/9
/08 4
:00
8/9
/08 7
:15
8/9
/08 1
3:1
5
8/9
/08 1
4:4
5
8/9
/08 1
9:0
0
8/1
7/0
8 1
:30
8/1
7/0
8 2
:15
8/3
0/0
8 2
0:0
0
8/3
0/0
8 2
0:4
5
9/4
/08 2
1:0
0
9/6
/08 1
9:0
0
9/8
/08 1
7:3
0
9/8
/08 1
8:1
5
9/1
1/0
8 2
0:1
5
10/8
/08 1
7:3
0
10/9
/08 1
5:3
0
11/1
7/0
8 2
:45
Rain fall Intensity in mm/hrIMD, Hyderabad Station -2008
>20 mm/hr - 36 events
>40 mm/hr – 12 events
Concerns of Climate variations and vulnerability for Flooding in urban areas
Source: Study on Urban Hydrology, Groundwater Quality, Pollution &Management of Hussainsagar Catchment Area, HyderabadDr. K. Venugopal1, Ramesh Kumar1, RD Prasad1, K Mahesh Kumar1,D Suneel Babu1, VVS Gurunadha Rao2, 2014
Rainfall deviation inrecent years hasincreased. In last twoyears it has been about25-30%
Climatic Vulnerability of Hyderabad

www.free-ppt -templates.com
73
New STP locations and Capacities in MLD
6.Amberpet-142
8.Nallacheruvu-80
9.Nagole-140
5. Fatehnagar-30
2. Attapur-70 10. Hayatnagar-24
7.Nagaram-29
3. Miralam-6
4.IDPL-59
Total capacity : 580 MLD
3. Infrastructure implementation

www.free-ppt -templates.com
Thank U.