Embed Size (px)
Citation preview

For more information contact:Investor and Rating Agency Relations
706.596.3264800.235.2667
Aflac Worldwide Headquarters1932 Wynnton RoadColumbus, GA 31999
Presentation Notes for the Aflac 2019 Financial Analysts
Briefing
September 25, 2019

FORWARD-LOOKING INFORMATION
The Private Securities Litigation Reform Act of 1995 provides a “safe harbor” to encourage companies to provide prospective information, so long as those informational statements are identified as forward-looking and are accompanied by meaningful cautionary statements identifying important factors that could cause actual results to differ materially from those included in the forward-looking statements. The company desires to take advantage of these provisions. This document contains cautionary statements identifying important factors that could cause actual results to differ materially from those projected herein, and in any other statements made by company officials in communications with the financial community and contained in documents filed with the Securities and Exchange Commission (SEC). Forward-looking statements are not based on historical information and relate to future operations, strategies, financial results or other developments. Furthermore, forward-looking information is subject to numerous assumptions, risks and uncertainties. In particular, statements containing words such as “expect,” “anticipate,” “believe,” “goal,” “objective,” “may,” “should,” “estimate,” “intends,” “projects,” “will,” “assumes,” “potential,” “target,” "outlook" or similar words as well as specific projections of future results, generally qualify as forward-looking. Aflac undertakes no obligation to update such forward-looking statements. The company cautions readers that the following factors, in addition to other factors mentioned from time to time, could cause actual results to differ materially from those contemplated by the forward-looking statements:
• difficult conditions in global capital markets and the economy
• exposure to significant interest rate risk
• concentration of business in Japan
• foreign currency fluctuations in the yen/dollar exchange rate
• limited availability of acceptable yen-denominated investments
• U.S. tax audit risk related to conversion of the Japan branch to a subsidiary
• deviations in actual experience from pricing and reserving assumptions
• ability to continue to develop and implement improvements in information technology systems
• competitive environment and ability to anticipate and respond to market trends
• ability to protect the Aflac brand and the Company's reputation
• ability to attract and retain qualified sales associates, brokers, employees, and distribution partners
• interruption in telecommunication, information technology and other operational systems, or a failure to maintain the security, confidentiality or privacy of sensitive data residing on such systems
• failure to comply with restrictions on patient privacy and information security
• extensive regulation and changes in law or regulation by governmental authorities
• tax rates applicable to the Company may change
• defaults and credit downgrades of investments
• decline in creditworthiness of other financial institutions
• significant valuation judgments in determination of amount of impairments taken on the Company's investments
• subsidiaries' ability to pay dividends to the Parent Company
• decreases in the Company's financial strength or debt ratings
• inherent limitations to risk management policies and procedures
• concentration of the Company's investments in any particular single-issuer or sector
• differing judgments applied to investment valuations
• ability to effectively manage key executive succession
• catastrophic events including, but not necessarily limited to, epidemics, pandemics, tornadoes, hurricanes, earthquakes, tsunamis, war or other military action, terrorism or other acts of violence, and damage incidental to such events
• changes in accounting standards
• increased expenses and reduced profitability resulting from changes in assumptions for pension and other postretirement benefit plans
• level and outcome of litigation
• allegations or determinations of worker misclassification in the United States

1
2
Strategic Overview of Aflac Incorporated
Dan AmosChairman and Chief Executive Officer, Aflac and Aflac Incorporated
2
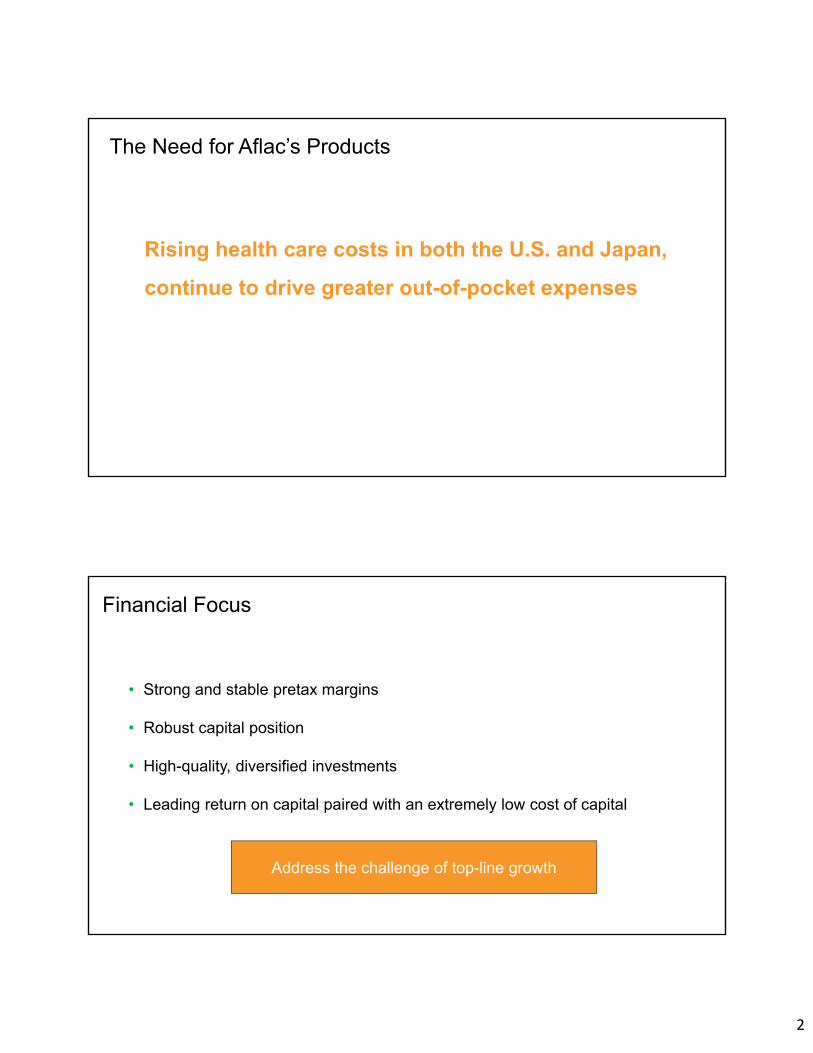
The Need for Aflac’s Products
Rising health care costs in both the U.S. and Japan,
continue to drive greater out-of-pocket expenses
Financial Focus
Address the challenge of top-line growth
• Strong and stable pretax margins
• Robust capital position
• High-quality, diversified investments
• Leading return on capital paired with an extremely low cost of capital

3
Product Development – Distribution Productivity – Digitizing Platforms
Innovating – Venturing – Incubating
Evolving the Core
Tactical Development
Generating Growth With a Measured Approach
Expanding the Core
Defending the Core
Leverage core with a measured approach

4
My Special Aflac Duck

5
9
Overview of Aflac Japan
Masatoshi KoidePresident and Representative Director, Aflac Life Insurance Japan Ltd.
10
Roadmap
I. Japan Insurance Market: Third Sector
II. Aflac Japan’s Competitive Advantages
III. Aflac Japan’s Vision and Strategy for Growth

6
11
Market Catalysts
Third sector market dynamics support further expansion, including:
Aging Population and Low Birthrate
Projected Social Security Benefits
Changing Consumer Needs
12
Opportunities for the Growing Third Sector (Cancer & Medical, FSA Basis, Stand-alone, Life Industry Only)
Policies inMillions
Source: Life Insurance Association of Japan
0
5
10
15
20
25
30
35
40
45
50
55
60
65
2002 2003 2004 2005 2006 2007 2008 2009 2010 2011 2012 2013 2014 2015 2016 2017 2018 2019As of March 31
Market more than doubled in 15 years

7
13
77.7 77.9 79.9 79.2 81.5 81.0
73.0 69.3 71.3 72.3 74.0 72.1
21.2 25.3
31.2 33.1 37.3 37.8
0
20
40
60
80
100
2001 2004 2007 2010 2013 2016
Life insurance Medical insurance Cancer insurance
Cancer Insurance Market Penetration(Product Penetration, Individual Basis, Three-year Interval Data)
Source: Japan Institute of Life Insurance
Life insurance does not include annuity insurance or child endowment
%
14
Aflac Japan VISION 2024
VisionBeing the leading company
“Creating Living in Your Own Way”
Through VISION 2024 Aflac Japan will:
• Strengthen Aflac’s position as the leading company in the third sector
• Expand into new frontiers consistent with our core capabilities and values
• Cultivate an innovation-driven corporate culture

8
15
Innovative Products
Broad Distribution
Trusted Brand
Aflac Japan is the leading company for cancer and medical insurance in Japan
As the pioneer of cancer insurance in Japan with 44+ years of experience, Aflac has developed scale, efficiencies and deep expertise
Leveraging Our Strengths as a Market Leader
16
Provide Latest Coverage Based on Customers’ Different Life Stages
Competitive Advantage: Innovative Products
・January 2019: Introduced mid-term, lump-sum rider addition system
・June 2019: Introduced special premium rate for medical insurance
Medical Insurance
20s 30s 50s 100
Life Stage of Customers
Cancer Insurance
Medical Insurance
Income Support CoverageNursing Care/ Dementia
Care CoverageDeath Coverage
Post-mortem Expense Coverage
Post-retirement Life Coverage
Coverage at Different Life Stages
40s

9
17
Competitive Advantage: Broad Distribution
Core Traditional Channel
Agencies
Affiliated Corporate 1,300+ agencies, including 200+ Aflac-exclusive agencies
Independent Corporate 4,000+ agencies, including 1,000+ Aflac-exclusive agencies
Individual 3,900+ agencies, including 3,500+ Aflac-exclusive agencies
Strategic Partners Channel
Japan Post
• 20,000+ post offices nationwide selling Aflac cancer insurance
• 76 branches of Japan Post Insurance Co., Ltd.
• Announced strategic alliance with a capital relationship in December 2018
Dai-ichi Life• Nearly 40,000 Dai-Ichi Life sales representatives offer Aflac cancer insurance
• 19 years of consistent, robust sales results under Business Alliance
Daido Life • Selling cancer insurance products in SME association market
Banks • Aflac Japan represented at 360+ banks
18
Aflac’s brand recognition is over 91%
• Attractive to consumers and business partners
• Communicates high-quality products and services for “insurance for daily living”
Competitive Advantage: Trusted Brand

10
19
Business Development Flexibility Following Conversion
Group structure
• Aflac Payment Services Co., Ltd.
• Aflac Insurance Services Co., Ltd.
• Aflac Heartful Services Co., Ltd.
• Tsusan Co., Ltd.
Aflac Japan subsidiaries
• Agile-style business processes introduced to provide customers with value in a flexible and speedy manner fitting for an age of rapid changes
Implement Agile operations
Capital management
Post-conversion, Aflac Life Insurance Japan Ltd. has flexibility to raise funding:
• April 2019: Yen-denominated perpetual subordinated corporate bonds
Hybrid bond issuance
Governance – Business operations
20
Cultivate an Innovation-Driven Corporate Culture
Innovation-driven Corporate Culture
Work SMARTDiversity Promotion
Talent Development: Leader Training
Next Generation Executive Development Program
U.S. Training Program

11
21
Innovation for a Cancer Ecosystem
Cancer EcosystemPrevention Early intervention Treatment optimization Living with cancer
Cancer insurance
Genetic testing
Early screening Medical check booking
Doctor appointment
Cancer treatment ePRO
Insurance
Health Care
Identify risk and
improveScreening Diagnosis
Select doctor/treatment
Recovery Final stage
Second opinion
Treatment
Support for treatment-work balance / Community
Clinical Trial
Potential business opportunity
22
Digital Innovation
AI-Search
Agile@Aflac
Straight-Through Payment
Private Cloud
AI-OCR
Data Analytics and Cloud
Product and Service Innovation
Automation and Process
Optimization
Culture and Organizational Enablement
AI-Data Analytics

12
23
Aflac Japan Adjusted Expense Ratio Outlook
Adjusted TargetExpense Ratio Outlook
• Earned premium normalized for paid-up third and first sector policies
• Efficiencies focused on procurement, space utilization and administrative process improvement
• Annual efficiency economic benefit of ¥2 to ¥3 billion per year compared to 2018 ratio
20.3%
22.2% 22.2% 22.3% 22.4% 22.5%
20.2% 20.2% 20.3% 20.4% 20.5%
19%
21%
23%
2018 2019 2020 2021 2022 2023
Expenses to Total Revenue
Actual Max Min
22.5%
24.1%23.6% 23.3% 23.0% 22.7%
22.1%21.6% 21.3% 21.0% 20.7%
20%
22%
24%
26%
2018 2019 2020 2021 2022 2023
Expenses to Normalized Earned Premium
Actual Max Min

13
Aflac Japan Growth Strategies
Koji AriyoshiDirector, Executive Vice President;Director of Sales and Marketing, Aflac Life Insurance Japan Ltd.
Outlook for Earned Premium Growth:All Third Sector and First Sector Protection – Includes the Impact of Paid-up Policies
(In billions)
500
600
700
800
900
1,000
1,100
1,200
2016 2017 2018 2019e 2020e 2021eYears ending December 31
¥

14
Competitive Cancer and Medical Insurance MarketCancer and Medical Insurance Market Share
(as % of new policies)
Source: Insurance: Statistics of Life Insurance Business in Japan, Hoken Kenkyujo Ltd.
Top 5
Aflac Company A Company B Company C Company D Others
40% 42% 44% 45% 46%
6% 6%7% 6% 6%7% 7%6% 7% 7%
12% 12% 10% 8% 8%
10% 9% 9% 9% 8%
25% 25% 24% 25% 26%
0%
20%
40%
60%
80%
100%
2013 2014 2015 2016 2017
0
200
400
600
800
1,000
1,200
Growing need to prepare for longevity risk
Increasing incidence of cancer and advances in medical technology drive the need for the latest coverage
Average Life Span of the Japanese People
1970
Male
Female
69.31
74.66
2018
81.25
87.32
+11.9 yrs
+12.7 yrs
1970
Male
Female
12.50
15.34
2018
19.70
24.50
+7.2 yrs
+9.2 yrs
Average Life Expectancy of People Age 65
Number of Cancer Patients
Around 1 million peoplediagnosed with cancer annually
Source: Abridged life table by the Health, Labour and Welfare Ministry
(in thousands)
Source: Number of cancer patients in Japan by the Health, Labour and Welfare Ministry
Growth Opportunities for Protection-type Products: Environment Surrounding Customers

15
Market of over 21 million existing policies
Corporate group market built on employee benefits packages
Nationwide network of diverse sales channels
15.6 million cancer policies 5.9 million medical policies
Approach to more than 30,000 groups
400+ walk-in shops
300+banks
Strategic partners with 150,000+ sales agents
9,000+ agencies
• 9 million+ policies without the latest coverage
• 3 million+ policies without the latest coverage
Aflac’s Growth Opportunities Unrivaled by Competitors
Product StrategyExternal
Environment
Customer Needs
Enhance product lineups based on changes in life stage
Strengthen coverage based on advances in health care and medical technology
20s 30s 50s 100
Example of Coverage to Offer
Life Stage of Customers
Cancer Insurance
Medical Insurance
Income Support CoverageNursing Care/ Dementia
Care CoverageDeath Coverage
Post-mortem Expense Coverage
Post-retirement Life Coverage
Coverage at Different Life Stages
40s

16
Channel Strategy
Channel Strategy
Agencies
• Better penetration of existing policyholders and corporate group markets
• Enhance support measures for strengthening management foundations and business frameworks
• Form an IT infrastructure for more efficient sales activities
Japan Post • Secure stable growth based on strategic alliance
Dai-ichi Life• Continue to maintain the long-standing, good
relationship, provide training and other sales support to secure stable sales
Daido Life• Maintain good relationships by engaging the Hojinkai
(Corporate Taxpayers Association) or SME market
Financial Institutions
• Increase our shares by strengthening relationships, expanding the number of loaned employees and providing training programs
¥904.6 Billion of Third Sector Annualized Premium In Force by Channel
As of March 31, 2019
Agencies89%
Strategic Partners
11%
Initiatives for sustainable growthAflac’s growth opportunities
• Agencies which have not thoroughly approached existing policyholders and agencies with more productive sales personnel will cooperate in developing a structure to approach existing policyholders
• Provide products for corporate group members’ benefits
• Simplify enrollment procedures through utilizing corporate intranet systems
• Enhance support measures that step into agency management for strengthening management foundations and business frameworks
• Increase the number of our productive walk-in shops
Market of over 21 million existing policies
Corporate group market built on employee benefits packages
Increase of productivity in saleschannels
(agencies, walk-in shops)
Initiatives in the Agency Channel
17
Overview of Aflac U.S.
Teresa L. WhitePresident, Aflac U.S.
34

18
35
The U.S. Workforce is Changing
We Continue to Execute Our Strategic Playbook Successfully
IncreaseGROWTH
Distribution expansion
Product innovation
Digital system transformation
Leveraging technology to focus on positive customer experience
Improve EFFICIENCY
Enhance the EXPERIENCE
Risk & Regulatory (Foundational)

19
Improving and Expanding
Distribution
Technologyfor Sales & Service
Solutions
Driving Product
Innovation
CustomersDistribution
EmployeesPromise
Digital Makesit Easier
Automated
Straight-through
processing, service
+ communications
via robotics and AI
Omni-Channel
Online, Mobile,
Chat, Text –
optimized and
flexible technology
Payment Options
Digital wallets,
Venmo, PayPal, etc.
Analytics Driven
Data-driven for
operational insights
and analytics
Fully Digital
Buy anytime,
anywhere - Digital and
Self Service options
for everything
Aflac U.S. Strategic Investments: One Digital Aflac
20
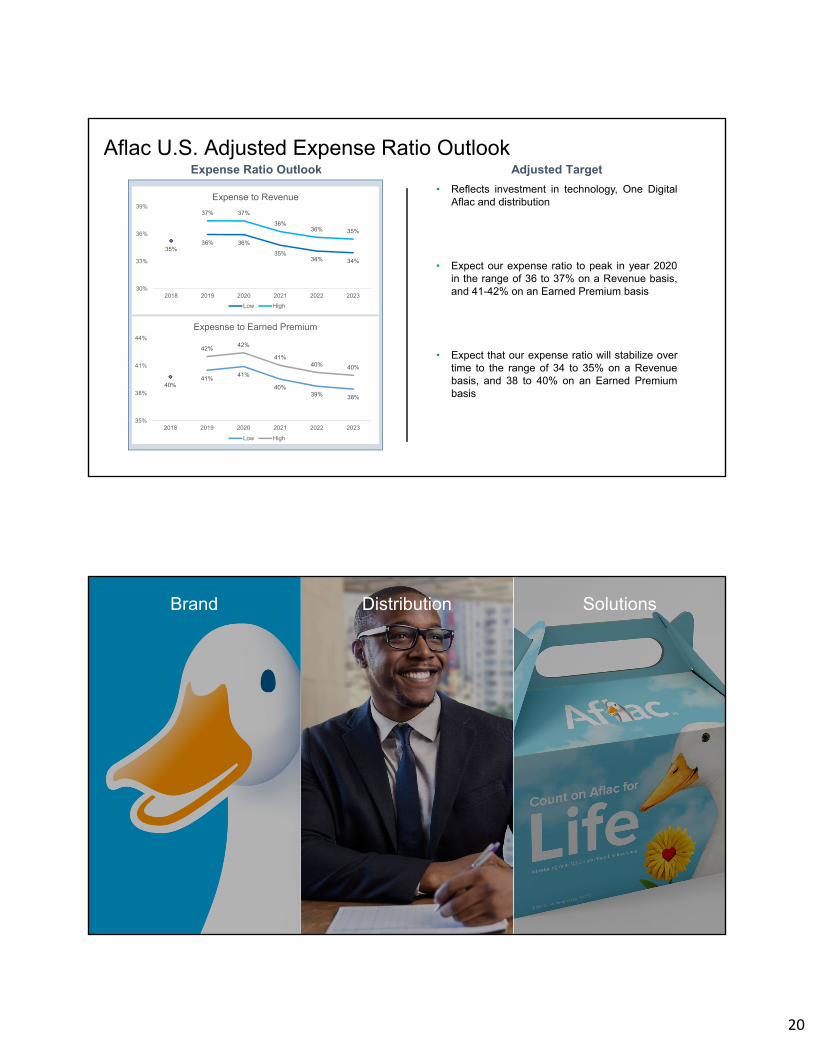
Aflac U.S. Adjusted Expense Ratio OutlookAdjusted TargetExpense Ratio Outlook
• Reflects investment in technology, One DigitalAflac and distribution
• Expect our expense ratio to peak in year 2020in the range of 36 to 37% on a Revenue basis,and 41-42% on an Earned Premium basis
• Expect that our expense ratio will stabilize overtime to the range of 34 to 35% on a Revenuebasis, and 38 to 40% on an Earned Premiumbasis
40%41%
41%
40%39% 38%
42%42%
41%40% 40%
35%
38%
41%
44%
2018 2019 2020 2021 2022 2023
Expesnse to Earned Premium
Low High
35%36% 36%
35%34% 34%
37% 37%
36%36% 35%
30%
33%
36%
39%
2018 2019 2020 2021 2022 2023
Expense to Revenue
Low High
Brand SolutionsDistribution

21
Help with expenses health insurance doesn’t cover
Not HomeNot Auto Not Health

22
The Aflac Duck Coach Nick Saban 5-Star Recruits
The Campus Tour Commercial

23
The Comeback is supplemented by Aflac, who helps you tackle the bills health insurance doesn’t cover.
The Comeback, Supplemented by Aflac…
Our Approach to Growth
Growth Strategy Framework Levers to Capitalize on Market Opportunities

24
Outlook for Earned Premium1 GrowthFocus on Access, Participation and Retention
1Earned premium calculated on net basis; i.e., after reinsurance.
Maintain stable persistency and generate steady earned premium growth of 2.0% to 2.5%
3,000
3,500
4,000
4,500
5,000
5,500
6,000
6,500
2016 2017 2018 2019e 2020e 2021e
$(In Millions)
Aflac U.S. Growth Strategies
Rich Williams Executive Vice President andChief Distribution Officer

25
Cost of Health Care Continues to Rise
Source: Kaiser Family Foundation Employer Health Benefits Survey, 2018; Kaiser/HRET Survey of Employer-Sponsored Health Benefits, 1999-2018
0
5,000
10,000
15,000
20,000
25,000
2007 2008 2009 2010 2011 2012 2013 2014 2015 2016 2017 2018
Employee Employer
Health PremiumsEmployer/Employee Contribution (family coverage)
Ave
rag
e H
ealt
h P
rem
ium
s
Worksite Health Coverage$
Average employee contribution for family coverage has increased 29% since 2012, while workers’ wages increased only 14%.
1 Total Aflac policy and certificate holders as of Dec. 31, 2018; Source: 2016 U.S. Census Bureau; Bureau of Labor Statistics
24.8 million
101.8 million
47.3 million
Self-employed -no Aflac access
Aflac is notoffered byemployer
Access to Aflac
Penetration
Don’t have Aflac:
39.7 million
Have Aflac:7.6 million1
Self-employed24.8 million
Public Sector22.3 million
Private Sector 126.8 million
Small Employers (1-99)
42.2 million
Medium Employers(100-999)
24.5 million
Large Employers(1,000+)
60.1 million
U.S. Working Population 174 million
Aflac’s Significant U.S. Growth Opportunity
Access
Penetration
Retention
Solving for:

26
Aflac U.S. Strategic Growth Focus
SMALL BUSINESS
BROKERAGE
EXISTING ACCOUNTS
CONSUMER MARKETS
Aflac U.S. Distribution Mix(New AP in Millions)
0
200
400
600
800
1,000
1,200
1,400
1,600
1,800
2010 2011 2012 2013 2014 2015 2016 2017 2018
Agent Broker Expansion
1%
1,5521,4821,4871,4331,4241,4881,476
63%66%67%69%74%74%77%
35%33%32%30%25%25%
22%
2%1%1%
1%1% 1%
In Millions
$
1,6014.7%(0.3)%3.7%0.7%(4.3)%0.8%6.8%% Δ YoY 3.2%
2%
37%
61%
80%
20%
1,382(4.9)%
Agency CAGR -1.5%Broker CAGR +10.0%

27
Broker Sales Trends
Product Innovation
Increasing CompetitionEnrollment Solutions
Client Expectations
Technology Solutions
Broker
Producer Trends
Average Weekly Producer Equivalents CAGR -2.2%Productivity CAGR 5.2%
-
20,000
40,000
60,000
80,000
100,000
120,000
140,000
160,000
180,000
200,000
8,000
8,200
8,400
8,600
8,800
9,000
9,200
9,400
9,600
2014 2015 2016 2017 2018
Pro
du
ctiv
ity (
$)
Nu
mb
er
of A
WP
Equ
iva
len
ts
Average Weekly Producer Productivity

28
Enhancing Distribution Through Portfolio Expansion
Dental Industry View
$25.9 billion in-force$2.9 billion new sales
3-Year 6% PPO CAGR
5-8% PPO profit margin
64% small business penetration
Aflac Strategic Rationale
Market expansion opportunity
Deepen existing account penetration
Recruit and retain agents
Consistent financial profile
Source: LIMRA/NADP, Eastbridge; Deloitte
Network Dental and Vision – Argus Acquisition
GO-TO-MARKET STRATEGY
• Simplified offering through agents to small businesses
• Customized offering through brokers to mid-large market
• Direct to Consumer offers simplified products
EXPECTED RESULTS
• Grow producers
• Accelerate small business growth
• Deepen broker network access
• $300 to $500 million in revenue over 5 to 7 years

29
101.8 million
47.3million
24.8million
Aflac is not offered to employeeAccess to Aflac at the worksiteSelf-employed - no Aflac access
Increasing Access Through Distribution Expansion
126.6 million without access to Aflac
35% of consumers prefer to purchase online, carrier direct
39% of consumers prefer alternative channels
Source: 2016 U.S. Census Bureau; Bureau of Labor Statistics; KL Consumer Community January 2017, Ask Your Target Market January 2017
Consumer Markets Approach
STRATEGY
• Direct-to-Consumer
• Aflac Brand
• Digital Platform
• Alliances / Partnerships
EXPECTED OUTCOMES
• Access New Markets
• Increase Penetration
• Consistent Financial Profile

30
Aflac Global Investments Update
Eric M. KirschPresident, Aflac Global InvestmentsExecutive Vice PresidentGlobal Chief Investment OfficerAflac Incorporated

31
2019 Investment ThemesTheme Strategy Result
Disciplined Investment Process SAA ∙ TAA ∙ ALMStrong Performance: NMY1, NII Low losses and impairments
Navigating Low Yen YieldsMinimize JGB investments Favor higher yielding yen credit assets
Defend NII
Hedging Strategies Hedged USD ProgramStable hedge costsFloating rate income protection
Grow AlternativesPrivate EquityReal Estate Equity
Growing variable income
Protect the PortfolioPrudent credit underwritingUp in quality bias
Higher quality, lower credit risk
Aflac Global Investments Growth Strategies
Leverage External Management PlatformAflac Corporate Ventures
Asset Manager PartnershipsPartnership launched 3Q19
1 New Money Yield
2%
41%31%
20%6%1% 4%
69%
23%
4%0%
20%
40%
60%
80%
AAA AA A BBB BB or Lower
4Q11 2Q19
29%
53%
18%
0% 0%
44%
22% 25%
8%1%
0%
10%
20%
30%
40%
50%
60%
JGBs Yen Credit U.S. Credit Private Loans Growth Assets
4Q11 2Q19
Our balance sheet benefits from expanded asset allocation that includes private market assets, USD assets and geographically diverse investments
Consistent Investment Process and Strong Performance1
4Q11 2Q19 YTD
Book Value: $99.2 billion $119.9 billion
Portfolio Yield - Japan: 3.29% 2.59%
Portfolio Yield - US: 6.72% 5.43%
New Money Yield - Japan: 2.08% 3.50%
New Money Yield - US: 5.35% 4.47%
Gross Losses from Sales7: ($90 million) ($11 million)
Impairments (pre-tax): ($801 million) ($4 million)
35%
16%
30%
6% 6% 7%
49%
30%
12%
4% 2% 3%
0%
10%
20%
30%
40%
50%
60%
Japan U.S. Europe Americasex. U.S.
Asiaex. Japan
ME, Africa& Australia
4Q11 2Q19
Note – Percentages may not add to 100 due to rounding 1 Excludes Corporate and Other segment 2 Includes IG corporates, munis and high yield 3 Includes bank loans, middle market loans, transitional real estate loans, commercial mortgage loans and infrastructure debt 4 Includes US equities, Japan equites and alternatives 5 Excludes equities, and alternatives 6 Supranational mapped to region of service 7 Excludes losses from equities and derivatives/other
2 43
Core ALM
Yield, Diversification
Floating-rate income
Variable NII
Diversified concentrated positions
Allocation to USD assets
Core ALM
Liability ProfilingCapital Allocation and Risk Appetite
Strategic Asset Allocation
Tactical Asset Allocation
Security & Manager Selection
• Investment • Risk • Capital
Global Committees
Avg. Quality: A Avg. Quality: A
Asset Class Allocation (4Q11 vs. 2Q19)
Fixed Maturities Credit Quality (4Q11 vs. 2Q19) Key Statistics
Holdings by Region5,6 (4Q11 vs. 2Q19)
2015 JGB downgrade

32
• Lower new money to invest
o Increased utilization of cash proceeds from operations
o Declining maturities of legacy yen privates
Aflac Japan Cashflow Outlook ~ 3-5years
Navigating Japan’s Low Interest Rate EnvironmentJGB Yields and Yen Credit Yields(%)
Investment Considerations
• Strategic asset allocation target
o Less than 30% yen allocation, focused on private and public credit
o Modest USD program growth through re-investment
4%
21%
16%
31%
16%
6%7%
JGBs
Yen Public Credit
Private Placements
USD Fixed
MML
TRE
Growth Assets
2019 Aflac Japan New Money Full-Year Forecast
¥
$
Note: Percentages may not add to 100 due to rounding1Includes IG Corporates, High Yield, and CMLs 2 Growth Assets includes both yen denominated and U.S. denominated assets
~¥950 billion
-0.4
0
0.4
0.8
1.2
1.6
30yr JGB 10yr JGB
29%
71%
Avg. Book YieldYen Credit New Purchases
2
1
Three-Pronged FX Hedging Program
Assets Floaters Fixed and growth Fixed and growth
Asset Duration 3 months 7-10 years 7-10 years
Hedging Duration 3 month – 1 year forwards 3-5 year forwards Collars (SMR)
Call outs
• Income correlates to hedge costs
• Stable net margin• NII Hedge & HC Term Out
• Locked-in hedge cost
• Credit spread
• Aligns to stressed economic value of Aflac Japan
Hedging StrategiesAs of June 30, 2019
3-month and 1-year Hedge Costs
2019 Floating for Fixed Income Swap
Locked in ~75% of floating income at 2.65%
Short Hedges1 UnhedgedLong Hedges 32
USD Portfolio Key Metrics ($ billions)
1.80
2.20
2.60
3.00
3.40
Jan-18 Apr-18 Jun-18 Sep-18 Dec-18 Mar-19 Jun-19
3m Hedge Costs 1yr Hedge Costs
Libor (%)
1.4
1.6
1.8
2
2.2
2.4
2.6
2.8
3
Dec-18 Mar-19 Jun-19 Sep-19 Dec-19
Libor Curveat Execution Fixed Rate: 2.65%
YTD Realized Libor Curveas of 6/30/19: 2.47%
Forward Libor Curveas of 6/30/19: 1.95%
Forward Libor Curveas of 8/30/19: 1.80%
Locked in ~75% of floating income at 2.65%
Assets Hedges% HC % HR
MV ($,B) Dur (yrs) Fwds ($,B) Dur (yrs) Collars ($,B)
Total 26.9 6.3 9.1 0.9 11.9 2.83% 34%
Group 1 6.7 0.3 6.8 0.4 - 3.08% -
Group 2 2.4 8.0 2.3 2.3 - 2.14% -
Group 3 17.9 8.3 - - 11.9 - 34%
Libor (%)
Note: Collars are struck out of the money, providing tail risk protection

33
647 985 1,3701,807
1,3751,900
2,400 2,9001.1%
1.6%2.0% 2.4%
0.0%0.5%1.0%1.5%2.0%2.5%
0
1,000
2,000
3,000
4,000
2019 2020 2021 2022
Cum. Paid-In Capital Cum. Committed Capital % of Invested Assets
Alternatives Portfolio Growing
Variable Net Investment Income ($ millions)
Forecasted Future Build ($ millions)
0 0
-1 0 -1
10 86
12
-10-505
1015
2Q17 3Q17 4Q17 1Q18 2Q18 3Q18 4Q18 1Q19 2Q19
Alternatives Portfolio Build ($ millions)
Note – Forecasted Future Build is subject to market changes and conditions. 1 Percentage of invested assets is based on cumulative committed capital and assumes constant balance sheet
1
• Systematic annual program commitments
• Selective manager additions
• 3-7 year average call cycle
Private Equity Investing Cycle
• Annual commitments paced
• Manager and strategy additions market dependent
Vintage Year Diversification
• J-curve mitigation strategy
• Co-investments outperformed
• Variable income growing
Performance
0
500
1,000
1,500
2Q17 3Q17 4Q17 1Q18 2Q18 3Q18 4Q18 1Q19 2Q19
Cum. Program Commit Commitment to Underlying Cum. Paid-In Capital
Protect the Portfolio
$7.2bn $6.4bn $6.3bn$5.5bn $5.5bn
16% 15% 15%13%
10%
0%
10%
20%
30%
$0bn
$2bn
$4bn
$6bn
$8bn
2015 2016 2017 2018 2Q19
Total Energy Exposure Face Value (left axis) Oil field services % of Energy (right axis)
Energy Exposure ($ billions, fair value)
De-risking Activity ($ billions)
24.6% 24.0% 23.2% 22.8%
6.0% 5.0% 3.6% 3.1%
0%5%
10%15%20%25%30%
2016 2017 2018 2Q19
Fixed Maturities BBB Exposure
Includes All BBB Fixed Maturities
Total BBB exposure
BBB- exposure (Incl. in above total BBB)
• Reduced weaker subsectors, such as Drillers
• Over 70% of BBB energy holdings have positive or stable outlooks
• 20% of energy exposure is in sovereign-linked entities
• Average rating of energy holdings is BBB+
• Reduced energy exposure
• Sold BBB corporates, purchased AA tax-exempt munis
• Reduced legacy private placements
• Improved quality of BBB exposure
• Selective relative value trades
• 27% of BBBs are split rated with one A rating
• Average public BBB- position is $25 million
• Over 1/3 of BBB- exposure matures within five years
• 11% of BBB- holdings are HY cross-over names
Our BBB Exposure Has a Conservative Bias
Reduced Energy Exposure by ~24%, $1.7 billion
Over $7 billion of Tactical De-risking
$2.6bn
$0.3bn
$3.7bn
$0.7bn
$0bn
$1bn
$2bn
$3bn
$4bn
2016 2017 2018 2Q19
Total: $7.3 billion

34
Healthcare, 19% Consumer
Cyclical Services,
13%
Technology, 9%
Food and Beverage,
9%Industrial Other, 8%
Consumer Products,
6%
Automotive, 5%
Packaging, 5%
Others (largest = 4%), 24%
Middle Market Loans
Book Value Outstanding ($mm) $1,900
Unique Issuers 198
Average Loan Commitment Size ($mm) $11
Largest Loan in Portfolio ($mm) $33
Weighted Average Spread over LIBOR 467bps
Book Yield (Gross) 7.30%
Average Loan Rating B+
<$15mm, 16%
$15mm -$25mm,
32%
$25mm -$35mm, 16%
>$35mm, 36%
BV ($mm) by Industry Sr. Leverage at Close by BV ($mm)
<3.0x, 10%
3.0x - 4.0x, 30%
4.0-4.75x, 40%
>4.75x, 20%
EBITDA at Close by BV ($mm)
Transitional Real Estate
Book Value Outstanding ($mm) $4,591
Unique Issuers 127
Average Loan Commitment Size ($mm) $41
Largest Loan in Portfolio ($mm) $178
Weighted Average Spread over LIBOR 338bps
Book Yield (Gross) 5.86%
Average Loan Rating BBB
East North Central, 6% East South
Central, 5%
Middle Atlantic, 9%
Mountain, 6%
New England,
4%
Pacific, 23%
South Atlantic,
23%
West North Central, 1%
West South Central,
19%
Various, 5%
LTV by BV ($mm)Region by BV ($mm) Property Type by BV ($mm)
Disciplined credit underwriting focused on senior secured first lien loans
Private Floating Rate Loan Portfolios As of June 30, 2019
Multifamily, 42%
Office, 34%
Retail, 3%
Hospitality, 15%
Industrial, 5%
Other, 1% LTV Below 50%, 13%
LTV 50-…
LTV 60-70%, …
LTV 70-80%, …
1 Book Value 2 As of June 30, 20193 Includes senior management4 Bank Loans brought in-house in July 2018
External Management Platform Accesses Income Enhancing Strategies
0.4 0.5 0.5 2.0
4.4
6.2
8.39.4
0
2
4
6
8
10
2012 2013 2014 2015 2016 2017 2018 2Q19
Japan Equities$0.5 billion, 6%
US Equities$0.3 billion, 3% Alternatives
$0.5 billion, 5%
Infrastructure Debt$0.4 billion, 4%
Transitional Real Estate$4.6 billion, 49%
Middle Market Loans$1.9 billion portfolio, 20%
Commercial Mortgage Loans$1.2 billion, 13%
Complexity
Ret
urn
• External Management Platform delivers alpha complementing our core ALM strategy
• Dedicated and specialized 8 person team3 with over $9B in AUM and on average 17 years of experience
• Provides insights into new investments, reviewed over 400 asset managers
• Led growth in loan portfolio and equity investment in NXT
• Developed in-house alternative funds selection
• 16 mandates with 12 asset managers
$9.4 billion Externally Managed Portfolio1,2
Externally Managed Portfolio ($ billion)1
4
35
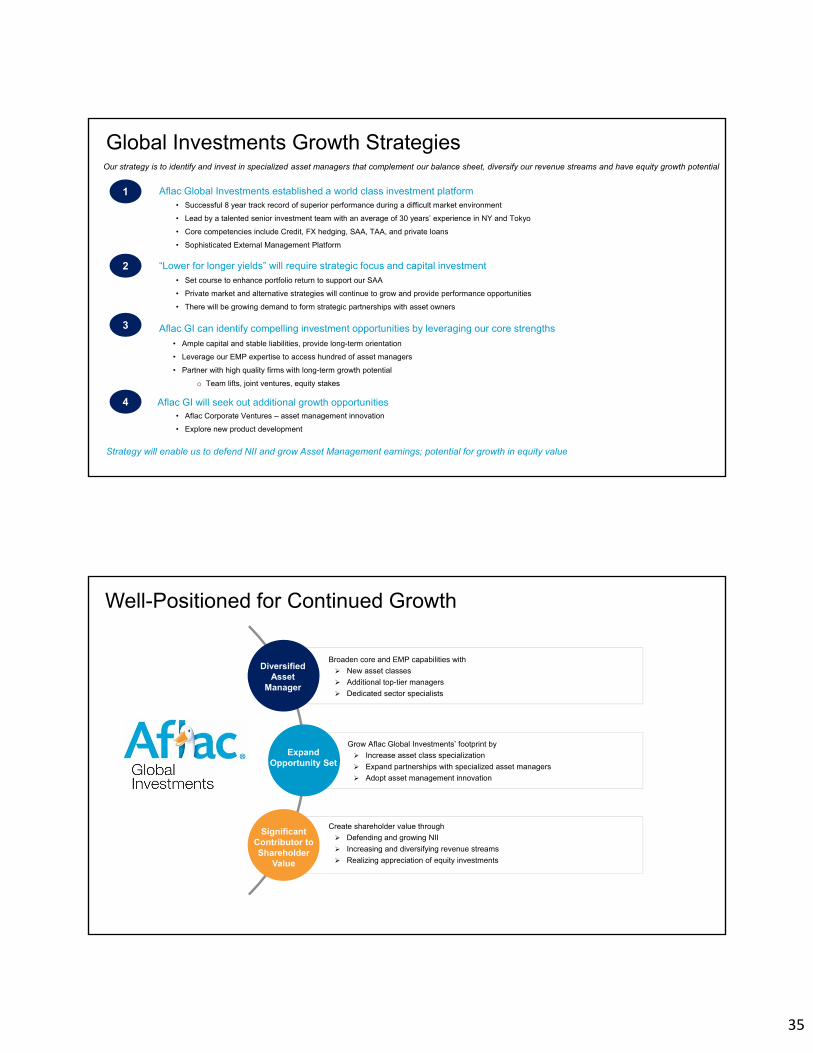
Global Investments Growth Strategies
1 Aflac Global Investments established a world class investment platform• Successful 8 year track record of superior performance during a difficult market environment
• Lead by a talented senior investment team with an average of 30 years’ experience in NY and Tokyo
• Core competencies include Credit, FX hedging, SAA, TAA, and private loans
• Sophisticated External Management Platform
2
Aflac GI can identify compelling investment opportunities by leveraging our core strengths
• Set course to enhance portfolio return to support our SAA
• Private market and alternative strategies will continue to grow and provide performance opportunities
• There will be growing demand to form strategic partnerships with asset owners
3
• Ample capital and stable liabilities, provide long-term orientation
• Leverage our EMP expertise to access hundred of asset managers
• Partner with high quality firms with long-term growth potential
o Team lifts, joint ventures, equity stakes
Our strategy is to identify and invest in specialized asset managers that complement our balance sheet, diversify our revenue streams and have equity growth potential
4 Aflac GI will seek out additional growth opportunities• Aflac Corporate Ventures – asset management innovation
• Explore new product development
Strategy will enable us to defend NII and grow Asset Management earnings; potential for growth in equity value
“Lower for longer yields” will require strategic focus and capital investment
Significant Contributor to Shareholder
Value
Diversified Asset
Manager
ExpandOpportunity Set
Broaden core and EMP capabilities with
New asset classes
Additional top-tier managers
Dedicated sector specialists
Grow Aflac Global Investments’ footprint by
Increase asset class specialization
Expand partnerships with specialized asset managers
Adopt asset management innovation
Create shareholder value through
Defending and growing NII
Increasing and diversifying revenue streams
Realizing appreciation of equity investments
Well-Positioned for Continued Growth

36
Appendix
18%
12%
7%
28%
14%
14%
3%3%1%
YTD 6/30/2019
CMLs
High Yield
Growth Assets
MMLs (Floating)
TRE (Floating)
IG Corporates
Yen Public Credit
JGBs
Private Placements
Book Value: $102 billion $106 billion
Duration: 13.5 years 13.3 years
Book Yield: 2.59% 2.59%
New Money Yield: 2.88% 3.50%
Quality: A A
Aflac Japan Portfolio Asset AllocationBased on U.S. GAAP Book Value
• New money allocated 63% to USD denominated assets; 37% to yen-denominated assets
• 28% of new money allocated to floaters
• Modest pacing of growth assets – 3%
Portfolio Asset Allocation
Asset Allocation Highlights
Note: Percentages may not add to 100 due to rounding 1Includes RMBS, Municipal Bonds, Corporate Bonds 2Includes HY Corporates, CMLs, Infrastructure 3Includes Transitional Real Estate, Middle Market Loans, Bank Loans, Infrastructure (floating) 4Includes Japan/US Equity and Alternatives
New Money Asset Allocation
6/30/20196/30/2018
50%
19%
4%
19%
6%
1%
JGBs Yen Private Placements Other Yen Fixed Income USD Fixed Income USD Floating Rate Growth
50%
20%
4%
20%
5%
1%
¥547 billion
1 2 3 4
¥
$

37
59%
11%
11%
6%6%4%3%
YTD 6/30/2019
Growth
MML (Floating)
CMLs
Infra Debt
TRE (Floating)
Municipals
Corporates
77%
8%
6%8%
1%
IG Corporates Munis Other USD Fixed Rate USD Floating Rate Growth Assets
Book Value: $13 billion $14 billion
Duration: 9.0 years 8.9 years
Book Yield: 5.53% 5.43%
New Money Yield: 4.33% 4.47%
Quality BBB+ A-
Aflac U.S. Portfolio Asset Allocation1
Based on U.S. GAAP Book Value
• 52% of new money allocated to IG Corporates
• 15% of new money allocated to floaters
• Modest pacing of growth assets – 3%
Portfolio Asset Allocation
Asset Allocation Highlights
New Money Asset Allocation
6/30/20196/30/2018
81%
8%4%
5%
1%
$1,250 billion
3 4 5
Note: Percentages may not add to 100 due to rounding. 1Aflac US Segment; excludes Aflac Inc. and CAIC Retrocession 2Includes Tax Free and Taxable Munis 3Other USD fixed rate includes Government, Agency (foreign and supranational), CMLs, Infrastructure, and High Yield Corporates 4USD floating rate includes Middle Market Loans, Transitional Real Estate 5Includes US Equity and Alternatives
2

38
Financial Outlook and Capital Management
Max K. BrodénSenior Vice President; Deputy Chief Financial Officer and Treasurer; Head of Corporate Development, Aflac Incorporated
Aflac Japan: Strength in Core Margins1
1 Based on current U.S. GAAP2 Benefit ratio measured to earned premium3 Expense ratio measured to total revenue
Aflac Japan
Revenue CAGR (-1.5 to -2.5%)
Considerations
• Business mix
• IT and digital investments
1H 2019 2019e 2019e – 2021e
Total Total Total
Benefit Ratio2 69.0% ~69.0 - 69.5% 68.5 - 70.5%
Expense Ratio3 20.3% ~21.0 - 21.5% 20 - 22%
Pretax Profit Margin 21.9% ~21.0 - 21.5% 20 - 22%

39
Aflac U.S.: Stable Profit Margins1
Aflac U.S.2
• Business mix
• IT and digital investments
• Excess capital drawdown
Revenue CAGR ~ 2%
Considerations
1H 2019 2019e 2019e – 2021e
Total Total Total
Benefit Ratio3 49.7% ~50% 49 - 51%
Expense Ratio4 35.6% ~36.5% 35 - 37%
Pretax Profit Margin 20.2% ~19% 19 - 21%
1 Based on current U.S. GAAP2 Excludes Argus 3 Benefit ratio measured to earned premium 4 Expense ratio measured to total revenue
SMR Sensitivity as of June 30, 2019(% points1)
Yen rates +1% (58)
Dollar rates +1% (47)
Yen strengthens +10 (76)
Credit spreads +1% (82)
FSA Earnings Projection(Fiscal year ending March 31, ¥ in millions)2
• AFS portfolio and foreign currency influences SMR, FSA earnings and ultimate dividend capacity:
200%
Aflac Japan Capital and FSA Earnings
Retained earnings + Other capital reserve - Unrealized after-tax net loss on AFS
Dividend capacity
1 SMR sensitivities to rates, spreads and currency movement are not linear 2 Assumes average exchange rate of 110 ¥/$
Dividend Policy: 80% - 100% of FSA Earnings
203,700
0
25,000
50,000
75,000
100,000
125,000
150,000
175,000
200,000
2019 2020e 2021e 2022e
Represents asset impairment, realized loss budget and F/X volatility
961
Regulatory Minimum
200
Internal Framework Minimum
500
0
400
800
1,200
2019 2020e 2021e 2022e
Solvency Margin Ratio (Fiscal year ending March 31, %)

40
Aflac U.S. Capital and Statutory Earnings
1 RBC ratio for American Family Life Assurance Company of Columbus; projections exclude the impact of proposed C-1 changes2 U.S. statutory earnings excluding Aflac Japan and includes Aflac (Columbus) and CAIC (Aflac Group)
• 2019 - 2020 annual statutory net earnings run-rate of $800 to $850 million
• Ordinary dividend of 80% - 100% of U.S. statutory earnings
Considerations
U.S. Statutory Earnings Projection2
(Fiscal year ending December 31, $ in millions)
791
200
300
400
500
600
700
800
900
1,000
2018 2019e 2020e 2021eRepresents asset impairment and realized loss budget
560
00
100
200
300
400
500
600
2018 2019e 2020e 2021e
Aflac Risk-Based Capital Ratio1
(Fiscal year ending December 31, %)
Expected Impacts of LDTI on U.S. GAAP FinancialsAflac Japan’s $35 Billion of Cancer In Force Drives a Unique Impact
Adoption Update:
• Likely to adopt modified retrospective• Anticipate adoption first quarter 2022• Implementation costs of $60 million from 2019 to 2021
Impact Analysis
• Income Statement Impact:
» Increase in nearer term earnings from lowering net premium reserve ratio
• Balance Sheet Impact: (upon transition, assuming current rate environment)
» AOCI – significant unrealized loss on discount rate applied to Japan liabilities
» Asset Gains - No offset from unrealized gains on approximately $31 billion of Japan HTM assets» ALM - Japan cancer accelerates rate loss component without associated morbidity gains
• No impact to statutory capital or earnings in U.S. or Japan• No impact to holding company cash flow and excess capital and liquidity• No impact to gross premium valuation (GPV) margins which take into account all cash flows
Economic Value impact - Zero

41
Value Creation1
6
10
14
18
2015 2016 2017 2018 1H19
AROE COE
$0
$6,000
$12,000
$18,000
$24,000
2015 2016 2017 2018 1H19$0
$500
$1,000
$1,500
$2,000
Equ
ity e
x-A
OC
I ($m
m)
Va
lue
Cre
ated
($m
m)
Value Created Equity ex-AOCI
• Stable differential between adjusted return on equity and cost of equity
• Building equity and creating value, as measured by the product of equity and the differential between AROE and COE
%
1Value created = (AROE – COE) * equity ex. AOCI
Lowering Enterprise Exposure to Currency
$16 Billion
$3 Billion
$4.4 Billion
Hedging Real Economic Events
• Cash flows from the foreign subsidiary, Aflac Life Insurance Japan, to the holding company
• Future expected cash flows on a present value basis
Economic Hedge: Protecting current and future distributions of Japan’s economic value
Constraints
Unhedged USD FSA earnings and SMR volatility
Enterprise Hedging Program Holding company liquidity
Yen-denominated debt Japan debt capital market conditions

42
Aflac Incorporated Strong Capital & LiquidityAflac Incorporated Liquidity
Notes Payable Maturity Profile 4 (In millions)
Capital Structure and Liquidity Objectives
• Maintain strong capital ratios and investment grade ratings
• Support nimble investment in our strategic growth objectives
• Balanced shareholder distribution policy
• Defend low cost of capital
• Optimize yen and dollar financing mix while managing duration
• Maintain leverage ratios within our current ratings
$mm 2017 2018 2019e
Operating Cash1 $2,683 $2,765 $3,664
- Capital Buffer2 $1,000 $1,000 $1,000
- Liquidity Support2 $500 $1,000 $1,000
Cash Available to Shareholders3 $1,183 $765 $1,664
350
700 750
450300 224 257
400550
46
232
557
272141 83
557278
0
200
400
600
800
1,000
1,200
19 20 21 22 23 24 25 26 27 28 29 30 31 32 33 … 38 39 40 … 46 47 48 49
Aflac Life Insurance Japan Hybrid
Aflac Incorporated Subordinated Debt (Call)
Aflac Incorporated Global Yen
Aflac Incorporated Samurai Term Loans
Aflac Incorporated USD Notes
$
1Total cash less non-operating cash 2Balance based on internal policy
3Net cash that may be deployable to shareholders at a given time4As of 6/30/2019. USD notes based on issuance amount
Year
Low risk liabilities – Lowered asset risk – Stability in margins and cash flows
LDTI – Economic modeling – Capital allocation
Modeling
Strong capital ratios – Reduced FX exposure – Reduced investment risk
Financial Focus
Risk reduction
Earnings profile
Economic Value-Based Criteria
43
Growth Investments & Capital Allocation
Frederick J. CrawfordExecutive Vice President; Chief Financial Officer,Aflac Incorporated
44
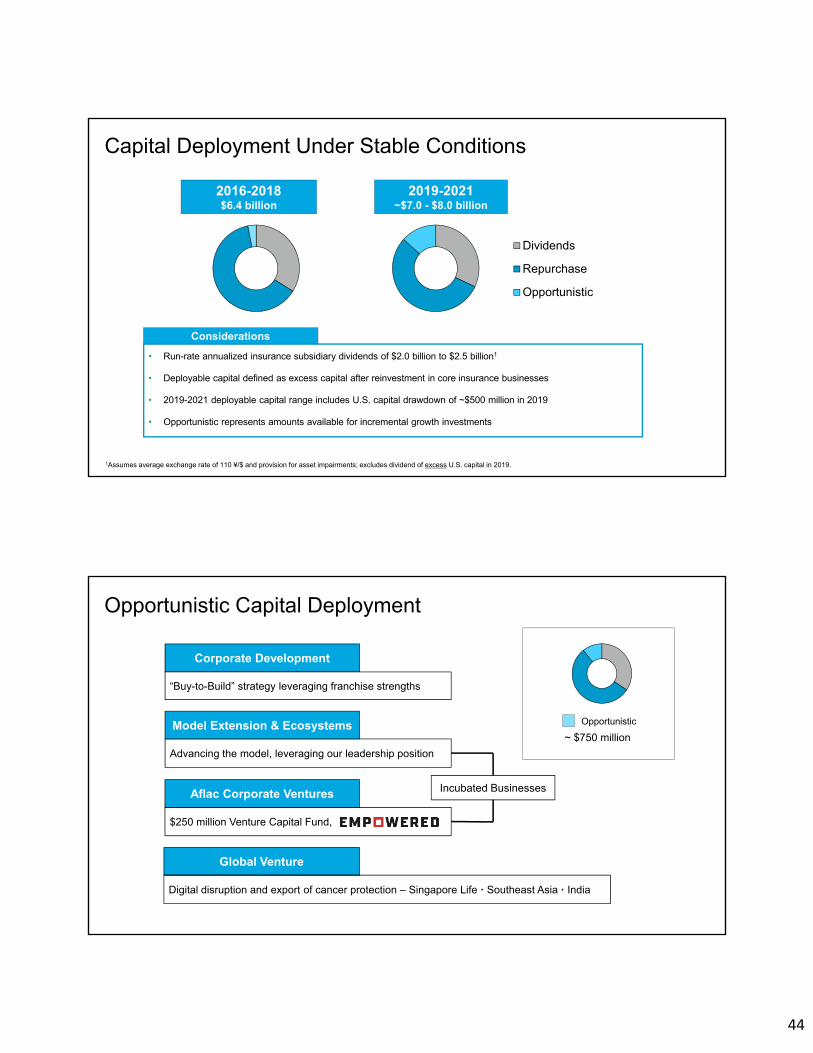
Capital Deployment Under Stable Conditions
2016-2018 $6.4 billion
2019-2021 ~$7.0 - $8.0 billion
Considerations
• Run-rate annualized insurance subsidiary dividends of $2.0 billion to $2.5 billion1
• Deployable capital defined as excess capital after reinvestment in core insurance businesses
• 2019-2021 deployable capital range includes U.S. capital drawdown of ~$500 million in 2019
• Opportunistic represents amounts available for incremental growth investments
Dividends
Repurchase
Opportunistic
1Assumes average exchange rate of 110 ¥/$ and provision for asset impairments; excludes dividend of excess U.S. capital in 2019.
Advancing the model, leveraging our leadership position
“Buy-to-Build” strategy leveraging franchise strengths
Corporate Development
$250 million Venture Capital Fund,
Opportunistic Capital Deployment
Aflac Corporate Ventures
Model Extension & Ecosystems
Incubated Businesses
Global Venture
Digital disruption and export of cancer protection ‒ Singapore Life ꞏ Southeast Asia ꞏ India
Opportunistic
~ $750 million

45
Corporate Development – “Buy to Build”
2009 2015 2019 (Pending)
Purchase Price: $40 million
Strategic Rationale:
Tech platform supporting small business HR solutions
Purchase Price: $96 million1
Strategic Rationale:
Entry into the network dental and vision market
Quality platforms with domain expertise leveraging the power of Aflac’s franchise
Purchase Price: $100 million
Strategic Rationale:
Entry into the supplemental group insurance business
1Includes $21 million in contingency payments. Subject to regulatory approval – forecasted to close 4Q 2019.
Network Dental & Vision
New Business Incubation
Advancing the Model: Business Incubation
Cancer in Japan
U.S. Small Businesses HR Solutions
U.S. Consumer Markets (Digital)
~$200mm of allocated capital through 2021 with measurable revenue contribution in 2022
Japan Consumer Markets (Digital)
Aflac is not offered to employee
Access to Aflac at the worksite
Self-employed - no Aflac access
126.6 million without access to Aflac
Leveraging Leadership in an Ecosystem
Source: 2016 U.S. Census Bureau; Bureau of Labor Statistics

46
(Oishi Kenko)
19%
7%
14%60%
Total Fund$250 million
Direct Investment $49.9M 19%
Fund Investment $19.9M 7%
In process $37.0M 14%
Remaining funds $143.2M 60%
5%10%
23%
33%
29%
Allocation by Sector
$69.8 million
2%
35%
35%
28%
Allocation by Stage
$69.8 million
Customer Support $3.5M 5%
Benefit (Cancer) Ecosystem $7.2M 10%
Distribution/Enrollment $16.1M 23%
Health/Wellness $23.1M 33%
External Funds $19.9M 29%
Seed $1.5M 2%
Early Stage $24.3M 35%
Late Stage $24.1M 35%
External Fund $19.9M 28%
Current Investments
Note: As of September 2019; allocation by stage and security type are as of time of investment and subject to change.
Aflac Venture Fund - $250 million
Global Ventures
• Gain exposure to growing Southeast Asia and India digital insurance markets
• Partner with a digitally focused platform seeking to disrupt traditional models
• Export our cancer insurance expertise via reinsurance partnership
• Limit capital-at-risk and commitment of Aflac management time and energy
• Singapore Life: focused on building-out its presence in Singapore with a desire to expand throughout Southeast Asia
Aflac’s Long-Term Objectives
$36 million investment

47
Financial Overview
• Investments: De-risking while defending net investment income
• Margins: Stable profit margins while funding growth and digital initiatives
• Tactical: Building opportunistic capital and reducing enterprise FX exposure
• Accounting: LDTI adoption, rating agency dialogue, and disclosures
• Capital Deployment: Balanced with shift toward growth investments
Guided by Growth & Stability of Economic Value
Strategic Outlook

48
Appendix
Glossary of Non-U.S. GAAP MeasuresThe Company defines adjusted earnings (a non-U.S. GAAP financial measure) as the profits derived from operations. The most comparable U.S. GAAP measure isnet earnings. Adjusted earnings are adjusted revenues less benefits and adjusted expenses. The adjustments to both revenues and expenses account for certainitems that cannot be predicted or that are outside management’s control. Adjusted revenues are U.S. GAAP total revenues excluding realized investment gains andlosses, except for amortized hedge costs/income related to foreign currency exposure management strategies and net interest cash flows from derivatives associatedwith certain investment strategies. Adjusted expenses are U.S. GAAP total acquisition and operating expenses including the impact of interest cash flows fromderivatives associated with notes payable but excluding any nonrecurring or other items not associated with the normal course of the Company’s insurance operationsand that do not reflect the Company's underlying business performance.
Adjusted earnings excluding current period foreign currency impact are computed using the average yen/dollar exchange rate for the comparable prior-year period,which eliminates fluctuations driven solely by yen-to-dollar currency rate changes.
Adjusted return on equity excluding foreign currency impact is calculated using adjusted earnings excluding the impact of the yen/dollar exchange rate, as reconciledwith total U.S. GAAP net earnings, divided by average shareholders’ equity, excluding accumulated other comprehensive income (AOCI). The most comparable U.S.GAAP financial measure is return on average equity (ROE) as determined using net earnings and average total shareholders’ equity.
Adjusted book value is the U.S. GAAP book value (representing total shareholders’ equity), less Accumulated Other Comprehensive Income (AOCI) as recorded onthe U.S. GAAP balance sheet. The Company considers adjusted book value important as it excludes AOCI, which fluctuates due to market movements that areoutside management’s control.
Amortized hedge costs/income represent costs/income incurred or recognized in using foreign currency forward contracts to hedge certain foreign exchange risks inthe company's Japan segment (costs) or in the Corporate and Other segment (income). These amortized hedge costs/ income are derived from the differencebetween the foreign currency spot rate at time of trade inception and the contractual foreign currency forward rate, recognized on a straight line basis over the term ofthe hedge. There is no comparable U.S. GAAP financial measure for amortized hedge costs/income.
A non-U.S. GAAP financial measure, normalized earned premium is adjusted to account for the effect of paid-up policies on earned premium. This normalized effect ofpaid up policies is not a part of adjusted revenues as previously defined. In reliance on the “unreasonable efforts” exception in 17 CFR §244.100(a)(2), a quantitativereconciliation of adjusted earned premium to the most comparable U.S. GAAP measure, earned premium, is not provided. Forward-looking information with regard toearned premium is not available without unreasonable effort. This is due to the unpredictable and uncontrollable nature of the reconciling items, which would require anunreasonable effort to forecast and we believe would result in such a broad range of projected values that would not be meaningful to investors. For this reason, webelieve that the probable significance of such information is low.

49
In Millions Per Diluted Share
2019 (YTD June 30, 2019)
2018 2017 2016 20152019
(YTD June 30, 2019)
2018 2017 2016 2015
Net earnings $1,745 $2,920 $4,604 $2,659 $2,533 $2.32 $3.77 $5.77 $3.21 5.85
Items impacting net earnings:
Realized investment (gains) losses (70) 297 0 (87) (94) (0.09) 0.38 .00 (0.10) (0.33)
Other and non-recurring (income) loss 1 75 69 137 233 .00 0.10 0.08 0.16 0.12
Income tax (benefit) expense on items excluded from adjusted earnings 18 (83) (24) (18) (48) 0.02 (0.11) (0.03) (0.02) 0.53
Tax reform adjustment 0 18 (1,933) 0 0 .00 0.02 (2.42) .00 (0.11)
Adjusted earnings 1,695 3,226 2,716 2,691 2,624 2.25 4.16 $3.40 3.25 6.06
Current period foreign currency impact 13 N/A N/A N/A N/A .02 N/A N/A N/A N/A
Adjusted earnings excluding current period foreign currency impact $1,708 $3,226 $2,716 $2,691 $2,624 $2.27 $4.16 $3.40 $3.25 $6.06
Reconciliation of U.S. GAAP Net Earnings to Adjusted Earnings
2019(YTD June 30, 2019) 2018 2017 2016 2015
U.S. GAAP ROE 13.5 % 12.2 % 20.4 % 13.9 % 14.1 %
Impact of excluding unrealized foreign currency translation gains (1.0)% (1.0)% (2.0)% (1.7)% (2.0)%
Impact of excluding unrealized gains (losses) on securities and derivatives 3.9 % 3.0 % 5.8 % 3.1 % 3.2 %
Impact of excluding pension liability adjustment (0.1)% (0.1)% (0.2)% (0.1)% (0.1)%
Impact of excluding AOCI 2.7 % 1.8 % 3.6 % 1.3 % 1.1 %
U.S. GAAP ROE - less AOCI 16.2 % 13.9 % 24.0 % 15.2 % 15.1 %Differences between adjusted & net earnings (0.5)% 1.5 % (9.8)% 0.2 % 0.5 %
Adjusted ROE - reported 15.7 % 15.4 % 14.2 % 15.4 % 15.7 %
Less impact of foreign currency (0.1)% N/A N/A N/A N/A Adjusted ROE, excluding foreign currency impact 15.8 % 15.4 % 14.2 % 15.4 % 15.7 %
Reconciliation of U.S. GAAP Return on Equity (ROE) to Adjusted ROE