Embed Size (px)
Citation preview
MEDICAID
What’s the 411?
“Medicaid, What’s the 411” was a presentation by Legislative
Budget Board staff for other Legislative Budget Board staff
interested in a Medicaid overview.
April 12, 2012
Overview of Presentation
Brief history of Medicaid
Eligible population
Covered services
Funding
Underfunding
Cost-containment in the current biennium
1115 Waiver and Managed Care
Medicaid Overview and History
Joint State/Federal program that provides
insurance to certain eligible populations
Created in 1965 as Title XIX of the Social Security
Act
Established in Texas in 1967
Administered by the Health and Human Services
Commission (HHSC)
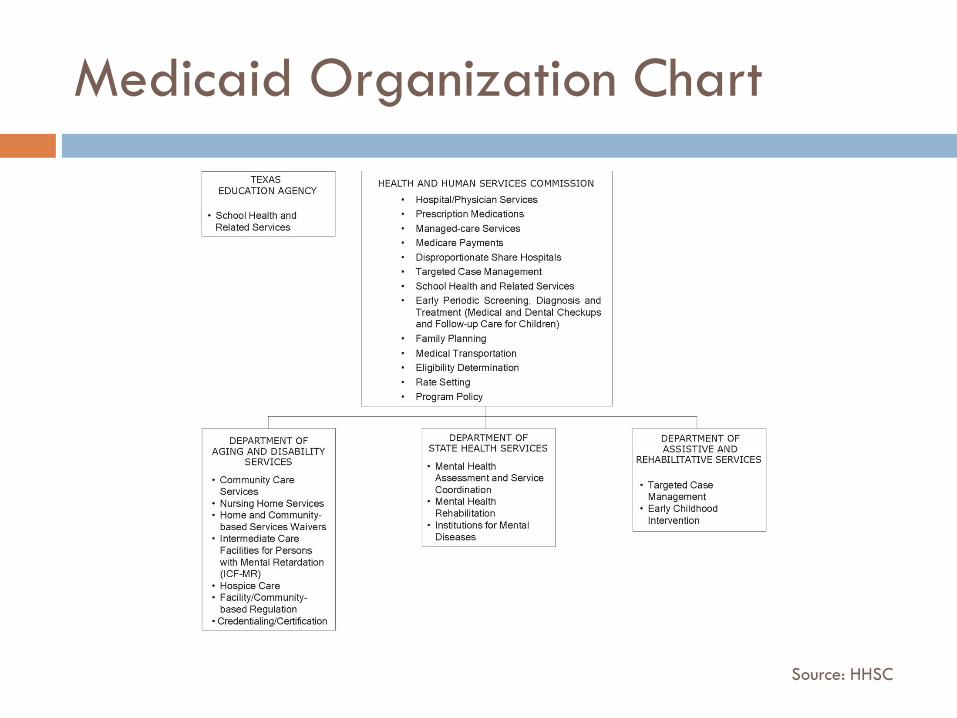
Medicaid Organization Chart
Source: HHSC
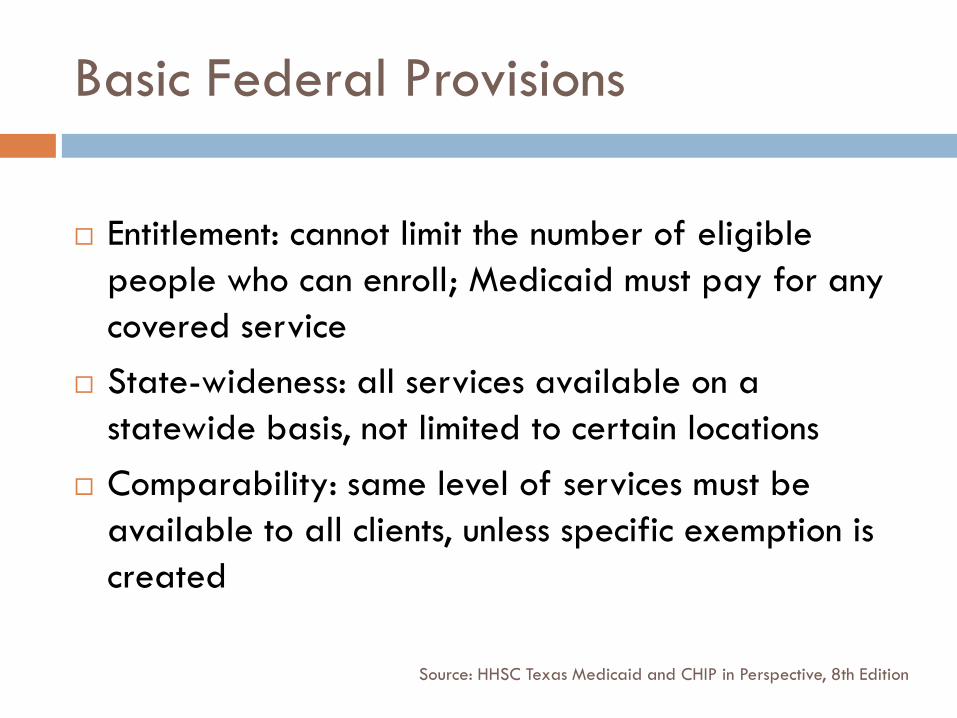
Basic Federal Provisions
Entitlement: cannot limit the number of eligible
people who can enroll; Medicaid must pay for any
covered service
State-wideness: all services available on a
statewide basis, not limited to certain locations
Comparability: same level of services must be
available to all clients, unless specific exemption is
created
Source: HHSC Texas Medicaid and CHIP in Perspective, 8th Edition
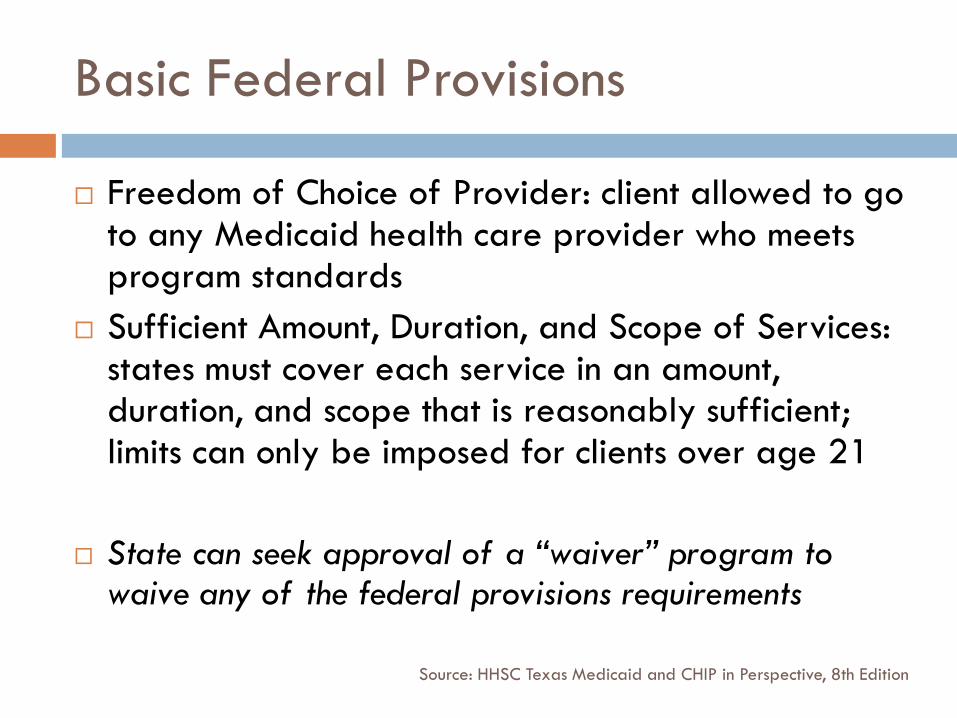
Basic Federal Provisions
Freedom of Choice of Provider: client allowed to go to any Medicaid health care provider who meets program standards
Sufficient Amount, Duration, and Scope of Services: states must cover each service in an amount, duration, and scope that is reasonably sufficient; limits can only be imposed for clients over age 21
State can seek approval of a “waiver” program to waive any of the federal provisions requirements
Source: HHSC Texas Medicaid and CHIP in Perspective, 8th Edition
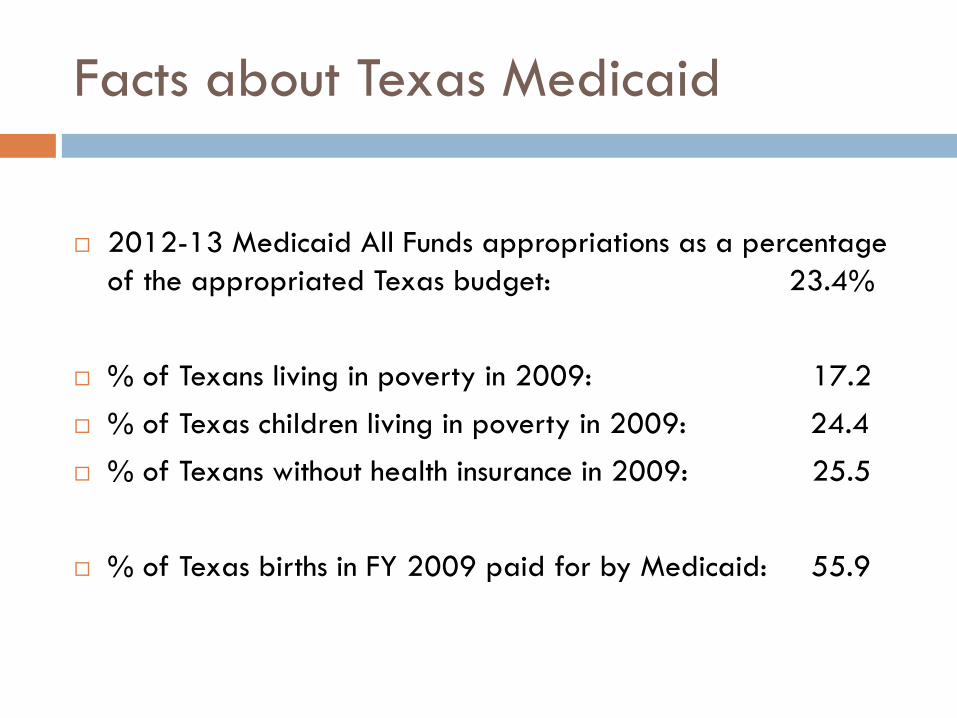
Facts about Texas Medicaid
2012-13 Medicaid All Funds appropriations as a percentage
of the appropriated Texas budget: 23.4%
% of Texans living in poverty in 2009: 17.2
% of Texas children living in poverty in 2009: 24.4
% of Texans without health insurance in 2009: 25.5
% of Texas births in FY 2009 paid for by Medicaid: 55.9
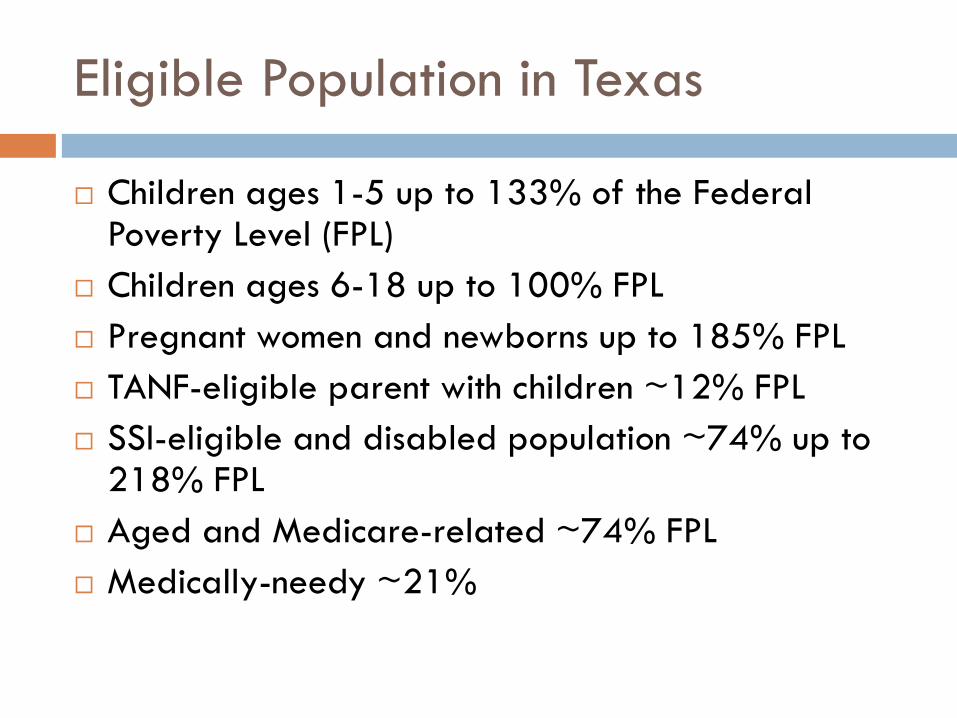
Eligible Population in Texas
Children ages 1-5 up to 133% of the Federal Poverty Level (FPL)
Children ages 6-18 up to 100% FPL
Pregnant women and newborns up to 185% FPL
TANF-eligible parent with children ~12% FPL
SSI-eligible and disabled population ~74% up to 218% FPL
Aged and Medicare-related ~74% FPL
Medically-needy ~21%
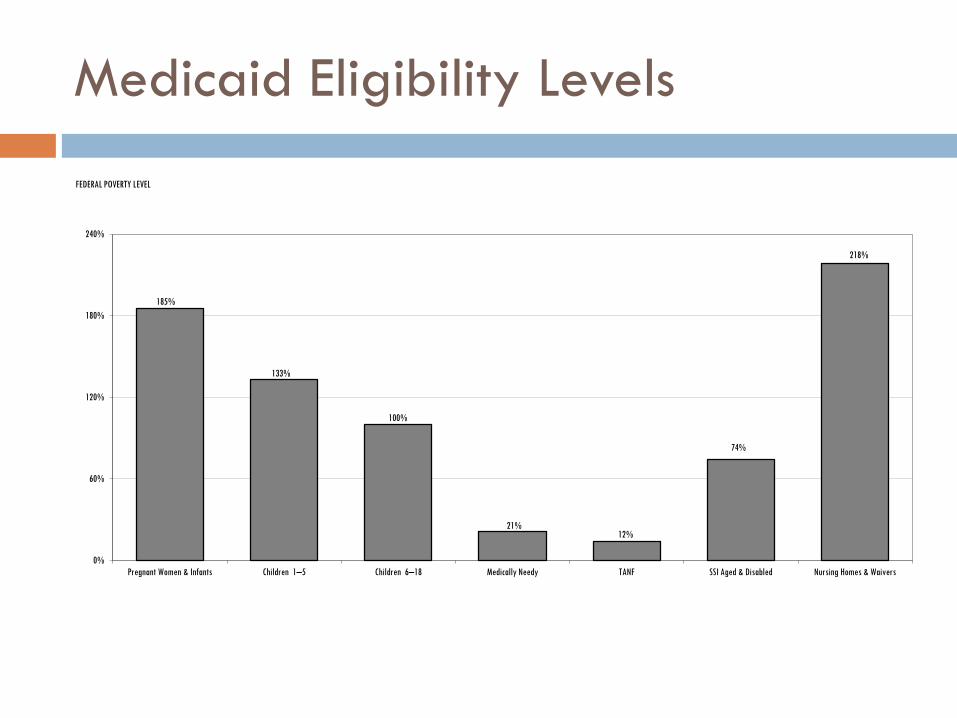
Medicaid Eligibility Levels
185%
133%
100%
21% 12%
74%
218%
0%
60%
120%
180%
240%
Pregnant Women & Infants Children 1–5 Children 6–18 Medically Needy TANF SSI Aged & Disabled Nursing Homes & Waivers
FEDERAL POVERTY LEVEL
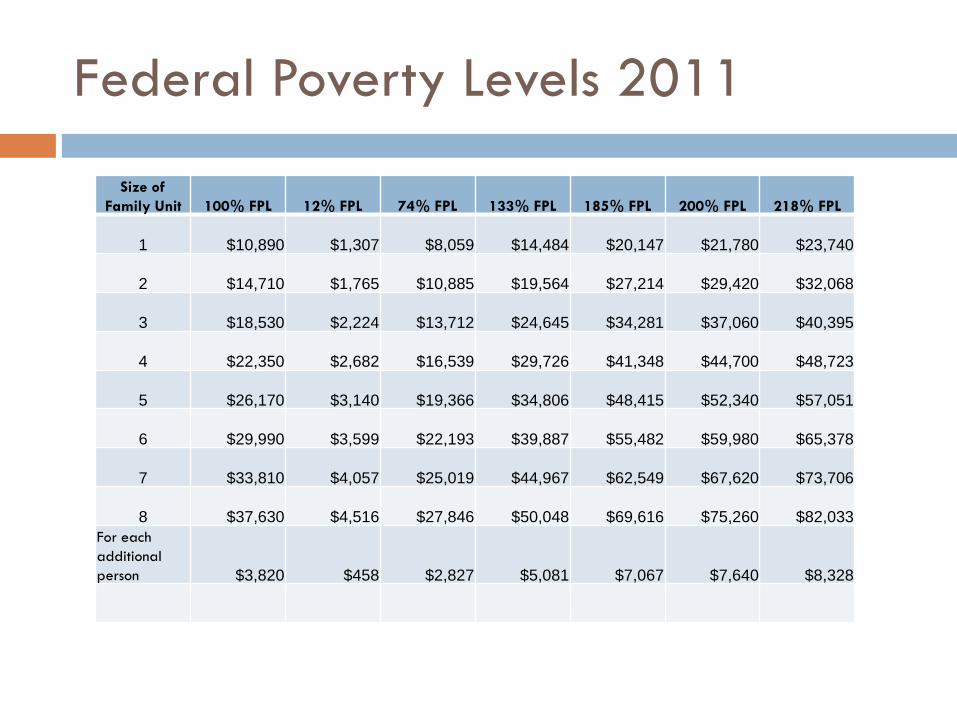
Federal Poverty Levels 2011
Size of
Family Unit 100% FPL 12% FPL 74% FPL 133% FPL 185% FPL 200% FPL 218% FPL
1 $10,890 $1,307 $8,059 $14,484 $20,147 $21,780 $23,740
2 $14,710 $1,765 $10,885 $19,564 $27,214 $29,420 $32,068
3 $18,530 $2,224 $13,712 $24,645 $34,281 $37,060 $40,395
4 $22,350 $2,682 $16,539 $29,726 $41,348 $44,700 $48,723
5 $26,170 $3,140 $19,366 $34,806 $48,415 $52,340 $57,051
6 $29,990 $3,599 $22,193 $39,887 $55,482 $59,980 $65,378
7 $33,810 $4,057 $25,019 $44,967 $62,549 $67,620 $73,706
8 $37,630 $4,516 $27,846 $50,048 $69,616 $75,260 $82,033
For each
additional
person $3,820 $458 $2,827 $5,081 $7,067 $7,640 $8,328
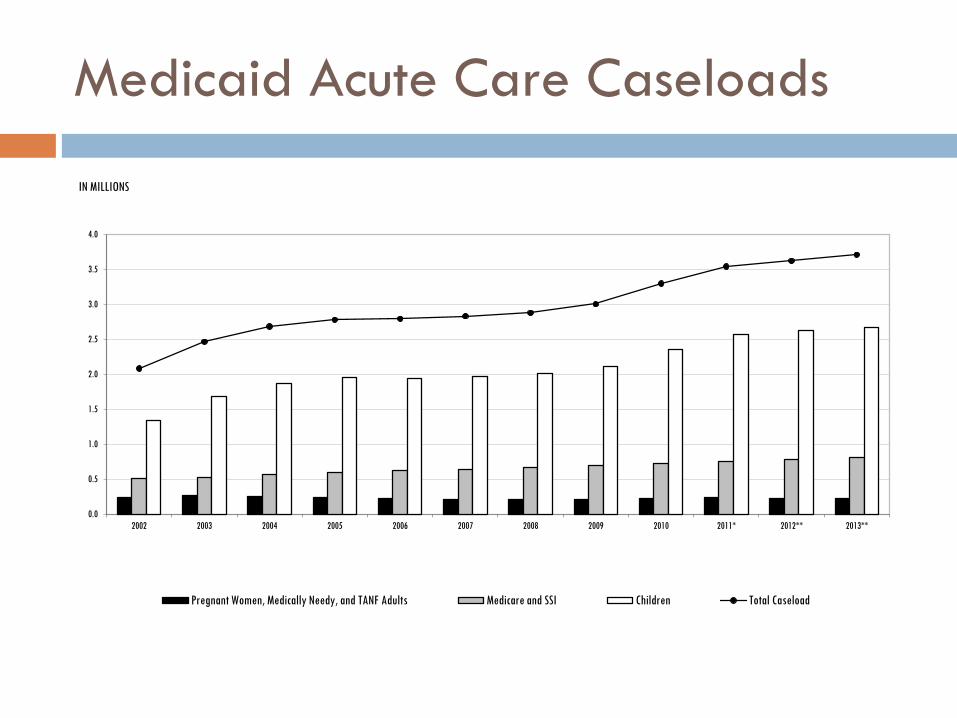
Medicaid Acute Care Caseloads
0.0
0.5
1.0
1.5
2.0
2.5
3.0
3.5
4.0
2002 2003 2004 2005 2006 2007 2008 2009 2010 2011* 2012** 2013**
IN MILLIONS
Pregnant Women, Medically Needy, and TANF Adults Medicare and SSI Children Total Caseload
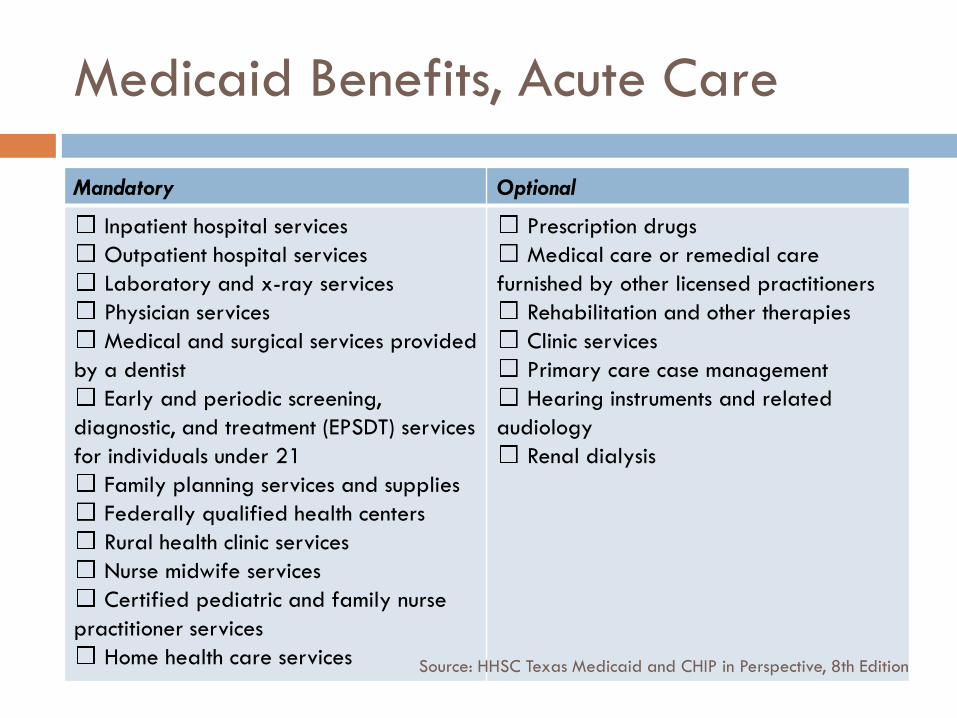
Medicaid Benefits, Acute Care
Mandatory Optional
Inpatient hospital services
Outpatient hospital services
Laboratory and x-ray services
Physician services
Medical and surgical services provided
by a dentist
Early and periodic screening,
diagnostic, and treatment (EPSDT) services
for individuals under 21
Family planning services and supplies
Federally qualified health centers
Rural health clinic services
Nurse midwife services
Certified pediatric and family nurse
practitioner services
Home health care services
Prescription drugs
Medical care or remedial care
furnished by other licensed practitioners
Rehabilitation and other therapies
Clinic services
Primary care case management
Hearing instruments and related
audiology
Renal dialysis
Source: HHSC Texas Medicaid and CHIP in Perspective, 8th Edition

Medicaid Benefits, Long Term Care
Mandatory Optional
Nursing facility (NF) services for
individuals 21 or over
Intermediate care facility services for
the developmentally disabled
Inpatient services for individuals 65
and over in an institution for mental
diseases (IMD)
Home and community-based services
Targeted case management
Hospice services
Services furnished under a Program of
All-Inclusive Care for the Elderly (PACE)
Source: HHSC Texas Medicaid and CHIP in Perspective, 8th Edition
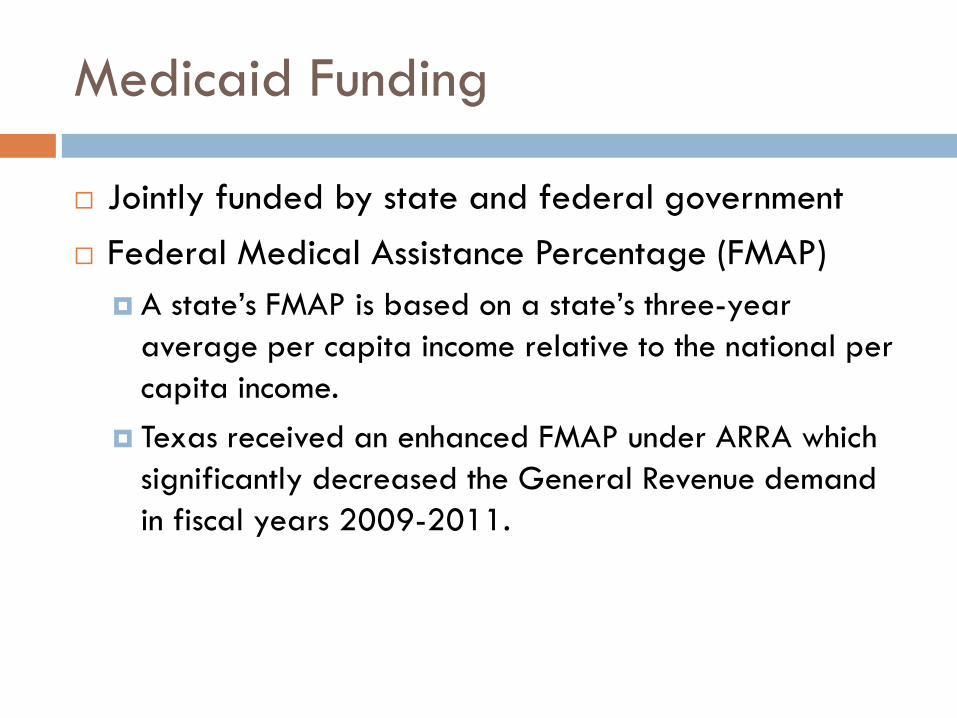
Medicaid Funding
Jointly funded by state and federal government
Federal Medical Assistance Percentage (FMAP)
A state’s FMAP is based on a state’s three-year
average per capita income relative to the national per
capita income.
Texas received an enhanced FMAP under ARRA which
significantly decreased the General Revenue demand
in fiscal years 2009-2011.
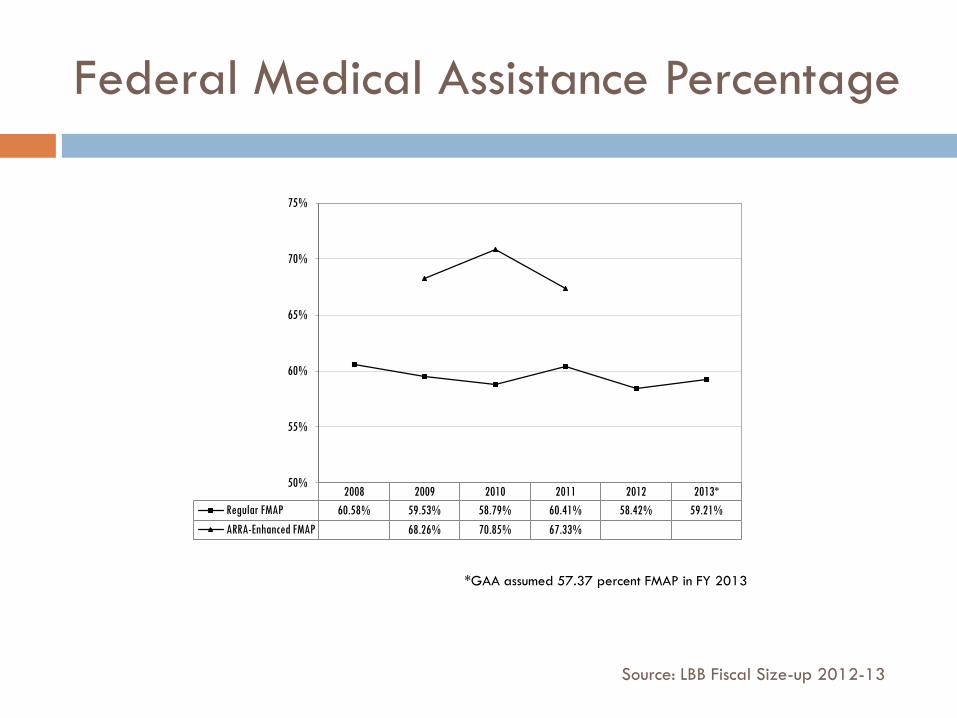
Federal Medical Assistance Percentage
2008 2009 2010 2011 2012 2013*
Regular FMAP 60.58% 59.53% 58.79% 60.41% 58.42% 59.21%
ARRA-Enhanced FMAP 68.26% 70.85% 67.33%
50%
55%
60%
65%
70%
75%
*GAA assumed 57.37 percent FMAP in FY 2013
Source: LBB Fiscal Size-up 2012-13
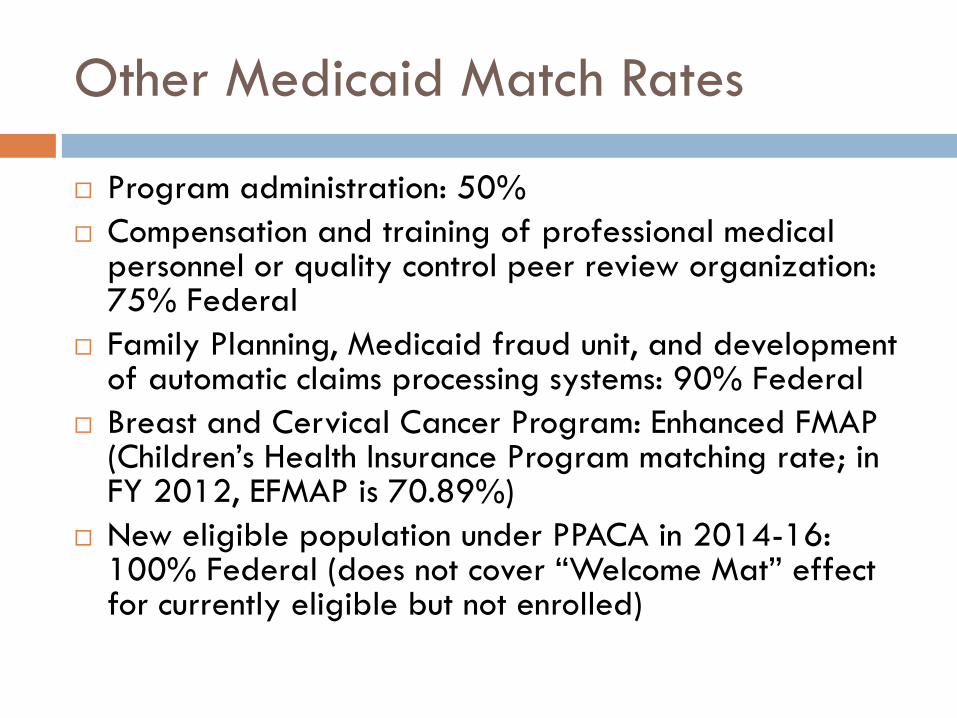
Other Medicaid Match Rates
Program administration: 50%
Compensation and training of professional medical personnel or quality control peer review organization: 75% Federal
Family Planning, Medicaid fraud unit, and development of automatic claims processing systems: 90% Federal
Breast and Cervical Cancer Program: Enhanced FMAP (Children’s Health Insurance Program matching rate; in FY 2012, EFMAP is 70.89%)
New eligible population under PPACA in 2014-16: 100% Federal (does not cover “Welcome Mat” effect for currently eligible but not enrolled)
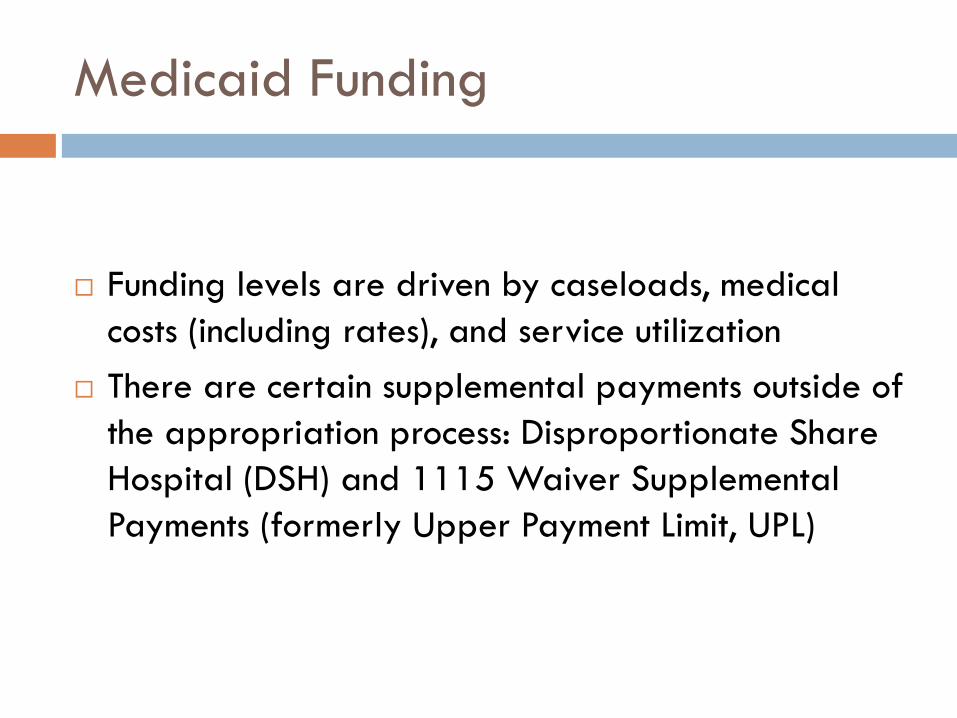
Medicaid Funding
Funding levels are driven by caseloads, medical
costs (including rates), and service utilization
There are certain supplemental payments outside of
the appropriation process: Disproportionate Share
Hospital (DSH) and 1115 Waiver Supplemental
Payments (formerly Upper Payment Limit, UPL)
Provider Reimbursement Rates
HHSC has rate-setting authority for provider reimbursement rates. Rates are typically lower than Medicare rates.
As part of the 5% and 2.5% reductions plans of the 2010-11 biennium, HHSC lowered Medicaid provider reimbursements rates for most services by 2%.
GAA, Article II, Special Provisions Section 16, outlines additional provider rate reductions for the 2012-13 biennium.
GAA, Article II, Special Provisions Section 15, requires LBB approval of certain rate changes.
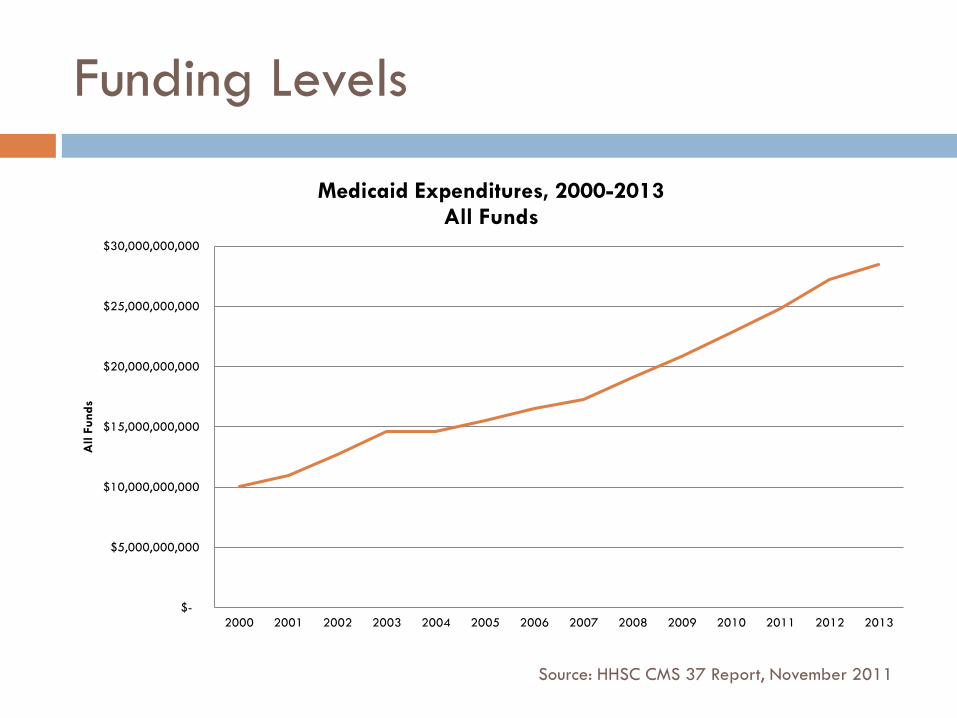
Funding Levels
$-
$5,000,000,000
$10,000,000,000
$15,000,000,000
$20,000,000,000
$25,000,000,000
$30,000,000,000
2000 2001 2002 2003 2004 2005 2006 2007 2008 2009 2010 2011 2012 2013
All F
unds
Medicaid Expenditures, 2000-2013 All Funds
Source: HHSC CMS 37 Report, November 2011
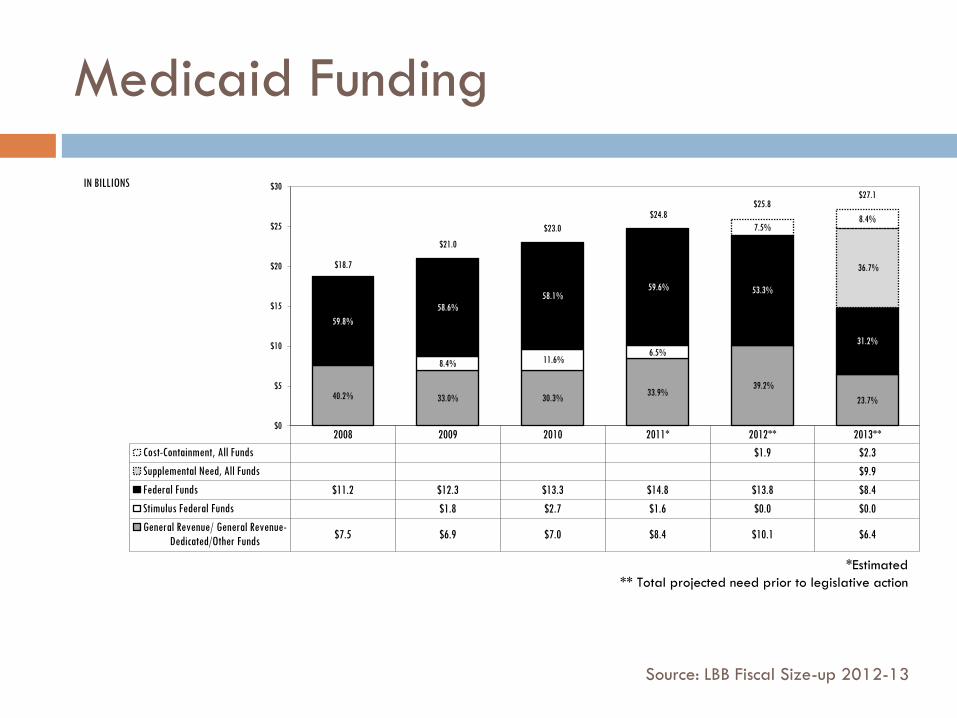
Medicaid Funding
2008 2009 2010 2011* 2012** 2013**
Cost-Containment, All Funds $1.9 $2.3
Supplemental Need, All Funds $9.9
Federal Funds $11.2 $12.3 $13.3 $14.8 $13.8 $8.4
Stimulus Federal Funds $1.8 $2.7 $1.6 $0.0 $0.0
General Revenue/ General Revenue-
Dedicated/Other Funds $7.5 $6.9 $7.0 $8.4 $10.1 $6.4
40.2% 33.0% 30.3% 33.9%
39.2%
23.7%
8.4% 11.6% 6.5%
59.8%
58.6%
58.1% 59.6% 53.3%
31.2%
36.7%
7.5% 8.4%
$0
$5
$10
$15
$20
$25
$30 IN BILLIONS
$18.7
$27.1
$21.0
$23.0
$24.8 $25.8
*Estimated
** Total projected need prior to legislative action
Source: LBB Fiscal Size-up 2012-13
Medicaid Under-funding
Challenges of the 82nd Legislature specific to
Medicaid:
Replace Federal Funds associated with ARRA-FMAP
+ regular program growth
= increase General Revenue demand
+ limited General Revenue
+ challenging political climate
+ entitlement nature of Medicaid
= decision to underfund Medicaid
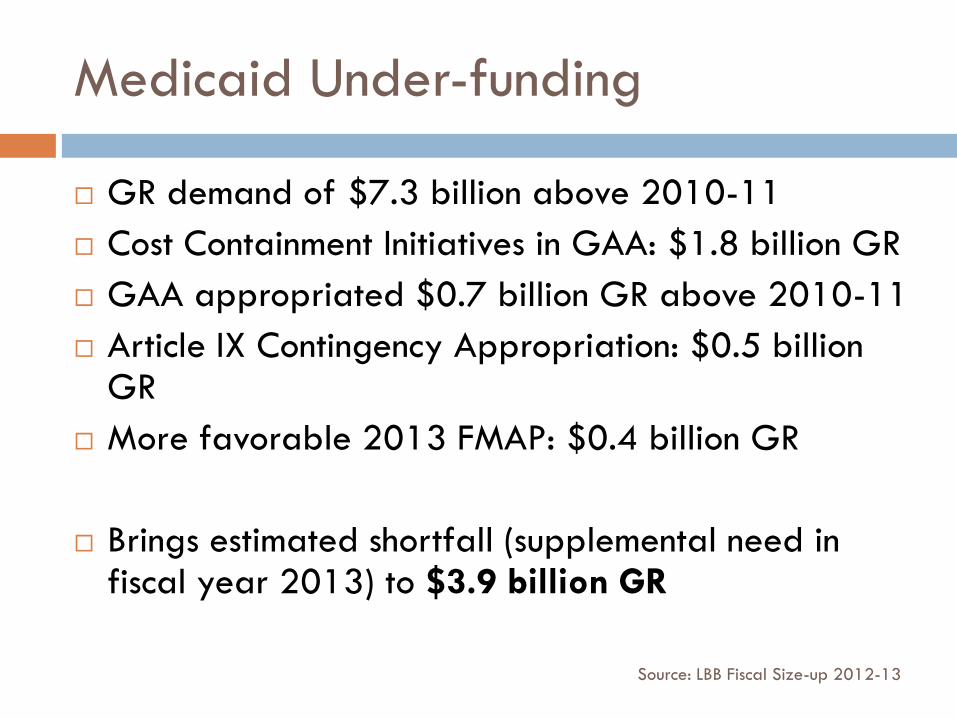
Medicaid Under-funding
GR demand of $7.3 billion above 2010-11
Cost Containment Initiatives in GAA: $1.8 billion GR
GAA appropriated $0.7 billion GR above 2010-11
Article IX Contingency Appropriation: $0.5 billion GR
More favorable 2013 FMAP: $0.4 billion GR
Brings estimated shortfall (supplemental need in fiscal year 2013) to $3.9 billion GR
Source: LBB Fiscal Size-up 2012-13
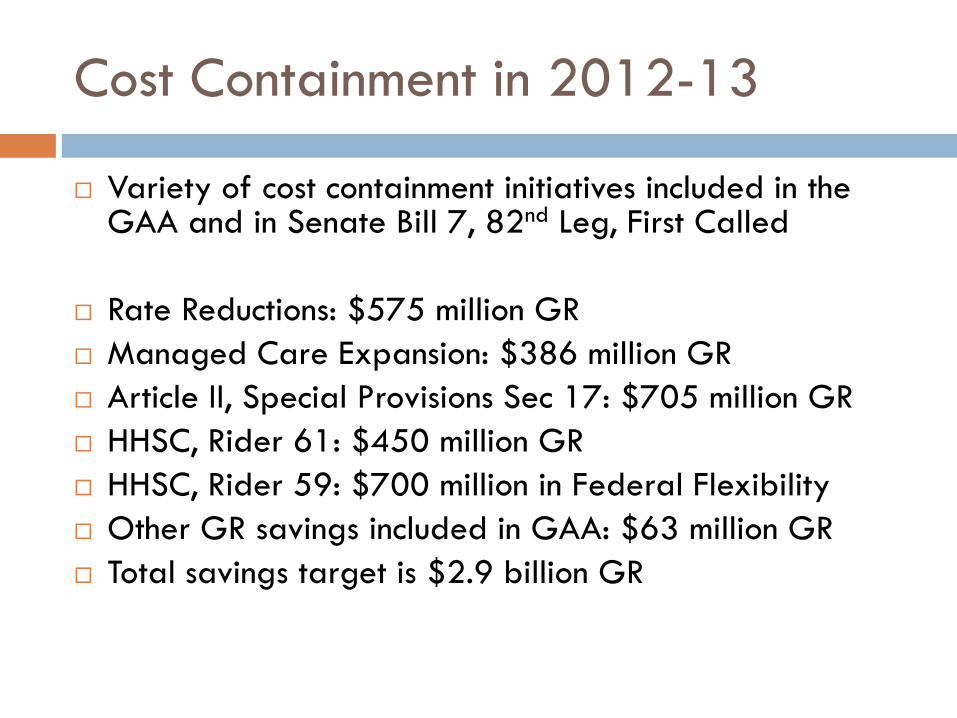
Cost Containment in 2012-13
Variety of cost containment initiatives included in the GAA and in Senate Bill 7, 82nd Leg, First Called
Rate Reductions: $575 million GR
Managed Care Expansion: $386 million GR
Article II, Special Provisions Sec 17: $705 million GR
HHSC, Rider 61: $450 million GR
HHSC, Rider 59: $700 million in Federal Flexibility
Other GR savings included in GAA: $63 million GR
Total savings target is $2.9 billion GR
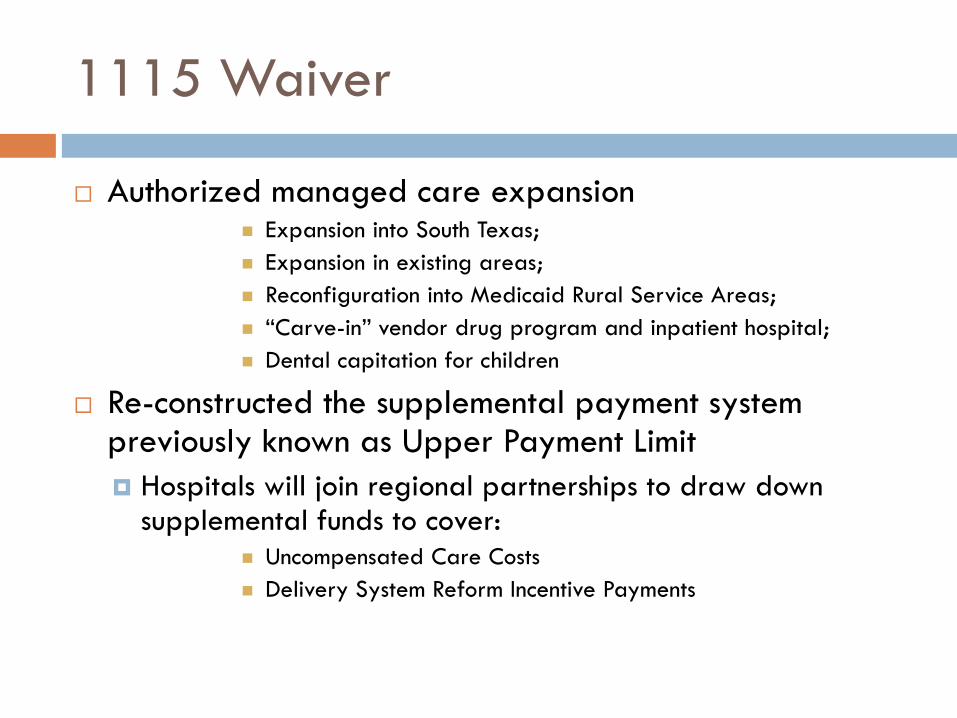
1115 Waiver
Authorized managed care expansion Expansion into South Texas;
Expansion in existing areas;
Reconfiguration into Medicaid Rural Service Areas;
“Carve-in” vendor drug program and inpatient hospital;
Dental capitation for children
Re-constructed the supplemental payment system previously known as Upper Payment Limit
Hospitals will join regional partnerships to draw down supplemental funds to cover:
Uncompensated Care Costs
Delivery System Reform Incentive Payments
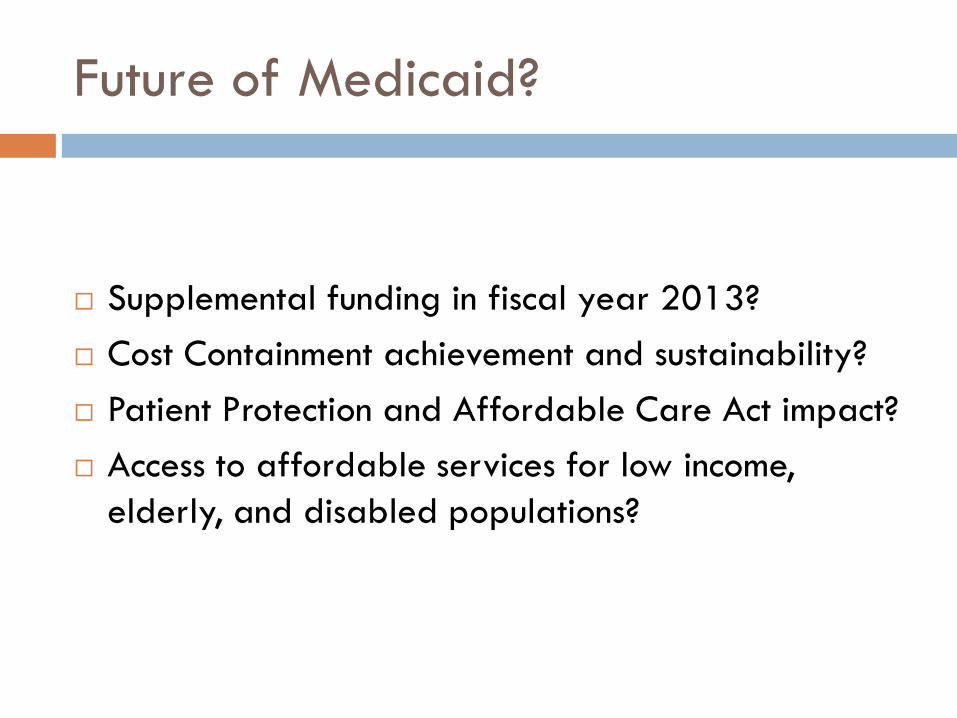
Future of Medicaid?
Supplemental funding in fiscal year 2013?
Cost Containment achievement and sustainability?
Patient Protection and Affordable Care Act impact?
Access to affordable services for low income,
elderly, and disabled populations?

![Texas Medicaid and Texas Diabetes Council Coordination Report · Session, 2017 (Article II, Health and Human Services Commission [HHSC], Rider 25) directs HHSC to identify efficiencies](https://img.dokumen.tips/doc/110x75/604aed604aba6f10fb7424b2/texas-medicaid-and-texas-diabetes-council-coordination-report-session-2017-article.jpg)