Embed Size (px)
Citation preview

ZAINAL RASYID MAHAYUDDIN
NUR AFIQAH KHAIRUDDIN

Aim and objectives of the research
Research methodology
Stage I - Data collection
Stage II – Classification development
Stage III – Prototype development
Stage IV – Testing and Validation

CELLULAR MANUFACTURING - application of group technology in manufacturing
Processing collection of similar parts (part families) on dedicated clusters of machines or manufacturing processes (cells).
Source - Steve Ah kioon, 2009
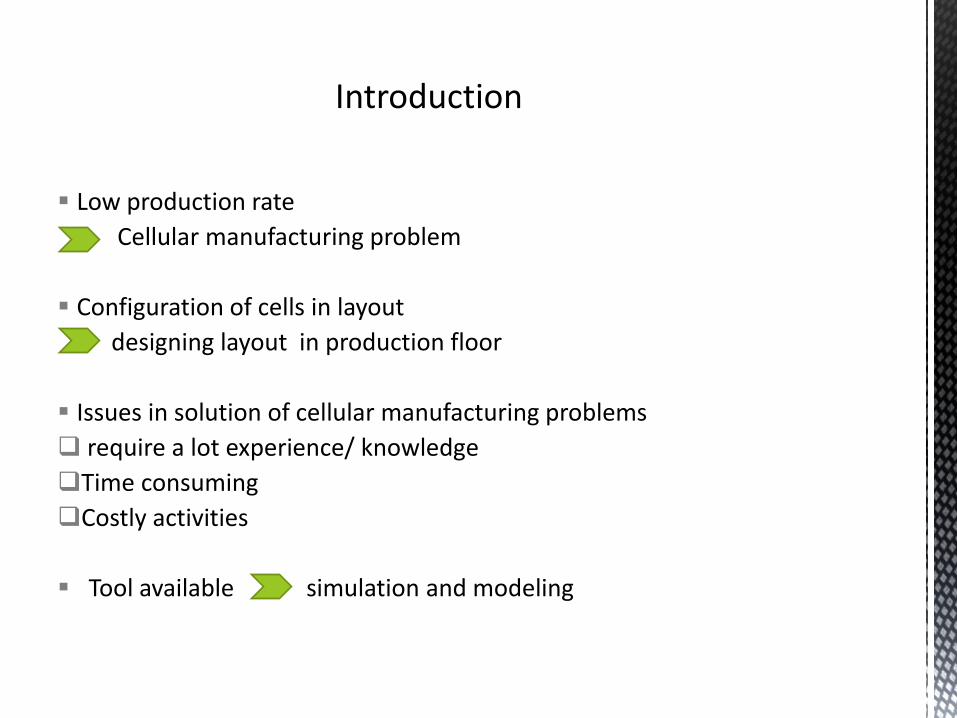
Low production rate
Cellular manufacturing problem
Configuration of cells in layout
designing layout in production floor
Issues in solution of cellular manufacturing problems
require a lot experience/ knowledge
Time consuming
Costly activities
Tool available simulation and modeling

.
Aim : To investigate the cladistic technique approach to classify cellular manufacturing problems
1. To classify problems in cellular manufacturing using cladistics technique
2. Develop a prototype and validate cladistics using prototype
RESEARCH METHODOLOGY
Collecting data samples to thoroughly understand problems and causes of problems obtained.
The information are needed during classification phase
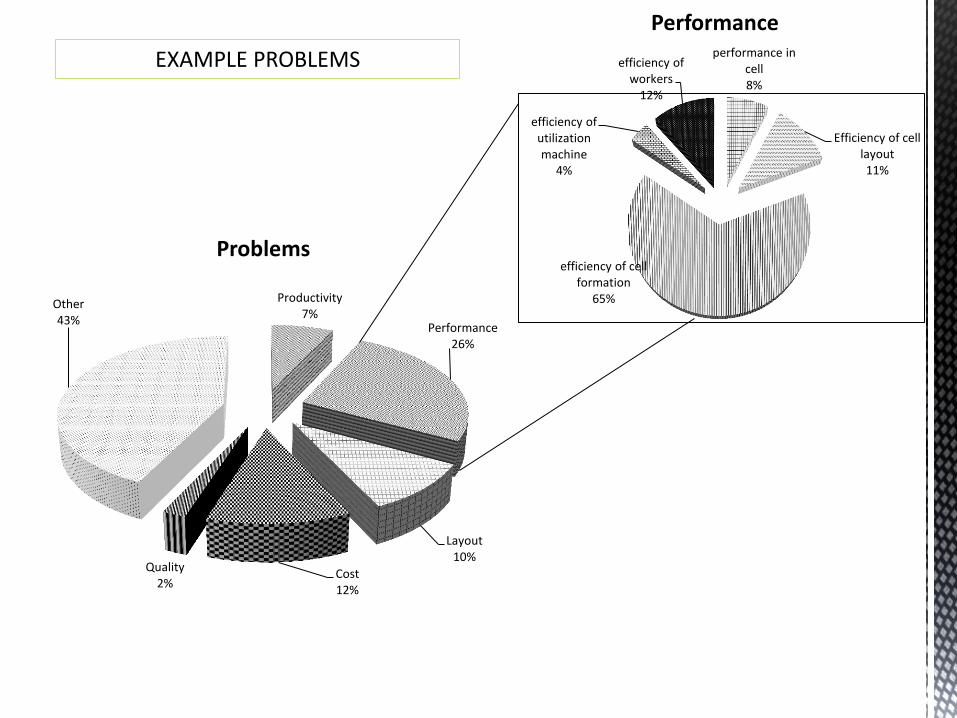
Productivity 7%
Performance 26%
Layout 10%
Cost 12%
Quality 2%
Other 43%
Problems
performance in cell 8%
Efficiency of cell layout 11%
efficiency of cell formation
65%
efficiency of utilization machine
4%
efficiency of workers
12%
Performance
EXAMPLE PROBLEMS
“Cladistics is a method for systematically organizing knowledge about a population of entities. It is a process for studying diversity and attempting to identify and understand laws and relationships that explain the evolution and existence of the variety of groups”
Source:Tsinopoulos and McCarthy (2000)
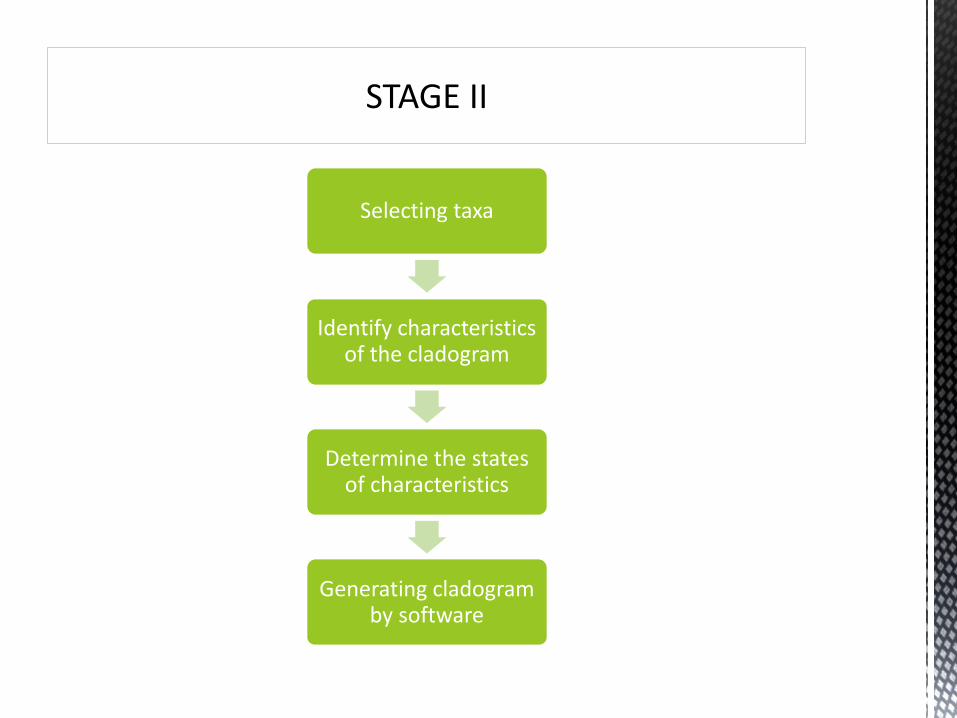
Selecting taxa
Identify characteristics of the cladogram
Determine the states of characteristics
Generating cladogram by software
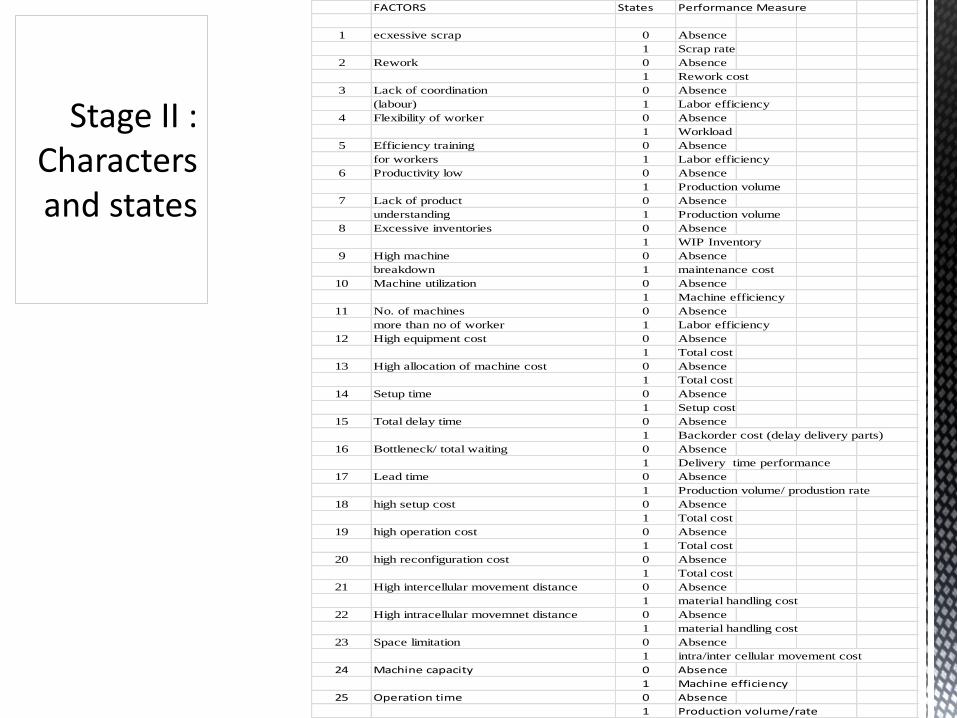
FACTORS States Performance Measure
1 ecxessive scrap 0 Absence
1 Scrap rate
2 Rework 0 Absence
1 Rework cost
3 Lack of coordination 0 Absence
(labour) 1 Labor efficiency
4 Flexibility of worker 0 Absence
1 Workload
5 Efficiency training 0 Absence
for workers 1 Labor efficiency
6 Productivity low 0 Absence
1 Production volume
7 Lack of product 0 Absence
understanding 1 Production volume
8 Excessive inventories 0 Absence
1 WIP Inventory
9 High machine 0 Absence
breakdown 1 maintenance cost
10 Machine utilization 0 Absence
1 Machine efficiency
11 No. of machines 0 Absence
more than no of worker 1 Labor efficiency
12 High equipment cost 0 Absence
1 Total cost
13 High allocation of machine cost 0 Absence
1 Total cost
14 Setup time 0 Absence
1 Setup cost
15 Total delay time 0 Absence
1 Backorder cost (delay delivery parts)
16 Bottleneck/ total waiting 0 Absence
1 Delivery time performance
17 Lead time 0 Absence
1 Production volume/ produstion rate
18 high setup cost 0 Absence
1 Total cost
19 high operation cost 0 Absence
1 Total cost
20 high reconfiguration cost 0 Absence
1 Total cost
21 High intercellular movement distance 0 Absence
1 material handling cost
22 High intracellular movemnet distance 0 Absence
1 material handling cost
23 Space limitation 0 Absence
1 intra/inter cellular movement cost
24 Machine capacity 0 Absence
1 Machine efficiency
25 Operation time 0 Absence
1 Production volume/rate
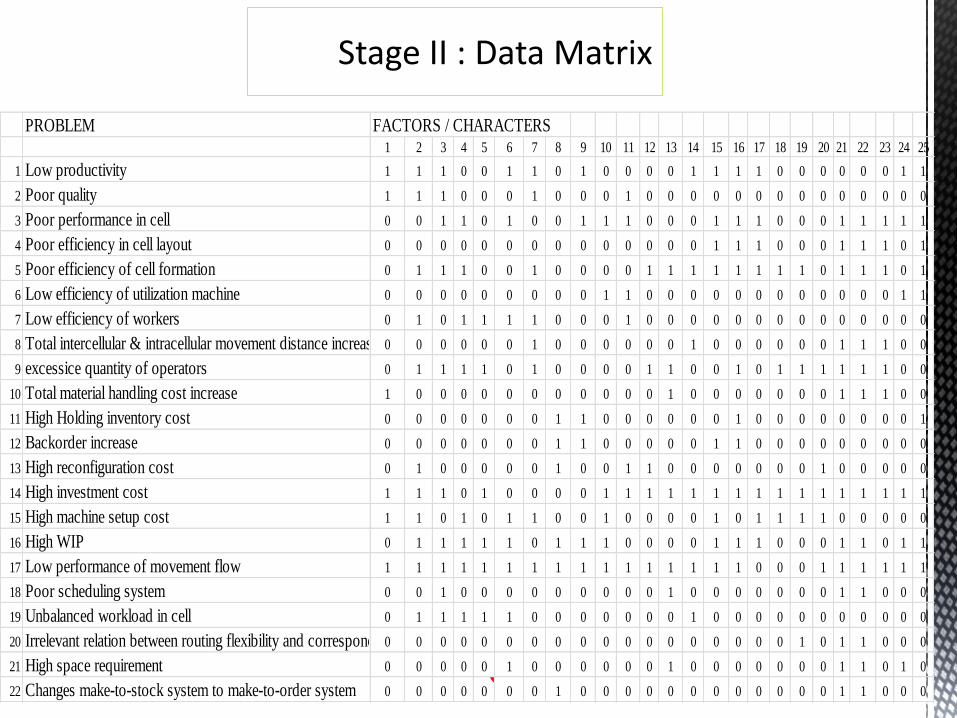
PROBLEM FACTORS / CHARACTERS1 2 3 4 5 6 7 8 9 10 11 12 13 14 15 16 17 18 19 20 21 22 23 24 25
1 Low productivity 1 1 1 0 0 1 1 0 1 0 0 0 0 1 1 1 1 0 0 0 0 0 0 1 1
2 Poor quality 1 1 1 0 0 0 1 0 0 0 1 0 0 0 0 0 0 0 0 0 0 0 0 0 0
3 Poor performance in cell 0 0 1 1 0 1 0 0 1 1 1 0 0 0 1 1 1 0 0 0 1 1 1 1 1
4 Poor efficiency in cell layout 0 0 0 0 0 0 0 0 0 0 0 0 0 0 1 1 1 0 0 0 1 1 1 0 1
5 Poor efficiency of cell formation 0 1 1 1 0 0 1 0 0 0 0 1 1 1 1 1 1 1 1 0 1 1 1 0 1
6 Low efficiency of utilization machine 0 0 0 0 0 0 0 0 0 1 1 0 0 0 0 0 0 0 0 0 0 0 0 1 1
7 Low efficiency of workers 0 1 0 1 1 1 1 0 0 0 1 0 0 0 0 0 0 0 0 0 0 0 0 0 0
8 Total intercellular & intracellular movement distance increase 0 0 0 0 0 0 1 0 0 0 0 0 0 1 0 0 0 0 0 0 1 1 1 0 0
9 excessice quantity of operators 0 1 1 1 1 0 1 0 0 0 0 1 1 0 0 1 0 1 1 1 1 1 1 0 0
10 Total material handling cost increase 1 0 0 0 0 0 0 0 0 0 0 0 1 0 0 0 0 0 0 0 1 1 1 0 0
11 High Holding inventory cost 0 0 0 0 0 0 0 1 1 0 0 0 0 0 0 1 0 0 0 0 0 0 0 0 1
12 Backorder increase 0 0 0 0 0 0 0 1 1 0 0 0 0 0 1 1 0 0 0 0 0 0 0 0 0
13 High reconfiguration cost 0 1 0 0 0 0 0 1 0 0 1 1 0 0 0 0 0 0 0 1 0 0 0 0 0
14 High investment cost 1 1 1 0 1 0 0 0 0 1 1 1 1 1 1 1 1 1 1 1 1 1 1 1 1
15 High machine setup cost 1 1 0 1 0 1 1 0 0 1 0 0 0 0 1 0 1 1 1 1 0 0 0 0 0
16 High WIP 0 1 1 1 1 1 0 1 1 1 0 0 0 0 1 1 1 0 0 0 1 1 0 1 1
17 Low performance of movement flow 1 1 1 1 1 1 1 1 1 1 1 1 1 1 1 1 0 0 0 1 1 1 1 1 1
18 Poor scheduling system 0 0 1 0 0 0 0 0 0 0 0 0 1 0 0 0 0 0 0 0 1 1 0 0 0
19 Unbalanced workload in cell 0 1 1 1 1 1 0 0 0 0 0 0 0 1 0 0 0 0 0 0 0 0 0 0 0
20 Irrelevant relation between routing flexibility and correspondent cost0 0 0 0 0 0 0 0 0 0 0 0 0 0 0 0 0 0 1 0 1 1 0 0 0
21 High space requirement 0 0 0 0 0 1 0 0 0 0 0 0 1 0 0 0 0 0 0 0 1 1 0 1 0
22 Changes make-to-stock system to make-to-order system 0 0 0 0 0 0 0 1 0 0 0 0 0 0 0 0 0 0 0 0 1 1 0 0 0
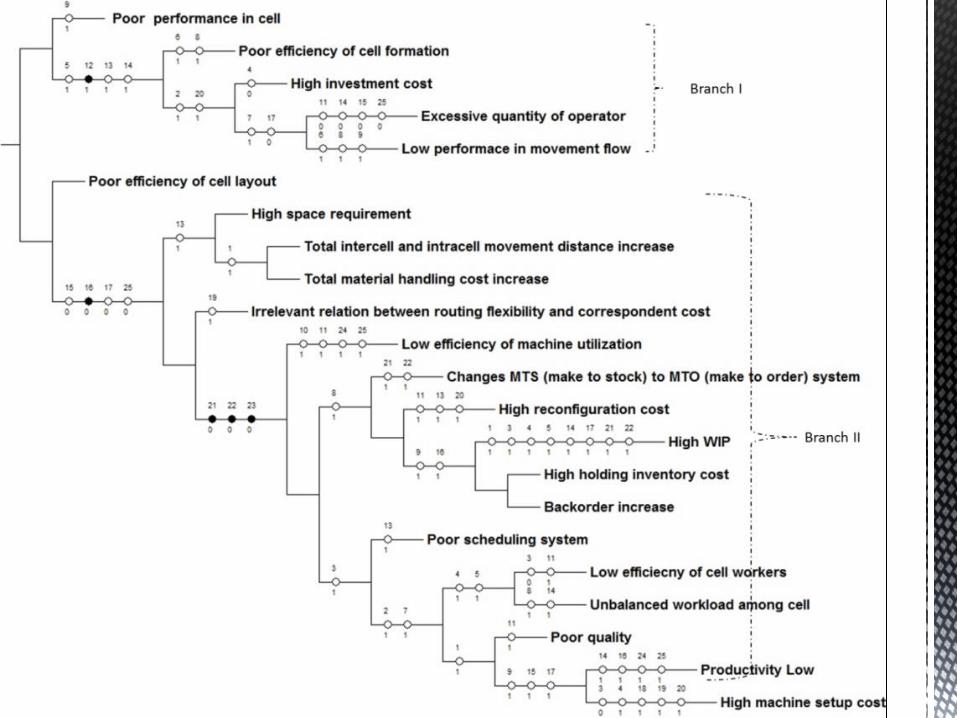
Figure 4. Problems Classification Cladogram
Figure 5. Evolution Trend
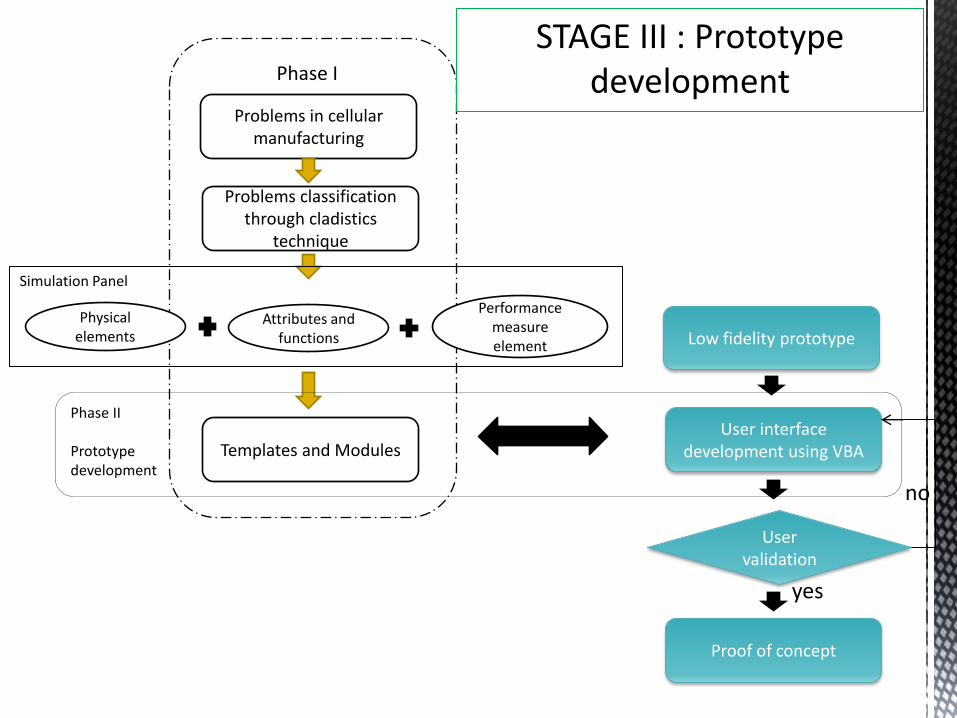
Problems in cellular manufacturing
Problems classification through cladistics
technique
Templates and Modules
Phase I I
Physical elements
Attributes and functions
Performance measure element
Simulation Panel
yes
Low fidelity prototype
User interface development using VBA
Proof of concept
User validation
no
Phase II Prototype development
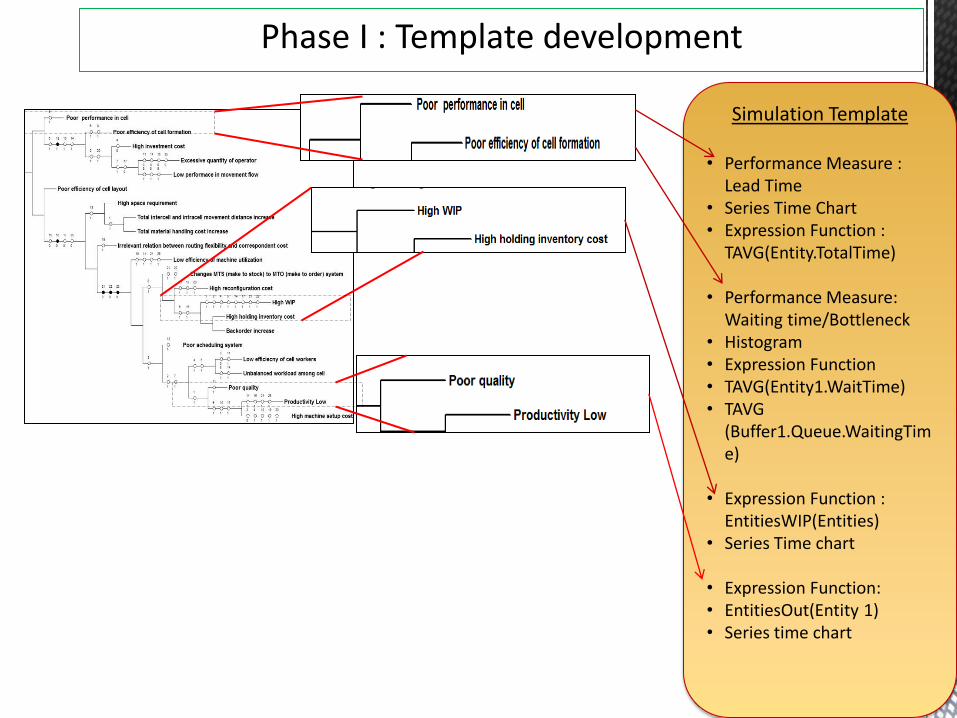
Simulation Template
• Performance Measure : Lead Time
• Series Time Chart • Expression Function :
TAVG(Entity.TotalTime)
• Performance Measure: Waiting time/Bottleneck
• Histogram • Expression Function • TAVG(Entity1.WaitTime) • TAVG
(Buffer1.Queue.WaitingTime)
• Expression Function : EntitiesWIP(Entities)
• Series Time chart
• Expression Function: • EntitiesOut(Entity 1) • Series time chart
Model Building
Performance Measure
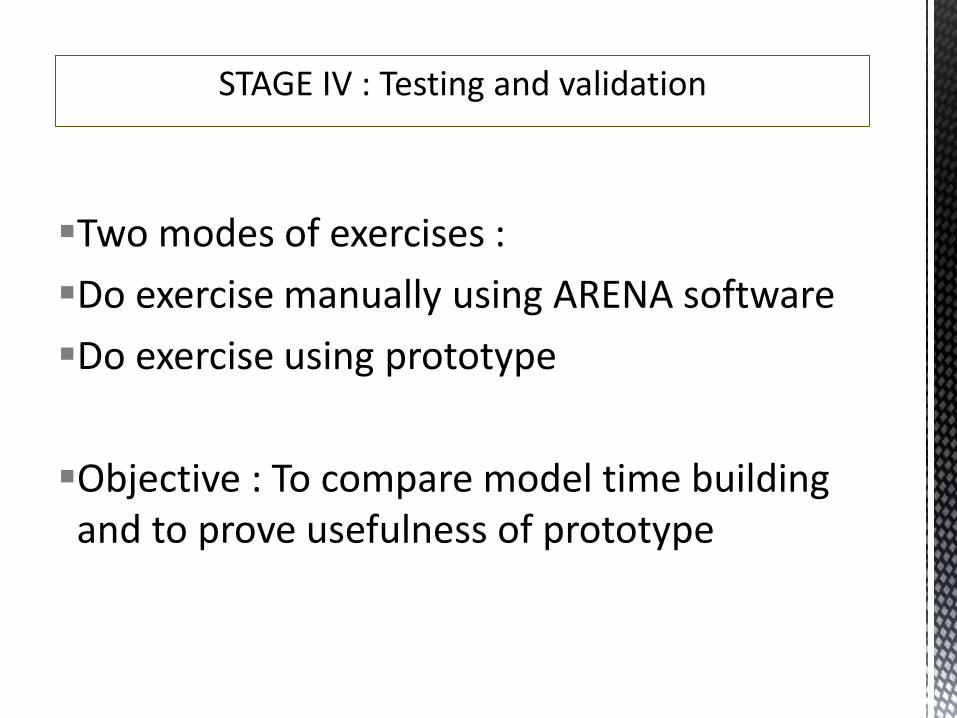
Two modes of exercises :
Do exercise manually using ARENA software
Do exercise using prototype
Objective : To compare model time building and to prove usefulness of prototype
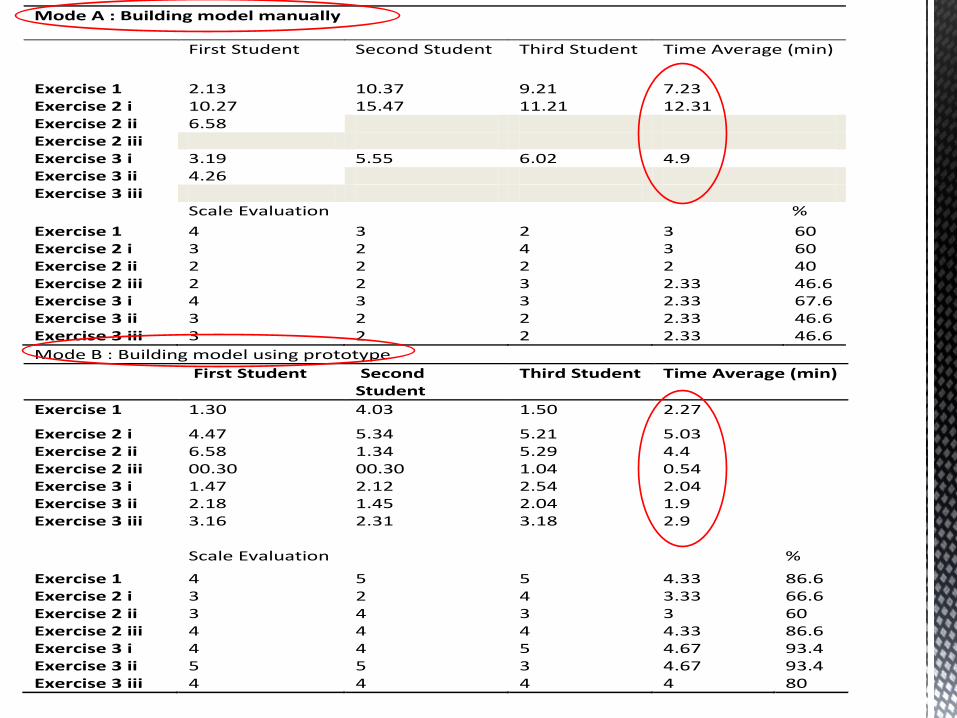
Mode A : Building model manually
First Student Second Student Third Student Time Average (min)
Exercise 1 2.13 10.37 9.21 7.23 Exercise 2 i 10.27 15.47 11.21 12.31 Exercise 2 ii 6.58 Exercise 2 iii Exercise 3 i 3.19 5.55 6.02 4.9 Exercise 3 ii 4.26 Exercise 3 iii Scale Evaluation %
Exercise 1 4 3 2 3 60 Exercise 2 i 3 2 4 3 60 Exercise 2 ii 2 2 2 2 40 Exercise 2 iii 2 2 3 2.33 46.6 Exercise 3 i 4 3 3 2.33 67.6 Exercise 3 ii 3 2 2 2.33 46.6 Exercise 3 iii 3 2 2 2.33 46.6
Mode B : Building model using prototype
First Student Second Student
Third Student Time Average (min)
Exercise 1 1.30 4.03 1.50 2.27
Exercise 2 i 4.47 5.34 5.21 5.03 Exercise 2 ii 6.58 1.34 5.29 4.4 Exercise 2 iii 00.30 00.30 1.04 0.54 Exercise 3 i 1.47 2.12 2.54 2.04 Exercise 3 ii 2.18 1.45 2.04 1.9 Exercise 3 iii
3.16 2.31 3.18 2.9
Scale Evaluation %
Exercise 1 4 5 5 4.33 86.6 Exercise 2 i 3 2 4 3.33 66.6 Exercise 2 ii 3 4 3 3 60 Exercise 2 iii 4 4 4 4.33 86.6 Exercise 3 i 4 4 5 4.67 93.4 Exercise 3 ii 5 5 3 4.67 93.4 Exercise 3 iii 4 4 4 4 80

First student
Second student
Third student
Average Score
1)Duration involve in simulation and modeling Never 0-6 months
6-12 months More than 12 months 2)User Experience in ARENA Lesson in lecture
Group project Thesis project Other than above
3) Ease of use The prototype is easy to use
4 3 2 3
Guideline given is understandable
3 2 3 2.67
Score percentage 56.67% 4)Usefulness of prototype
The prototype is very useful in building the model
5 4 3 4
The prototype can reduce time model building
5 4 3 4
Physical element can be created easily
5 4 4 4.33
Performance measure can be create easily
4 4 4 4
Performance measure element is very useful for modeling simulation building
4 3 3 3.33
The prototype has a potential to increase simulation modeling building
3 3 4 3.33
Average score percentage
76.67%
Cladistic technique is used to classify the problems according to factors identified
Problems can be solved by using simulation tool based on classification made
Reducing time of model development