Embed Size (px)
Citation preview
1Fiscal Year Ended March 31, 2019
Translation
May 14, 2019
Presentation MaterialFiscal Year Ended March 31, 2019

2Fiscal Year Ended March 31, 2019
Translation
May 14, 2019
● FY2018 Results○ FY2019 Plan

3Fiscal Year Ended March 31, 2019
Translation
May 14, 2019
(Billion yen) FY2017FY2018 Change
Feb. Forecast Results YoY Change Change from Feb. Forecast
Net Sales 133.36 142.00 140.95 +5.7% (0.7)%Operating Income 5.81 6.00 5.13 (11.7)% (14.4)%Ratio to net sales 4.4% 4.2% 3.6% (0.8)pt (0.6)pt
Profit attributable to owners of parent (16.05) 1.85 0.91 - (50.4)%Ratio to net sales (12.0)% 1.3% 0.7% +12.7pt (0.6)pt
ROA (11.3)% 1.3% 0.7% +12.1pt (0.6)ptROE (28.6)% 3.8% 1.9% +30.5pt (1.9)ptCapital Investment 7.52 10.00 9.55 +26.9% (4.5)%Depreciation 6.10 7.00 6.49 +6.4% (7.2)%R&D Expenses 4.20 4.15 4.28 +1.9% +3.1%Average Exchange Rate 1US$(Yen) 110.85 110.36 110.91 +0.06 +0.55
With the deterioration in the business environment from December both net sales and operating income fell below the February forecast

4Fiscal Year Ended March 31, 2019
Translation
May 14, 2019
100.2 92.9
113.9 123.3 118.4 116.3
133.3 140.9
(2.5)
(6.9)
4.9 5.1 2.1 3.3
5.8 5.1
(15.0)
(10.0)
(5.0)
0.0
5.0
10.0
15.0
0.0
25.0
50.0
75.0
100.0
125.0
150.0
FY2011 FY2012 FY2013 FY2014 FY2015 FY2016 FY2017 FY2018
Net salesOperating income
(Net sales)(Billion yen)
(Operating income)(Billion yen)
The 8thMedium-termThe 7th Medium-term Management PlanThe 6th Medium-term Management PlanAverage
exchange rate (Yen/US$) 108.38 110.9183.10 100.24 109.93 120.1379.08
Structural reform Implementation of Business Management SystemReview of policies for affiliate companies
110.85
Great East Japan Earthquake Competition laws

5Fiscal Year Ended March 31, 2019
Translation
May 14, 2019
Remained at +5.7% YoY growth affected by major production adjustment mainly in Greater China from the end of 2018 with the impact of escalating US-China trade friction
Automotive Electronics
28%
Industrial
Equipment
24%
New Energy
4%
Home Appliances
10%
ICT27%
Other7%
FY2017133.3
billion yen
Automotive Electronics
30%
Industrial Equipment
23%New
Energy3%
Home Appliances
11%
ICT26%
Other7%
FY2018140.9
billion yen
Automotive
Electronics
Industrial Equipment
New Energy
Home Appliances
ICT
Other
0
20
40
60
80
100
120
140
160
FY2017 FY2018
+13%YoY
+2%
(8)%+10%
+3%
(1)%
Net sales (Billion yen)
Sales ratio for automotive electronics have reached 30% for the first timeDriven by the growth of such markets as 48V mild hybrid system and ADAS

6Fiscal Year Ended March 31, 2019
Translation
May 14, 2019
(¥0.2b) from Other factors(¥1.8b) from
higher manufacturing
fixed costs
(¥0.8b) from higher electricity
cost
(¥2.0b) from higher material prices
(¥4.8b) from negative factors
+4.1b from positive factors
1.75
1.37
1.08 0.92
4.9%
3.8%
3.1%2.7%
0.0%
1.0%
2.0%
3.0%
4.0%
5.0%
6.0%
0.00
0.50
1.00
1.50
2.00
2.50
3.00
1Q 2Q 3Q 4Q
Operating incomeOperating income margin
Operating income (Billion yen)
Operating income margin
Main positives: 1)Effective sales promotion in automotive electronics and home appliance 2) Effect of selling price adjustment 3) Optimization of SCM (improvement in logistics cost)
Main negatives: 1) Higher materials and electricity costs 2) Higher manufacturing fixed costs including labor costs (caused by delay in start-up of facilities due to difficulty in obtaining parts)
(¥0.7b) YoY
Quarterly operating income in FY2018 YoY positives and negatives for
FY2018 operating income+¥0.2b from
lower SG&A costs
+¥1.5b from higher capacity
utilization
+¥1.1b from price factors
+¥1.3b from higher gross profit

7Fiscal Year Ended March 31, 2019
Translation
May 14, 2019
○ FY2018 Results● FY2019 Plan
8Fiscal Year Ended March 31, 2019
Translation
May 14, 2019
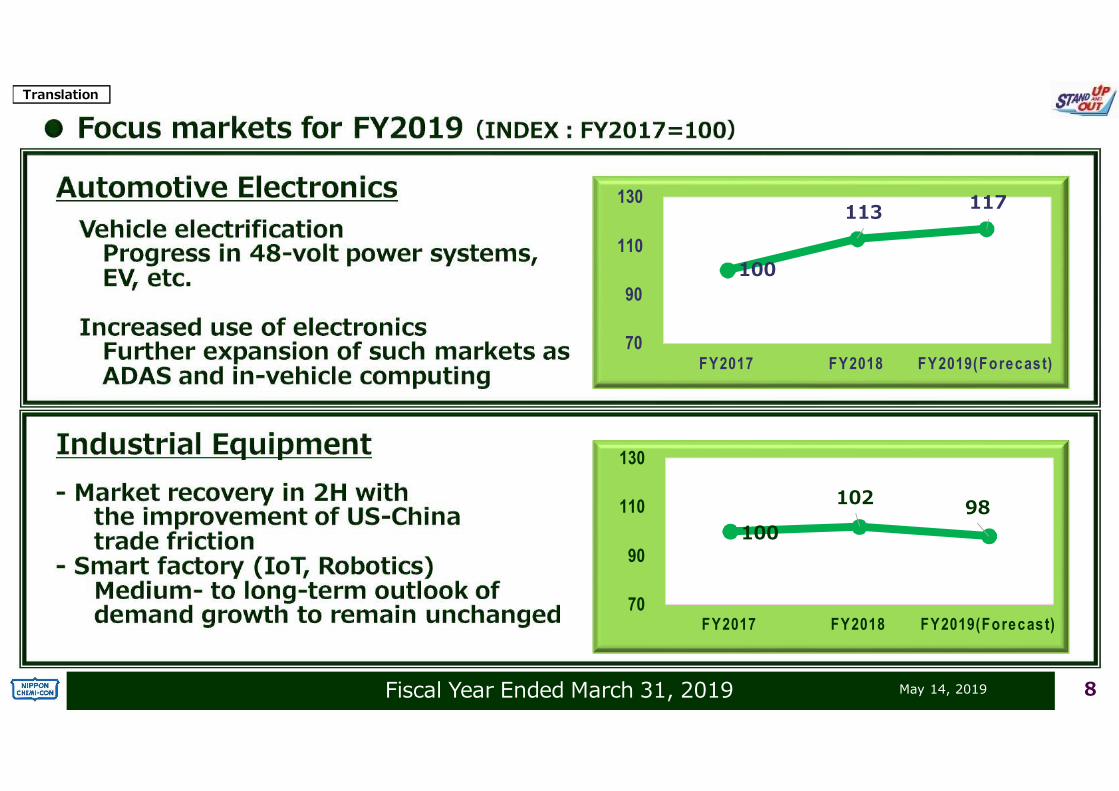
100
113 117
70
90
110
130
FY2017 FY2018 FY2019(Forecast)
100
102 98
70
90
110
130
FY2017 FY2018 FY2019(Forecast)
9Fiscal Year Ended March 31, 2019
Translation
May 14, 2019
INDEX:2016-1H = 100INDEX:FY17-1H = 100
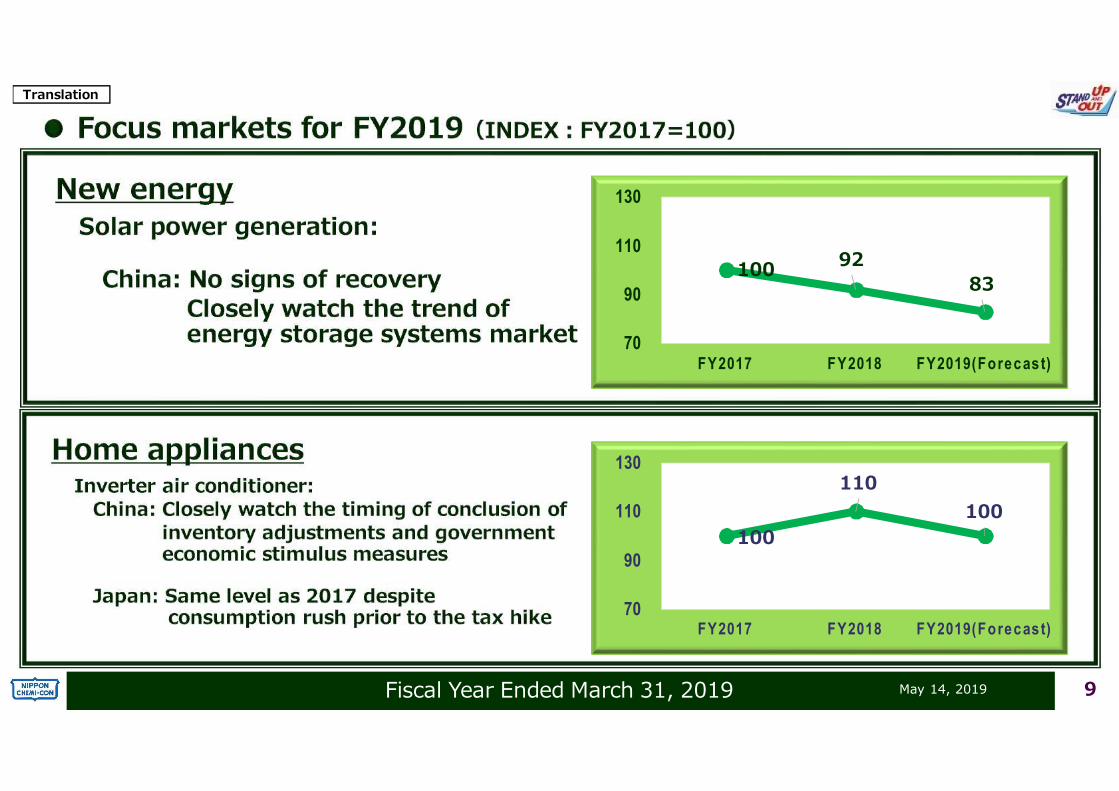
100 92 83
70
90
110
130
FY2017 FY2018 FY2019(Forecast)
100
110 100
70
90
110
130
FY2017 FY2018 FY2019(Forecast)

10Fiscal Year Ended March 31, 2019
Translation
May 14, 2019
INDEX:2016-1H = 100INDEX:FY17-1H = 100
100
103 105
70
90
110
130
FY2017 FY2018 FY2019(Forecast)
100
106 103
70
90
110
130
FY2017 FY2018 FY2019(Forecast)

11Fiscal Year Ended March 31, 2019
Translation
May 14, 2019
Restoring the public confidence and improving corporate value toward the 90th anniversary(promoting aggressive management from shareholders' perspective)
"Creating a platform for growing into a company with annual sales of 200 billion yen in the 9th Medium-term management plan"
Provide customers with the best solution
Automotive Electronics
Industrial Equipment New Energy Home
Appliances ICT

12Fiscal Year Ended March 31, 2019
Translation
May 14, 2019
FY2019 goals
Strengthen growth potential (improve sales ratio for automotive electronics)● FY2017 28% → FY2018 30% → FY2019 goal:31%
Enhance new product development for automotive electronics and conduct capital investment to increase production capacity of conductive polymer capacitors and hybrid capacitors
Use speedy management to improve performance(permeate business management system)● Improve gross profit margin through cooperation between production and sales
(Expand sales of highly profitable products, improve unprofitable products, and obtain more product qualifications at overseas factories)
FY2017 20.7% → FY2018 18.9% → FY2019 goal:19.4%● Launch new products able to provide solutions to meet the needs of strategic markets
(Improve new product ratio by 20% YoY)● Increase competitiveness through accelerating reorganization of overseas factories,
improving productivity, and expanding production capacity

13Fiscal Year Ended March 31, 2019
Translation
May 14, 2019
(Billion yen)FY2018 FY2019(Forecast)
1H 2H Full Year 1H 2H Full Year YoY
Net Sales 72.17 68.77 140.95 64.00 74.00 138.00 (2.1)%
Operating Income 3.13 2.00 5.13 1.50 3.80 5.30 +3.2%Ratio to net sales 4.3% 2.9% 3.6% 2.3% 5.1% 3.8% +0.2pt
Profit attributable to owners of parent (0.10) 1.02 0.91 0.90 2.60 3.50 +281.4%
Ratio to net sales (0.1)% 1.5% 0.7% 1.4% 3.5% 2.5% +1.8ptROA - - 0.7% - - 2.5% +1.8ptROE - - 1.9% - - 7.1% +5.2ptCapital Investment 5.50 4.05 9.55 4.40 3.60 8.00 (16.3)%Depreciation 3.06 3.43 6.49 3.50 3.90 7.40 +13.9%R&D Expenses 2.13 2.15 4.28 2.10 2.20 4.30 +0.3%Average Exchange Rate1US$(Yen) 110.26 111.55 110.91 110.00 110.00 110.00 (0.91)1euro(Yen) 129.85 125.14 128.41 125.00 125.00 125.00 (3.41)
YoY increase projected in operating income by improving the gross profit rate despite negative growth projected in net sales with the impact of U.S-China trade friction

14Fiscal Year Ended March 31, 2019
Translation
May 14, 2019

15Fiscal Year Ended March 31, 2019
Translation
May 14, 2019
Automotive Electronics
30%
Industrial Equipment
23%
New Energy
3%
Home Appliances
11%
ICT26%
Other7%
Automotive Electronics
31%
Industrial Equipment
23%
New Energy
3%
Home Appliances
10%
ICT27%
Other6%

16Fiscal Year Ended March 31, 2019
Translation
May 14, 2019
12% 14% 13% 13% 13% 14%
44% 45% 42% 44% 43% 41%
10% 10% 11% 11% 12% 13%10% 10% 10% 10% 10% 11%
24% 21% 24% 22% 22% 21%
0%
10%
20%
30%
40%
50%
60%
70%
80%
90%
100%
FY2014 FY2015 FY2016 FY2017 FY2018 FY2019(Forecast)
Japan
Americas
Europe
Greater China
Other

17Fiscal Year Ended March 31, 2019
Translation
May 14, 2019
〔Note〕The projected performance figures in this material are based on information available to Nippon Chemi-Con’s management at the time this material was prepared. There are many uncertain factors inherent in forecasting, and there might be cases in which actual results differ from forecast values. Nippon Chemi-Con undertakes no obligation to publicly update or revise any forward-looking statements included in this material.
If you are interested in investing in Nippon Chemi-Con, you are requested to make a final investment decision at your own risk. Please note that neither Nippon Chemi-Con nor any third party providing information shall be responsible for any damage or loss you may suffer due to investment in Nippon Chemi-Con based on the information shown in this material.


![Consolidated Financial Results for the Fiscal Year Ended ...Note: Comprehensive income Fiscal year ended March 31, 2019: ¥1,761 million [24.3%] Fiscal year ended March 31, 2018: ¥1,417](https://img.dokumen.tips/doc/110x75/5fe4d06806b4775830253106/consolidated-financial-results-for-the-fiscal-year-ended-note-comprehensive.jpg)


![[Japanese GAAP] : Freund Corporation · Fiscal year ended Feb. 29, 2020: 16,744,520 shares Fiscal year ended Feb. 28, 2019: 16,821,233 shares Reference: Summary of Non-consolidated](https://img.dokumen.tips/doc/110x75/5ece2710cebd7c0f84041010/japanese-gaap-freund-fiscal-year-ended-feb-29-2020-16744520-shares-fiscal.jpg)


