Embed Size (px)
Citation preview

Fertilization and fertilizers use
in the Netherlands
Presentation for Stanley Company
ir. J.J. (Janjo) de Haan & ir. W. (Wim) van Dijk

Program
1. Introduction Wageningen UR
2. Introduction Dutch agriculture
3. Fertilization advisory systems in the Netherlands
● Recommendations fertilizer rates
● Guided fertilization systems & application techniques
Break
4. Organic fertilizer use
5. Legislation and market requirements
6. Overview of trends and developments
7. Difference China and the Netherlands (discussion)
2
1. Wageningen UR
Mission
‘to explore the potential of nature to improve the quality of life’

living environment
The Wageningen UR domain:
healthy food and living environment
food and food production
health, lifestyle and livelihood
Sustainable agriculture
Nutrition and health
Sustainable fishery
Biomass
Chains
Marine resource
management
Landscape and land use
Nature & Biodiversity
Water management
Competing claims
Behaviour and perception
Food security
Institutions
Consumer
Citizen

Wageningen UR
Research
Top 3 in our domains
Top 100 worldwide in university ranking
Exploitation and valorisation of research
Education
> 11,000 students
> 6,000 faculty and staff
Turnover € 710 million

Two partners
Wageningen University
9 applied research institutes

Our strengths
Combination of university and market-oriented research institutes
Cooperation between scientific and social science disciplines
Connecting knowledge at various scale levels
Strong international position
Strong cooperation in the ‘Golden Triangle’
Wageningen Campus
Government
Science
Business

2. Dutch agriculture
8

Soil types
in the
Netherlands
9

Key figures Dutch agriculture
Agro complex is 10% of Gross National Product
2nd largest exporter of agricultural products in the world
10
Share per sector
Area
(x1000 ha)
Economic value
(x109 €)
Labour years
(x1000)
Number of
farms (x1000)
Live stock farms 1 225 69 41.5
Arable farms 517 2.4 16 12.1
Field horticultural farms 87 28 6.8
Greenhouse farms 10 41 3.8
Mixed farms 7 3.3
Total 1 839 26.5 (52) 161 67.5

Dairy farming 1,225
Grassland 993
Maize 226
Arable farming 517
Cereals 193
Potatoes 156
Sugar beets 75
Horticulture 87
Field production of vegetables 25
Flower bulbs 24
Tree nursery and perennials 17
Gardening (fruits) 19
Plant production (acreage x 1000 ha)
Farm size 30-100 ha
High yield levels
High inputs
● Nutrients
● Pesticides
Highly mechanized
Large use of animal manure
Environmental problems
11

Total phosphate production in manure
The Netherlands, 2011
12
Total: 170 Mkg P2O5
Average 90 kg/ha

3. Fertiliser recommendations
Organisation
Recommendations
● Nitrogen
● Phosphorus and potassium
● Other nutrients
● Magnesium and sulphur
● Micronutrients
13

Fertilization Committees NL
Main task: assessing fertilizer recommendations
● Most recommendations developed in 1970-80
Representatives
● Farmers organization (chair)
● Research institutes
● Laboratories
● Extension service
Sectors
● Forage crops
● Arable and horticultural crops

Fixed and guided fertiliser
recommendations
Fixed
● Crop demand assesses in advance
● Based on measurement of soil nutrient status at the start of the growing season
● Applied at once or in split applications
Guided (nitrogen)
● Basis fertilisation
● Supplementary dressings based on measurement of nutrient status during the growing season
15

Fixed nitrogen recommendations
Economic optimal N rate (Nopt) derived from several dose-response trials
Taking into account soil mineral nitrogen (SMN) in spring
Depending on: crop (type) and variety soil type
Regarding: yield and quality of the product market price fertilizer price

Deriving nitrogen recommendations
Dose-response trials
● Series of trials
● Nopt1…n
● Recommendation: average of Nopt1…n
17

Deriving of the recommendation
Optimal nitrogen rate from several dose-response trials plotted against soil mineral nitrogen content
Fitting a linear relationship recommendation
For example potato on clay soil (figure): 285 – 1.1 SMN

Examples of fixed nitrogen recommendations
Cultivation Nitrogen rate (kg/ha)
Ware potatoes, clay / loess soil 285 – 1.1 SMN (0-60 cm)
Ware potatoes, sandy soil 300 – 1.8 SMN (0-30 cm)
Starch potatoes, sandy soil 275 – 1.8 SMN (0-30 cm)
Winter wheat, feed, clay soil 140 – SMN (0-100 cm) + 90 + 40
Winter wheat, bread, clay soil 140 – SMN (0-100 cm) + 80 + 80
Winter wheat, feed, sand soil 140 – SMN (0-100 cm) + 90
Sugar beets 200 – 1.7 * SMN (0-60)
Maize (all soil types) 205 – SMN (0-30 cm)

Corrections to recommended N rate
Correction (kg N/ha)
Incorported crop residues
Green manure - 20 to 60
Grassland - 100
Differences in soil mineralization -50 to +30
Poor soil structure +30 to 50
Yield level (wheat) 20 kg N/ton grain
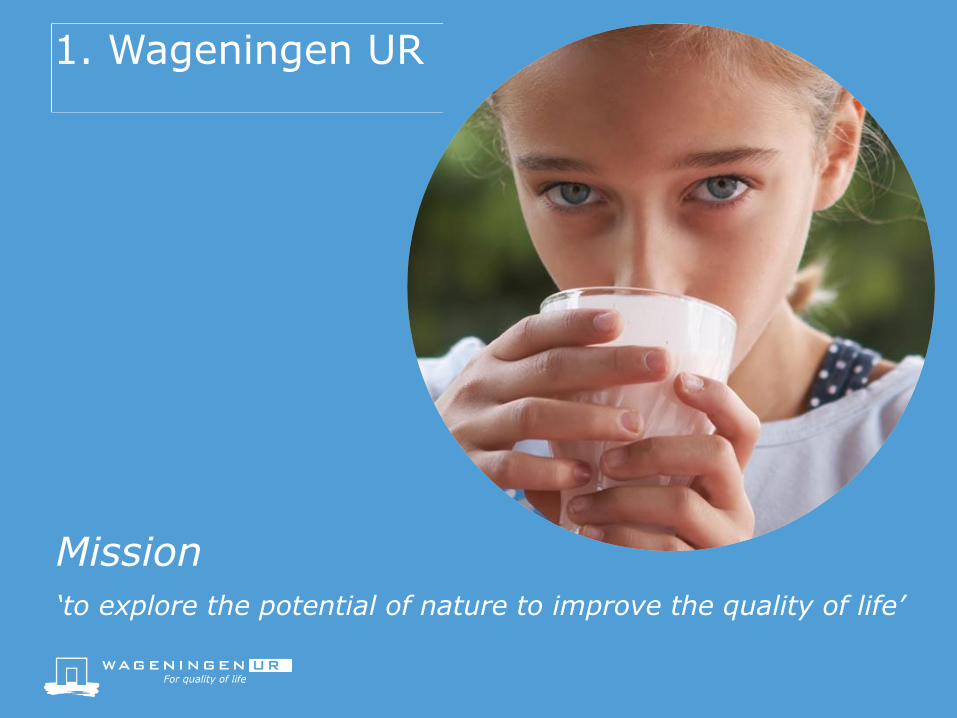
Adjustment of the N rate during the season
Splitting the N rate
1. fixed basis rate
2. adjust top-dressing(s) to growth conditions
crop conditions soil conditions
weather conditions

Guided nitrogen fertilization systems
Before planting 65% of the fixed rate (50%-80%)
Additional top dressings based on growth conditions
Indicators:
● soil mineral N
● nitrate concentration in the petioles
● fresh biomass of the foliar
● radiation reflection characteristic of the crop ~ N uptake, biomass

When is control and adjustment useful?
Uncertainty about the N mineralization
Risk of leaching
If a high N mineralization is expected
After application of manure
At heterogeneous fields

Indicator: soil mineral N (SMN)
N balance method
Global N uptake pattern potato
SMN determination during growth periode (sampling)
Additional N rate = forthcoming N uptake + margin – SMN – expected mineralization
Potato and vegetable crops
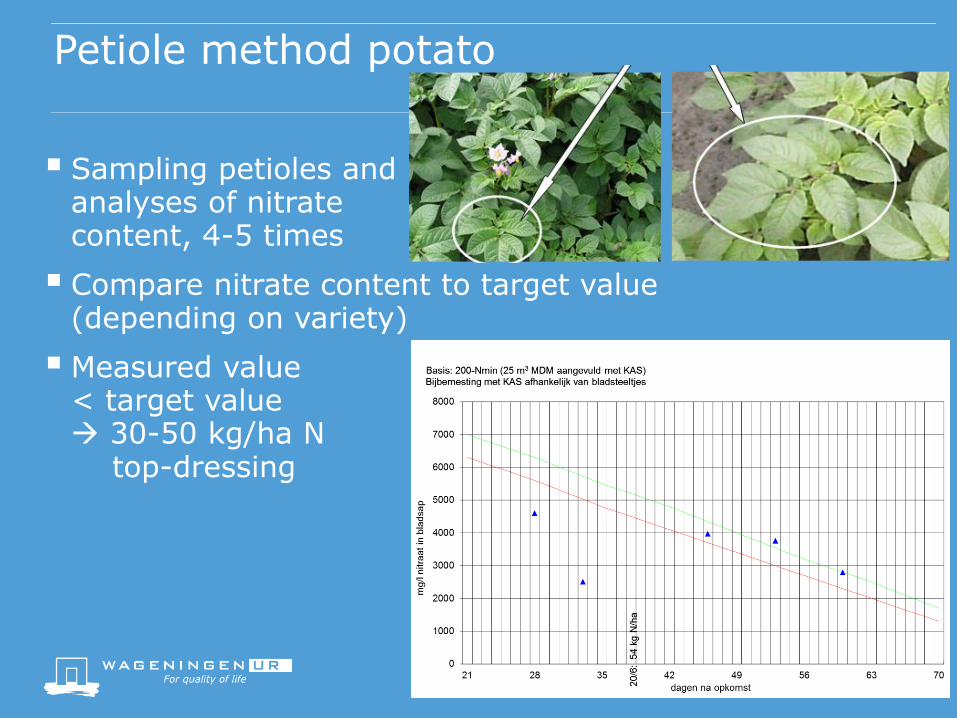
Petiole method potato
Sampling petioles and analyses of nitrate content, 4-5 times
Compare nitrate content to target value (depending on variety)
Measured value < target value 30-50 kg/ha N top-dressing

Potato monitoring
Nitrate content petioles + foliar weight of 5 plants, 4 times during the growing season
Comparisson to target values (depending on variety)
Calculation additional N top-dressing
Top-dressing: 70 kg/ha N, 3-4 weeks after emergence
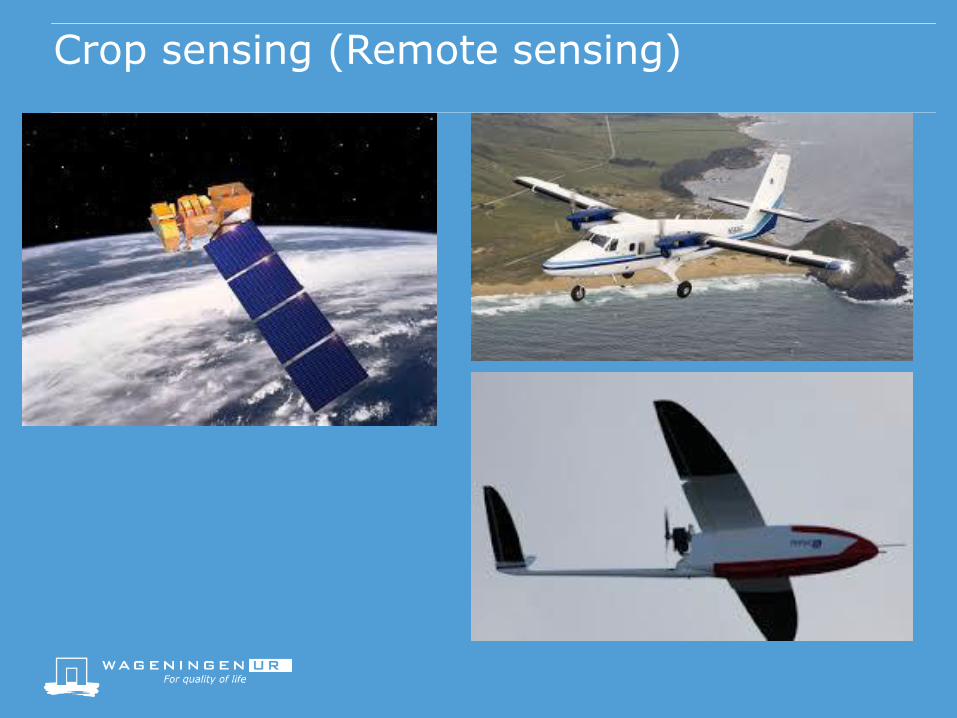
Crop sensing (Remote sensing)

Crop sensing (Near Sensing)

Sensing of the crop
Determination of differences:
- biomass
- N uptake
Between fields or within a field

What do crop sensors observe ?
Crop sensor:
reflection calculation interpretation
of radiation vegetation index
Sensor data indicate relative differences
Additional sampling to determine absolute level
?

From sensing to N recommendation
Derive N uptake of the crop from it’s radiation reflection
Compare to target value
Calculate additional N rate

Variability within a field
How to deal with it?

Guided N rate systems based on crop
sensing of potato
Procedure:
1. Measuring radiation reflection of the canopy
2. Calculation vegetation index
3. Derivation N uptake by the crop
4. Comparison to target value
5. Calculation of additional N top-dressing (different ways)

Example crop sensing + N-balance potato
Before planting: 150 kg N per ha
N top-dressings:
- 1st measurement: 125 kg N per ha
- 2nd and 3th measurement: awaiting
next one
- 4th measurement: 15 kg N per ha 0
Before planting: 150 kg N per ha
N top-dressings:
- 1st and 2nd measurement: 0
- 3th measurement: 41 kg N per ha
- 4th measurement: 0

State-of-the-art crop-sensing-based N
fertilization
Crop-sensing-bases N fertilization looks promising
Advantages: quick advice saving of labour (no/less sampling) location specific top dressing within the field
Improvement / refining is necessary and possible
May also be applicable in seed potatoes development of specific target values
Sensors are expensive and need control and maintenance
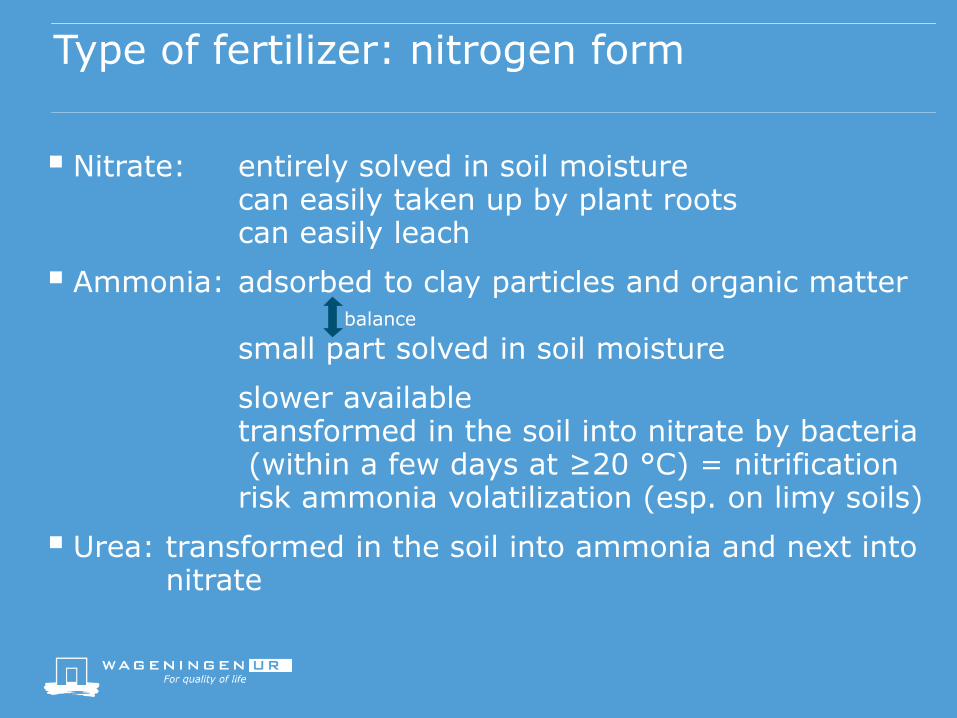
Type of fertilizer: nitrogen form
Nitrate: entirely solved in soil moisture can easily taken up by plant roots can easily leach
Ammonia: adsorbed to clay particles and organic matter balance
small part solved in soil moisture
slower available transformed in the soil into nitrate by bacteria (within a few days at ≥20 °C) = nitrification risk ammonia volatilization (esp. on limy soils)
Urea: transformed in the soil into ammonia and next into nitrate

Common N fertilizers
Ammonium sulphate
Calcium ammonium nitrate (CAN)
Urea
● 80-90% replacement value of CAN on limy (clay) soils, 90-95% on sandy soils with pH <7
Urea ammonium nitrate (UAN)
● almost similar to CAN on sandy soils with pH <7, 90-95% on limy soils
NP and NPK fertilizers (MAP, DAP, KNO3, blends)
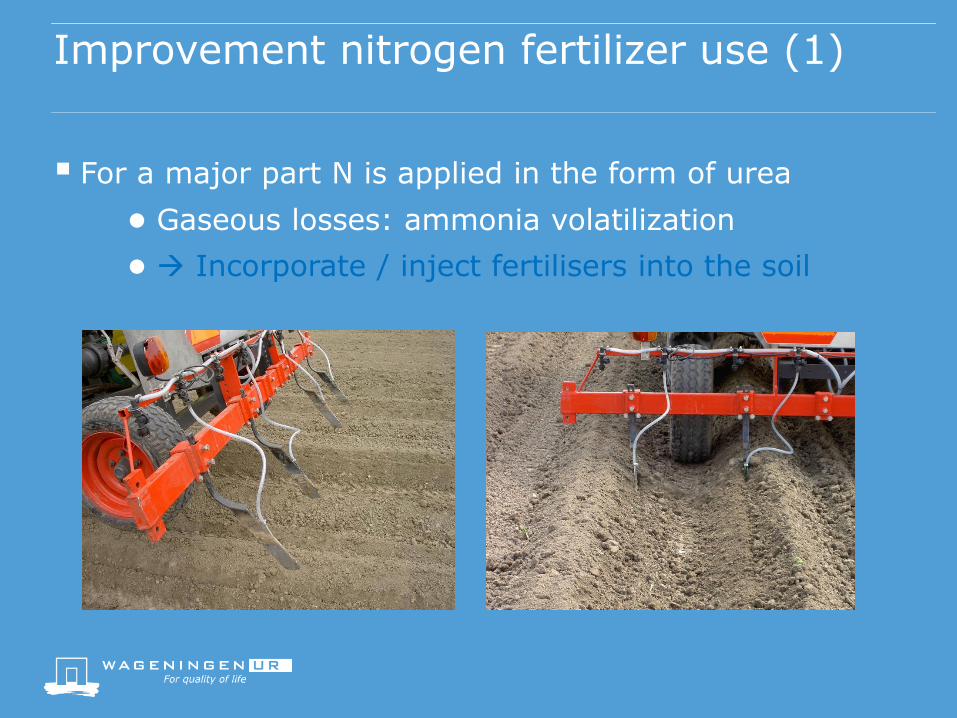
Improvement nitrogen fertilizer use (1)
For a major part N is applied in the form of urea
● Gaseous losses: ammonia volatilization
● Incorporate / inject fertilisers into the soil

Pulstec

Improvement nitrogen fertilizer use (2)
Risks for surface runoff / leaching
● Especially in wet periods
● Very heavy soils low water infiltration capacity
● Incorporate fertilizers into the soil
● Coarsely textured soils with limiting rooting depth low water holding capacity, susceptible to leaching
● Use of fertilizers that prevent leaching
● Ammonium fertilizers with nitrification inhibitor
● Slow-release fertilizers (coating or molecular compounds)

Foliar application of nitrogen
Top dressing(s) during the growing season
Liquid urea or UAN
Can be combined with spraying of fungicides (late blight)
Risk of leaf damage (UAN) ≤20 kg/ha N per time
Faster N uptake than soil fertilization advantage under dry conditions In other cases similar tot CAN

Effects of special fertilizers
Conclusions from field trials
Sometimes better than CAN
Limited contribution to improve nitrogen use efficiency
Guided nitrogen fertilization provides better opportunities to improve nitrogen use efficiency
42

Fertigation
Fertilization by the (drip) irrigation system

Benefits of drip irrigation / fertigation
Regular supply of water and nutrients
Makes accurate fertilization possible
Improves N utilization
Increases yield and quality
Saving of water and nitrogen
Use of saline water (to certain extent)
Highest profit in arid regions (on desert soils)
Disadvantage: high costs

Soil sampling soil fertility
Once in the rotation cycle (4-5 year)
Top layer (0-20/25 cm)
Parameters
● Organic matter
● pH
● Phosphorus
● Potassium
● Magnesium, sulphur
● Micronutrients

Phosphorus recommendations
Depending on:
● Plant available phosphorus content in the soil (analyses)
● Crop demand
● Soil type
Target levels available content in the soil
In general a broadcast application
Major sources: manure, triple super phosphate
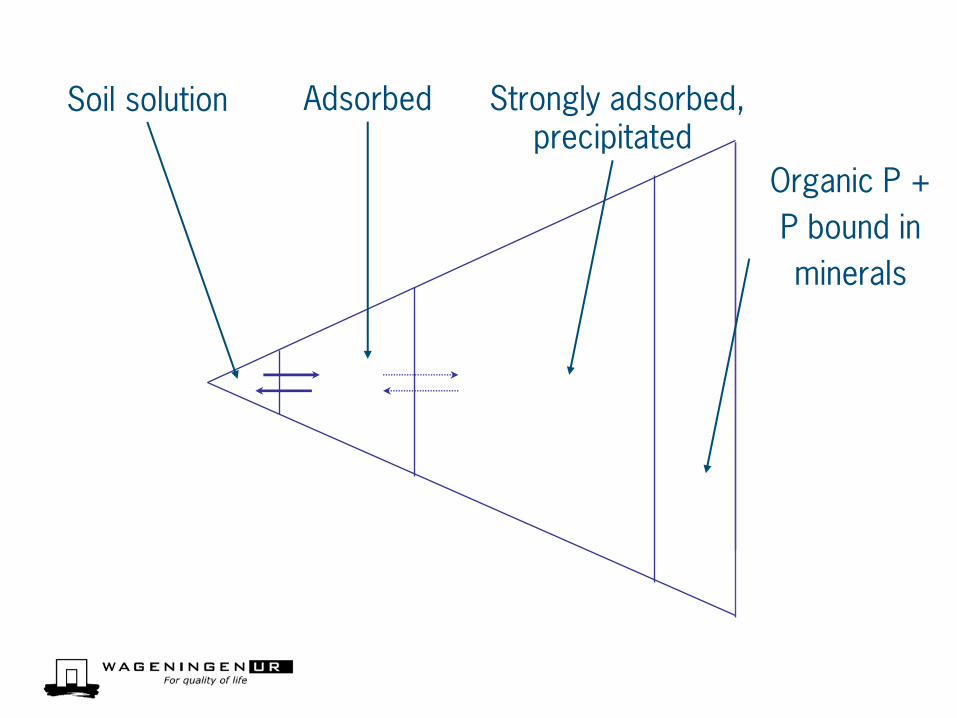
Soil solution Adsorbed Strongly adsorbed, precipitated
Organic P +
P bound in
minerals

Soil solution Adsorbed
Pw
P-Al
P-CaCl2
Organic P +
P bound in
minerals
Strongly adsorbed, precipitated
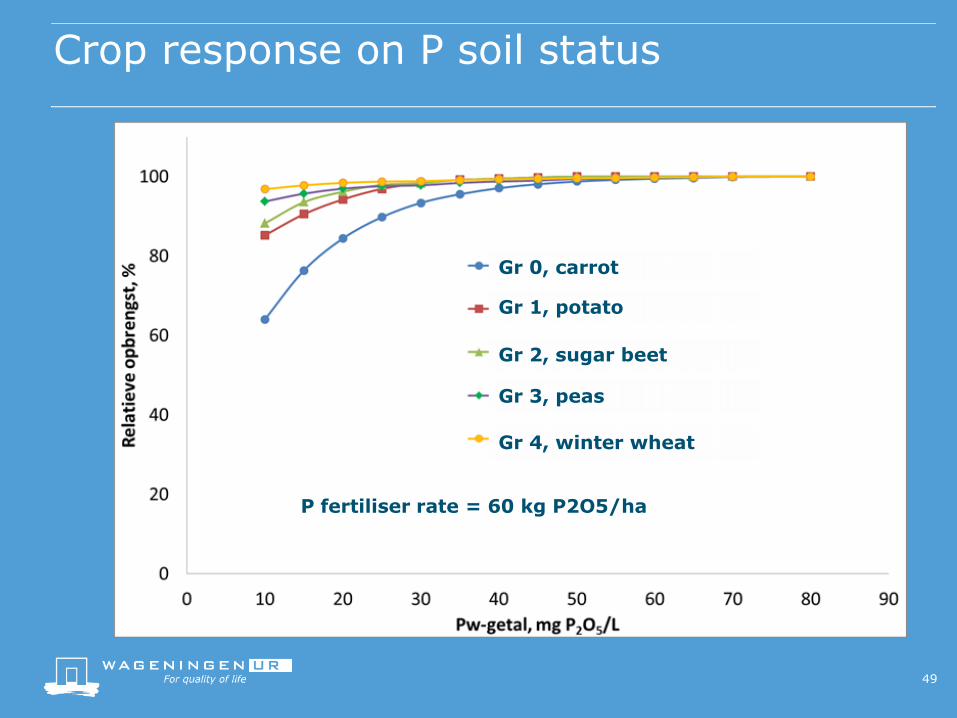
Crop response on P soil status
49
Gr 0, carrot
Gr 1, potato
Gr 2, sugar beet
Gr 3, peas
Gr 4, winter wheat
PP fertiliser rate = 60 kg P2O5/ha

P fertiliser demand in relation to soil P
status
50
Dekzand, dalgrond, rivierklei, loss
0
50
100
150
200
250
0 10 20 30 40 50 60 70
Pw
kg
P2O
5/h
a
0
1
2
3
4
Laag (rep) Laag Neutraal Hoog
Sand, loess

Self correcting advisory system
51
Balance
fertilisation
Accumulation
Starvation
Crop offtake
P advice
Soil P status
Low average high
PP amount

Attention phosphorus
Phosphorus is not mobile in the soil
Roots must grow to the phosphorus stock
Limited root development, especially during juvenile growth
High P demand at the start of the growing season
Apply P fertilizers at start of growing season, preferably close to the plants and incorporate in the soil
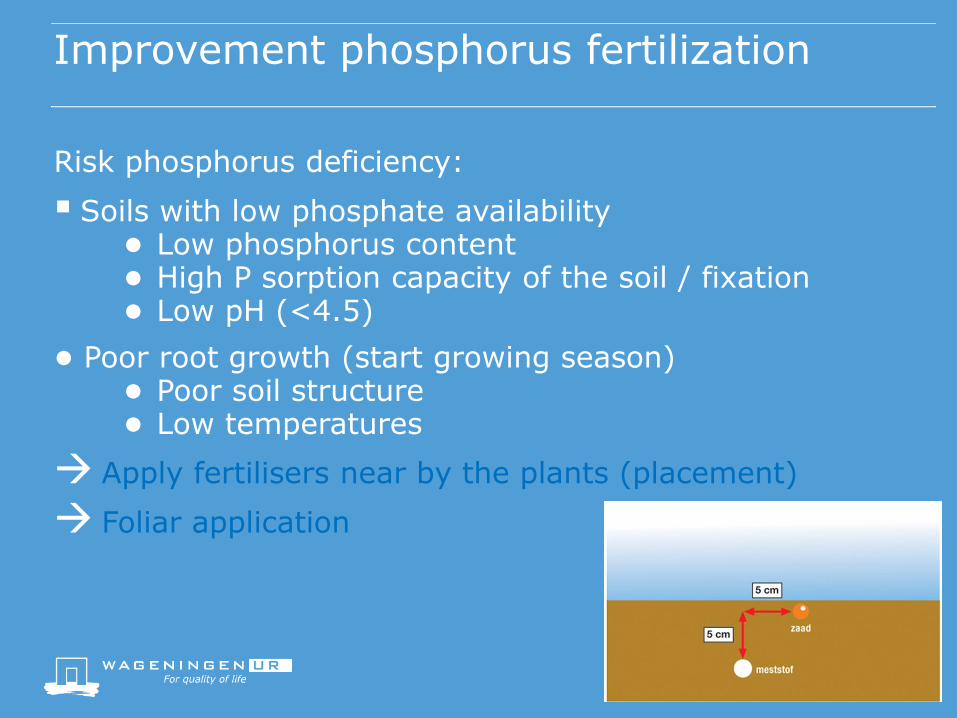
Improvement phosphorus fertilization
Risk phosphorus deficiency:
Soils with low phosphate availability ● Low phosphorus content ● High P sorption capacity of the soil / fixation ● Low pH (<4.5)
● Poor root growth (start growing season) ● Poor soil structure ● Low temperatures
Apply fertilisers near by the plants (placement)
Foliar application

Effect of phosphorus placement in maize

Potassium recommendations
Depending on:
● for plant uptake available soil content (analyses)
● crop demand
● soil type (sandy soil, clay soil, loess soil)
● other soil properties: clay content, organic matter content, pH
Target levels available content in the soil
Broadcast application
Major sources: manure, potassium chloride (KCl)

Recommendation table potassium (kg K2O per ha) for marine and river clay soils with <10% organic matter

Magnesium
Recommendation based on soil Mg content
Risk for deficiency
● Low soil content
● Low pH
● Soils with little organic matter
● Apply Mg-fertilizers to the soil before planting Foliar application during the growing season
Potatoes are in general sensitive for Mg deficiency
Also differences between potato varieties

Sulphur
Recommendation based on a balance
● Crop offtake, deposition, mineral sulphur in the soil, mineralisation in the soil, leaching, sulphur in irrigation water
Supply:
● Soil: mineral sulphur mineralisation of sulphur sulphur in groundwater
● Fertilizers: accompanying anion in several fertilizers blends, for example ammonia sulphate nitrate or CAN + S
Micro elements
Recommendations for manganese, boron, molybdeen and copper
● Based on soil analysis
● Don’t apply too much
Right pH for the soil conditions
Apply of fertilizers with micro elements:
● Animal manure
● Compost
● Fertilizer with micro elements (mostly combined fertilizers)
● Specific fertilisers (foliar application)

pH recommendation
Important for availability nutrients and soil structure
Soil sampling
Target levels depending
● Soil type
● Organic matter and clay content
● Rotation

pH recommendation sandy soils
Crop rotation Organic matter content
%-potato %-sugar beet <5.0 5-8 8-15 >15
50 0 5.1-5.5 4.9-5.3 4.7-5.1 4.6-5.0
20-40 0 5.3-5.7 5.1-5.5 5.0-5.4 4.8-5.2
33-50 16-25 5.6-5.9 5.4-5.8 5.3-5.7 5.1-5.5
4. Organic fertilizer use
Unprocessed manure
Digested manure
Processed manure (separation)
62
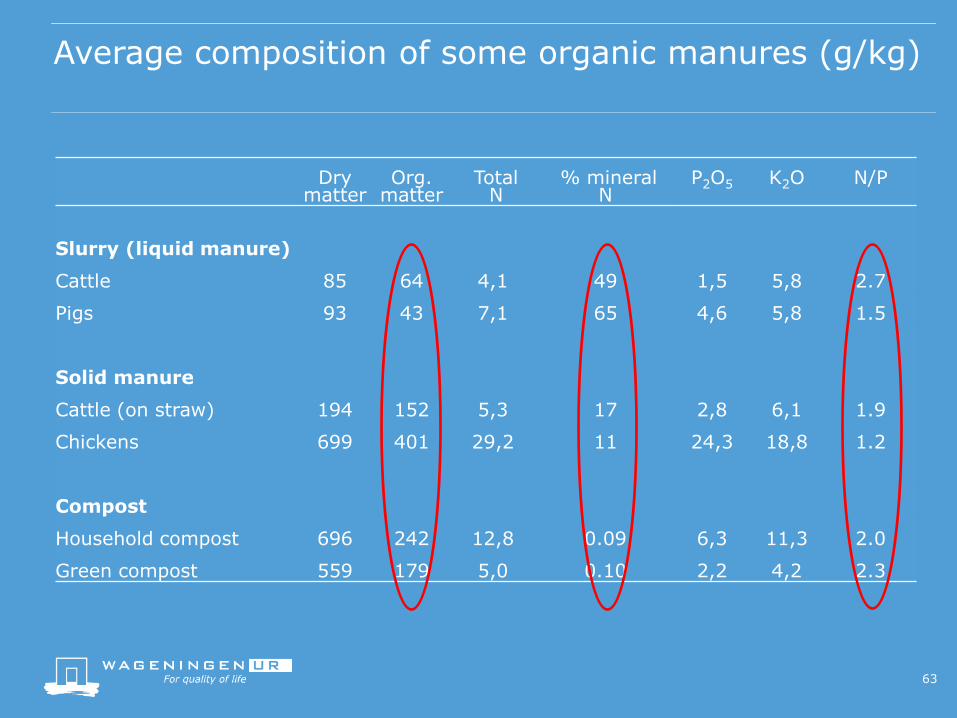
Average composition of some organic manures (g/kg)
63
Dry
matter Org.
matter Total
N % mineral
N P2O5
K2O
N/P
Slurry (liquid manure)
Cattle 85 64 4,1 49 1,5 5,8 2.7
Pigs 93 43 7,1 65 4,6 5,8 1.5
Solid manure
Cattle (on straw) 194 152 5,3 17 2,8 6,1 1.9
Chickens 699 401 29,2 11 24,3 18,8 1.2
Compost
Household compost 696 242 12,8 0.09 6,3 11,3 2.0
Green compost 559 179 5,0 0.10 2,2 4,2 2.3

N replacement value (NRF)
Part of the nitrogen that has the same effectiveness as mineral
fertiliser
NRF depends on
● Ratio mineral N (N-NH3) and organic N
● Application technique: effects volatilization of N-NH3
● Application time: autumn, spring
● Animal type: ruminant, pigs, poultry, other
● Nitrogen uptake period of the crop

Mineral N
During application: Volatilisation NH3
Not volatilised Nm: NH3 --- > NO3
Directly available for plant uptake
Susceptible for leaching
N fertilizer value Nm depends on:
● Volatilization losses --- > Application method
● Leaching losses --- > Application time

Ammonia volatilisation
Application technique Ammonia volatilization
(% of Nm)
Surface spreading 75-80%
Surface spreading + incorporation 20-30%
Injection ≤5%

Organic N
Part of organic matter
Not directly available
N must be broken down to mineral N
● Depending on temperature and soil moisture content
● Differences in degradability
● Cattle manure < pig, poultry manure

Degradibility organic N
Fresh plant material
1st year > 1st year
Cattle manure
1st year > 1st year
Pig, poultry manure
1st year > 1st year
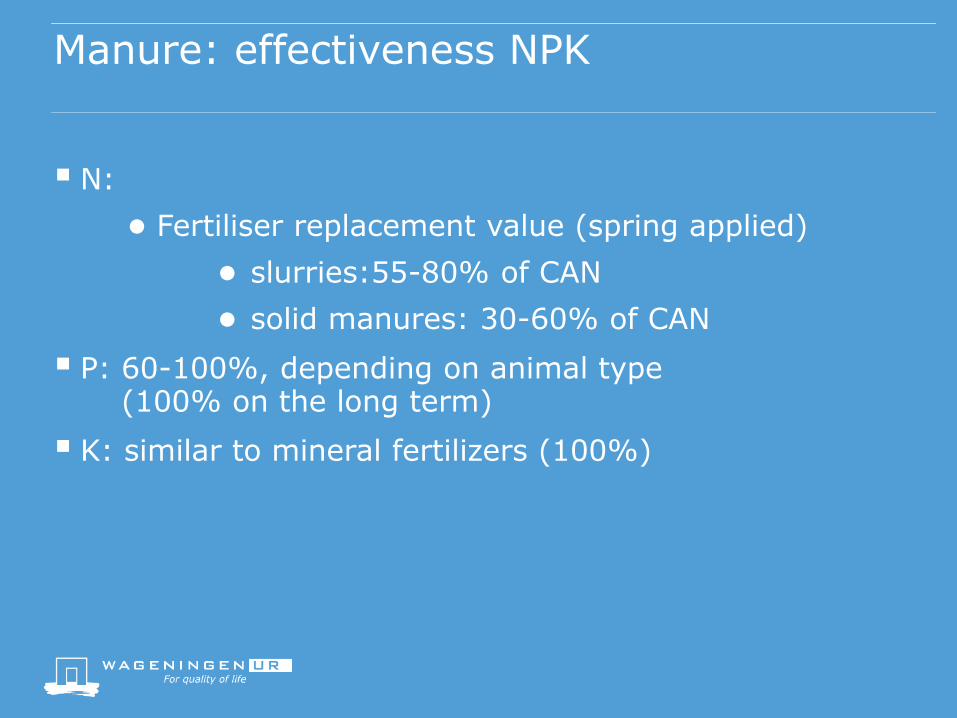
Manure: effectiveness NPK
N:
● Fertiliser replacement value (spring applied)
● slurries:55-80% of CAN
● solid manures: 30-60% of CAN
P: 60-100%, depending on animal type (100% on the long term)
K: similar to mineral fertilizers (100%)

Digestate
Fermentation of manure
+ other organic materials
Remainder product is digestate
suited as organic fertilizer
All inputted minerals remain in the digestate
Organic nitrogen partly converted tot N-NH3 by decomposition
of the organic matter
Composition digestate varies, depending on:
- type and composition of the fermented manure
- type and amount of co-fermented products
N replacement value is up to 10% higher than the value of
unprocessed manure (when injected)

Processing of manure
Phosphorus surplus from manure in the Netherlands
Mechanical separation of slurry
Liquid fraction (poor in P) Solid fraction (rich in P)
Permeate production of
mineral concentrate
(reversed osmosis)

Manufacture of mineral concentrates
High-grade separation
Processing steps:
1. Accurate separation technique
2. Ultrafiltration of liquid fraction
3. Reversed osmosis

Example separation of pig slurry
Effect on the composition of the separated fractions (kg/ton)
DM OM N tot. N-NH3 P2O5 K2O N-tot./P2O5
Input slurry 90 45 7.0 60% 4.0 5.6 1.8
Separation (high efficiency technique)
Solid fraction 270 146 10.5 57% 18.7 5.7 0.6
Liquid fraction 58 25 6.4 58% 1.4 5.6 4.5
Ultra filtration and reversed osmoses of the liquid fraction
Mineral concentrates 38 17 8.1 90% 0.5 9.3 17.3

Agronomic value of mineral concentrates
Liquid NK fertilizer
● Ratio N : K2O = 1 : 1.2 (average)
● N-total: 90% mineral nitrogen 10% organic nitrogen (4-13%)
Incorporation obliged
N replacement value: 70-85%
Small amounts of micro nutrients
No contamination or harmful side effects
Application in arable crops, forage crops and horticulture
Replacement of chemical fertilizer

5. Legislation and market requirements on
fertilization
Why legislation
What is the legislation
Market requirements
75

Why legislation?
Water quality
● Nitrogen and phosphorus leaching
● Ground- and surface water
● EU: Nitrate Directive & Water Framework Directive
Ammonia losses
● Around nature areas
Food safety
● Nitrate concentrations in produce
● Heavy metals and microbiological contamination
76
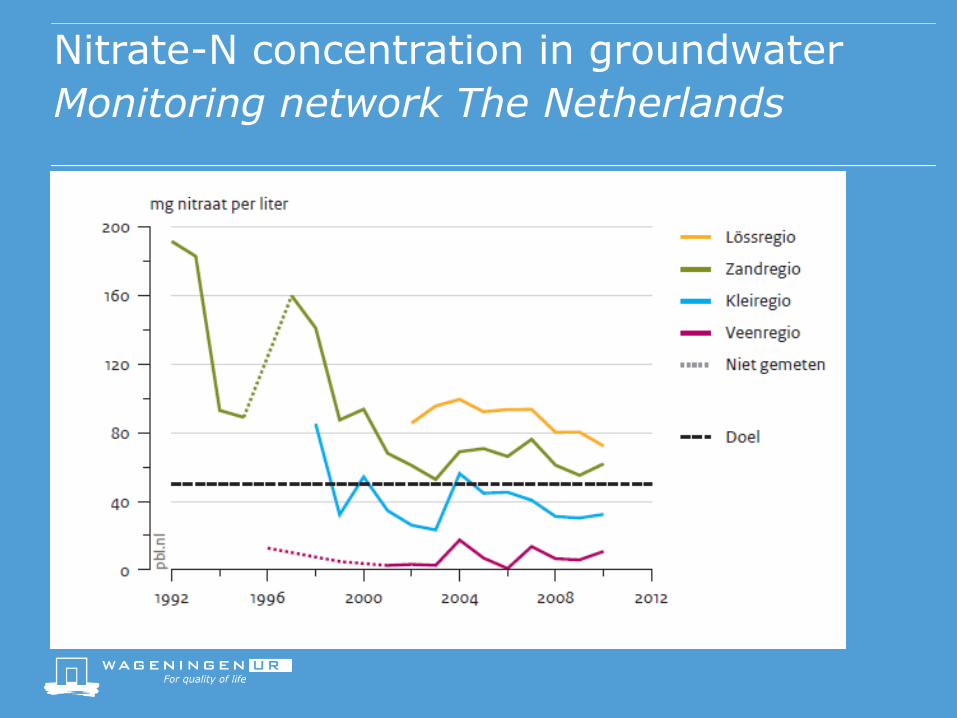
Nitrate-N concentration in groundwater
Monitoring network The Netherlands

N and P concentration in surfacewater
Monitoring network The Netherlands

Nitrogen and phosphorus legislation
Maximum allowed levels for nitrogen and phosphorus
● Application standards
Rules for incorporation of manure
Application time of manure and mineral fertilisers
Obligations on applications along water courses
Catch crop after maize
Obliged manure procession
79

Nitrogen: application standards
Manure
● Maximum 170 kg N/ha
● Derogation: 250 kg N/ha
● Farms with > 80% grassland
Total N (manure + mineral fertilisers)
● Application standard per crop
● Restricted to effective N
● Manure: 40-80%
● Mineral fertiliser: 100%
80

Standards for effective N in manure
Manure type Clay Sand/loess
Slurries
Cattle 60 60
Pig 60 80
Solid manure
Chicken 55 55
Cattle 45 45
Compost 10 10
81

Example: Sugar beet
Application standard: 150 kg N/ha
82

Crop nitrogen application standards
MIN (recommendation, 50 mg N/l in groundwater)
● Clay soils: 100% of recommendation
● Sandy and loess soils: 70-80% of recommendation
● Risk of yield reduction
● Efficient N use important
Crop specific values
83

Phosphorus application standards
84
Application standard depending on:
● Land use:
● P soil status
Total P in manure and mineral fertiliser

Market requirements and other legislation
Use of organic manure in vegetables
Heavy metals
Nitrate content of vegetables
Certification
Sky lark project
85

6. Overview of trends and developments
Declining soil quality
● Organic matter content
● Compaction of soils
● Soil health
Legislation restricts fertilization strongly
● Decreasing organic matter input
Solutions
● Extensification of crop rotation
● Organic fertilizers with higher carbon content
● Reduced tillage
86

Overview of trends and developments
Need for improved fertilizer recommendations
● Recommendations based on intensity and capacity parameters
● Precision fertilisation advices
● Using sensing techniques
● Using information on soil variability
● Incorporating other aspects
● Soil physical and biological aspects
● Plant health and crop quality
87
Overview of trends and developments
Recycling and optimizing organic fertilizers
● Manure processing
● For products fit on need of crop
● For export of nutrients
● Recycling of nutrients & organic matter from waste
● Struvite (NH4MgPO4) from sewage sludge
● Composts
● Anaerobic digestation products
88

7. Differences between China and the
Netherlands, questions and discussion
What is the largest similarity in fertilization between China and the Netherlands?
What is the largest difference between China and the Netherlands?
What is the most important subject to take home?
What was this morning the most remarkable subject?
89

Thank you for
your attention
90