Embed Size (px)
Citation preview

Presentation for investorsPresentation for investorsAnnual results 2011
Nýherji hf. 30. January 2012

1 Introduction
2 Financials
3 Outlook
Nýherji hf. Presentation for investors
Nýherji hf. – a group of IT companies
Nýherji hf.
• About half Nýherji‘s employees work in the subsidiaries:
• TM Software in Iceland
• Applicon in Iceland
• Applicon in Denmark
• Applicon in Sweden
• Dansupport in Denmark
•Total income
• ISK 14.261.184 in 2010
• ISK 15.479.846 in 2011
•Number of employees
• 587 – 2010
• 533 – 2011

Eight Nýherji entities were merged
In 2011, eight Nýherji entities in Iceland were merged into three companies: Nýherji hf., Applicon ehf. and TM Software ehf.
Skyggnir ehf., Sense ehf. and Viðja ehf. merged into Nýherji hf.
Vigor ehf. merged into Applicon ehf.
EMR ehf. merged into TM Software ehf.
• EMR‘s medical data storage is now a part of TM Software‘s products.•

Organizational chart

Principal results for the year 2011
•ISK 72 million loss in 2011.
• Explained in part by a goodwill write-down of ISK 124 million at a subsidiary.
• ISK 321 million profit in 2010
• Sales profit ISK 324 millions because bancruptcy of Roku ehf.
• EBITDA amounted to ISK 532 million.• EBITDA was ISK 518 million the year 2010.• EBITDA was ISK 518 million the year 2010.
• Housing at Borgartún 37 was owned by Nyherji in 2010. With leasing operational cost grew ISK 130 million in 2011.
Total revenues were ISK 15.480 million, increasing by ISK 1.219 million or 7,9% from 2010.
Improved results from domestic operations
Results from parent company were largely in line with expectations in 2011.
• Hardware and software sales exceeded budget projections considerably
Good sales on consumer market on products from Sony.
Sales of Lenovo computers saw an increase
Technical services overall results did not meet projections.
• Revenues in certain core areas of the technical services sector were strong
• Expectations of improved results in 2012.

TM Software sells to 45 countries
Performance in line with expectation with the company posting a solid profit.
• Sales of internally developed software solutions to companies abroad far exceeded previous levels.
• TM Software is a part of mutual Cloud solution with Google, Salesforce and Atlassian.
• In the consultancy and project sphere the project pipeline is good.
The operation of healthcare solutions was in line with projections despite The operation of healthcare solutions was in line with projections despite cutbacks and contraction in the healthcare sector.

Good demand for SAP solutions
Applicon ehf.
• Domestic demand for SAP consultancy services is good and project pipeline is good.
• Applicon ehf worked on sale and implementation project for the Swedish bank Landshypotek in cooperation with Applicon in Sweden.
Applicon A/S posted a loss from operations.
• Delays in launching a system for Region Hovedsaden have caused Applicon considerable losses.
• The installation of the system is expected to be completed at the first hospital in april.
• Project status is good for other customers and outlook is reasonably good for the year.

Good result in Sweden
Applicon Sweden performed above projections during the year, despite difficulties in the Swedish IT sector
• The number of customers has grown and the company is doing more business with existing customers.
• Contract with Landshypotek of installing a SAP banking solution.
Dansupport’s performance in line with expectations.
• Over the past two years the company has been able to successfully turn around its business.
• Dansupport has been able to strengthen its position in the highly competitive Danish market.
• Prospects for this year are favourable.

1 Introduction
2 Financials
3 Outlook
Nýherji hf. Presentation for investors

Income statement Q4 2011
In millions ISK Q42011
% of sales
Q42010
% of sales
Sales of goods and services…………....... 4.304 100% 3.988 100%
Cost of goods and services sold......... (3.455) (80%) (3.117) (78%)
Gross profit..........……………………....... 849 20% 871 22%
Other income............................................ 2 0% 4 0%
Other operating expenses..………........ (757) (17%) (758) (19%)
Write-down of goodwill............................. (124) (3%) 0 0%
Operating profit (loss) (EBIT) …......... (30) (0%) 117 3%
EBITDA ………………………………......... 156 3,6% 191 5%

Income statement 2011
In millions ISK 31.12.2011 % of sales
31.12.2010 % of sales
Sales of goods and services ...…............. 15.480 100% 14.261 100%
COGS ...................................................... (12.378) 80% (11.150) 78%
Gross profit ............................…………… 3.102 20% 3.111 22%
Other income ............................................ 13 0% 16 0%Other income ............................................ 13 0% 16 0%
Other operating expenses …………........ (2.850) 18% (2.898) 20%
Write-down of goodwill .............................. (124) 1% 0 0%
Operating profit (loss) (EBIT) 140 1% 229 2%
EBITDA ……………………… 532 3,4% 518 3,6%

0%
4%
8%
12%
16%
3.000
3.500
4.000
4.500
5.000
Milljó
n IS
K
Good sales in fourth quarter
-20%
-16%
-12%
-8%
-4%
0%
0
500
1.000
1.500
2.000
2.500
F1 2010 F2 2010 F3 2010 F4 2010 F1 2011 F2 2011 F3 2011 F4 2011
Milljó
n IS
K
Sales EBIT% EBITDA%
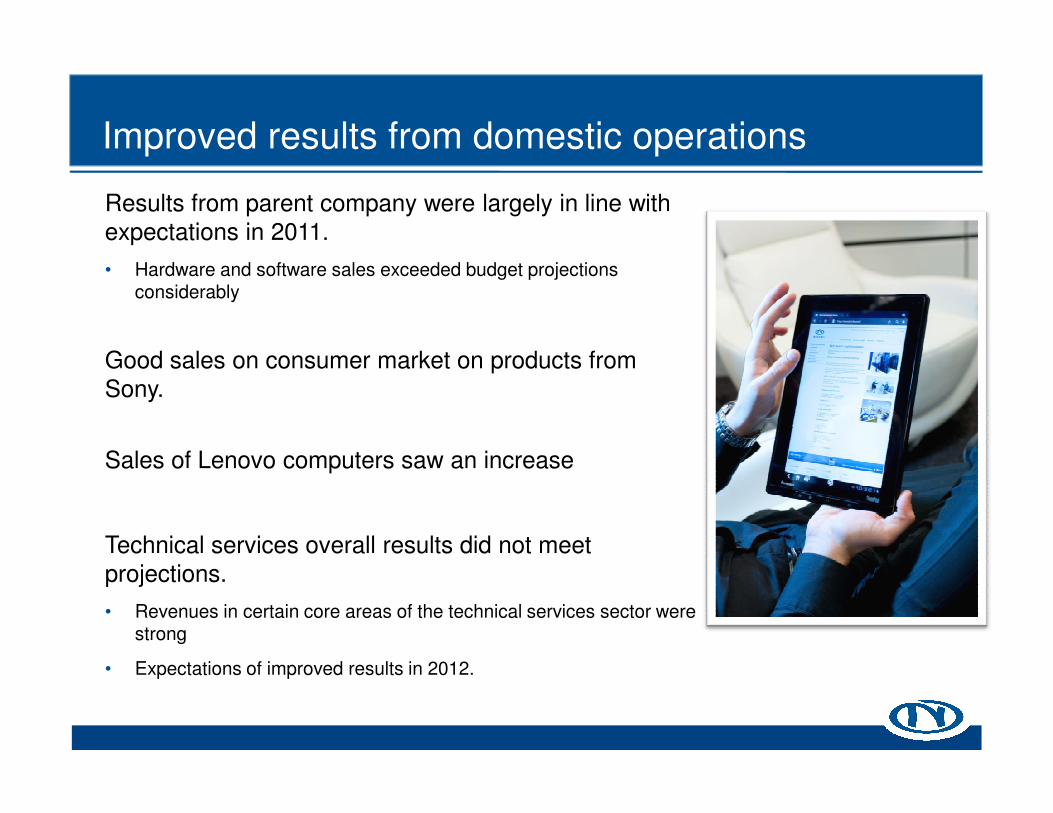
Growth in good sales
5.000
6.000
7.000
8.000
Milljó
n IS
K
Good Sales
0
1.000
2.000
3.000
4.000
2009 2010 2011
Milljó
n IS
K
Good sales

EBITDA
2%
4%
6%
8%
50
100
150
200
Milljó
n IS
K
-6%
-4%
-2%
0%
-150
-100
-50
0
F1 2010 F2 2010 F3 2010 F4 2010 F1 2011 F2 2011 F3 2011 F4 2011
Milljó
n IS
K
EBITDA EBTIDA%

EBITDA – foreign and domestic operations
80
120
160
200
Milljó
n IS
K
80
120
160
200
Milljó
n IS
K
-120
-80
-40
0
40
F1 2010
F2 2010
F3 2010
F4 2010
F1 2011
F2 2011
F3 2011
F4 2011
Milljó
n IS
K
Foreign operations
-120
-80
-40
0
40
F1 2010
F2 2010
F3 2010
F4 2010
F1 2011
F2 2011
F3 2011
F4 2011
Milljó
n IS
K
Domestic operations

Balance sheet 2011
In million ISK 31.12.2011 31.12.2010
Non-current assets ………………………………….. 4.280 4.292
Current assets .……………………………………… 4.138 3.689
Total assets .......………………………………….... 8.418 7.981
Equity ......…………………………………………….. 2.187 2.420Equity ......…………………………………………….. 2.187 2.420
Non-current liabilities ..……………………………… 2.225 2.374
Current liabilities .......…………............................... 4.006 3.187
Total equity and liabilities ....…………………….. 8.418 7.981
Current ratio ......…………………………………….. 1,03 1,16
Equity ratio ........…………………………………...... 26% 30,3%
1 Introduction
2 Financials
3 Outlook
Nýherji hf. Presentation for investors

Two locations instead of four in domestic
operations
Nýherji og subsidiaries offices in Borgartún 37.
• Nýherji hf.
• Applicon ehf.
• TM Software ehf.
A new warehouse and service center at one location.
• One reception for service center, warehouse and
spare part services.

Outlook
Expectations of over ISK 100 million increase in EBITDA in the year 2012.
Substantial improvement in return of foreign Substantial improvement in return of foreign operations.
• The project status and outlook at Applicon Sweden is good.
• A turnaround is expected in the operations of Applicon Denmark during the year.

Q & A
Nýherji hf. Presentation for investors