Embed Size (px)
Citation preview

Nine months 2012 results Presentation for investors and analysts
26th October 2012

2
No. 2012 - 21
Contents
1 Key highlights
2 Consolidated financial information
3 Business development
4 Appendix
5 Financial supplement
6 Schedule and contacts

3
No. 2012 - 21
Million Euros
Business diversification and a prudent management approach allow MAPFRE to successfully face a very adverse economic context
Key highlights1
Revenues 19,412.6 10.5%
Premiums 16,571.9 13.0%
Managed savings 30,229.9 3.7%
Non-life combined ratio 95.3% -1.4 p.p.
ROE 11.5% -2.8 p.p.
Attributable result 655.9 -14.3%
Recurring attributable result 737.9 9.1%
Earnings per share (Euros) 0.21 -16.7%Recurring earnings per share (Euros) 0.24 +9.1%

4
No. 2012 - 21
Non-Life: excellent combined ratio in Spain and strong improvement in the underwriting result at the international insurance and global businesses
Organic growth of the international business, enhanced by the depreciation of the Euro
Life: improvement in recurring results thanks to the growth of the international business
Impairment of the shareholdings in BANKIA and CATTOLICA, as well as a provision of €30 million for the challenging financial environment
Highlights of the results
1 Key highlights
Positive impact on equity as a result of the recovery in the financial markets, offset by the depreciation of the Brazilian Real
The international business continues to deliver on its great potential and drives the Group’s growth
The international business continues to deliver on its great potential and drives the Group’s growth

5
No. 2012 - 21
Development of recurring results
1 Key highlights
Million Euros
Reported figures
Adjustments
Recurring figures
1) Shareholdings in BANKIA and CATTOLICA
9M 2011 9M 2012 %
Result from insurance operations 857.3 712.6 -16.9%
Impact of the earthquakes in Japan and New Zealand 98.5 ---
Greek fixed income --- 41.5
Impairment of equities(1) --- 90.4
Net realised gains -69.1 -38.4 -44.4%
Gain from alliance with BANCO DO BRASIL -122.1 ---
RECURRING RESULT FROM INSURANCE OPERATIONS 764.6 806.1 5.4%
Result from non-insurance operations -4.1 0.2 ---
Other companies and consolidation adjustments -87.6 -56.9 -35.0%
Losses from shareholding in BSF CAJA MADRID-MAPFRE 3.4 ---
Release of provision for financial instability --- -41.5
Investment impairment provisions --- 30.0
RECURRING ATTRIBUTABLE RESULT 676.3 737.9 9.1%
6
No. 2012 - 21
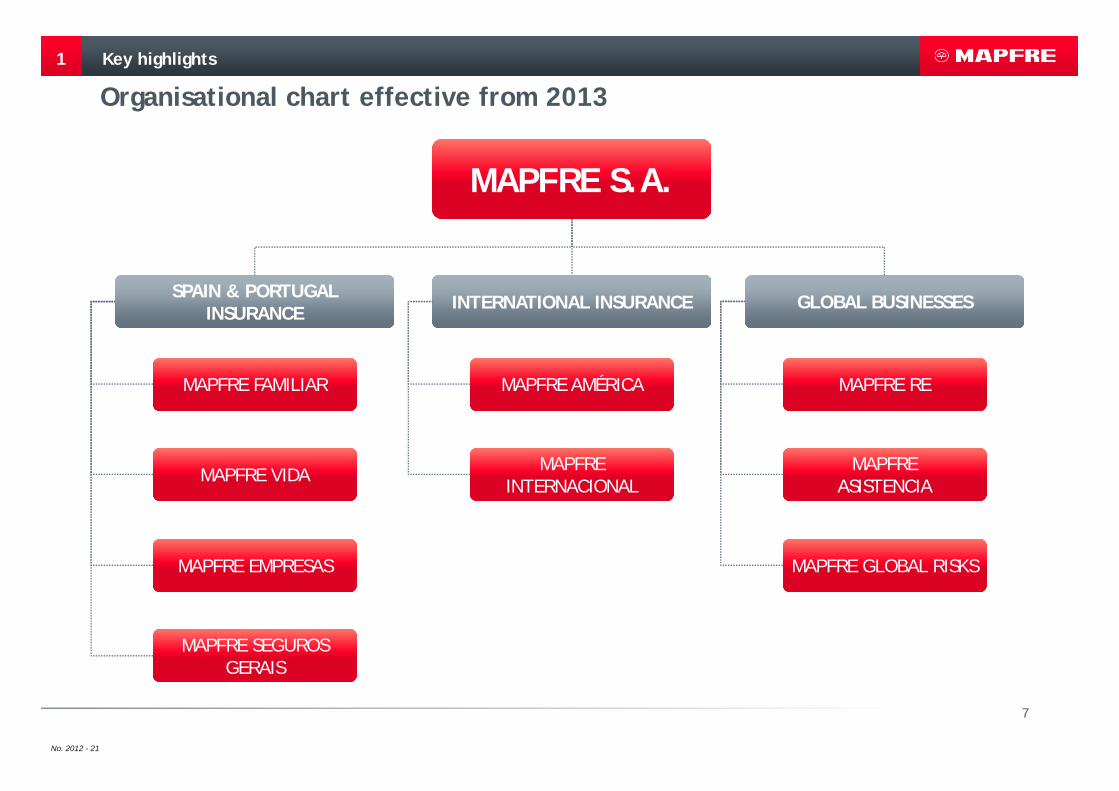
1
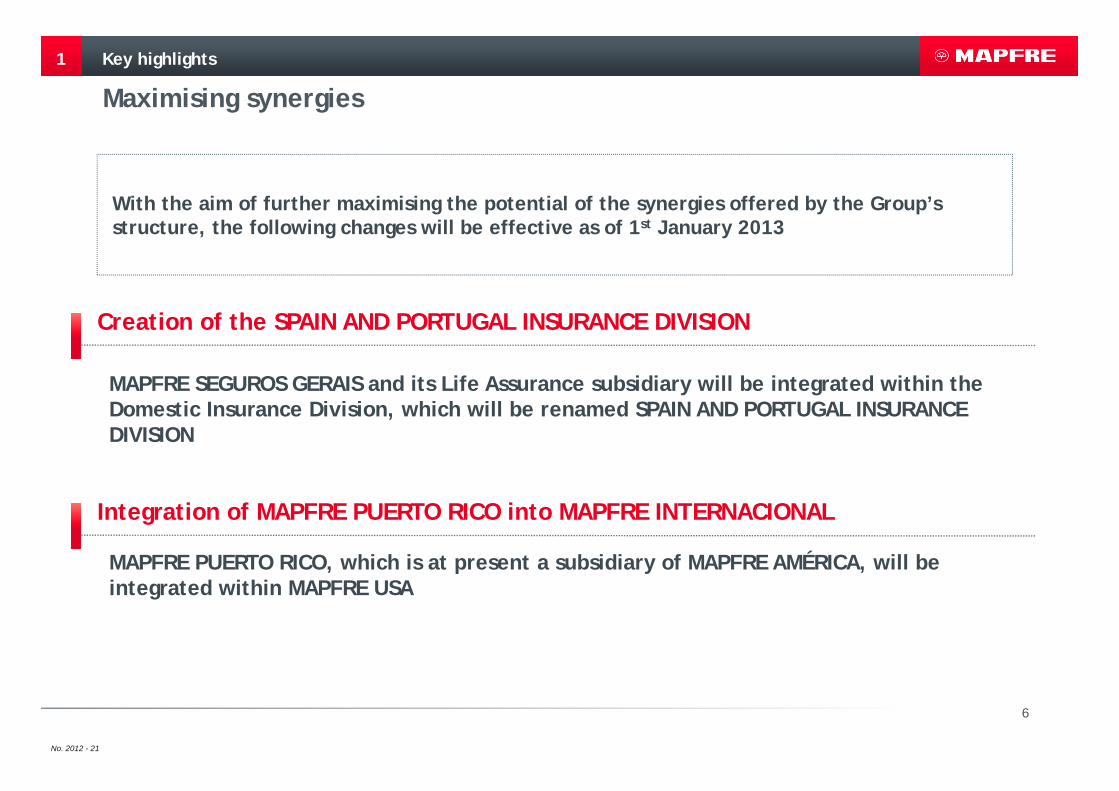
Maximising synergies
MAPFRE SEGUROS GERAIS and its Life Assurance subsidiary will be integrated within the Domestic Insurance Division, which will be renamed SPAIN AND PORTUGAL INSURANCE DIVISION
Creation of the SPAIN AND PORTUGAL INSURANCE DIVISION
MAPFRE PUERTO RICO, which is at present a subsidiary of MAPFRE AMÉRICA, will be integrated within MAPFRE USA
Integration of MAPFRE PUERTO RICO into MAPFRE INTERNACIONAL
With the aim of further maximising the potential of the synergies offered by the Group’s structure, the following changes will be effective as of 1st January 2013
Key highlights
7
No. 2012 - 21
MAPFRE FAMILIAR
MAPFRE VIDA
MAPFRE EMPRESAS
MAPFRE AMÉRICA
MAPFRE INTERNACIONAL
MAPFRE RE
MAPFRE ASISTENCIA
MAPFRE GLOBAL RISKS
MAPFRE S.A.
SPAIN & PORTUGAL INSURANCE INTERNATIONAL INSURANCE GLOBAL BUSINESSES
1
MAPFRE SEGUROS GERAIS
Organisational chart effective from 2013Key highlights

8
No. 2012 - 21
1
Interim dividend against the 2012 results
Key highlights
In light of the volatility in the economic and financial environment,MAPFRE’s Board of Directors deems it appropriate to strengthen theGroup’s levels of capitalisation, liquidity and financial flexibility.
Therefore, it has agreed to pay an interim dividend against the 2012results of €0.04 per share; thus the total dividend paid in the yearamounts to €0.12 per share. In total, the outlay amounts to €369.6million.
9
No. 2012 - 21
1 Key highlights
2 Consolidated financial information
3 Business development
4 Appendix
5 Financial supplement
6 Schedule and contacts

10
No. 2012 - 21
1) Aggregate premiums
Consolidated financial information
Breakdown of premiums and results by line of business and geographical areas
2
Spain 33% Spain 33% Abroad 67%Abroad 67%
Non-Life (Abroad) Non-Life (Spain)
Life (Spain) Life (Abroad)
Reinsurance
Premiums(1) Contribution to consolidated results
43.2%
12.8%
11.5%
12.8%
19.7%
Segment EUR M %
Non-Life Spain 255.7 35.9%
Non-Life Abroad 228.9 32.1%
Life Spain 89.5 12.6%
Life Abroad 61.2 8.6%
Reinsurance 77.3 10.8%
Result from insurance operations
712.6 100.0%
Other/Consolidation adjustments -56.7
Attributable result 655.9

11
No. 2012 - 21
Information by business areas
2
Contribution to premiums(1) Contribution to insurance results
Consolidated financial information
1) Aggregate premiums2) The contribution in 9M 2011 does not include the impact of the gain recognised as a result of the cancellation of the put option on the shareholding in MAPFRE NOSSA CAIXA
9M 2011Business area % % EUR M
DOMESTIC INSURANCE 38.7% 32.5% 5,772.0
MAPFRE BRASIL 15.8% 20.2% 3,577.1
MAPFRE RE 13.0% 12.8% 2,277.0
MAPFRE USA 6.8% 6.6% 1,172.4
MAPFRE GLOBAL RISKS 5.2% 4.9% 867.8
MAPFRE ASISTENCIA 2.7% 3.1% 553.7
OTHER 17.8% 19.9% 3,520.5
9M 2012 9M 2011Business area % % EUR M
DOMESTIC INSURANCE 57.7% 48.4% 345.2
MAPFRE USA 3.7% 11.8% 84.1
MAPFRE RE 5.7% 10.8% 77.3
MAPFRE BRASIL(2) 6.8% 10.7% 75.9
MAPFRE GLOBAL RISKS 2.2% 2.4% 17.1
MAPFRE ASISTENCIA 1.8% 2.5% 17.7
9M 2012

12
No. 2012 - 21
Development of Non-Life insurance results
2 Consolidated financial information
Non-Life business – Main business areas
Million Euros
1) Ratios calculated over net premiums earned
Business area 9M 2011 9M 2012 % 9M 2011 9M 2012 % 9M 2011 9M 2012
DOMESTIC INSURANCE 3,667.8 3,499.5 -4.6% 372.3 338.4 -9.1% 88.9% 89.8%
MAPFRE BRASIL 1,742.9 2,123.2 21.8% -8.5 -11.1 30.6% 100.6% 100.7%
MAPFRE AMÉRICA - OTHER COUNTRIES 2,088.8 2,549.5 22.1% -26.6 6.2 --- 101.9% 99.6%
MAPFRE RE 1,744.2 1,908.3 9.4% -15.8 69.8 --- 101.3% 94.2%
MAPFRE USA 1,071.7 1,172.4 9.4% -78.2 15.3 --- 108.1% 98.5%
MAPFRE GLOBAL RISKS 813.2 867.8 6.7% 12.9 10.6 -17.8% 93.6% 94.8%
MAPFRE ASISTENCIA 416.6 553.7 32.9% 26.5 24.4 -7.9% 92.4% 94.9%
Premiums Underwriting result Combined ratio(1)

13
No. 2012 - 21
Development of Non-Life insurance results
2
Non-Life Account Key points
1) Ratios as a % of net premiums earned2) As of 31st May 2011
Consolidated financial information
Million Euros
Organic growth of the international business, enhanced by the depreciation of the Euro, which offsets the impact of the economic crisis in Spain
Consolidation of BB SEGUROS(2)
Favourable trend in the reinsurance loss experience and in the international business
Increase in the expense ratio, mainly due to the greater weight of the international business
Provision for the impairment of financial assets amounting to €137.3 million (net of realised capital gains)
Improvement of the recurring financial result thanks to a higher volume of technical reserves
9M 2011 9M 2012 %
Gross written and accepted premiums
10,846.3 11,906.5 9.8%
Underwriting result 293.0 464.8 58.6%
Net financial and other non-technical income
583.8 428.2 -26.7%
Result of Non-life business 876.8 893.0 1.8%
Loss ratio(1) 69.5% 66.8%
Expense ratio(1) 27.2% 28.5%
Combined ratio(1) 96.7% 95.3%

14
No. 2012 - 21
Development of Life Assurance results
2 Consolidated financial information
Million Euros
Life business – Main business areas
Business area 9M 2011 9M 2012 % 9M 2011 9M 2012 %
DOMESTIC INSURANCE 2,391.3 2,272.5 -5.0% 178.8 152.1 -14.9%
MAPFRE BRASIL 727.7 1,453.9 99.8% 259.4 246.1 -5.1%
MAPFRE AMÉRICA - OTHER COUNTRIES 348.0 477.7 37.3% 9.0 17.9 98.9%
MAPFRE RE 292.8 368.7 25.9% 33.9 16.4 -51.6%
MIDDLESEA --- 64.6 --- --- 11.7 ---
PremiumsUnderwriting and financial
result

15
No. 2012 - 21
Development of Life Assurance results
2
Life Account Key points
1) In 9M 2011, impact of profits resulting from the agreement with BANCO DO BRASIL; in 9M 2012, provision for the impairment of the shareholding in BANKIA2) This has a neutral impact on results, since it is compensated by a variation of equal amount and opposing sign in technical reserves
Consolidated financial information
Million Euros
Organic growth of the international business
Very good performance of Life-Savings insurance through the agents’ channel in Spain, which partly offsets the weakness of the bank channel
The winning of large corporate transactions in the Life-Savings segment in Spain amounting to €354 million
Consolidation of BB SEGUROS and MIDDLESEA INSURANCE
Significant improvement of the recurring underwriting and financial result in Latin America
Consolidation of BB SEGUROS and MIDDLESEA INSURANCE
Negative results from financial assets amounting to €10 million (net of realised capital gains)
Gains of €137.4 million, recognised in 9M 2011, arising from the agreement with BANCO DO BRASIL
9M 2011 9M 2012 %
Gross written and accepted premiums
3,813.5 4,665.4 22.3%
Underwriting and financial result
481.5 357.3 -25.8%
w/o extraordinary results (1) 344.1 393.0 14.2%
Unrealised gains from unit-
linked investments(2) -5.6 81.6 ---
Result of Life business 475.9 438.9 -7.8%
w/o extraordinary results (1) 338.5 474.6 40.2%
16
No. 2012 - 21
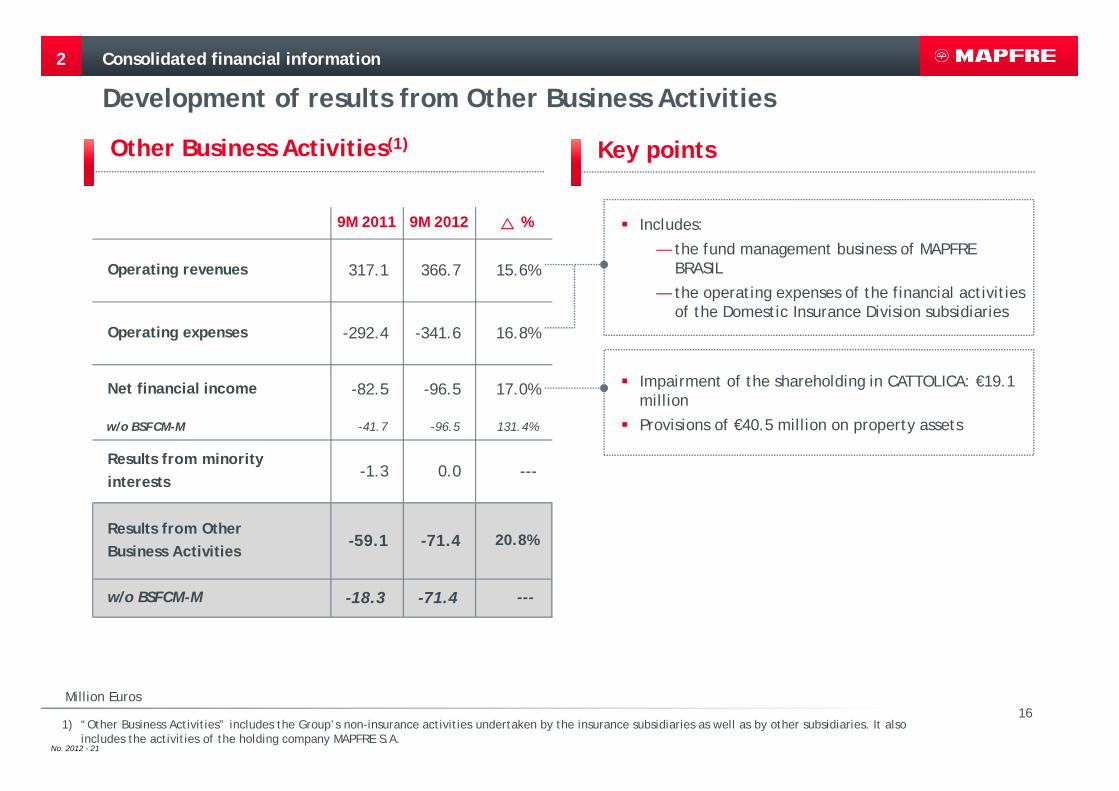
Development of results from Other Business Activities
2
Key pointsOther Business Activities(1)
1) “Other Business Activities” includes the Group’s non-insurance activities undertaken by the insurance subsidiaries as well as by other subsidiaries. It also includes the activities of the holding company MAPFRE S.A.
Consolidated financial information
Million Euros
Impairment of the shareholding in CATTOLICA: €19.1 million
Provisions of €40.5 million on property assets
Includes:
— the fund management business of MAPFRE BRASIL
— the operating expenses of the financial activities of the Domestic Insurance Division subsidiaries
9M 2011 9M 2012 %
Operating revenues 317.1 366.7 15.6%
Operating expenses -292.4 -341.6 16.8%
Net financial income -82.5 -96.5 17.0%
w/o BSFCM-M -41.7 -96.5 131.4%
Results from minority interests
-1.3 0.0 ---
Results from OtherBusiness Activities
-59.1 -71.4 20.8%
w/o BSFCM-M -18.3 -71.4 ---

17
No. 2012 - 21
Consolidated result
2
Key highlights
Consolidated financial information
Million Euros
The result attributable to minority interests increases due to the impact of the alliance with BANCO DO BRASIL
9M 2011 9M 2012 %
Result on restatement of financial accounts -16.0 -5.4 -66.3%
Result before tax and minority interests 1,277.6 1,255.1 -1.8%
Taxes -328.1 -371.3 13.2%
Result after tax 949.5 883.8 -6.9%
Result after tax from discontinued operations -0.2 0.0 ---
Result for the year 949.3 883.8 -6.9%
Result attributable to minority interests -183.7 -227.9 24.1%
Result attributable to the controlling Company 765.6 655.9 -14.3%

18
No. 2012 - 21
Balance sheet – key highlights
2
1) Includes unit-linked reserves
Consolidated financial information
Million Euros
Value assigned to the assets included after the alliance with BANCO DO BRASIL
Recovery of the financial markets in the third quarter
Purchase of financial assets
30.9.11 31.12.11 30.9.12
Goodwill 2,895.2 2,266.4 2,364.4
Other intangible assets 937.5 2,450.1 2,266.6
Other fixed assets 384.4 382.0 427.1
Cash & equivalents 903.7 1,254.3 789.2
Investments & real estate 36,637.8 36,697.0 38,135.3
Participation of reinsurance in technical
reserves3,104.2 3,305.3 3,382.3
Insurance & reinsurance operations 4,030.2 3,977.7 4,711.8
Deferred taxes 1,247.3 1,264.2 1,289.9
Other assets 3,218.6 3,258.6 3,525.1
TOTAL ASSETS 53,358.9 54,855.6 56,891.7
Shareholders' Equity 7,061.8 7,042.9 7,766.3
Minority interests 2,182.0 2,683.7 2,373.9
Financial & subordinated debt 1,757.4 1,915.0 1,893.3
Technical reserves 36,263.2 36,451.3 37,734.9
- Life assurance reserves(1) 20,864.0 20,502.0 21,438.0
- Other technical reserves 15,399.2 15,949.3 16,296.9
Reserves for risks and expenses 1,154.8 1,153.3 1,038.3
Insurance & reinsurance operations 1,423.2 1,518.9 1,738.4
Deferred taxes 1,125.1 1,730.8 1,720.9
Other liabilities 2,391.4 2,359.7 2,625.7
TOTAL LIABILITIES 53,358.9 54,855.6 56,891.7Appreciation of the Euro versus the Brazilian Real
Tax impact of a higher volume of intangible assets
Growth of the volume ceded by the international business
19
No. 2012 - 21
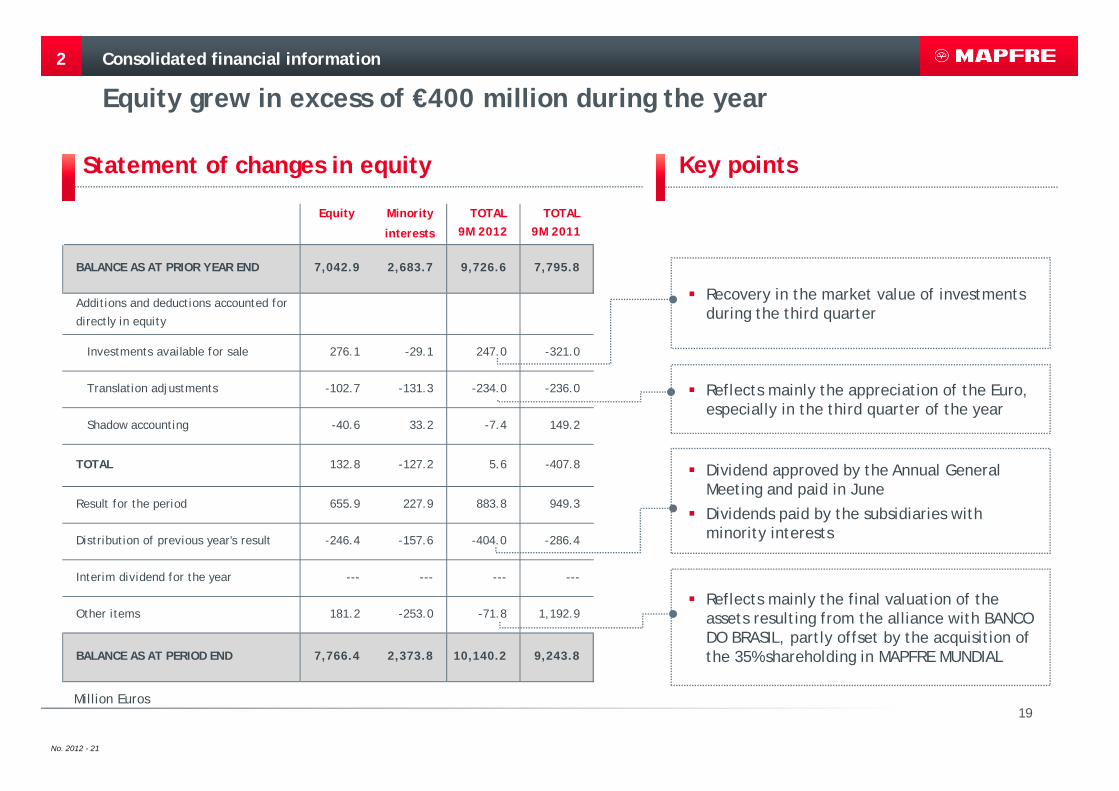
Equity grew in excess of €400 million during the year
2
Statement of changes in equity Key points
Consolidated financial information
Million Euros
Recovery in the market value of investments during the third quarter
Reflects mainly the appreciation of the Euro, especially in the third quarter of the year
Dividend approved by the Annual General Meeting and paid in June
Dividends paid by the subsidiaries with minority interests
Reflects mainly the final valuation of the assets resulting from the alliance with BANCO DO BRASIL, partly offset by the acquisition of the 35% shareholding in MAPFRE MUNDIAL
Equity Minority
interests
BALANCE AS AT PRIOR YEAR END 7,042.9 2,683.7 9,726.6 7,795.8
Additions and deductions accounted for
directly in equity
Investments available for sale 276.1 -29.1 247.0 -321.0
Translation adjustments -102.7 -131.3 -234.0 -236.0
Shadow accounting -40.6 33.2 -7.4 149.2
TOTAL 132.8 -127.2 5.6 -407.8
Result for the period 655.9 227.9 883.8 949.3
Distribution of previous year's result -246.4 -157.6 -404.0 -286.4
Interim dividend for the year --- --- --- ---
Other items 181.2 -253.0 -71.8 1,192.9
BALANCE AS AT PERIOD END 7,766.4 2,373.8 10,140.2 9,243.8
TOTAL 9M 2012
TOTAL 9M 2011

20
No. 2012 - 21
1 Key highlights
2 Consolidated financial information
3 Business development
4 Appendix
5 Financial supplement
6 Schedule and contacts
21
No. 2012 - 21
Business development
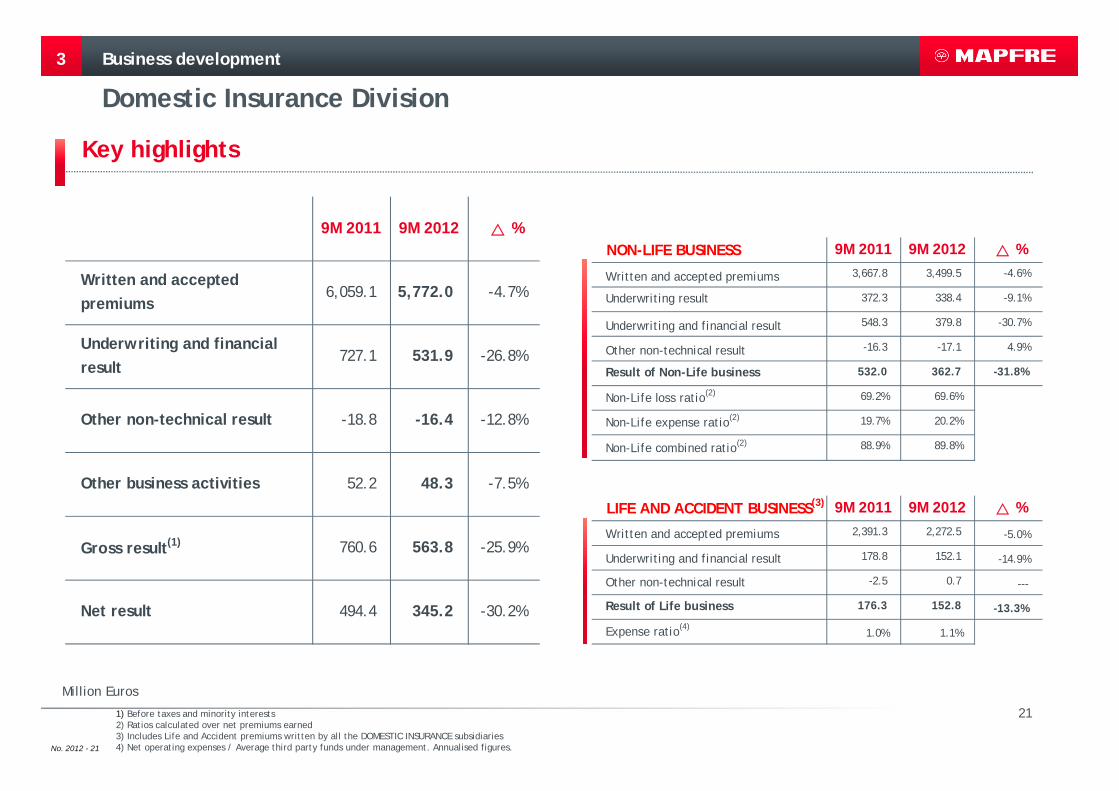
Domestic Insurance Division
3
Key highlights
Million Euros
1) Before taxes and minority interests2) Ratios calculated over net premiums earned3) Includes Life and Accident premiums written by all the DOMESTIC INSURANCE subsidiaries 4) Net operating expenses / Average third party funds under management. Annualised figures.
9M 2011 9M 2012 %
Written and accepted premiums
6,059.1 5,772.0 -4.7%
Underwriting and financial result
727.1 531.9 -26.8%
Other non-technical result -18.8 -16.4 -12.8%
Other business activities 52.2 48.3 -7.5%
Gross result(1) 760.6 563.8 -25.9%
Net result 494.4 345.2 -30.2%
NON-LIFE BUSINESS 9M 2011 9M 2012 %
Written and accepted premiums 3,667.8 3,499.5 -4.6%
Underwriting result 372.3 338.4 -9.1%
Underwriting and financial result 548.3 379.8 -30.7%
Other non-technical result -16.3 -17.1 4.9%
Result of Non-Life business 532.0 362.7 -31.8%
Non-Life loss ratio(2) 69.2% 69.6%
Non-Life expense ratio(2) 19.7% 20.2%
Non-Life combined ratio(2) 88.9% 89.8%
LIFE AND ACCIDENT BUSINESS(3) 9M 2011 9M 2012 %
Written and accepted premiums 2,391.3 2,272.5 -5.0%
Underwriting and financial result 178.8 152.1 -14.9%
Other non-technical result -2.5 0.7 ---
Result of Life business 176.3 152.8 -13.3%
Expense ratio(4)1.0% 1.1%
22
No. 2012 - 21
3
Net financial income
Net resultExcluding the effect of realisation gains and impairments, the net result decreases 10.9%
Includes realisations from investments, net of write-downs, of -€88.3 million, compared to €43 million in 9M 2011
a better performance than the market in the Motor line (-5.1% versus -5.4%), with a noteworthy contribution from VERTI (€28.2 million, +64.8%)
the good performance of the agents’ channel in the Life-Savings segment, which partly offsets the lower issuance in the bank channel
the winning of large corporate transactions in the Life-Savings segment amounting to €354 million
Premiums evolution
Premiums decrease as a result of the decline in demand in the Spanish market. In this environment, worthy of mention are:
Insurance result
The insurance result, which remains at excellent levels, reflects: a lower level of earned premiums, partly offset by a favourable trend in the Motor line an exceptionally low loss experience in the Home and Burial lines in 9M 2011 the decrease in the expense ratio at MAPFRE EMPRESAS, favoured by the increase in earned premiums in this business
and the non-recurring impact of a change in the accrual of commissions and other acquisition costs the focus on the Life-Protection business
Business development
Domestic Insurance Division: highlights of the results
23
No. 2012 - 21
3
Million Euros
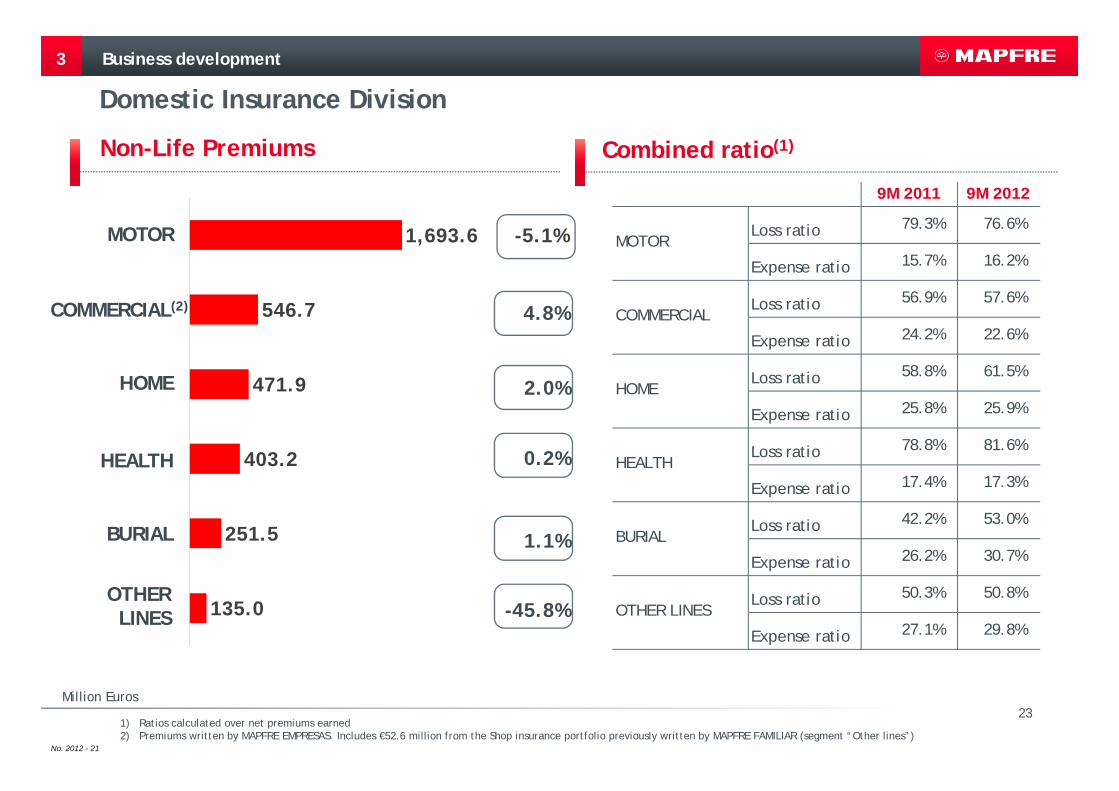
Combined ratio(1)Non-Life Premiums
Business development
Domestic Insurance Division
1) Ratios calculated over net premiums earned2) Premiums written by MAPFRE EMPRESAS. Includes €52.6 million from the Shop insurance portfolio previously written by MAPFRE FAMILIAR (segment “Other lines”)
MOTOR
HEALTH
BURIAL
COMMERCIAL(2)
HOME
OTHER LINES
9M 2011 9M 2012
Loss ratio 79.3% 76.6%
Expense ratio 15.7% 16.2%
Loss ratio 56.9% 57.6%
Expense ratio 24.2% 22.6%
Loss ratio 58.8% 61.5%
Expense ratio 25.8% 25.9%
Loss ratio 78.8% 81.6%
Expense ratio 17.4% 17.3%
Loss ratio 42.2% 53.0%
Expense ratio 26.2% 30.7%
Loss ratio 50.3% 50.8%
Expense ratio 27.1% 29.8%
HEALTH
OTHER LINES
MOTOR
BURIAL
COMMERCIAL
HOME
1,693.6
546.7
471.9
403.2
251.5
135.0
-5.1%
4.8%
2.0%
0.2%
1.1%
-45.8%

24
No. 2012 - 21
Domestic Insurance Division
3 Business development
Life business: activity indicators
Million Euros
1) Cumulative variation versus prior year end. Excludes the variation in shareholders’ equity over the same period.
2) Includes the effect of “shadow accounting” which adjusts technical reserves for variations in the market value of matching assets
1) Accident insurance premiums written by MAPFRE FAMILIAR in previous years
GROSS WRITTEN AND ACCEPTED PREMIUMS 9M 2011 9M 2012 %
Regular premiums 467.5 337.8 -27.7%
Single premiums 1,581.5 1,560.1 -1.4%
Life premiums - Savings 2,049.0 1,897.9 -7.4%
Life premiums - Protection 340.3 322.7 -5.2%
Accident premiums(1) -- 49.5 --
TOTAL PREMIUMS 2,389.3 2,270.1 -5.0%
- Agents' and other channels 942.2 1,251.7 32.8%
- Bank channel 1,447.1 1,018.4 -29.6%
MANAGED SAVINGS 9M 2011 9M 2012 %Regular premiums 4,634.4 4,528.2 -2.3%
Single premiums 12,543.4 12,820.0 2.2%
Life Assurance - Protection 156.5 154.9 -1.0%
Total Mathematical Reserves 17,334.3 17,503.1 1.0%
Other reserves 532.0 606.0 13.9%
TECHNICAL RESERVES 17,866.3 18,109.1 1.4%
Mutual funds and managed portfolios 2,549.5 2,417.6 -5.2%
Pension funds 4,963.2 5,018.7 1.1%
TOTAL MANAGED SAVINGS 25,379.0 25,545.4 0.7%
CHANGE IN FUNDS UNDER MANAGEMENT(1) 9M 2011 9M 2012
IFRS technical reserves(2) 49.4 298.3
Variation w/o the effect of "shadow accounting" 180.9 260.2
Pension funds -229.9 -62.7
- Net sales -126.5 -210.8
Mutual funds and managed portfolios -56.3 -230.8
- Net sales - Mutual funds -190.4 -127.1
TOTAL CHANGE -236.8 4.8
the good performance of the agents’ channel in Life-Savings insurance
the winning of large corporate transactions in the Life-Savings segment amounting to €354 million
the decline of the savings rate of Spanish households and a greater preference for short-term products
the recovery in the market value of investments during the third quarter
The development of the funds under management reflects:

25
No. 2012 - 21
International Insurance Division
3 Business development
Key highlights
Million Euros
1) Before taxes and minority interests2) Ratios calculated over net premiums earned
MAPFRE AMÉRICA
MAPFRE INTERNACIONAL
9M 2011 9M 2012 %
Written and accepted premiums
6,345.0 8,270.0 30.3%
Underwriting and financial result
528.2 626.5 18.6%
Other non-technical result -4.5 -4.7 4.4%
Other business activities -1.2 -7.9 ---
Gross result(1) 506.6 608.6 20.1%
Net result 308.4 256.6 -16.8%
Non-Life combined ratio(2) 103.0% 99.7%
9M 2011 9M 2012 %
Gross written and accepted premiums 4,907.4 6,604.3 34.5%
Underwriting and financial result 458.8 486.0 5.9%
Other non-technical results -2.7 -3.9 44.4%
Gross result(1) 440.5 491.2 11.5%
Net result 250.2 170.5 -31.9%
Non-life combined ratio(2) 101.2% 100.1%
9M 2011 9M 2012 %
Gross written and accepted premiums 1,437.6 1,665.7 15.9%
Underwriting and financial result 69.5 140.5 102.2%
Result from other business activities -1.6 -22.4 ---
Gross result(1) 66.1 117.4 77.6%
Net result 58.2 86.1 47.9%
Non-life combined ratio(2) 106.7% 98.7%
26
No. 2012 - 21
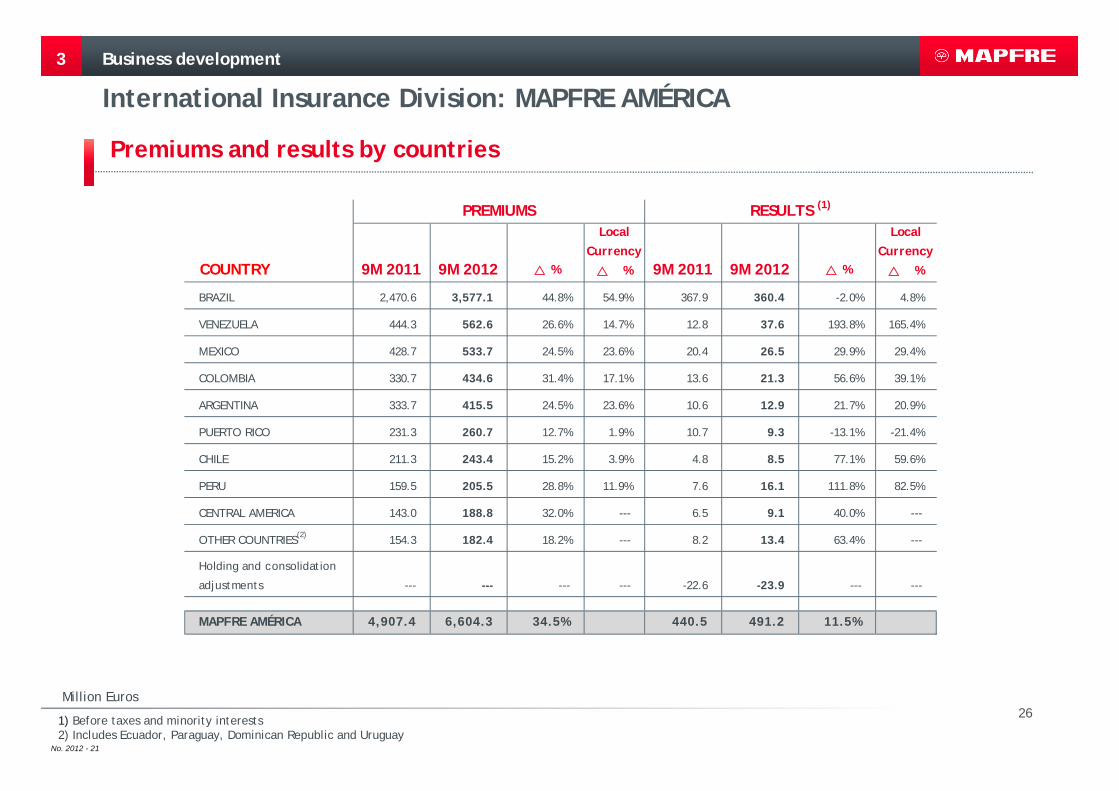
International Insurance Division: MAPFRE AMÉRICA
3
Premiums and results by countries
Business development
Million Euros
1) Before taxes and minority interests2) Includes Ecuador, Paraguay, Dominican Republic and Uruguay
COUNTRY 9M 2011 9M 2012 %
Local Currency
% 9M 2011 9M 2012 %
Local Currency
%
BRAZIL 2,470.6 3,577.1 44.8% 54.9% 367.9 360.4 -2.0% 4.8%
VENEZUELA 444.3 562.6 26.6% 14.7% 12.8 37.6 193.8% 165.4%
MEXICO 428.7 533.7 24.5% 23.6% 20.4 26.5 29.9% 29.4%
COLOMBIA 330.7 434.6 31.4% 17.1% 13.6 21.3 56.6% 39.1%
ARGENTINA 333.7 415.5 24.5% 23.6% 10.6 12.9 21.7% 20.9%
PUERTO RICO 231.3 260.7 12.7% 1.9% 10.7 9.3 -13.1% -21.4%
CHILE 211.3 243.4 15.2% 3.9% 4.8 8.5 77.1% 59.6%
PERU 159.5 205.5 28.8% 11.9% 7.6 16.1 111.8% 82.5%
CENTRAL AMERICA 143.0 188.8 32.0% --- 6.5 9.1 40.0% ---
OTHER COUNTRIES(2) 154.3 182.4 18.2% --- 8.2 13.4 63.4% ---
Holding and consolidation
adjustments --- --- --- --- -22.6 -23.9 --- ---
MAPFRE AMÉRICA 4,907.4 6,604.3 34.5% 440.5 491.2 11.5%
RESULTS (1)PREMIUMS

27
No. 2012 - 21
Consolidation of the businesses with BANCO DO BRASIL since 31.5.2011 Variation in the combined ratio due to:
– an improvement in the loss ratio in the General Insurance, Health and Accident segments– a greater weight of businesses resulting from sales distribution agreements and affinities with a larger ratio of
acquisition expenses but a lower loss ratio Increase of results in Peru due to the sale of a property with a capital gain of €3 million
3
BRAZIL
The growth in results reflects the decrease in inflation, which resulted in a lower expected loss ratio and a reduction in restatement losses
VENEZUELA
Strong growth in all lines due to the consolidation of the businesses with BANCO DO BRASIL since 31.5.2011
Decrease in the combined ratio as a result of a lower loss ratio in the General Insurance line Amortisation of VOBA amounting to €59.3 million, before taxes and minority interests (VOBA
was not amortised in 9M 2011)
Sustained growth in the Motor line stemming from the implementation of specific commercial plans
Continued improvement in the underwriting result due to a stricter underwriting policy
MEXICO
Business development
International Insurance Division: MAPFRE AMÉRICA
Highlights of the Unit
Highlights by countries

28
No. 2012 - 21
3
Premiums and results by countries
Million Euros
1) Before taxes and minority interests
Business development
International Insurance Division: MAPFRE INTERNACIONAL
«Holding and consolidation adjustments» includes an impairment of €19.1 million on the shareholding in CATTOLICA, which was already accounted for in the second quarter. In 9M 2011, it included the positive impact of the increase in the shareholding in MIDDLESEA (Malta) for a consideration of €14.9 million.
COUNTRY 9M 2011 9M 2012 %
Local Currency
% 9M 2011 9M 2012 %
Local Currency
%
USA 1,071.7 1,172.4 9.4% -0.7% 33.9 107.9 218.3% 188.7%
TURKEY 210.4 279.1 32.7% 32.7% 18.5 21.1 14.1% 14.1%
PORTUGAL 110.0 96.3 -12.5% --- 5.8 3.8 -34.5% ---
MALTA 21.4 90.4 321.8% --- -1.5 11.0 --- ---
PHILIPPINES 24.1 27.5 14.1% 1.4% 3.8 3.0 -21.1% -29.9%
Holding and
consolidation adjust. --- --- --- --- 5.6 -29.4 --- ---
MAPFRE INTERNACIONAL
1,437.6 1,665.7 15.9% 66.1 117.4 77.7%
RESULTS (1)PREMIUMS

29
No. 2012 - 21
3
USA
Other countries
Strong premiums growth in the Health and Motor lines, resulting from the implementation of several sales campaigns. Increases in the Fire and Engineering lines as well, due to the growing activity in industrial risks and the cooperation with MAPFRE GLOBAL RISKS
Improvement in technical results due to a decrease in the loss ratio in the Motor and Health lines, and a net positive effect of €2.9 million due to a change in the regulations governing the Motor line
Lower financial results, mainly stemming from negative exchange rate differences (which were positive in 9M 2011) and the reduction in interest rates
Positive impact of the appreciation of the USD against the Euro(1)
Decrease in production in California and New York as a result of a change in the sales strategy, targeted at improving the underwriting result in these states
Significant improvement in the loss ratio due to milder weather and rate increases Lower financial results, as a result of the decrease in interest rates in the USA, and lower realisation gains A higher effective tax rate due to the significant reduction in negative tax bases
Reduction in premiums, driven by the country’s economic situation, as well as by the cancellation of fronting operations and of a bancassurance agreement
The result includes an impairment from the investment in BANKIA of €3.3 million (posted in the second quarter)
Declining sales of Life products as a result of the financial crisis and a lower issuance in the bank channel
Improvement in financial income in the third quarter, which reflects the recovery in the stock markets
TURKEY
MALTA
PORTUGAL
Business development
International Insurance Division: MAPFRE INTERNACIONAL
1) When comparing average exchange rates for 9M 2011 and 9M 2012

30
No. 2012 - 21
3
Key highlights
1) Before taxes and minority interests
Million Euros
Global Businesses Division
Business development
9M 2011 9M 2012 %
Premiums & operating income
3,378.6 3,825.6 13.2%
Underwriting and financial result
125.3 170.4 36.0%
Other non-technical result 1.3 2.9 123.1%
Other business activities -1.5 -1.6 6.7%
Gross result(1) 125.2 171.7 37.1%
Net result 87.2 119.2 36.7%
Non-Life Combined Ratio 98.9% 94.4%
MAPFRE RE 2,277.0 11.8%
MAPFRE GLOBAL RISKS 867.8 6.7%
MAPFRE ASISTENCIA 680.8 28.8%
MAPFRE RE 118.6 55.0%
MAPFRE GLOBAL RISKS 24.5 2.1%
MAPFRE ASISTENCIA 27.3 9.6%
MAPFRE RE 84.4 58.9%
MAPFRE GLOBAL RISKS 17.1 -8.1%
MAPFRE ASISTENCIA 17.7 14.2%

31
No. 2012 - 21
Key figures Key highlights
1) Before taxes and minority interests2) Ratio calculated over net premiums earned
Million Euros
3
Global Businesses Division: MAPFRE RE
Business development
Growth of the Property Damage lines in Latin America and the USA, as well as of the Life Assurance business in Europe and Latin America
Depreciation of the Euro; growth at constant exchange rates of 7.0%
Lower impact of natural catastrophes, which amounted to €218.5 million in 9M 2011
The financial result (€56.2 million) was affected by: Impairments on BANKIA of €30.1 million (posted in
the second quarter) Negative exchange rate differences of €1.8 million
(-€3.0 million in 9M 2011) Realisation gains of €3.4 million (€6.6 million in 9M
2011)
9M 2011 9M 2012 %
Gross written and accepted premiums
2,037.0 2,277.0 11.8%
- of which Life premiums 292.8 368.7 25.9%
- of which Non-Life premiums 1,744.2 1,908.3 9.4%
Underwriting result -10.8 62.4 ---
Gross result(1) 75.1 120.4 60.3%
Net result 53.1 84.4 58.9%
Non-life combined ratio(2) 101.3% 94.2%
ROE 10.2% 12.4%
32
No. 2012 - 21
Key figures Key highlights
3
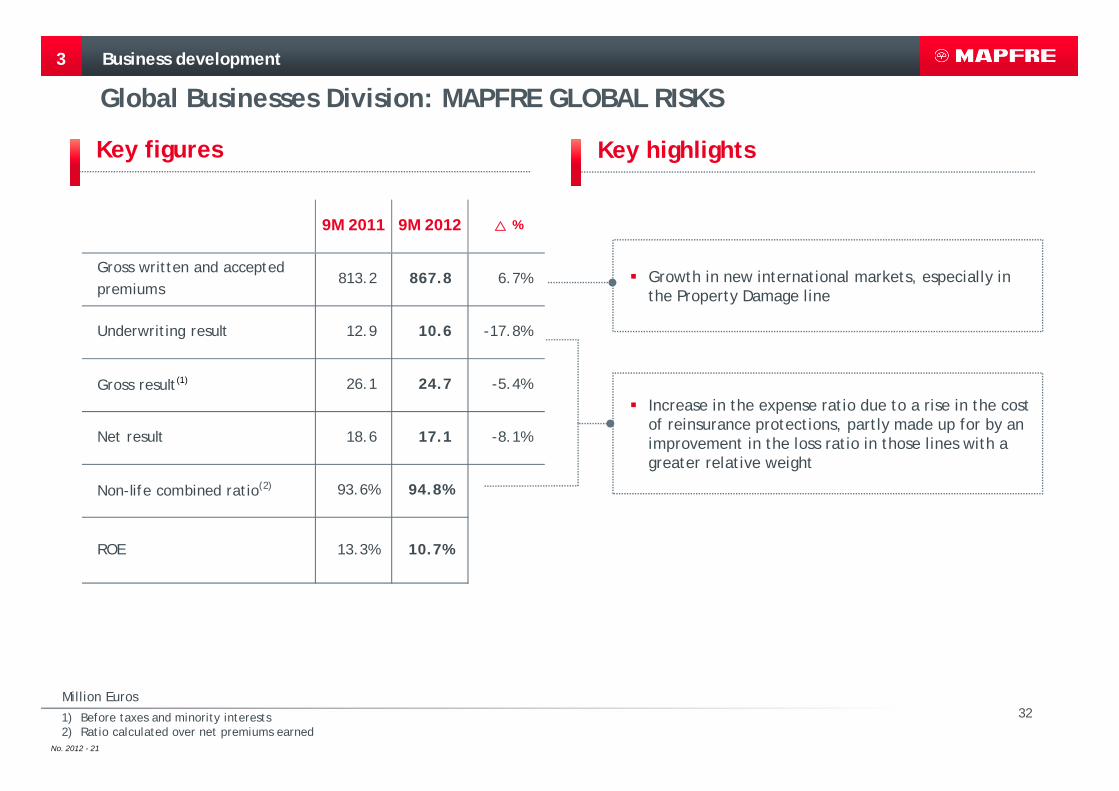
Global Businesses Division: MAPFRE GLOBAL RISKS
Business development
1) Before taxes and minority interests2) Ratio calculated over net premiums earned
Million Euros
Growth in new international markets, especially in the Property Damage line
Increase in the expense ratio due to a rise in the cost of reinsurance protections, partly made up for by an improvement in the loss ratio in those lines with a greater relative weight
9M 2011 9M 2012 %
Gross written and accepted premiums
813.2 867.8 6.7%
Underwriting result 12.9 10.6 -17.8%
Gross result(1) 26.1 24.7 -5.4%
Net result 18.6 17.1 -8.1%
Non-life combined ratio(2) 93.6% 94.8%
ROE 13.3% 10.7%
33
No. 2012 - 21
Key figures Key highlights
3
1) Before taxes and minority interests2) Ratio calculated over net premiums earned
Million Euros
Business development
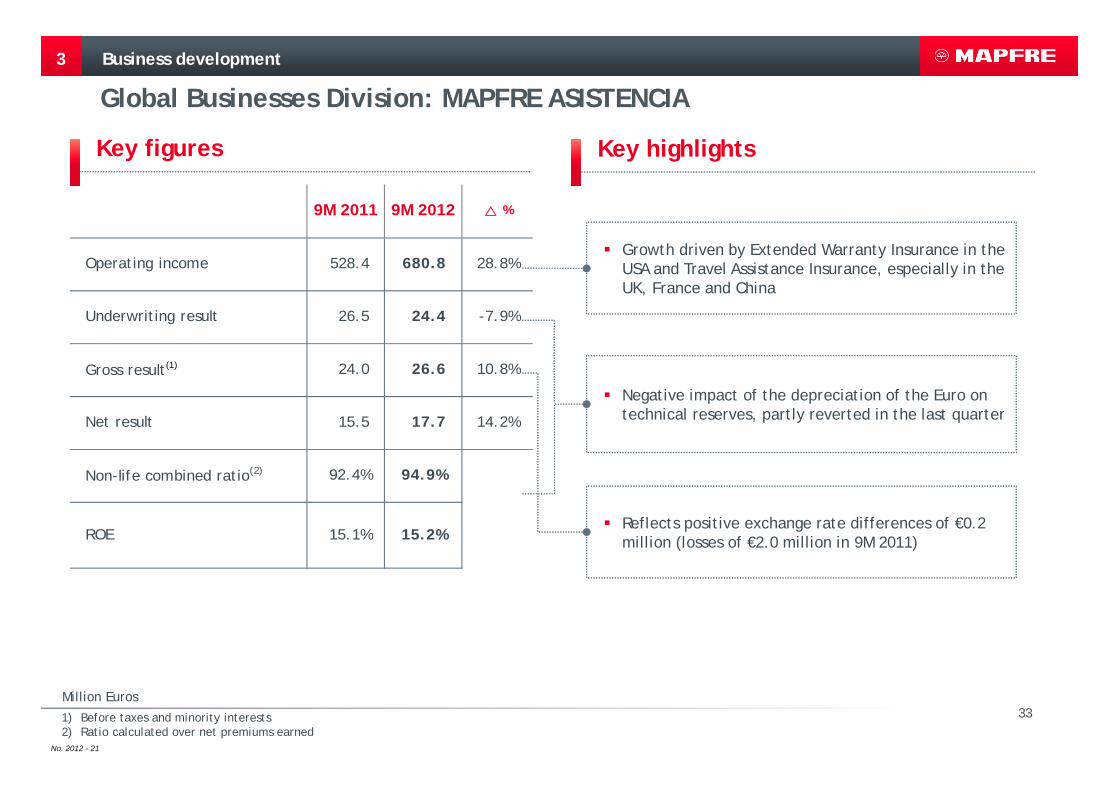
Global Businesses Division: MAPFRE ASISTENCIA
Growth driven by Extended Warranty Insurance in the USA and Travel Assistance Insurance, especially in the UK, France and China
Negative impact of the depreciation of the Euro on technical reserves, partly reverted in the last quarter
Reflects positive exchange rate differences of €0.2 million (losses of €2.0 million in 9M 2011)
9M 2011 9M 2012 %
Operating income 528.4 680.8 28.8%
Underwriting result 26.5 24.4 -7.9%
Gross result(1) 24.0 26.6 10.8%
Net result 15.5 17.7 14.2%
Non-life combined ratio(2) 92.4% 94.9%
ROE 15.1% 15.2%

34
No. 2012 - 21
1 Key highlights
2 Consolidated financial information
3 Business development
4 Appendix
5 Financial supplement
6 Schedule and contacts

35
No. 2012 - 21
Appendix
Consolidated income statement
4
Million Euros
1) Ratios calculated over net premiums earned
9M 2011 9M 2012 %NON-LIFE INSURANCE AND REINSURANCEGross written and accepted premiums 10,846.3 11,906.5 9.8%
Premiums earned, net of ceded and retroceded reinsurance 9,049.5 9,875.4 9.1%
Net claims incurred and variation in other technical provisions -6,286.1 -6,599.3 5.0%
Operating expenses, net of reinsurance -2,438.2 -2,766.9 13.5%
Other technical income and expenses -32.2 -44.4 37.9%
Technical Result 293.0 464.8 58.6%Net fin'l. income and other non-technical income and expenses 583.8 428.2 -26.7%
Result of Non-life business 876.8 893.0 1.8%
LIFE ASSURANCE AND REINSURANCEGross written and accepted premiums 3,813.5 4,665.4 22.3%
Premiums earned, net of ceded and retroceded reinsurance 3,534.4 4,014.1 13.6%
Net claims incurred and variation in other technical provisions -3,389.5 -3,671.8 8.3%
Operating expenses, net of reinsurance -593.9 -821.0 38.2%
Other technical income and expenses 237.0 16.3 -93.1%
Technical Result -212.0 -462.4 118.1%Net fin'l. income and other non-technical income and expenses 693.5 819.7 18.2%
Unrealised gains and losses in Unit-Linked products -5.6 81.6 ---
Result of Life business 475.9 438.9 -7.8%
OTHER BUSINESS ACTIVITIESOperating income 317.1 366.7 15.6%
Operating expenses -292.4 -341.6 16.8%
Other income and expenses -83.8 -96.5 15.2%
Results from other business activities -59.1 -71.4 20.8%
Result on restatement of financial accounts -16.0 -5.4 -66.3%
Result before tax and minority interests 1,277.6 1,255.1 -1.8%Taxes -328.1 -371.3 13.2%
Result after tax 949.5 883.8 -6.9%Result after tax from discontinued operations -0.2 0.0 ---
Result for the year 949.3 883.8 -6.9%Result attributable to minority shareholders -183.7 -227.9 24.1%
Result attributable to the controlling Company 765.6 655.9 -14.3%
Non-life loss ratio(1) 69.5% 66.8%
Non-life expense ratio(1) 27.2% 28.5%
Non-life combined ratio(1) 96.7% 95.3%
36
No. 2012 - 21
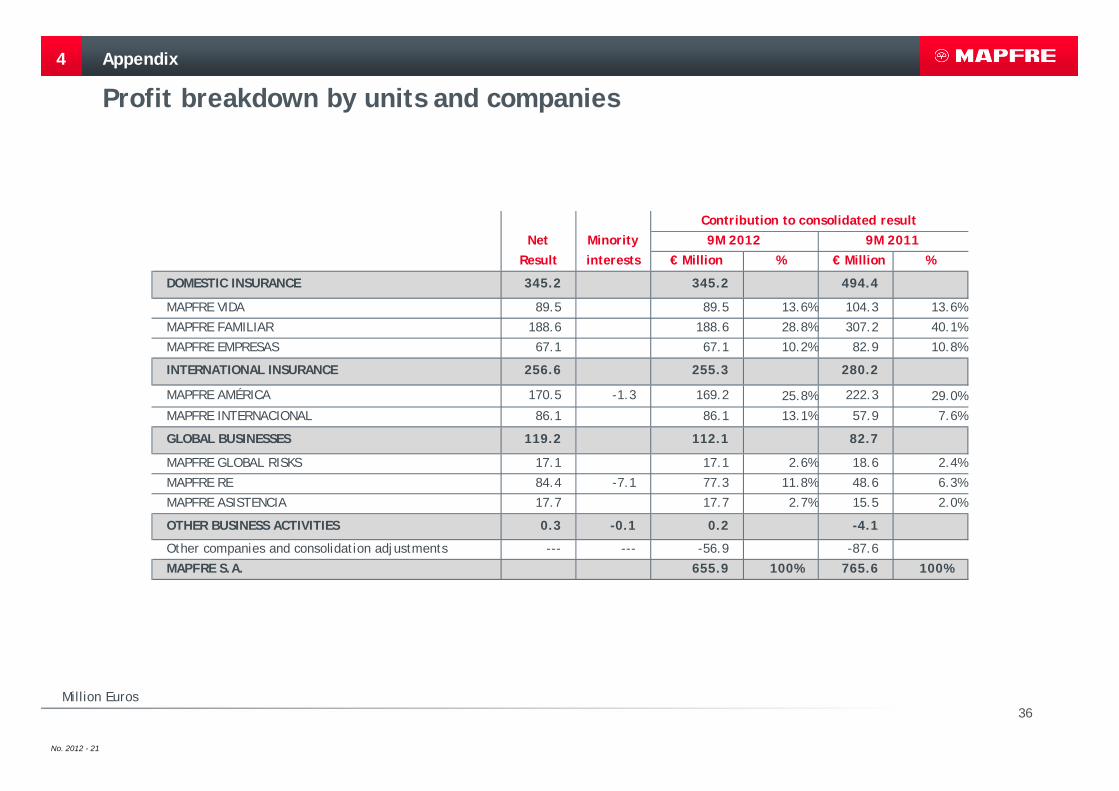
Profit breakdown by units and companies
4 Appendix
Million Euros
Net MinorityResult interests € Million % € Million %
DOMESTIC INSURANCE 345.2 345.2 494.4
MAPFRE VIDA 89.5 89.5 13.6% 104.3 13.6%
MAPFRE FAMILIAR 188.6 188.6 28.8% 307.2 40.1%
MAPFRE EMPRESAS 67.1 67.1 10.2% 82.9 10.8%
INTERNATIONAL INSURANCE 256.6 255.3 280.2
MAPFRE AMÉRICA 170.5 -1.3 169.2 25.8% 222.3 29.0%
MAPFRE INTERNACIONAL 86.1 86.1 13.1% 57.9 7.6%
GLOBAL BUSINESSES 119.2 112.1 82.7
MAPFRE GLOBAL RISKS 17.1 17.1 2.6% 18.6 2.4%
MAPFRE RE 84.4 -7.1 77.3 11.8% 48.6 6.3%
MAPFRE ASISTENCIA 17.7 17.7 2.7% 15.5 2.0%
OTHER BUSINESS ACTIVITIES 0.3 -0.1 0.2 -4.1
Other companies and consolidation adjustments --- --- -56.9 -87.6
MAPFRE S.A. 655.9 100% 765.6 100%
Contribution to consolidated result9M 2012 9M 2011

37
No. 2012 - 21
4
Breakdown of recurring results by units and companies
Million Euros
Appendix
9M 2011 9M 2012 % 9M 2011 9M 2012 % 9M 2011 9M 2012 %
DOMESTIC INSURANCE 494.4 345.2 -30.2% 23.5 -74.6 --- 470.9 419.8 -10.9%
MAPFRE VIDA 104.3 89.5 -14.2% -0.3 -16.9 --- 104.6 106.4 1.7%
MAPFRE FAMILIAR 307.2 188.6 -38.6% 16.7 -43.8 --- 290.5 232.4 -20.0%
MAPFRE EMPRESAS 82.9 67.1 -19.1% 7.1 -13.9 --- 75.8 81.0 6.9%
INTERNATIONAL INSURANCE 280.2 255.3 -8.9% 164.8 8.8 -94.7% 115.4 246.5 113.6%
MAPFRE AMÉRICA 222.3 169.2 -23.9% 122.1 12.7 -89.6% 100.2 156.5 56.2%
MAPFRE INTERNACIONAL 57.9 86.1 48.7% 42.7 -3.9 --- 15.2 90.0 ---
GLOBAL BUSINESSES 82.7 112.1 35.6% -95.2 -27.7 -70.9% 177.9 139.8 -21.4%
MAPFRE GLOBAL RISKS 18.6 17.1 -8.1% -0.6 -5.2 --- 19.2 22.3 16.1%
MAPFRE RE 48.6 77.3 59.1% -94.6 -22.4 -76.3% 143.2 99.7 -30.4%
MAPFRE ASISTENCIA 15.5 17.7 14.2% -0.1 --- 15.5 17.8 14.8%
OTHER BUSINESS ACTIVITIES -4.1 0.2 --- --- -4.1 0.2 ---
Other companies and consolidation adjustments -87.6 -56.9 -35.0% -3.8 11.5 --- -83.8 -68.4 -18.4%
MAPFRE S.A. 765.6 655.9 -14.3% 89.3 -82.0 --- 676.3 737.9 9.1%
Recurring attributableconsolidated result resultNon-recurring results
Contribution to

38
No. 2012 - 21
Expense and loss ratios
4
1) (Operating expenses, net of reinsurance + profit sharing and returns – other technical income + other technical expenses) / Net premiums earned. Figures for the Non-life business.2) (Net claims incurred in the year + variation of other technical reserves) / Net premiums earned. Figures for the Non-life business.3) Combined ratio = Expense ratio + Loss ratio. Figures for the Non-life business.4) Net operating expenses / average third party funds under management. Annualised figures.
Appendix
Million Euros
9M 2011 9M 2012 9M 2011 9M 2012 9M 2011 9M 2012
MAPFRE S.A. consolidated 27.2% 28.5% 69.5% 66.8% 96.7% 95.3%
DOMESTIC INSURANCE 19.7% 20.2% 69.2% 69.6% 88.9% 89.8%
MAPFRE FAMILIAR 19.1% 19.8% 70.9% 71.3% 90.0% 91.1%
MAPFRE EMPRESAS 24.2% 22.6% 56.9% 57.6% 81.1% 80.2%
MAPFRE VIDA(4) 1.0% 1.1%
INTERNATIONAL INSURANCE 33.3% 34.4% 69.7% 65.3% 103.0% 99.7%
MAPFRE AMÉRICA 36.3% 37.2% 64.9% 62.9% 101.2% 100.1%
MAPFRE INTERNACIONAL 26.3% 27.2% 80.4% 71.5% 106.7% 98.7%
GLOBAL BUSINESSES 27.7% 29.9% 71.2% 64.5% 98.9% 94.4%
MAPFRE GLOBAL RISKS 25.5% 28.2% 68.1% 66.6% 93.6% 94.8%
MAPFRE RE 28.1% 28.8% 73.2% 65.4% 101.3% 94.2%
MAPFRE ASISTENCIA 27.4% 27.9% 65.0% 67.0% 92.4% 94.9%
RATIOS
Expense ratio(1) Loss ratio(2) Combined ratio(3)
39
No. 2012 - 21
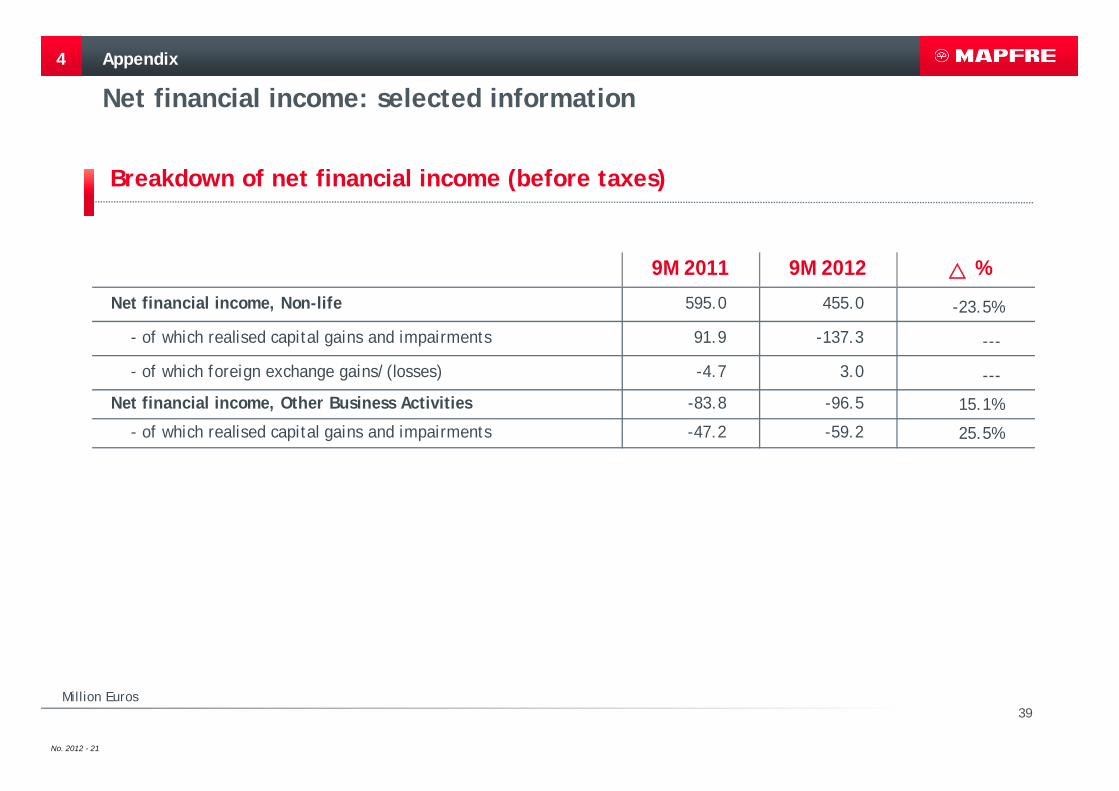
Net financial income: selected information
4 Appendix
Million Euros
Breakdown of net financial income (before taxes)
9M 2011 9M 2012 %
Net financial income, Non-life 595.0 455.0 -23.5%
- of which realised capital gains and impairments 91.9 -137.3 ---
- of which foreign exchange gains/(losses) -4.7 3.0 ---
Net financial income, Other Business Activities -83.8 -96.5 15.1%
- of which realised capital gains and impairments -47.2 -59.2 25.5%

40
No. 2012 - 21
4
Realisation gains, impairments and other negative financial results
Appendix
1) Net of policyholders’ participation
Million Euros
Net financial income: selected information (contd.)
9M 2011 9M 2012 9M 2011 9M 2012 9M 2011 9M 2012 9M 2011 9M 2012
MAPFRE FAMILIAR 26.9 24.8 -36.3 -54.6 26.9 -66.1
MAPFRE VIDA(1) 4.3 25.9 -30.9 -20.2 4.3 -25.2
MAPFRE EMPRESAS 11.8 8.6 -14.5 -14.6 11.8 -20.5
MAPFRE AMÉRICA 0.0 18.3 0.0 0.0 0.0 18.3
MAPFRE GLOBAL RISKS -0.5 0.9 -5.5 -2.8 -0.5 -7.4
MAPFRE RE 6.6 3.4 -30.1 -8.2 6.6 -34.9
MAPFRE ASISTENCIA 0.0 0.0 -0.1 0.0 0.0 -0.1
MAPFRE INTERNACIONAL 47.1 15.9 -22.4 0.0 47.1 -6.5
TOTAL 96.2 97.8 0.0 -139.8 0.0 -100.4 96.2 -142.4
Realisation gainsImpairments from
Bankia and CattolicaOther negative financial results
Impact on pre-tax result
41
No. 2012 - 21
1 Key highlights
2 Consolidated financial information
3 Business development
4 Appendix
5 Financial supplement
6 Schedule and contacts
42
No. 2012 - 21
Financial supplement
Operating companies: Key figures
5
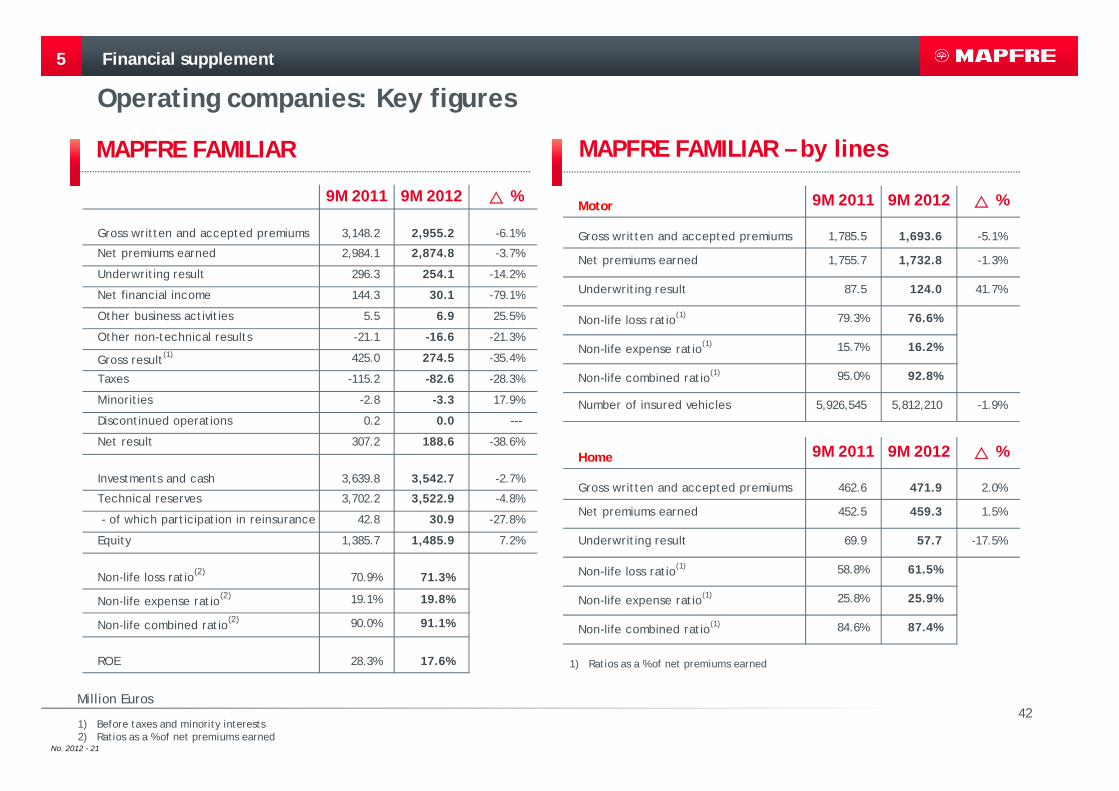
MAPFRE FAMILIAR
1) Before taxes and minority interests2) Ratios as a % of net premiums earned
Million Euros
9M 2011 9M 2012 %
Gross written and accepted premiums 3,148.2 2,955.2 -6.1%
Net premiums earned 2,984.1 2,874.8 -3.7%
Underwriting result 296.3 254.1 -14.2%
Net financial income 144.3 30.1 -79.1%
Other business activities 5.5 6.9 25.5%
Other non-technical results -21.1 -16.6 -21.3%
Gross result(1) 425.0 274.5 -35.4%
Taxes -115.2 -82.6 -28.3%
Minorities -2.8 -3.3 17.9%
Discontinued operations 0.2 0.0 ---
Net result 307.2 188.6 -38.6%
Investments and cash 3,639.8 3,542.7 -2.7%
Technical reserves 3,702.2 3,522.9 -4.8%
- of which participation in reinsurance 42.8 30.9 -27.8%
Equity 1,385.7 1,485.9 7.2%
Non-life loss ratio(2) 70.9% 71.3%
Non-life expense ratio(2) 19.1% 19.8%
Non-life combined ratio(2) 90.0% 91.1%
ROE 28.3% 17.6%
MAPFRE FAMILIAR – by lines
1) Ratios as a % of net premiums earned
Motor 9M 2011 9M 2012 %
Gross written and accepted premiums 1,785.5 1,693.6 -5.1%
Net premiums earned 1,755.7 1,732.8 -1.3%
Underwriting result 87.5 124.0 41.7%
Non-life loss ratio(1) 79.3% 76.6%
Non-life expense ratio(1) 15.7% 16.2%
Non-life combined ratio(1) 95.0% 92.8%
Number of insured vehicles 5,926,545 5,812,210 -1.9%
Home 9M 2011 9M 2012 %
Gross written and accepted premiums 462.6 471.9 2.0%
Net premiums earned 452.5 459.3 1.5%
Underwriting result 69.9 57.7 -17.5%
Non-life loss ratio(1) 58.8% 61.5%
Non-life expense ratio(1) 25.8% 25.9%
Non-life combined ratio(1) 84.6% 87.4%
43
No. 2012 - 21
5 Financial supplement
Operating companies: Key figures
1) Ratios as a % of net premiums earned
Million Euros
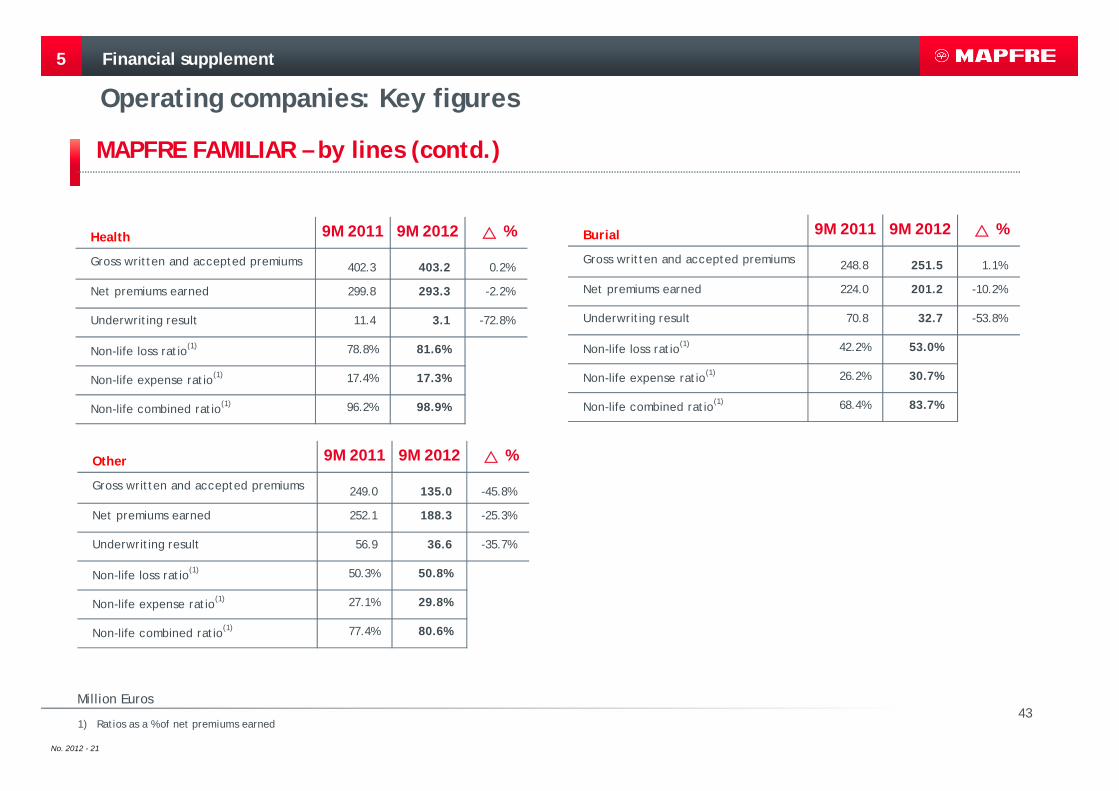
MAPFRE FAMILIAR – by lines (contd.)
Health 9M 2011 9M 2012 %
Gross written and accepted premiums 402.3 403.2 0.2%
Net premiums earned 299.8 293.3 -2.2%
Underwriting result 11.4 3.1 -72.8%
Non-life loss ratio(1) 78.8% 81.6%
Non-life expense ratio(1) 17.4% 17.3%
Non-life combined ratio(1) 96.2% 98.9%
Other 9M 2011 9M 2012 %
Gross written and accepted premiums 249.0 135.0 -45.8%
Net premiums earned 252.1 188.3 -25.3%
Underwriting result 56.9 36.6 -35.7%
Non-life loss ratio(1) 50.3% 50.8%
Non-life expense ratio(1) 27.1% 29.8%
Non-life combined ratio(1) 77.4% 80.6%
Burial 9M 2011 9M 2012 %
Gross written and accepted premiums 248.8 251.5 1.1%
Net premiums earned 224.0 201.2 -10.2%
Underwriting result 70.8 32.7 -53.8%
Non-life loss ratio(1) 42.2% 53.0%
Non-life expense ratio(1) 26.2% 30.7%
Non-life combined ratio(1) 68.4% 83.7%

44
No. 2012 - 21
5 Financial supplement
Operating companies: Key figures
1) Before taxes and minority interests2) Ratios as a % of net premiums earned
Million Euros
MAPFRE EMPRESAS
9M 2011 9M 2012 %
Gross written and accepted premiums 521.6 546.7 4.8%
Net premiums earned 395.6 418.1 5.7%
Underwriting result 74.6 82.7 10.9%
Net financial income 39.1 13.5 -65.5%
Other business activities 0.6 0.0 ---
Other non-technical results 2.3 0.2 -91.3%
Gross result(1) 116.6 96.4 -17.3%
Taxes -33.7 -29.3 -13.1%
Minorities 0.0 0.0 ---
Net result 82.9 67.1 -19.1%
Investments and cash 1,137.4 1,155.9 1.6%
Technical reserves 1,310.8 1,311.7 0.1%
- of which participation in reinsurance 361.0 365.7 1.3%
Shareholders' equity 269.7 296.1 9.8%
Non-life loss ratio(2) 56.9% 57.6%
Non-life expense ratio(2) 24.2% 22.6%
Non-life combined ratio(2) 81.1% 80.2%
ROE 31.8% 26.3%

45
No. 2012 - 21
5 Financial supplement
Operating companies: Key figuresMAPFRE VIDA
Million Euros
1) Before taxes and minority interests2) Net operating expenses / average third-party funds under management. Annualised figures.
1) Includes BANKINTER VIDA, CCM VIDA Y PENSIONES and UNIÓN DUERO VIDA2) Accident insurance premiums written by MAPFRE FAMILIAR in previous years
9M 2011 9M 2012 %Technical Reserves excluding
shadow accounting 18,186.6 18,437.7 1.4%
Shadow accounting adjustments -320.3 -328.6 2.6%
Technical Reserves IFRS 17,866.3 18,109.1 1.4%
Mutual Funds and managed portfolios 2,549.5 2,417.6 -5.2%
Pension Funds 4,963.2 5,018.7 1.1%
Funds under management
IFRS 25,379.0 25,545.4 0.7%
Excluding the effect of "shadow accounting" 25,699.3 25,874.0 0.7%
Gross written and accepted premiums 2,389.3 2,270.1 -5.0%
Net premiums earned 2,306.8 2,167.8 -6.0%
Underwriting and financial result 172.9 151.5 -12.4%
Other business activities 46.1 41.4 -10.2%
Other non technical results 0.0 0.0 ---
Gross result(1) 219.0 192.9 -11.9%
Taxes -64.4 -56.2 -12.7%
Minorities -50.3 -47.2 -6.2%
Net result 104.3 89.5 -14.2%
Investments and cash 18,548.1 18,708.5 0.9%
Shareholders' equity 1,060.6 1,148.0 8.2%
Expense Ratio(2) 1.01% 1.10%
ROE 14.1% 10.7%
Breakdown of premiums 9M 2011 9M 2012 %Regular Premiums 467.5 337.8 -27.7%
- Agents' and other channels 215.0 198.3 -7.8%
- Bank channel - MAPFRE-CM VIDA 20.9 15.1 -27.8%
- Bank channel - CATALUNYACAIXA 129.4 50.4 -61.1%
- Bank channel - Other(1) 102.2 74.0 -27.6%
Single Premiums 1,581.5 1,560.1 -1.4%
- Agents' and other channels 607.2 890.0 46.6%
- Bank channel - MAPFRE-CM VIDA 383.7 269.5 -29.8%
- Bank channel - CATALUNYACAIXA 509.2 193.3 -62.0%
- Bank channel - Other(1) 81.4 207.3 154.7%
Life premiums - Savings 2,049.0 1,897.9 -7.4%
Life Premiums - Protection 340.3 322.7 -5.2%
- Agents' and other channels 120.0 113.9 -5.1%
- Bank channel - MAPFRE-CM VIDA 97.1 84.6 -12.9%
- Bank channel - CATALUNYACAIXA 43.1 42.8 -0.7%
- Bank channel - Other(1) 80.1 81.4 1.6%
Accident Premiums(2) --- 49.5 --
TOTAL PREMIUMS 2,389.3 2,270.1 -5.0%
- Agents' and other channels 942.2 1,251.7 32.8%
- Bank channel 1,447.1 1,018.4 -29.6%

46
No. 2012 - 21
5 Financial supplement
Operating companies: Key figures
Million Euros
1) Includes BANKINTER VIDA, CCM VIDA Y PENSIONES, UNIÓN DUERO VIDA and DUERO PENSIONES
1) Cumulative variation versus prior year end. Excludes the variation in shareholders’ equity over the same period.
2) Includes the effect of “shadow accounting” which adjusts technical reserves for variations in the market value of matching assets
3) Includes BANKINTER VIDA, CCM VIDA Y PENSIONES, UNIÓN DUERO VIDA and DUERO PENSIONES
MAPFRE VIDA
Funds under management 9M 2011 9M 2012 %Regular premiums insurance 4,634.4 4,528.2 -2.3% - Agents' channel and others 3,170.6 3,132.0 -1.2%
- Bank channel - MAPFRE-CM VIDA 273.0 250.4 -8.3%
- Bank channel - CATALUNYACAIXA 658.4 571.7 -13.2%
- Bank channel - Other(1) 532.4 574.1 7.8%
Single premiums insurance 12,543.4 12,820.0 2.2% - Agents' channel and others 5,736.7 6,321.5 10.2%
- Bank channel - MAPFRE-CM VIDA 4,234.6 4,130.8 -2.5%
- Bank channel - CATALUNYACAIXA 1,461.6 1,252.1 -14.3%
- Bank channel - Other(1) 1,110.5 1,115.6 0.5%
Life-Protection insurance 156.5 154.9 -1.0% - Agents' channel and others 59.2 58.3 -1.5%
- Bank channel - MAPFRE-CM VIDA 66.3 68.5 3.3%
- Bank channel - CATALUNYACAIXA 20.6 17.9 -13.1%
- Bank channel - Other(1) 10.4 10.2 -1.9%
Total mathematical reserves 17,334.3 17,503.1 1.0%Other reserves 532.0 606.0 13.9%
TOTAL TECHNICAL RESERVES 17,866.3 18,109.1 1.4%
Mutual funds and managed portfolios 2,549.5 2,417.6 -5.2%
Pension funds 4,963.2 5,018.7 1.1%
> MAPFRE INVERSIÓN 1,513.6 1,533.0 1.3%
- Individual system 1,274.9 1,262.2 -1.0%
- Employers' system 238.7 270.8 13.4%
> CATALUNYACAIXA 1,392.1 1,313.8 -5.6%
> Other(1) 2,057.5 2,171.9 5.6%
TOTAL MANAGED SAVINGS 25,379.0 25,545.4 0.7%
Change in funds under management(1) 9M 2011 9M 2012
IFRS technical reserves(2) 49.4 298.3
Variation w/o the effect of "shadow accounting" 180.9 260.2
- Agents' channel and others 258.4 489.0
- Bank channel - MAPFRE-CM VIDA 136.9 -23.4
- Bank channel - CATALUNYACAIXA -259.4 -214.8
- Bank channel - Other(3) 45.0 9.4
Pension funds -229.9 -62.7
Net sales -126.5 -210.8
- Agents' channel and others -58.0 -49.6
- Bank channel -68.5 -161.2
Mutual funds and managed portfolios -56.3 -230.8
Net sales - Mutual funds -190.4 -127.1
TOTAL CHANGE -236.8 4.8

47
No. 2012 - 21
5 Financial supplement
Operating companies: Key figures
MAPFRE AMÉRICA MAPFRE AMÉRICA – by lines
1) Before taxes and minority interests2) Ratios as a % of net premiums earned
Million Euros
1) Ratios as a % of net premiums earned
9M 2011 9M 2012 %
Gross written and accepted premiums 4,907.4 6,604.3 34.5%
Net premiums earned 3,727.3 4,860.2 30.4%
Underwriting and financial result 458.8 486.0 5.9%
Other business activities 0.4 14.5 ---
Other non-technical results -2.7 -3.9 44.4%
Result on restatement -16.0 -5.4 -66.3%
Gross result(1) 440.5 491.2 11.5%
Taxes -92.1 -159.5 73.2%
Minorities -98.2 -161.2 64.2%
Net result 250.2 170.5 -31.9%
Investments and cash 6,077.2 6,970.0 14.7%
Technical reserves 6,344.8 7,426.7 17.1%
- of which participation in reinsurance 1,291.5 1,633.5 26.5%
Shareholders' equity 2,037.4 2,329.1 14.3%
Non-life loss ratio(2) 64.9% 62.9%
Non-life expense ratio(2) 36.3% 37.2%
Non-life combined ratio(2) 101.2% 100.1%
ROE 19.2% 10.3%
Non-Life 9M 2011 9M 2012 %
Gross written and accepted premiums 3,831.7 4,672.7 21.9%
Net premiums earned 2,782.1 3,366.5 21.0%
Underwriting result -35.1 -4.9 -86.0%
Non-life loss ratio(1) 64.9% 62.9%
Non-life expense ratio(1) 36.3% 37.2%
Non-life combined ratio(1) 101.2% 100.1%
Life 9M 2011 9M 2012 %
Gross written and accepted premiums 1,075.7 1,931.6 79.6%
Net premiums earned 945.2 1,493.7 58.0%
Underwriting and financial result 268.4 264.0 -1.6%
48
No. 2012 - 21
5 Financial supplement
Operating companies: Key figures
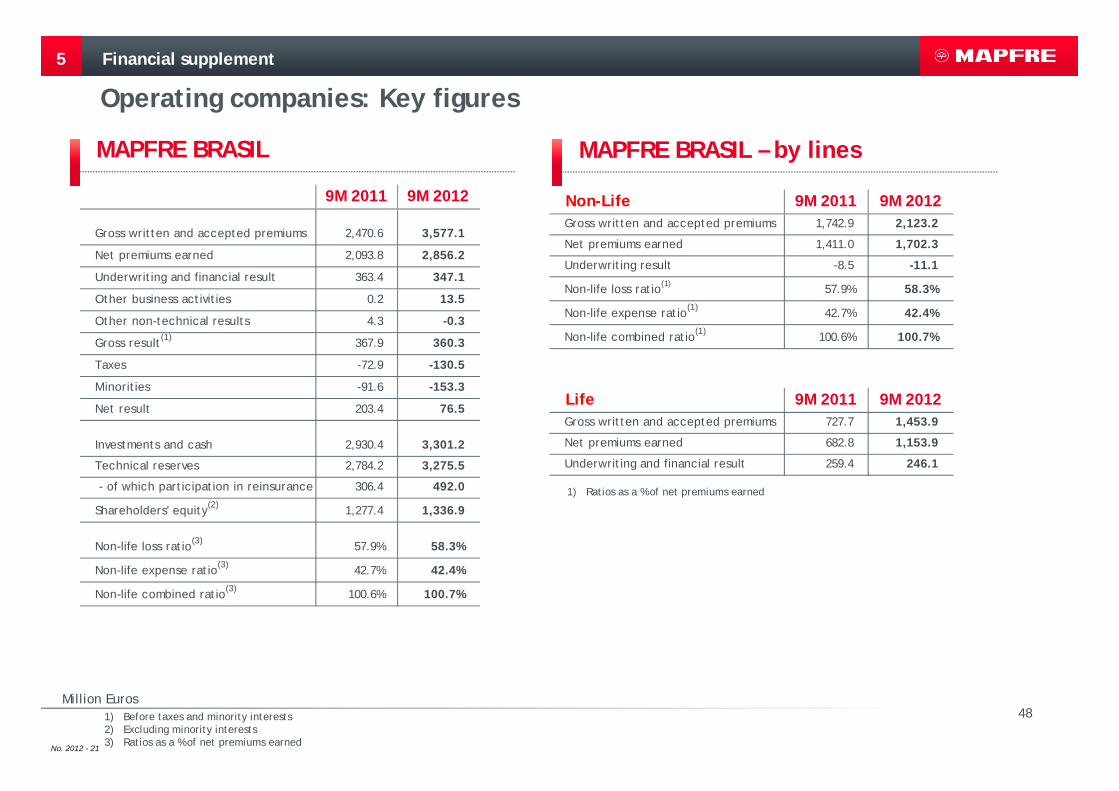
MAPFRE BRASIL MAPFRE BRASIL – by lines
1) Before taxes and minority interests2) Excluding minority interests3) Ratios as a % of net premiums earned
Million Euros
1) Ratios as a % of net premiums earned
9M 2011 9M 2012
Gross written and accepted premiums 2,470.6 3,577.1
Net premiums earned 2,093.8 2,856.2
Underwriting and financial result 363.4 347.1
Other business activities 0.2 13.5
Other non-technical results 4.3 -0.3
Gross result(1) 367.9 360.3
Taxes -72.9 -130.5
Minorities -91.6 -153.3
Net result 203.4 76.5
Investments and cash 2,930.4 3,301.2
Technical reserves 2,784.2 3,275.5
- of which participation in reinsurance 306.4 492.0
Shareholders' equity(2) 1,277.4 1,336.9
Non-life loss ratio(3) 57.9% 58.3%
Non-life expense ratio(3) 42.7% 42.4%
Non-life combined ratio(3) 100.6% 100.7%
Non-Life 9M 2011 9M 2012Gross written and accepted premiums 1,742.9 2,123.2
Net premiums earned 1,411.0 1,702.3
Underwriting result -8.5 -11.1
Non-life loss ratio(1) 57.9% 58.3%
Non-life expense ratio(1) 42.7% 42.4%
Non-life combined ratio(1) 100.6% 100.7%
Life 9M 2011 9M 2012Gross written and accepted premiums 727.7 1,453.9
Net premiums earned 682.8 1,153.9
Underwriting and financial result 259.4 246.1

49
No. 2012 - 21
5 Financial supplement
Operating companies: Key figures
MAPFRE INTERNACIONAL MAPFRE INTERNACIONAL – by lines
1) Before taxes and minority interests2) Ratios as a % of net premiums earned
Million Euros
1) Ratios as a % of net premiums earned
9M 2011 9M 2012 %
Gross written and accepted premiums 1,437.6 1,665.7 15.9%
Net premiums earned 1,235.9 1,425.0 15.3%
Underwriting result -63.9 -47.2 -26.1%
Net financial income 133.4 187.8 40.8%
Other business activities -1.6 -22.4 ---
Other non-technical results -1.8 -0.8 -55.6%
Gross result(1) 66.1 117.4 77.6%
Taxes -7.7 -24.4 216.9%
Minorities -0.2 -6.9 ---
Net result 58.2 86.1 47.9%
Investments and cash 3,798.5 4,105.2 8.1%
Technical reserves 3,014.7 3,176.5 5.4%
- of which participation in reinsurance 188.4 262.0 39.1%
Shareholders' equity 2,222.0 2,414.4 8.7%
Non-life loss ratio(2) 80.4% 71.5%
Non-life expense ratio(2) 26.3% 27.2%
Non-life combined ratio(2) 106.7% 98.7%
ROE 3.1% 4.9%
Non-Life 9M 2011 9M 2012 %
Gross written and accepted premiums 1,383.9 1,573.1 13.7%
Net premiums earned 1,184.8 1,336.6 12.8%
Underwriting result -79.5 16.9 ---
Non-life loss ratio(1) 80.4% 71.5%
Non-life expense ratio(1) 26.3% 27.2%
Non-life combined ratio(1) 106.7% 98.7%
Life 9M 2011 9M 2012 %
Gross written and accepted premiums 53.7 92.6 72.4%
Net premiums earned 51.2 88.4 72.7%
Underwriting and financial result 1.8 14.0 ---

50
No. 2012 - 21
5 Financial supplement
Operating companies: Key figures
MAPFRE USA MAPFRE GLOBAL RISKS
1) Before taxes and minority interests2) Ratios as a % of net premiums earned
Million Euros
9M 2011 9M 2012 %
Gross written and accepted premiums 1,071.7 1,172.4 9.4%
Net premiums earned 961.6 1,055.2 9.7%
Underwriting result -78.2 15.3 ---
Net financial income 111.8 94.4 -15.6%
Other business activities 0.0 0.0 ---
Other non-technical results 0.3 -1.8 ---
Gross result(1) 33.9 107.9 218.3%
Taxes -2.2 -23.3 ---
Minorities -0.1 -0.5 400.0%
Net result 31.6 84.1 166.1%
Investments and cash 1,891.7 2,067.0 9.3%
Technical reserves 1,353.4 1,381.4 2.1%
- of which participation in reinsurance 73.6 129.0 75.3%
Shareholders' equity 1,063.7 1,194.6 12.3%
Non-life loss ratio(2) 81.9% 71.6%
Non-life expense ratio(2) 26.2% 26.9%
Non-life combined ratio(2) 108.1% 98.5%
ROE 5.8% 9.9%
9M 2011 9M 2012 %
Gross written and accepted premiums 813.2 867.8 6.7%
- Global Risks 743.4 791.0 6.4%
- Credit and Surety business 69.8 76.8 10.0%
Net premiums earned 203.1 205.3 1.1%
Underwriting result 12.9 10.6 -17.8%
Net financial income 11.1 13.9 25.2%
Other business activities -0.7 -1.0 42.9%
Other non-technical results 2.8 1.2 -57.1%
Gross result(1) 26.1 24.7 -5.4%
Taxes -7.5 -7.5 0.0%
Minorities 0.0 -0.1 ---
Net result 18.6 17.1 -8.1%
Investments and cash 616.4 698.3 13.3%
Technical reserves 2,037.8 2,006.6 -1.5%
- of which participation in reinsurance 1,578.0 1,521.2 -3.6%
Shareholders' equity 212.6 266.4 25.3%
Non-life loss ratio(2) 68.1% 66.6%
Non-life expense ratio(2) 25.5% 28.2%
Non-life combined ratio(2) 93.6% 94.8%
ROE 13.3% 10.7%
51
No. 2012 - 21
5
MAPFRE RE MAPFRE RE – by lines
Financial supplement
Operating companies: Key figures
1) Before taxes and minority interests2) Ratios as a % of net premiums earned
Million Euros
1) Ratios as a % of net premiums earned
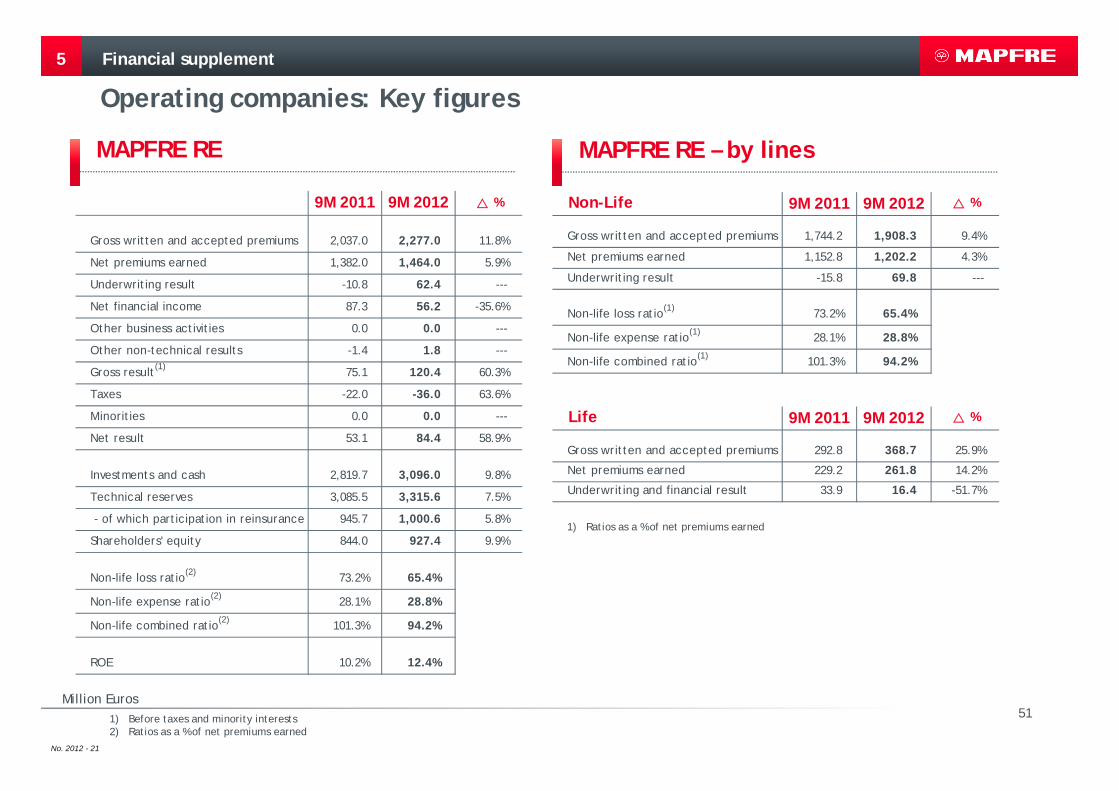
9M 2011 9M 2012 %
Gross written and accepted premiums 2,037.0 2,277.0 11.8%
Net premiums earned 1,382.0 1,464.0 5.9%
Underwriting result -10.8 62.4 ---
Net financial income 87.3 56.2 -35.6%
Other business activities 0.0 0.0 ---
Other non-technical results -1.4 1.8 ---
Gross result(1) 75.1 120.4 60.3%
Taxes -22.0 -36.0 63.6%
Minorities 0.0 0.0 ---
Net result 53.1 84.4 58.9%
Investments and cash 2,819.7 3,096.0 9.8%
Technical reserves 3,085.5 3,315.6 7.5%
- of which participation in reinsurance 945.7 1,000.6 5.8%
Shareholders' equity 844.0 927.4 9.9%
Non-life loss ratio(2) 73.2% 65.4%
Non-life expense ratio(2) 28.1% 28.8%
Non-life combined ratio(2) 101.3% 94.2%
ROE 10.2% 12.4%
Non-Life 9M 2011 9M 2012 %
Gross written and accepted premiums 1,744.2 1,908.3 9.4%
Net premiums earned 1,152.8 1,202.2 4.3%
Underwriting result -15.8 69.8 ---
Non-life loss ratio(1) 73.2% 65.4%
Non-life expense ratio(1) 28.1% 28.8%
Non-life combined ratio(1) 101.3% 94.2%
Life 9M 2011 9M 2012 %
Gross written and accepted premiums 292.8 368.7 25.9%
Net premiums earned 229.2 261.8 14.2%
Underwriting and financial result 33.9 16.4 -51.7%

52
No. 2012 - 21
5
MAPFRE ASISTENCIA
Financial supplement
Operating companies: Key figures
1) Before taxes and minority interests2) Ratios as a % of net premiums earned
Million Euros
9M 2011 9M 2012 %
Operating income 528.4 680.8 28.8%
- Gross written and accepted premiums 416.6 553.7 32.9%
- Other income 111.8 127.1 13.7%
Net premiums earned 349.1 474.3 35.9%
Underwriting result 26.5 24.4 -7.9%
Net financial income -1.6 2.9 ---
Other business activities -0.8 -0.6 -25.0%
Other non-technical results -0.1 -0.1 ---
Gross result(1) 24.0 26.6 10.8%
Taxes -7.1 -8.1 14.1%
Minorities -1.0 -0.8 -20.0%
Net result 15.5 17.7 14.2%
Investments and cash 123.7 150.8 21.9%
Technical reserves 278.0 366.7 31.9%
- of which participation in reinsurance 2.9 11.3 289.7%
Shareholders' equity 162.1 205.0 26.5%
Non-life loss ratio(2) 65.0% 67.0%
Non-life expense ratio(2) 27.4% 27.9%
Non-life combined ratio(2) 92.4% 94.9%
ROE 15.1% 15.2%
53
No. 2012 - 21
1 Key highlights
2 Consolidated financial information
3 Business development
4 Appendix
5 Financial supplement
6 Schedule and contacts

54
No. 2012 - 21
Schedule and contacts
2012 Provisional Schedule
6
26-Oct-12 Madrid Release 2012 Third Quarter Results
Conference Call – 2012 Third Quarter Results
30-Oct-12 London Presentation to analysts – 2012 Third Quarter Results
55
No. 2012 - 21
Investor Relations Department
6
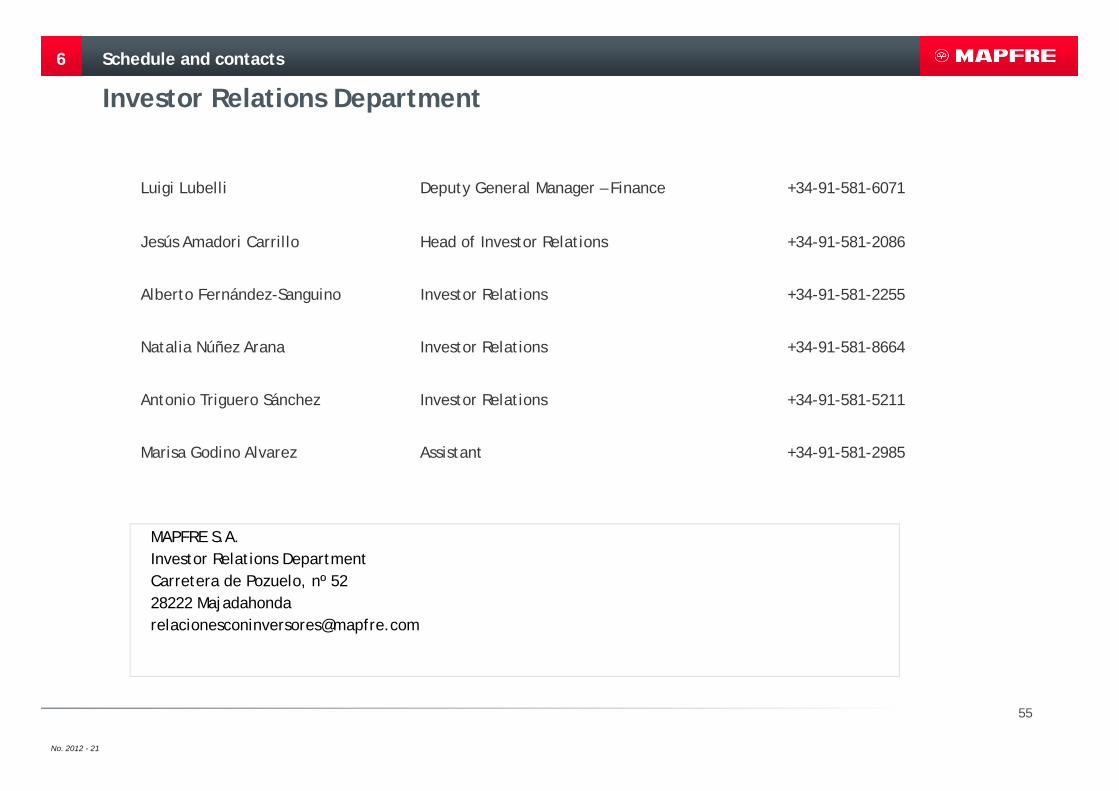
Luigi Lubelli Deputy General Manager – Finance +34-91-581-6071
Jesús Amadori Carrillo Head of Investor Relations +34-91-581-2086
Alberto Fernández-Sanguino Investor Relations +34-91-581-2255
Natalia Núñez Arana Investor Relations +34-91-581-8664
Antonio Triguero Sánchez Investor Relations +34-91-581-5211
Marisa Godino Alvarez Assistant +34-91-581-2985
MAPFRE S.A.Investor Relations DepartmentCarretera de Pozuelo, nº 5228222 [email protected]
Schedule and contacts

56
No. 2012 - 21
Disclaimer
This document is purely informative. Its content does not constitute, nor can it be interpreted as, an offer or an invitationto sell, exchange or buy, and it is not binding on the issuer in any way. The information about the plans of the Company, itsevolution, its results and its dividends represents a simple forecast whose formulation does not represent a guarantee with respect to the future performance of the Company or the achievement of its targets or estimated results. The recipients of this information must be aware that the preparation of these forecasts is based on assumptions and estimates, which are subject to a high degree of uncertainty, and that, due to multiple factors, future results may differ materially from expected results. Among such factors, the following are worth highlighting: the development of the insurance market and the general economic situation of those countries where the Group operates; circumstances which may affect the competitiveness of insurance products and services; changes in the basis of calculation of mortality and morbidity tables which may affect the insurance activities of the Life and Health segments; frequency and severity of claims covered; effectiveness of the Groups reinsurance policies and fluctuations in the cost and availability of covers offered by third party reinsurers; changes in the legal environment; adverse legal actions; changes in monetary policy; variations in interest ratesand exchange rates; fluctuations in liquidity and the value and profitability of assets which make up the investment portfolio; restrictions in the access to third party financing.
MAPFRE S.A. does not undertake to update or revise periodically the content of this document.