Embed Size (px)
Citation preview

Developing the future.
PresentationFacts & Figures
May 2014

Developing the future.
Presentation ThyssenKruppMay 2014
1
Agenda
Presentation slides 2-12
• Key Figures, Strategic Way Forward and Group Outlook
• Group Performance, Financials and Conclusion
Facts & Figures slides 16-67

Developing the future.
Presentation ThyssenKruppMay 2014
2
H1 2013/14: Progress in De-Risking Supporting Group Transformation
Bond placement and new syn loan adding to solid financial situation
Significantly reduced losses/cash drain at Steel Americas by sale of Steel USA, slab supply contract & operational improvements CSA (EBITDA adj. ~breakeven in 13/14)
Termination of Outokumpu exposure through asset swap and sale of 29.9% stake
Settlement of Deutsche Bahn damage claims
Strengthening of equity and further deleveraging through capital increase
Exit from virtually all postretirement healthcare obligations

Developing the future.
Presentation ThyssenKruppMay 2014
3
Financial Highlights Q2 and Outlook FY
Order Intake
€10.2 bn
EBIT adjusted
€309 m
• Capital Goods: H1 yoy up by 4%; Q2 yoy broadly stable• Materials: H1 yoy up by 3%; Q2 yoy and qoq up
Net Income*
€269 m
NFD
€3.96 bn
Sales & EBIT adj.
Outlook revised
upwards
• H1 yoy up by 87%; Q2 yoy 60% up and qoq 26% up• Positive contribution from 5 BAs; Steel Americas EBITDA adj. ~breakeven
~€290 m• >50% of cost savings targeted in FY achieved in H1
• Return to positive quarterly Net Income • H1 with €204 m well on track to achieve FY target
• NFD yoy down by >€1.3 bn and qoq down by ~€0.5 bn
• Sales: up by mid to higher single-digit % (adj. for F/X and portfolio changes)
• EBIT adj.: almost doubling vs. prior year (€586 m) (incl. AST & VDM)
* Full Group; attributable to ThyssenKrupp AG‘s stockholders

Developing the future.
Presentation ThyssenKruppMay 2014
4
Sales* Growing at Mid to Higher 1-Digit % Rate and EBIT Almost Doubling
ElevatorTechnology,Industrial Solutions
ComponentsTechnology
SteelAmericas
2013/14E
€586 m
Growth / Markets
EBIT adj. by BA
EBIT adj. by driver
2012/13
Materials Services*,
Steel Europe
incl. €(495) mof Steel Americas
€586 m
Q1: €246 m
Q2: €309 m
Q1: €246 m
Q2: €309 m
Low 3-digit m€ negative now including:• DB settlement payment• AST & VDM
- NWC requirements - Capex requirements(Group Capex: max €1.4 bn)
• NWC increase Steel USA (compensation payment in CF from divestments)
• Higher sales growth
* incl. AST & VDMwith lower 2-digit €m
negative
EBITDA adj. ~breakeven
Almost doubling vs. prior year
FCFbefore divest
* adjusted for F/X and portfolio changes

Developing the future.
Presentation ThyssenKruppMay 2014
5
Agenda
Presentation slides 2-12
• Key Figures, Strategic Way Forward and Group Outlook
• Group Performance, Financials and Conclusion
Facts & Figures slides 16-67

Developing the future.
Presentation ThyssenKruppMay 2014
6
3.586 3.834
14.641 15.082
4.631 5.744
2.684 3.012
3.249 3.382
3.597 3,483
5.753 6.256
5.023 4.704
1.069 1.183
20,891
Improving Group Orders YTD
20,176
Group cont. ops.
Order intake – continuing operations (million €)
• CT: stronger auto markets and recovery of wind energy• ET: growth mainly from China (NI) and the US• IS: relatively stable on high level
H1 2012/13 H1 2013/14
IndustrialSolutions
ElevatorTechn.
Comp Techn.
MaterialsServices
SteelEurope
24,66022,858
Group cont. ops.
Order backlog – continuing operations (million €)
Sep 30, 2013 Mar 31, 2014
+8%ytd
IndustrialSolutions
ElevatorTechn.
Rest of Group
SteelAmericas
+4%yoy
+6%*
* adjusted for F/X and portfolio changes
• ET: order book supported by record orders in H1• IS: high order backlog driven by big ticket at Marine,
fertilizer & cement projects

Developing the future.
Presentation ThyssenKruppMay 2014
7
10,671 10,220
Volume Improvements Drive Order Intake at Components and Materials
10,113
Group cont. ops.
Order intake – continuing operations (million €)
1.360 1.439 1.573
1.633 1.801 1.581
1.595 2,295** 1.188
2.988 2.8423.414
2.6202.274
2.430
509609
574
• CT: yoy recovery of European auto
• ET: yoy currency; qoq mainly seasonality effects
• IS: qoq big ticket effect
• MX: yoy and qoq higher volumes
• SE: yoy mainly divestment related lower; qoq seasonally higher volumes
• AM: yoy positive price; qoqslightly lower volumes
Q22013/14
Q22012/13
Q12013/14
IndustrialSolutions
SteelAmericas
ElevatorTechn.
Comp Techn.
MaterialsServices
SteelEurope
+1%yoy
+2%*
* adjusted for F/X and portfolio changes
-4%qoq
** big ticket order

Developing the future.
Presentation ThyssenKruppMay 2014
8
2012/13Q1
SteelEurope
MaterialsServices
ElevatorTechn.
Comp.Techn.
EBIT adjusted (million €); EBIT adjusted margin (%)
11.0 11.3
11.912.5
1.22.0
Corp./Cons.
5.34.4
SteelAmericas(excl. D&A for TK Steel USA)
2.40.9
Industrial Solutions
6380
175172
199156
Q2
3462
1962
1.4
3.0
Group 309136
Corp.
Cons.
2013/14Q3E
(26)
(193)
(93)
(110)
(203) (220)
4.6
62
4.8
75
Q3 Q2
10.5
146
11.0
163
13.4
173
12.6
180
2.0
193
2.7
246
2.0
58
1.7
56
2012/13Q1 Q2
2013/14Q3E Q3 Q2
2.6
0.4
9 62
(44) (17)
(120)
(98)
(218)
(103)
(98)
(201)
Earnings Improvement to Continue into H2
(119)
(101)
yoybroadly stable
yoyup
yoyup
qoqslightly
up
qoqstable
qoqup
qoqstable
qoqstable
Developing the future.
Presentation ThyssenKruppMay 2014
9
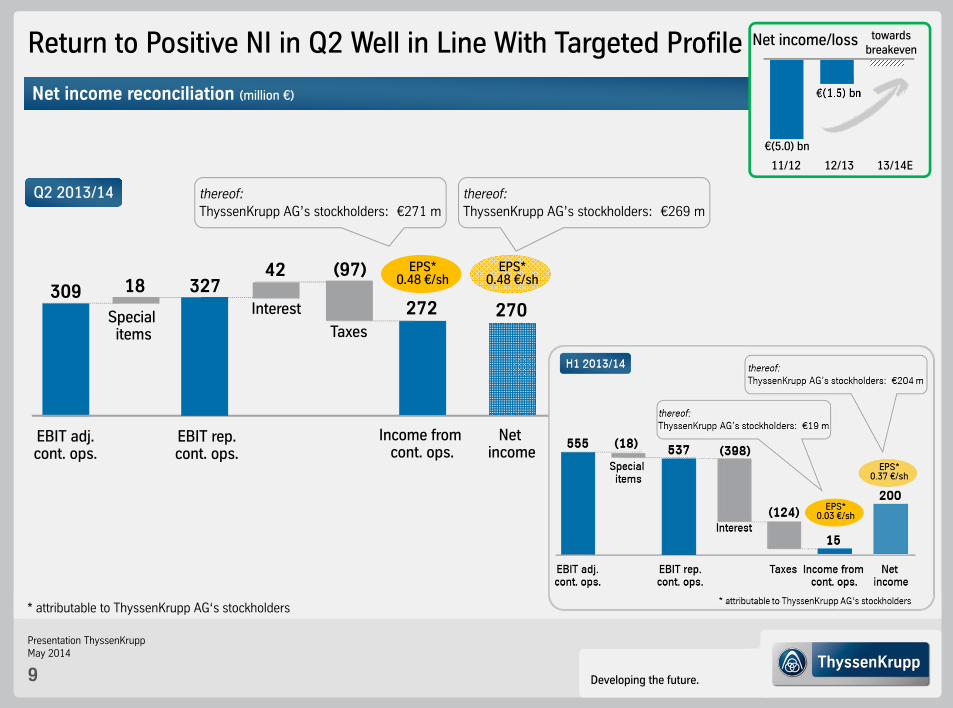
Net income reconciliation (million €)
Return to Positive NI in Q2 Well in Line With Targeted Profile
EBIT adj.cont. ops.
309 327
Income from cont. ops.
272
42
InterestSpecial items
18(97)
Taxes
EBIT rep.cont. ops.
thereof:ThyssenKrupp AG’s stockholders: €271 m
EPS* 0.48 €/sh
* attributable to ThyssenKrupp AG‘s stockholders
11/12 13/14E
€(5.0) bn
€(1.5) bn
towardsbreakeven
12/13
Net income/loss
Q2 2013/14
Net income
270
EPS* 0.48 €/sh
thereof:ThyssenKrupp AG’s stockholders: €269 m

Developing the future.
Presentation ThyssenKruppMay 2014
10
Divestments
NFDDec 2013
NFDMar 2014
(4,246)
(4,459)
1,302
Capex
Q2 2013/14 (million €)
Capex for property, plant & equipment, financial & intangible assets & financial investments
M&A More Than Compensating Legacy Cash-Out and NWC Requirements
OCF
(356)
(220)
Gearing136.5%
Gearing124.4%
FCF before divest (576)
52
Others
FCF 447
Incl. DB settlement payment
11/12 13/14E
€(2.1) bn
€(0.3) m Low 3-digit m€ negative
12/13
FCF before divest
(3,960)
Divestments: • sale of OTK stake: €31 m
Others: • repayment by OTK of revolving
back-up facility: €160 m• F/X effects (mainly at ET, IS, AM): €(90) m
Mainly purchase price of US$1.55 bn for Steel USA plus provisional purchase price adjustments for increased NWC
Cash-out Budd
(279)

Developing the future.
Presentation ThyssenKruppMay 2014
11
Balance Sheet Restructuring and Future Savings by Budd Chapter 11
6,938Pension & similar obligations
Postretirement healthcare obligations
699
3,681
~585**
Mar 31, 2014pre Budd transaction
6,938
3,960
~330**
Mar 31, 2014post Budd transaction
8
Exit from virtually all annual
• net periodic postretirement cost: €27 m*
• cash payments: €34 m*
* as of FY 2012/13
+NFD
Deferred tax assets related to pensions, net
in million €
Δ - 691
Δ + 279
Δ - 255
Exit from virtually all postretirement
healthcare obligations
Voluntary request by The Budd Company (pure shell company of former US auto activities)
for Chapter 11 leading to deconsolidation as of March 31, 2014:
+Increase in equity: €177 m
** only available on FY basis

Developing the future.
Presentation ThyssenKruppMay 2014
12
Value Upside from Performance & De-Risking return to previous margin levels• performance measures • ramp-up new plants in BIC
CT
reduce Corporate line• performance measures, e.g.
Corp
Cultural change and leadership
Performance and benchmarking ambition
Rational allocation of capital
Continuous de-risking
Value Upside
close margin gap to peers• while leverage growth
opportunities
ET
leverage growth opportunities• while maintain
2-digit EBIT margins*
IS
return to previous margin levels• performance measures• specialization & processing
AST & VDM: finalizing industrial concept by summer
MX
return to > wacc across the cycle• BIC reloaded:efficiency & differentiation
SE
EBITDA adj. ~breakeven in FY 13/14 BCF ~breakeven during FY 14/15
AM
Back to FCF generation Significant deleveraging
Gearing<100%
* incl. notional interest credit from excess prepayment
Developing the future.
Presentation ThyssenKruppMay 2014
13
Financial Calendar – FY 2013/14
May Roadshows
Paris (14th), New York (19th), Boston (20th), Brussels (26th), Netherlands (27th)
Conferences
Exane Nordic Corporate Access Day, Stockholm (22nd)
June Roadshows
London (2nd)
Conferences
Deutsche Bank Global Industrials and Basic Materials Conference, Chicago (4th-5th)
Deutsche Bank German, Swiss & Austrian Conference 2014, Berlin (12th-13th)
August Conference Call Q3 2013/14 (14th)

Developing the future.
Presentation ThyssenKruppMay 2014
14
Contact Details ThyssenKrupp Investor Relations
Phone numbers +49 201-844-
Dr. Claus Ehrenbeck -536464Head of Investor Relations
Christian Schulte -536966IR Manager (Deputy Head)
Rainer Hecker -538830IR Manager
Sabine Sawazki -536420IR Manager
Klaudia Kelch -538371IR Manager
To be added to the IR mailing list,
send us a brief e-mail with your details!
E-mail: [email protected]

Developing the future.
Presentation ThyssenKruppMay 2014
15
Appendix
Agenda

Developing the future.
Presentation ThyssenKruppMay 2014
16
Significant cash flow
Low net financial debt
Investment grade
ThyssenKrupp – Strategic Way Forward
Financial Stability Strategic Push
Inorganic growth: Acquisitions
Organic growth: Expand market position
Strengthen R&D
Performance Orientation
Change Management
Portfolio Optimization
Company Positioning
Closed
Auto Systems
Brazil
Civil
Shipbuilding
Construction
Inoxum
Metal Forming
Tailored Blanks
TK Steel USA
Waupaca
Xervon
Mission Statement (“Leitbild”)
Leadership
Network organization
Transparency
Compliance
People
Innovation
Systems & processes
Continuous benchmarking
Profitable growth
Cost control
Capital efficiency
Cash generation
DiversifiedIndustrialCompany
More & Better
TKA C T
Achieve Change @ TKAA CC TT
Achieve Change @C

Developing the future.
Presentation ThyssenKruppMay 2014
17
SWF: Progress in Change, Performance and Financial SituationFinancial Stability
Strategic Push
Performance Orientation
Change Management
Portfolio Optimization
Company Positioning + + +
12/13 13/14 14/15
~€600 m
~€850 m
~€850 m
~€2.3 bn*
* incl. ~€300 m from TK CSA
New Supervisory Board Chairman with compliance and corporate governance as top priority
New and smaller Executive Board
New Executive Board Member for Legal Affairs & Compliance
Less Corporate and Service Functions6 with new management
New and less BA Executives12 new BA Executives
~€490 m and >50%
of cost savings
targeted in FY 2013/14
achieved in H1
Capital structure & financing supported by:
Portfolio Optimization Performance Orientation
2011/12 2012/13
deleverage€(5.8) bn
€(5.0) bn
NFD
Gearing <100%targeted
Mar 2014
€(3.96) bn

Developing the future.
Presentation ThyssenKruppMay 2014
18
Premium flat carbon steels
Large-scale, multiple niche approach
Long-term customer relations
Technology leadership in products and processes
Premium flat carbon steels
CSA: slab mill in Brazil, 5 m t capacity, SoP Q3 CY 2010
Steel USA (disposal group): processing plant (hot / cold rolling and coating), SoP Jul. 31, 2010
Global materials distribution (carbon & stainless steel, pipes & tubes, nonferrous metals, aluminum, plastics)
Technical and infrastructure services for production & manufacturing sectors
Elevators
Escalators & moving walks
Passenger boarding bridges
Stair lifts, home elevator
Maintenance, Repair & Modernization
Components for the automotive industry(e.g. crankshafts, axle modules, steering systems)
Large-diameter bearings & rings (e.g. for wind energy)
Undercarriages for tracked earthmoving machinery
SteelEurope
Steel Americas
MaterialsServices
ElevatorTechnology
ComponentsTechnology
FY 2012/13: Sales €38.6 bn • EBIT adj. €586 m • Employees 156,856
ThyssenKrupp
ThyssenKrupp – Continuing Operations (incl. Steel Americas, excl. AST and VDM)
€9.6 bn€143 m
€1.9 bn€(495) m
€11.7 bn€236 m
€6.2 bn€675 m
Petrochemical complexes
Cement plants and systems for open-pit mining & mat. handling
Production systems for auto and aerospace industry
Engineering & Construction of non-nuclear submarines and Naval Surface Vessels
Sales: €5.7 bnEBIT adj.: €240 m
Industrial Solutions
€5.6 bn€640 m

Developing the future.
Presentation ThyssenKruppMay 2014
19
(375)
1.293 1.762 399 586
SteelEurope
ElevatorTechn.
Comp.Techn.
MaterialsServices
5 Year Performance Track Record and Outlook
EBIT adjusted, EBIT adjusted margin (million €, %)
08/09
Group*
09/10 10/11
84731
1.133
247 143
(139)
382 533 311 236
598 646 641 587 675
260*
720*473*
4.11.0
0.9
6.88.8
2.4 2.0
(1.1)
3.0 3.6
10.311.312.5 12.2
11.313.1
(1.9)
5.37.3
2.2
11/12
6.5
* pro forma
EBIT adjusted from continuing operations excluding Inoxum, incl. notional interest credit from excess prepayment (mainly ET, IS) deducted in Group consolidation line
(86)
301503 453
240
4.2
11.0
IndustrialSolutions
12/13
1.5
08/09 09/10 10/11 11/12 13/14E
1.5
SteelAmericas*
(77) (600) (1.071) (1.010) (495)
(0.9)
3.4
689 640
* 2012/13 excluding D&A for Steel USA
12/13 13/14E

Developing the future.
Presentation ThyssenKruppMay 2014
20
Systematic Benchmarking Aiming at Best-in-Class OperationsSelected Peers / Relevant Peer Segments
• Process Technologies (chemicals): Maire Tecnimont / Oil, Gas & Petrochem.
• Resource Technologies (mining & cement): FLSmidth, Sandvik / Mining
• System Engineering (automotive):Kuka
• Marine Systems:DCNS (F), Navantia (E), Damen (NL)
• Chassis & Powertrain: Continental; NSK (JPN); TRW (USA)
• Industry: SKF (Industrial); Titan Int’l (USA, Undercarriage)
• UTC / Otis• KONE• Schindler
Elevator Technology
Industrial Solutions
Components Technology
Steel Europe • ArcelorMittal / Flat Carbon Europe
• Salzgitter / Steel• Tata Steel / Europe• Voestalpine / Steel
• ArcelorMittal / Distribution Solutions• Klöckner• Reliance
Materials Services

Developing the future.
Presentation ThyssenKruppMay 2014
21
Leading Engineering Competence
Leading market positions
One integrated company
Active portfolio management
Benchmark performance
Profitablegrowth
Capitalefficiency
Diversified Industrial Company
ThyssenKrupp – Diversified Industrial Group

Developing the future.
Presentation ThyssenKruppMay 2014
22
ThyssenKrupp’s Leading Engineering Competence Supports Better for More
Climate change
Urbanization
Globalization
Leadingengineering
expertise
in
MaterialMechanical
Plant
More consumer and capital
goods
More resource and energy use
More infrastructure and buildings
Reduced CO2emissions, renewable
energies
Efficient resource and energy use,
alternative energies
Efficient infrastructure
and processes
Demand (“more”)
Drivers
Demography
Finite resources
Political framework
Business opportunities ConstraintsDemand (“better”)

Developing the future.
Presentation ThyssenKruppMay 2014
23
Structure and Elements of ThyssenKrupp Compliance Program
Reporting
Training
Group Policy Statements/ Guidance Notes
Whistleblowing
Sanctions for violations
Inform & Advise Identify Report & Act
Compliance audits
Advisory
Compliance Culture
Compliance Organization
Tone from the Top Compliance Commitment
Integrate Compliance in business processes
Risk analysis
Compliance Responsibility
Ombudsman
Corrective actions

Developing the future.
Presentation ThyssenKruppMay 2014
24
Key Financials (I)
* attributable to ThyssenKrupp AG’s stockholders
Q1 Q2 Q3 Q4 FY Q1 Q2
Order intake €m 10,063 10,113 9,401 9,059 38,636 10,671 10,220
Sales €m 9,189 9,540 9,920 9,910 38,559 9,109 10,295
EBITDA €m 369 226 356 204 1,154 468 598
EBITDA adjusted €m 380 465 408 416 1,669 505 580
EBIT €m 94 (52) 33 (684) (609) 210 327
EBIT adjusted €m 104 193 136 153 586 246 309
EBT €m (76) (243) (205) (1,182) (1,706) (230) 369
EBT adjusted €m (66) 2 (102) (346) (512) (194) 351
Net income €m (77) (129) (429) (995) (1,629) (257) 272
attrib. to TK AG stockh. €m (63) (131) (398) (898) (1,490) (252) 271
Earnings per share* € (0.13) (0.25) (0.77) (1.75) (2.90) (0.45) 0.48
2013/142012/13
Cont. Ops.(incl. Steel Americas with
Steel USA until Feb 26, 2014)

Developing the future.
Presentation ThyssenKruppMay 2014
25
Key Financials (II)
* incl. financial investments
** referring to Full GroupBCF (Business Cash Flow) = FCF before interest, tax and divestments = EBITDA +/- ∆ NWC – Capex +/- Other
Q1 Q2 Q3 Q4 FY Q1 Q2
TK Value Added** €m (1,865)
Ø Capital Employed** €m 18,045 16,607 15,566 14,827 14,827 12,187 12,732
Goodwill** €m 3,493
Capital expenditures* €m 334 287 239 453 1,313 232 220
Depreciation/amort. €m 281 282 328 1,171 2,062 263 276
Business cash flow €m (147) 190 421 8 472 30 (279)
Cash flow from divestm. €m 934 50 45 192 1,221 23 1,023
Cash flow from investm. €m (334) (287) (239) (453) (1,313) (232) (220)
Free cash flow €m 654 (75) 224 86 889 (62) 447
FCF before divest €m (280) (125) 179 (106) (332) (85) (576)
Cash and cash equivalents** (incl. short-term securities) €m 4,276 4,738 3,731 3,833 3,833 4,076 5,045
Net financial debt** €m 5,205 5,298 5,326 5,038 5,038 4,459 3,960
Equity €m 4,266 4,247 3,573 2,512 2,512 3,266 3,183
Employees 154,850 155,473 155,551 156,856 156,856 156,633 160,786
2013/142012/13
Cont. Ops.(incl. Steel Americas with
Steel USA until Feb 26, 2014)

Developing the future.
Presentation ThyssenKruppMay 2014
26
Key Financials
* attributable to ThyssenKrupp AG’s stockholders
Q1 Q2 Q3 Q4 FY Q1 Q2
Order intake €m 11,202 10,113 9,401 9,059 39,774 10,671 10,220
Sales €m 10,412 9,540 9,920 9,910 39,782 9,109 10,295
EBITDA €m 443 223 356 190 1,212 655 596
EBITDA adjusted €m 310 463 411 415 1,600 505 580
EBIT €m 166 (53) 33 (698) (552) 397 325
EBIT adjusted €m 35 191 139 152 517 246 309
EBT €m (12) (242) (202) (1,193) (1,649) (43) 367
EBT adjusted €m (143) 3 (96) (343) (579) (194) 351
Net income €m (18) (127) (426) (1,006) (1,576) (70) 270
attrib. to TK AG stockh. €m (3) (129) (395) (909) (1,436) (65) 269
Earnings per share* € (0.01) (0.25) (0.76) (1.77) (2.79) (0.11) 0.48
2013/142012/13
Full Group(incl. Inoxum in Q1 12/13 and
subsequent effects from loan note vs. asset swap in 13/14)

Developing the future.
Presentation ThyssenKruppMay 2014
27
Special ItemsBusiness Area(million €) Q1 Q2 Q3 Q4 FY Q1 Q2
Impairment (37) (7) (44)Disposal effect 3 1 4Restructuring 1 (1) (2) (30) (32) (7)Impairment (8)Others (1)Asset disposals (1)Impairment 1 (4) (11) (14)Restructuring (9) (17) (23) (49) (41) (4)Others 1 (2) (1)Impairment 2 2Restructuring 1 (10) (9) (4)Others 18 1 6 25Disposal effect (4) 8 (3) 1 10Impairment (14) 2 (12)Rail cartel case (207) (207)Restructuring (3) (3) (8) (14) (17)Others (1) (4) (2) (3) (10) (1) (2)Asset disposals (1) 110 110Impairment (22) (22) 1 1Restructuring (20) (37) (71) (128) (14)Others (10) (31) (41) 3Asset disposals (5) (5) 141Impairment (586) (586)Others (94) (94) 18 2Disposal effect (1) (7) (8) (11) (77)Impairment (1) (2) (3)Restructuring (1) (37) (38) (2) (3)Others (15) (19) 12 (5) (27) (1)
Consolidation 6 (1) 1 7
Continuing operations (10) (245) (103) (836) (1,194) (36) 18
Discontinued operations 141 0 (2) (14) 125 187 (2)
Group (incl. discontinued operations) 131 (244) (105) (850) (1,069) 151 16
2012/13 2013/14
SE
AM
Cor
p.C
TM
XIS
ET

Developing the future.
Presentation ThyssenKruppMay 2014
28
2,300
FY 2014/15
700
FY 2013/14FY 2012/13
Ramp-up Efficiency Gains 2015
Sustainable Efficiency Gains to Support EBIT Target FY 2013/14 and Mid-Term Upside
50% contribution to efficiency target from synergize+ especially by tapping unaddressed bundling potentials and pulling cross-functional levers
Efficiency Gains 2015 by Business Area
Efficiency Gains 2015 by Categories
2015
~10%
Energy & Other
Personnel ~20%
Operations~20%
~50%
Corporate
~6%Industrial Solutions~15%
Components Technology ~14%
Steel Europe
Elevator Technology~14%
Materials Services
~12%
~27%
million €
(Procurement)
700
500
100
~600
150
150
850
850
~13%Steel Americas
achievedH1: ~490

Developing the future.
Presentation ThyssenKruppMay 2014
29
Improving Capex Allocation Geared to CapGoods Businesses
2008/09 2009/10 2010/11 2011/12
CapGoods
2012/13
Cash flows from investing activities incl. Steel Americas (billion €)
Materials
3.7
3.2
2.5
1.8
1.3 FY 2013/14E:max €1.4 bn
~34
~8
~33
CTETISMXSEAM
~38~62 in %
thereof:SE: ~10%IS: ~15%CT: ~60%
thereof:SE: ~45%CT: ~15%ET: ~10%
Maint.Growth
2013/14
H1: ~0.5
in %~33
~8~11 ~7
~32
~9

Developing the future.
Presentation ThyssenKruppMay 2014
30
Solid Financial Situation
2014/15 2015/16 2016/17 after2017/18
Available committed credit facilities
Cash and cash equivalents
1,6661,020
1,659 1,710 1,617
3,715
1,333
* incl. securities of €6 m
8,760
19% 11% 18% 15% 19% 18%
5,045*
2017/182013/14(6 months)
Total: 9,005
Liquidity analysis and maturity profile of gross financial debt as of March 31, 2014 (million €)
Incl. new syndicated loan facility of €2 bn; facility due March 28, 2017

Developing the future.
Presentation ThyssenKruppMay 2014
31
Change in Innovation Ambition
R&D expenses TK Group The InCar®plus Project 2013/2014
Highlights:
• 30 projects with more than 40 individual solutions
• Green, cost-competitive, lightweight, high-performing
• Body:Innovative steel technologies for economical lightweight design
• Powertrain:Optimized internal combustion engines and efficient electric drives for the mobility of tomorrow
• Chassis & Steering:Comfort and safety – performance driver for more functionality, while retaining lightweight design targets
Start: Oct 2011 End: Sep 2014 Results as of fall 2014
R&D and innovation characterized by ambition for
sustainable technological differentiation
343 331
244
57
644
269
47
647
R&D cost
Amortization of capitalized
development cost
Order relatedR&D cost
2013/14E 2012/132011/12
Further increase by allBusiness Areas planned
Note: Group w/o Inoxum increased R&D expenses by €20 m or 3.2%

Developing the future.
Presentation ThyssenKruppMay 2014
32
Accrued Pension and Similar Obligations
Accrued pension liability Germany
Accrued postretirement obligation other than pensions
Other accrued pension-related obligation
Accrued pension and similar obligations (in €m)
Sep 30, 2013
Accrued pension liability outside GER
Discount rateGermany
3.60
Reclassification liabilities associated with assets held for sale
7,696*
6,922
Oct 1, 2012
6,427
3.50
7,348*252698
(29)
6,039
388
302850
(378)
6,342
580
7,348*
12/13 13/14 14/15 15/16 …
- 100-200 p.a.
Assumption: unchanged discount rate
“Patient” long-term debt, no immediate redemption in one go Interest cost independent of ratings, covenants etc. German discount rate aligned to interest rate for AA-rated corporate bonds and
discounts rate of other German companies Yoy decrease in accrued pension liability mainly driven by increased discount rate
outside Germany and divestment of Inoxum Qoq increase in accrued pension liability due to lower discount rate
overcompensated by removal of virtually all postretirement obligations in connection with deconsolidation of The Budd Company
Number of plan participants steadily decreasing 66% of obligations owed to retired employees, average age ~75 years
16/17
Accrued pension & similar obligations expected to decrease over time (in €m)
17/18
6,734
3.10
6,946204
Postretirement: 8
6,300
434
6,349
3.50
7,211226665
(29)
6,002
347
* Figures have been adjusted due to the adoption of IAS 19R
Mar 31, 2014Dec 31, 2013

Developing the future.
Presentation ThyssenKruppMay 2014
33
Majority of Pension Plans in Germany
Funded status of defined benefit obligation(FY 2012/13, in €m)
* incl. other effects of €57 m
98% of the unfunded portion can be found in Germany since the German pension system requires no mandatory funding of pension obligations with plan assets; funding is mainly done by ThyssenKrupp’s operating assets
Accrued pension liabilities*
Underfunded portion
594Unfunded
portion
5,773 6,424
Plan assets
2,054
DBO
Development of accrued pension liabilities(FY 2012/13, in €m)
Germany
6,238
Defined benefit
obligation
Plan assets Accrued pension liability
(199)
6,039
Outside Germany
2,183
Defined benefit
obligation
Plan assets
Accrued pension liability
(1,855)
385
Plan assets outside Germany mainly attributable to USA (~37%) and UK (~30%)
Plan asset classes include national and international stocks, fixed income, government and non-government securities and real estate
exp. return 6.00 exp. return
5.76
Other effects
57
Accrued pension liability and accrued postretirement obligation other than pensions referring to defined benefit plans

Developing the future.
Presentation ThyssenKruppMay 2014
34
Elements of Change in Accrued Pensions and Similar Obligations (in €m) / Position in Key Financial Statements
7,696*
Oct 1, 2012
7,348*
Sep 30, 2013
Net periodic pension cost €321 m
Interest cost
297 (115)
Exp. return on planassets
151
(Past) service costs**
** and other P&L effects including termination benefits
Curtailm.settlem.
(566)
Pension benefit
payments
(100)
other
P&L1)
Cash FlowStatement
in EBIT
Interest income/expense
Personnel expenses
– ––
Included in “changes in accrued pension & similar obligations”(mainly net periodic costs – payments)
below EBIT
(in “I“)
(34)
Postretirement benefit
payments
other compr.income
– – – – –
(in “I“)
– – – –
29
Interest cost
(Past) service costs**
Net periodic postretirement cost
€27 m
Interest in/exp
Personnel expenses
(in “I“)
–
– – – – – – – – –
–
–
()(partly in actuarial
gains/losses)
Mature Pension Schemes: Benefit Payments Higher Than Costs
3.60
German discount rate
3.50
–
Cash payments €600 m
1) additionally personnel expenses include €127 m net periodic pension cost for defined contribution plans Accrued pension liability and accrued postretirement obligation other than pensions referring to defined benefit plans
Curtailm.settlem.
(12) (1) (1)
* adjusted to reflect IAS 19R adjustments

Developing the future.
Presentation ThyssenKruppMay 2014
35
Continuing Tight Inventory Management at All Materials BAs
* slabs, unfinished/finished products to shipments;simplified assumption: no yield loss
** raw materials to crude steel production;simplified assumption: 1 t crude steel ~ 2 t of ore (~1.5 t) and coke/coal (~0.5 t)
*** Shipments structurally adjusted by TKS USA, thus only shipment of slabs in Q2 13/14
Materials Services Inventories(Metals Services, only warehous. bus., ex Mannex)
inventories m tDIO
m t days
Materials Services Inventories(Metals Services, only warehous. bus., ex Mannex)
12/13
inventories m tDIO
13/14
0
40
80
120
0
2
4
6
8
10
12
Steel EuropeInventories
11/12 12/13
m t days
Q2Q1 Q3 Q4 Q1 Q2 Q3Q4
DIO raw materials decreased in Q2 due to lower stock of iron ore/ coking coal and higher crude steel production
DIO steel production qoqdecreased due to seasonally higher shipments
Lower inventories in Q3E
inventories m tDIO steel products*DIO raw materials**
Q1
13/14
Q2
Steel AmericasInventories
m t days
Decrease DIO steel products in Q2 due to lower stock of finished goods (deconsolidation of TKS USA) but stable shipments***
Decrease DIO raw materials related to reduction of inventory
Stable inventories in Q3E
inventories m tDIO steel products*DIO raw materials**
0
50
100
150
200
250
0,0
0,5
1,0
1,5
2,0
2,5
11/12 12/13 13/14
Q3E Q2Q1 Q3 Q4 Q1 Q2 Q3Q4 Q1Q2Q3E
Qoq seasonal slight decrease of inventories
DIO broadly at same level (QoQ and YoY) expected in Q3E
m t days
0
40
80
120
0,0
0,5
1,0
1,5
2,0
11/12
Q2Q1 Q3 Q4 Q2Q1 Q3 Q4Q1 Q2 Q3E

Developing the future.
Presentation ThyssenKruppMay 2014
36
Current trading conditionsSales by region – FY 2012/13
Components Technology – Q2 2013/14 HighlightsOrder intake in €m Quarterly order intake auto components EBIT in €m; EBIT adj. margin in %
Q2 2013/14: qoq/yoy increased order intake driven by continuing high demand from the US and China
EBIT adjustedEBIT
Q1
2012/13 2013/14 2012/13 2013/14
Increasing order activity (+9% qoq, +16% yoy)
• Light vehicles: continuing high demand from the US
and China; stabilizing of European markets
• Trucks: market at low level with first signs of recovery
• Industrial components: further improving business activity for wind turbines (especially in China); construction equipment market still challenging
EBIT adj. margin qoq and yoy up to 4.8% mainly benefitting from restructuring and efficiency measures
Q4Q2
2008/09
Q4 Q2
2010/11
Q4
2012/13
1,3601,439
Q2
1,539
Q2Q2
1,4921,573
Q4
4.4
63
4.8
Q2 Q1 Q2
5567
75
4.6
64
62
43
80
5.320
57
3.8
Germany
Rest of EU
NAFTA
South America
Asia
31%
21%26%
8%
14%
€5.7 bn
Q2
Restated figures due to reclassification of the former disposal group Berco

Developing the future.
Presentation ThyssenKruppMay 2014
37
Components Technology
BCF (Business Cash Flow) = FCF before interest, tax and divestments= EBITDA +/- ∆ NWC – Capex +/- Other
Q1 Q2 Q3 Q4 FY Q1 Q2
Order intake €m 1,324 1,360 1,539 1,492 5,715 1,439 1,573
Sales €m 1,345 1,360 1,517 1,490 5,712 1,428 1,555
EBITDA €m 108 130 145 95 478 120 136
EBITDA adjusted €m 107 129 145 126 506 129 144
EBIT €m 42 64 43 20 168 55 67
EBIT adjusted €m 41 62 80 57 240 63 75
EBIT adj. margin % 3.0 4.6 5.3 3.8 4.2 4.4 4.8
TK Value Added €m (100)
Ø Capital Employed €m 2,896 2,959 2,988 2,978 2,978 2,867 2,856
BCF €m (103) (82) 102 161 78 (41) 1
CF from divestm. €m 2 6 1 5 14 2 0
CF for investm. €m (124) (85) (77) (103) (389) (65) (73)
27,789 27,698 27,562 27,737 27,737 28,057 28,354
2013/14
Employees
2012/13
Key figures

Developing the future.
Presentation ThyssenKruppMay 2014
38
Overview Business Area Components TechnologyEight Business Units in Three Clusters
BEARINGS
UNDERCARRIAGES
INDUSTRY(~20% of sales)
Excavator
DAMPERS
SPRINGS & STABILIZERS
STEERING
SYSTEMS
CHASSIS(~60% of sales)
CAMSHAFTS
FORGED & MACHINED
COMPONENTS
POWERTRAIN(~20% of sales)
Motor
Sales: €5,712 m; Employees: 27,737
Note: Sales and employees as of FY 2012/13 and Sep 30, 2013

Developing the future.
Presentation ThyssenKruppMay 2014
39
Future Customer Challenges Create Business OpportunitiesLeveraging Technology Base and Global Presence
Strategic Actions Components TechnologyFuture Challenges
Explore market opportunities: Strong global presence,ongoing actions to optimize footprint
Global footprint to ensure proximity to customers
Realign Footprint
Focus on process efficiency, highest quality standards and customer service
Close cooperation leveraging entire Group
BA- and Group-wide programs accelerate learning curve in all business units
Cost efficiency and restructuring
IncreasePerformance
Support environmental targets: Ongoing innovations for less weight and CO2-reduction (e.g. cylinder head module)
Strong R&D pipeline within our three business segments (e.g. InCarplus for automotive innovations)
Differentiate
EBIT adj., EBIT adj. margin (million €, %)
Sales (million €)
Strongest Performance Lever

Developing the future.
Presentation ThyssenKruppMay 2014
40
Elevator Technology – Q2 2013/14 HighlightsOrder intake in €m Units under Maintenance EBIT in €m; EBIT adj. margin in %
EBIT adjustedEBIT
172
154
11.011.3
175
133
11.0
159
163
Q22012/13
Q12013/14
Q2
10.5
133
146
Current trading conditions
1,696 1,5751,801
1,581
Record
Q2 Q1 Q22012/13 2013/14
1,633
AmericasEurope/Africa/Middle East Asia/Pacific
188
153
11.2
H1: 3,249 H1: 3,382
Current trading conditionsPlanned Test Tower in Rottweil, Germany
Order backlog with €3.8 bn remains on record level Order intake in Q2 impacted by seasonality and negative FX effects• New installation: strong demand from China, US and South Korea;
Europe stable despite delays in larger projects; weak demandin Spain and France
• Modernization: in line with expectations• Maintenance: service portfolio growing, but with continued price
pressure Margin improvements reflect success of performance
program (yoy); qoq margin impacted by seasonality
2004/05 2012/13
CAGR+4.8%
~0.8 m
>1.1 m
New test tower to foster innovations and certify elevators for mid and high-rise buildings before and while the buildings are being constructed, thus reducing installation times:• High speed elevators
(test speed up to 18 m/s)• Energy efficient solutions
Test shafts: 9; Tower height: 244 m

Developing the future.
Presentation ThyssenKruppMay 2014
41
Elevator Technology
BCF (Business Cash Flow) = FCF before interest, tax and divestments= EBITDA +/- ∆ NWC – Capex +/- Other
Q1 Q2 Q3 Q4 FY Q1 Q2
Order intake €m 1,616 1,633 1,696 1,575 6,520 1,801 1,581
Sales €m 1,532 1,388 1,562 1,673 6,155 1,544 1,481
EBITDA €m 190 159 179 176 703 152 177
EBITDA adjusted €m 188 166 197 201 753 194 181
EBIT €m 171 133 154 153 611 133 159
EBIT adjusted €m 169 146 172 188 675 175 163
EBIT adj. margin % 11.0 10.5 11.0 11.2 11.0 11.3 11.0
TK Value Added €m 423
Ø Capital Employed €m 2,359 2,371 2,372 2,353 2,353 2,271 2,271
BCF €m 74 257 203 118 652 51 230
CF from divestm. €m 3 3 1 2 9 1 0
CF for investm. €m (23) (20) (25) (76) (144) (14) (19)
47,897 48,150 48,488 49,112 49,112 49,348 49,316
2013/14
Employees
2012/13
Key figures

Titel des VortragsDatumAnlass, Referent
42 Developing the future.
Presentation ThyssenKruppMay 2014
42
Elevator TechnologySales*: €6,155 m; Employees*: 49,112
Central/Eastern/Northern Europe
Southern Europe/Africa/Middle East
Products/Services
OperatingUnit
Americas Asia/PacificAccess
Solutions
Elevators/Escalators new installation,service and modernization
Home elevators,stair lifts,PassengerBoardingBridges
Service base: >1,100,000 units
Overview Business Area Elevator Technology
* Sales: FY 2012/13; Employees: Sep. 30, 2013

Titel des VortragsDatumAnlass, Referent
43 Developing the future.
Presentation ThyssenKruppMay 2014
43
Five Initiatives to Improve Performance and Push Growth
EBIT adj. margin
Sales
Target level
Profitability!
Growth!
Growth EmergingMarkets
2
M&A5
Portfolio | Restructuring3
Manufacturing | NI1 Service | Modernization2
Manufacturing | NI1
15% EBIT adj. margin | €1 bn EBIT adj.
1
2
3 4
5

Titel des VortragsDatumAnlass, Referent
44 Developing the future.
Presentation ThyssenKruppMay 2014
44
Industrial Solutions – Q2 2013/14 HighlightsOrder intake in €m Order backlog in €bn EBIT* in €m; EBIT* adj. margin in %
157
11.9164 13.4
173779
15.515.8
Major order intake Q2 2013/14 Current trading conditions
2,295
1,595
16.4
12.6
198
156
EBIT* adjustedEBIT*
H1: 3,597
Q2 12/13 included 2 cement plants with ~€350 m, Q1 13/14 big ticket MS, Q2 13/14 major cement plant order
(Comparable project)
Plan
t Te
chno
logy
180
* incl. notional interest credit from excess prepayment
Turnkey cement complex for Société des Cimentsde Ain El Kebira, Algeria:
907
Q2 Q1 Q2
2012/13 2013/14
14.6
162
10.2
199
H1 order intake virtually stable on high level Upward order trend at plant engineering businesses continuing
with chemicals and cement orders compensating for ongoing softer new installation demand in mining • Demand for fertilizer plants leading to follow-up order in Hungary• Sustained high infrastructure demand for cement plants resulting
in another turnkey cement plant order in the emerging markets• Demand for service & maintenance in addition to stable oil sands
business cushioning order intake at mining Further increase in earnings driven by billing of fertilizer projects
and efficiency gains in all businesses leading to record EBIT adj.
Q2 Q1 Q22012/13 2013/14
Q22012/13
Q12013/14
Q2
Mar
ine
Sys
tem
s
Plan
t Te
chno
logy
Mar
ine
Sys
tem
s
1,188
H1: 3,483 15.1
195
12.5
Combining technological expertise & strong presence in growth markets
Cement clinker plant with 6,000 t/d Raw material processing, clinker
manufacture and cement loading and laboratory automation system for quality assurance and monitoring
Order value mid 3-digit €m range, SOP in 2016

Titel des VortragsDatumAnlass, Referent
45 Developing the future.
Presentation ThyssenKruppMay 2014
45
Industrial Solutions
BCF (Business Cash Flow) = FCF before interest, tax and divestments= EBITDA +/- ∆ NWC – Capex +/- Other
Q1 Q2 Q3 Q4 FY Q1 Q2
Order intake €m 2,002 1,595 779 907 5,283 2,295 1,188
Sales €m 1,306 1,428 1,306 1,602 5,641 1,288 1,593
EBITDA €m 155 210 174 179 718 186 211
EBITDA adjusted €m 155 191 174 183 702 186 214
EBIT €m 141 198 157 162 658 173 195
EBIT adjusted €m 140 180 156 164 640 173 199
EBIT adj. margin % 10.7 12.6 11.9 10.2 11.3 13.4 12.5
TK Value Added €m 525
Ø Capital Employed €m 1,488 1,478 1,462 1,472 1,472 1,523 1,485
BCF €m 277 344 158 (255) 524 264 (29)
CF from divestm. €m 1 3 2 13 19 1 (1)
CF for investm. €m (8) (10) (14) (32) (64) (11) (11)
18,176 18,427 18,660 18,841 18,841 18,982 19,081
2013/14
Employees
2012/13
Key figures

Titel des VortragsDatumAnlass, Referent
46 Developing the future.
Presentation ThyssenKruppMay 2014
46
Engineering Powerhouse Within ThyssenKrupp Industrial Solutions
ThyssenKrupp Industrial Solutions(Sales: €5,641 m; Employees: 18,841)
Construction (C) &Services (S)Procurement (P)Engineering (E)
70% of employees have an engineering / technical degreeKnow-how transfer based on common value chain
Process Technologies
Resource Technologies
System Engineering
Marine Systems
Sales (€m)Employees
~800~3,650
~2,100~5,700
~1,400 ~5,400
~1,300~4,050
Note: Sales and employees as of FY 2012/13 and Sep 30, 2013
Business Units
Products & Services with market positions (#)
Non-nuclear submarines (#1)
Naval surface vessels frigates & corvettes
Plants for: Nitrogen Fertilizers (#1) Electrolysis (#1) Coke Technology (#1) Oil & Gas / Polymers
Plants & equipment for: Open Pit Mining (#1) Cement industry (#3)
Production systems for: Automotive industry
(#2) Aerospace industry

Developing the future.
Presentation ThyssenKruppMay 2014
47
Leveraging GrowthEPC, Technology & Innovation, Service, M&A
1
Integration & RegionalizationRegional Clusters, Joint Customer Marketing
2
PeopleGlobal Mobility, Recruiting
3
PerformanceRisk Management, Cultural Change,
4
Enhancing Global Growth & Becoming a Global Leading Player
€8 bn sales with double-digit EBIT margin*
>€8 bn
€5.6 bn >10%
FY 2012/13 Target
* incl. notional interest credit from excess prepayment

Developing the future.
Presentation ThyssenKruppMay 2014
48
Materials Services – Q2 2013/14 HighlightsOrder intake* in €m EBIT in €m; EBIT adj. margin in %
*thereof materials warehousing business ~60% EBIT adjustedEBIT
1.22.0
51 43
62 7634
37
1.756
3,0472,842
3,4142,988
(157)
2.058
2,863
2.6
64
Q2 Q1 Q22012/13 2013/14
Q22012/13
Q12013/14
Q2
Current trading conditionsIntegration of AST & VDM (since Feb 28, 2014)
Shipments follow typical seasonal pattern (+10% qoq) Order intake increased on a comparable basis by 10%;
AST & VDM contribute ~€300 m to order intake Pricing environment still unsatisfying; prices for all relevant
materials on average below prior year level Stable earnings in both Q2 and H1 yoy• Sales initiatives and performance programs
contribute positively• AST & VDM with slightly negative EBIT contribution of €(3) m
Materials Services
MetalsServices
SpecialServices
SpecialMaterials
VDMAST
DistributionAST
Materials warehousing shipments in 1,000 t
1,3281,463
1,363 1,427 1,445
Q2 Q1 Q22012/13 2013/14
AST & VDM: finalizing industrial concept by summer

Developing the future.
Presentation ThyssenKruppMay 2014
49
Materials Services
Key figures
BCF (Business Cash Flow)= FCF before interest, tax and divestments= EBITDA +/- ∆ NWC – Capex +/- Other
Q1 Q2 Q3 Q4 FY Q1 Q2
Order intake €m 2,765 2,988 3,047 2,863 11,663 2,842 3,414thereof Special Materials 288
Sales €m 2,815 2,923 3,056 2,906 11,700 2,739 3,320thereof Special Materials 266
EBITDA €m 59 (134) 87 85 96 62 66
EBITDA adjusted €m 63 80 84 99 326 54 85thereof Special Materials 4
EBIT €m 36 (157) 51 64 (6) 43 37
EBIT adjusted €m 40 58 62 76 236 34 56thereof Special Materials (3)
EBIT adj. margin % 1.4 2.0 2.0 2.6 2.0 1.2 1.7thereof Special Materials (1.1)
TK Value Added €m (258)
Ø Capital Employed €m 2,913 2,925 2,881 2,808 2,808 2,562 3,017thereof Special Materials 357
BCF €m (175) (29) 136 258 190 (236) (67)thereof Special Materials (1)
CF from divestm. €m 2 8 34 5 49 19 1
CF for investm. €m (19) (13) (8) (36) (76) (13) (16)
26,280 26,230 25,994 26,978 26,978 25,128 30,653
2013/14
Employees
2012/13

Developing the future.
Presentation ThyssenKruppMay 2014
50
Link Between Industrial and Raw Materials Producers and Customers
Materials Services
Warehousing / Service Center
business
Trading• Distribution
• Value added services
• Supply chain management
• Project management
Production•Stainless steel (AST)•High performance
alloys (VDM)
(since Feb 28, 2014)
Producers
Customers 250,000 worldwide
Materials Services: Sales: €11,700 m; Employees: 26,978
Note: Sales and employees as of FY 2012/13 and Sep 30, 2013

Developing the future.
Presentation ThyssenKruppMay 2014
51
Materials Services Performance and Growth LeversPerformance Before Growth!
EBITmargin
Sales
Profitability! Growth!
• Organic growth• Selected smaller
growth investments(e.g. USA, Europe)
Performance Initiatives

Developing the future.
Presentation ThyssenKruppMay 2014
52
Steel Europe – Q2 2013/14 HighlightsShipments in 1,000 t
indexed (Q1 2004/05=100) Ø rev/t
126
3,058
127
Order intake in €m EBIT in €m; EBIT adj. margin in %
EBIT adjustedEBIT
2,315 2,177 2,274 2,430 2,620
3,093
Q2 Q12013/142012/13
2,839
123
Q2 Q1 Q22012/13 2013/14
Q22012/13
Q12013/14
Q2
2.4
14
19
42
281.8
0.9
20
62
522.6
62
(10)0.49
121
2,580
Q2
117
3,109
Current trading conditionsInventories and Months of Supply - EuropeStrengthening differentiation: more efficient corrosion protection in exposed quality
Qoq higher EBIT adj. as lower Ø rev/t were more than compensated by esp. higher shipments (+20%) and efficiency gains from “Best-in-Class Reloaded” program; steel production up in preparation for planned BF#2 reline
Against background of inadequate selling prices and earnings, focus remains on "Best-in-Class Reloaded": cost-reduction measures, intensified sales efforts and differentiation initiatives; divestment process of grain-oriented electrical steel activities
Expectation fiscal Q3: qoq higher EBIT adj. reflecting higher Ø rev/t, higher shipments and efficiency gains
ZM EcoProtect® &ZM PrimeProtect®
with significantadvantages overpure zinc coatings
world’s first zinc-magnesium coatingsin exposed quality
sig. higher corrosion protection forflat surfaces, cut edges and creep around scratches
coating thickness can be reduced by one third or 2 kg of zinc / mid-size car
ideal for components exposed to particularly high corrosion risks
harder surface, less abrasion in the die reduced cleaning intervals
easier to weld

Developing the future.
Presentation ThyssenKruppMay 2014
53
Steel Europe
BCF (Business Cash Flow) = FCF before interest, tax and divestments= EBITDA +/- ∆ NWC – Capex +/- Other
Key figures
Q1 Q2 Q3 Q4 FY Q1 Q2
Order intake €m 2,403 2,620 2,315 2,177 9,515 2,274 2,430
Sales €m 2,253 2,512 2,562 2,293 9,620 2,074 2,389
EBITDA €m 142 98 119 154 512 126 158
EBITDA adjusted €m 142 118 166 146 572 126 168
EBIT €m 29 (10) 14 28 62 20 52
EBIT adjusted €m 30 9 62 42 143 19 62
EBIT adj. margin % 1.3 0.4 2.4 1.8 1.5 0.9 2.6
TK Value Added €m (432)
Ø Capital Employed €m 5,387 5,351 5,291 5,198 5,198 4,669 4,605
BCF €m 15 97 173 (5) 280 182 59
CF from divestm. €m 2 1 5 159 167 0 (3)
CF for investm. €m (94) (105) (74) (136) (409) (91) (63)
27,629 27,773 27,609 26,961 26,961 26,658 26,397
2013/14
Employees
2012/13

Developing the future.
Presentation ThyssenKruppMay 2014
54
Overview Business Area Steel Europe
Product Mix Steel Europe FY 2012/13
in % of salesTailored Blanks
ElectricalSteel
Medium-wide Strip
Hot Strip
Tinplate
Coated Products(HDG, EG, Color)
Cold Strip
Heavy Plate
Sales by Industry Steel Europe FY 2012/13
in % of sales
28
2423
6
127
Others Automotive industry (incl. suppliers)Packaging
Trade
Mechanical Engineering
Steel and steel-related processing
Key Figures Steel Europe

Developing the future.
Presentation ThyssenKruppMay 2014
55
Program Geared to Achieve +ve TKVA Over the Cycle
Comprehensivemarket &
competitionreview
Comprehensivemarket &
competitionreview
CostsCosts
• structural adjustments• operational improvements• exit non-core activities
MixMix
• expand attractive niches• adjust Capex strategy
DifferentiationDifferentiation
• innovation initiative• time-to-market• delivery performance
>€500 m/yrgross EBIT effects
by FY 2014/15
from capacitiesto customers
~€150 m/yrgross EBIT effects
by FY 2014/15

Developing the future.
Presentation ThyssenKruppMay 2014
56
historically with manageable volatilitysig +ve EBIT adj. / BCF in upcycle -ve EBIT adj. / BCF in downcycle+ve TKVA over the cycle
“Best-in-Class Reloaded” program to meet Group requirements and tackle steel market challenges
Comprehensive Cost & Differentiation Program Geared to Sustainable Improvement of Profit and Cash Flow Profile
* EBIT(DA) as reported until 2005/06** FCF until 2010/11;
excl. –ve FCF Steel Americas projects
EBIT adj.
EBITDAadj.
CostsCosts
MixMix
DifferentiationDifferentiation
EBIT adj. / EBITDA adj. * in € bnEBIT adj. / EBITDA adj. * in € bn
TKVA in € bnTKVA in € bn
Business Cash-Flow** in € bnBusiness Cash-Flow** in € bn

Developing the future.
Presentation ThyssenKruppMay 2014
57
133156
122 130147
135121
136153
116135 136
126 117138 139
120140 138
127150
120 129146
136123
Average revenues per ton*, indexed Q1 2004/2005 = 100
HKM share
Steel Europe: Output, Shipments and Revenues per Metric Ton
Cold-rolledHot-rolled; incl. slabs
2007/08 2008/09
Crude steel output (incl. share in HKM) 1,000 t/quarter Shipments*: Hot-rolled and cold-rolled products 1,000 t/quarter
2009/10
* shipments and average revenues per ton until FY 2007/08 relate to former Steel segment
2010/11 2011/12 2012/13
Q1Q1 Q2 Q3 Q4Q1 Q2 Q3 Q4Q1 Q2 Q3 Q4Q1 Q2 Q3 Q4Q1 Q2 Q3 Q4
696 828863
Fiscal year
2009/10 2010/11 Q1
2013/14
2,628
3,324
Q1
2013/14Fiscal year
2009/10 2010/11 Q1
2012/13
2,580
947
1,633
Q2 Q3 Q4
3,256
1,130
2,126
2,485
3,312
786 863
2,360
3,146 3,002
1,026
1,977
Q2 Q3 Q4
957
2,046
3,002
2011/12
2,529
845
1,684
3,058
1,116
1,942
3,093
1,116
1,977
2,839
1,004
1,834
2011/12
2,965
2,102
Q1
2012/13
611 833 857 859
2,010
2,622
Q2
2,153
2,986
Q3
3,097
2,241 2,082
Q4
2,941
2013/14
Q1
Q2
3,109
1,205
1,904
2,555
3,418
Q2
Q2

Developing the future.
Presentation ThyssenKruppMay 2014
58
Steel: Inventories and Months of Supply
InventoriesChina
Inventories and Months of Supply - Germany
Inventories and Months of Supply - USA
Source(s): BDS, MSCI, UBS, MySteel
Germany: German Steel Traders: March inventories at month end / rolled steel w/o stainless
Inventories[m t]
MOS[months]
USA: March MSCI inventories, carbon flat-rolled
Inventories[m st]
MOS[months]
China: flat steel inventory in 23 major cities (HR, CR and Plate)
Inventories[m t]

Developing the future.
Presentation ThyssenKruppMay 2014
59
Steel Americas – Q2 2013/14 HighlightsProduction & shipments in 1,000 t
Slab productionCSA
Slab shipmentsCSA
Q2 Q1 Q2
Q2 Q1 Q22013/14
887
Order intake in €m EBIT in €m
EBIT adjustedEBIT
496 491
609574
1
(17)
117
509(44)
823
Current trading conditionsFocus on cash and earnings improvements in € bn
(821)
(136)
986
(192)
Q2 Q1 Q22012/13 2013/14
Q22012/13
Q12013/14
Q22012/13
2013/142012/13
Business Cash FlowCapexEBITDA adj.
998
(193)
(26)
987
903 854 936 923 1,034
Sale of Steel USA closed on Feb 26, 2014; financials included in Steel Americas figures until end of February
qoq EBIT adj. in fiscal Q2 slightly more negative: weaker performance at Steel USA (until closing) partly compensated by operational improvements and positive F/X effects at CSA;yoy EBIT adj. in fiscal Q2 improved despite a positive non-period tax effect of €102 m in the prior-year quarter
Positive special items in Q2: €141 m disposal gain, €2 m from updated valuation of a long-term freight contract
EBITDA adj. ~breakeven expected in current FY
EBITDA adj~breakeven
in FY 2013/14
BCF~breakeven during FY

Developing the future.
Presentation ThyssenKruppMay 2014
60
Steel Americas
BCF (Business Cash Flow) = FCF before interest, tax and divestments= EBITDA +/- ∆ NWC – Capex +/- Other
Key figures
Q1 Q2 Q3 Q4 FY Q1 Q2
Order intake €m 560 509 496 491 2,056 609 574
Sales €m 488 501 472 406 1,867 538 535
EBITDA €m (87) (12) (162) (205) (467) 29 143
EBITDA adjusted €m (87) (12) (162) (106) (368) 10 1
EBIT €m (122) (44) (192) (821) (1,180) 1 117
EBIT adjusted €m (122) (44) (193) (136) (495) (17) (26)
TK Value Added €m (1,291)
Ø Capital Employed €m 3,244 3,296 3,284 3,202 3,202 2,789 2,820
BCF €m (142) (71) (220) (100) (533) (178) (151)
CF from divestm. €m 0 0 1 4 5 0 1,263
CF for investm. €m (52) (42) (28) (48) (170) (22) (33)
3,990 4,068 4,100 4,112 4,112 5,491 4,037
2013/14
Employees
2012/13

Developing the future.
Presentation ThyssenKruppMay 2014
61
Steel Americas: TKS USA Divested And Forward Strategy TK CSA Defined
Exit TK Steel USAExit TK Steel USA
Sale to MT/NSSMY
Price: $1.55 bn
Sale to MT/NSSMY
Price: $1.55 bn
Shift in market focus TK CSAShift in market focus TK CSA
TKS USAAlabamaTKS USAAlabama
TK CSABrazil
TK CSABrazil
Mid-term solution outside of TK portfolio feasibleMid-term solution outside of TK portfolio feasible
Current focus on operating improvements in BrazilCurrent focus on operating improvements in Brazil
2.8
09/10
0.0
13/14e
3.53.3
11/12
slab sales TK CSAin m t/yr
• stabilization & continuous ramp-up
• efficiency imprvmts
• implement sales orgaand develop customerbase complementing
• 40% load from slabsupply to Alabama

Developing the future.
Presentation ThyssenKruppMay 2014
62
EBITDA Breakeven Targeted in FY 2013/14, Cash B/E in FY 2014/15
2004 2006 2008 2010 2012 20141.0
1.5
2.0
2.5
3.0
3.52010/11 2011/12 2012/13 2014/15E
(2.8)
(1.4)
(0.7)
(1.1) (0.5)
(0.6)(0.5) (0.2)
(0.4)
seaborne raw material spread vs HRC USseaborne raw material spread vs HRC US
2004 2006 2008 2010 2012 2014
Δ $600/tΔ $600/t
assuming no major headwinds
from F/X andraw material spreads
assuming no major headwinds
from F/X andraw material spreads
BRL/USDBRL/USD2013/14E
BCF~breakeven during FYEBITDA adj.
~breakeven
€ bn Business Cash Flow
Capex
EBITDA adj

Developing the future.
Presentation ThyssenKruppMay 2014
63
Corporate: Overview
Corporate
BCF (Business Cash Flow) = FCF before interest, tax and divestments= EBITDA +/- ∆ NWC – Capex +/- Other
Q1 Q2 Q3 Q4 FY Q1 Q2
Order intake €m 55 43 43 49 190 42 43
Sales €m 55 43 43 49 190 42 42
EBITDA €m (102) (128) (73) (154) (458) (107) (188)
EBITDA adjusted €m (88) (110) (83) (105) (386) (94) (108)
EBIT €m (112) (139) (83) (166) (500) (116) (199)
EBIT adjusted €m (97) (120) (93) (115) (425) (103) (119)
BCF €m (153) (296) (141) (156) (746) (30) (302)
3,089 3,127 3,138 3,115 3,115 2,969 2,948
2013/14
Employees
2012/13

Developing the future.
Presentation ThyssenKruppMay 2014
64
Long term- Short term- Outlookrating rating
Standard & Poor’s BB B negative
Moody’s Ba1 Not Prime negative
Fitch BB+ B negative
ThyssenKrupp Rating
Developing the future.
Presentation ThyssenKruppMay 2014
65
Management Compensation Aligned with Shareholder InterestFi
xed
Vari
able
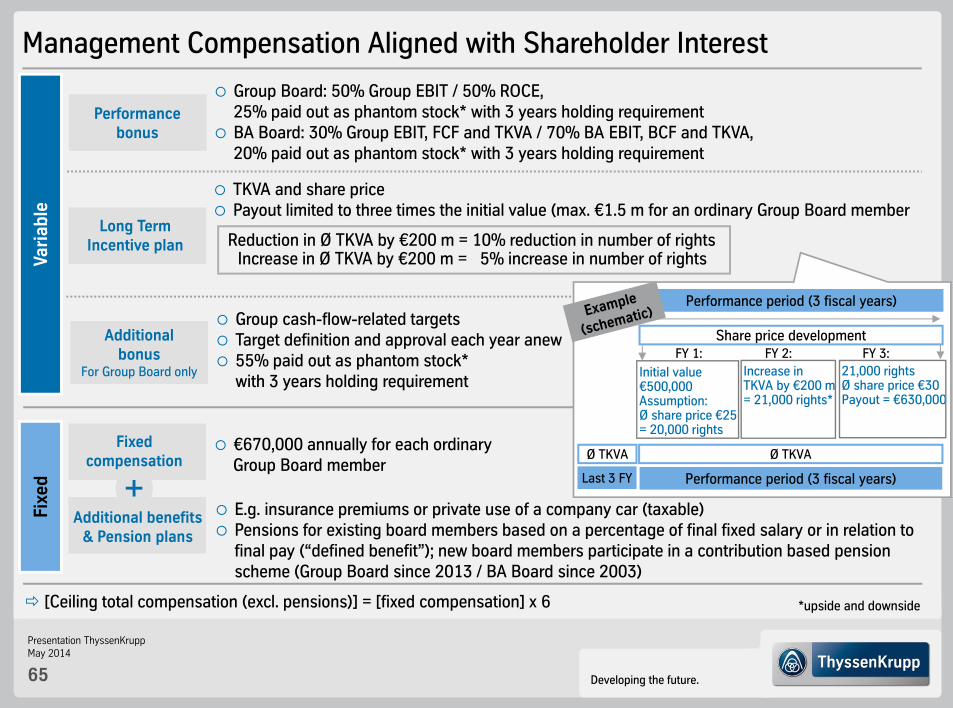
€670,000 annually for each ordinary Group Board member
E.g. insurance premiums or private use of a company car (taxable) Pensions for existing board members based on a percentage of final fixed salary or in relation to
final pay (“defined benefit”); new board members participate in a contribution based pension scheme (Group Board since 2013 / BA Board since 2003)
Long Term Incentive plan
Additional bonus
For Group Board only
Group cash-flow-related targets Target definition and approval each year anew 55% paid out as phantom stock*
with 3 years holding requirement
Fixed compensation
Additional benefits & Pension plans
TKVA and share price Payout limited to three times the initial value (max. €1.5 m for an ordinary Group Board member
Performance bonus
Group Board: 50% Group EBIT / 50% ROCE, 25% paid out as phantom stock* with 3 years holding requirement
BA Board: 30% Group EBIT, FCF and TKVA / 70% BA EBIT, BCF and TKVA, 20% paid out as phantom stock* with 3 years holding requirement
Performance period (3 fiscal years)
Share price development
Performance period (3 fiscal years)Last 3 FY
Ø TKVAØ TKVA
Initial value €500,000Assumption:Ø share price €25= 20,000 rights
Increase in TKVA by €200 m = 21,000 rights*
21,000 rightsØ share price €30Payout = €630,000
FY 1: FY 2: FY 3:
[Ceiling total compensation (excl. pensions)] = [fixed compensation] x 6
Reduction in Ø TKVA by €200 m = 10% reduction in number of rightsIncrease in Ø TKVA by €200 m = 5% increase in number of rights
*upside and downside

Developing the future.
Presentation ThyssenKruppMay 2014
66
Source: WpHG Announcements; ThyssenKrupp Shareholder ID 03/2014
Free Float
76.97%
InternationalMutual Funds 66.97%
incl.Cevian Capital15.08%
AKBH Foundation 23.03%
Shareholder Structure
PrivateInvestors 10.00%

Developing the future.
Presentation ThyssenKruppMay 2014
67
Our Mission Statement
Competence and diversity, global reach, and tradition form the basis of our worldwide market leadership. We create value for customers, employees and shareholders.
We are ThyssenKrupp – The Technology & Materials Company.
We are customer-focused. We develop innovative products and services that create sustainable infrastructures and promote efficient use of resources.
We Meet the Challenges of Tomorrow with our Customers.
We engage as entrepreneurs, with confidence, a passion to perform, and courage, aiming to be best in class. This is based on the dedication and performance of every team member. Employee development is especially important. Employee health and workplace safety have top priority.
We Hold Ourselves to the Highest Standards.
We serve the interests of the Group. Our interactions are based on transparency and mutual respect. Integrity, credibility, reliability and consistency define everything we do. Compliance is a must. We are a responsible corporate citizen.
We Share Common Values.

Developing the future.
Presentation ThyssenKruppMay 2014
68
Disclaimer ThyssenKrupp AG
“The information set forth and included in this presentation is not provided in connection with an offer or solicitation for the purchase or sale of a security and is intended for informational purposes only.
This presentation contains forward-looking statements that are subject to risks and uncertainties. Statements contained herein that are not statements of historical fact may be deemed to be forward-looking information. When we use words such as “plan,” “believe,” “expect,” “anticipate,” “intend,” “estimate,” “may” or similar expressions, we are making forward-looking statements. You should not rely on forward-looking statements because they are subject to a number of assumptions concerning future events, and are subject to a number of uncertainties and other factors, many of which are outside of our control, that could cause actual results to differmaterially from those indicated. These factors include, but are not limited to, the following:(i) market risks: principally economic price and volume developments, (ii) dependence on performance of major customers and industries, (iii) our level of debt, management of interest rate risk and hedging against commodity price risks;(iv) costs associated with, and regulation relating to, our pension liabilities and healthcare measures, (v) environmental protection and remediation of real estate and associated with rising standards for real estate environmental protection, (vi) volatility of steel prices and dependence on the automotive industry, (vii) availability of raw materials; (viii) inflation, interest rate levels and fluctuations in exchange rates; (ix) general economic, political and business conditions and existing and future governmental regulation; and (x) the effects of competition. Please note that we disclaim any intention or obligation to update or revise any forward-looking statements whether as a result of new information, future events or otherwise.”