Embed Size (px)
Citation preview

1

2

3,5
Andalucía
3,0
Unión Europea2,0
2,5
Zona Euro
1,5
% PIB
0 5
1,0
0,0
0,5
2014 2015 2016 Prev 2017 Prev 2018
Fuente: Eurostat e IECA. Tasa Variación Real PIB
3
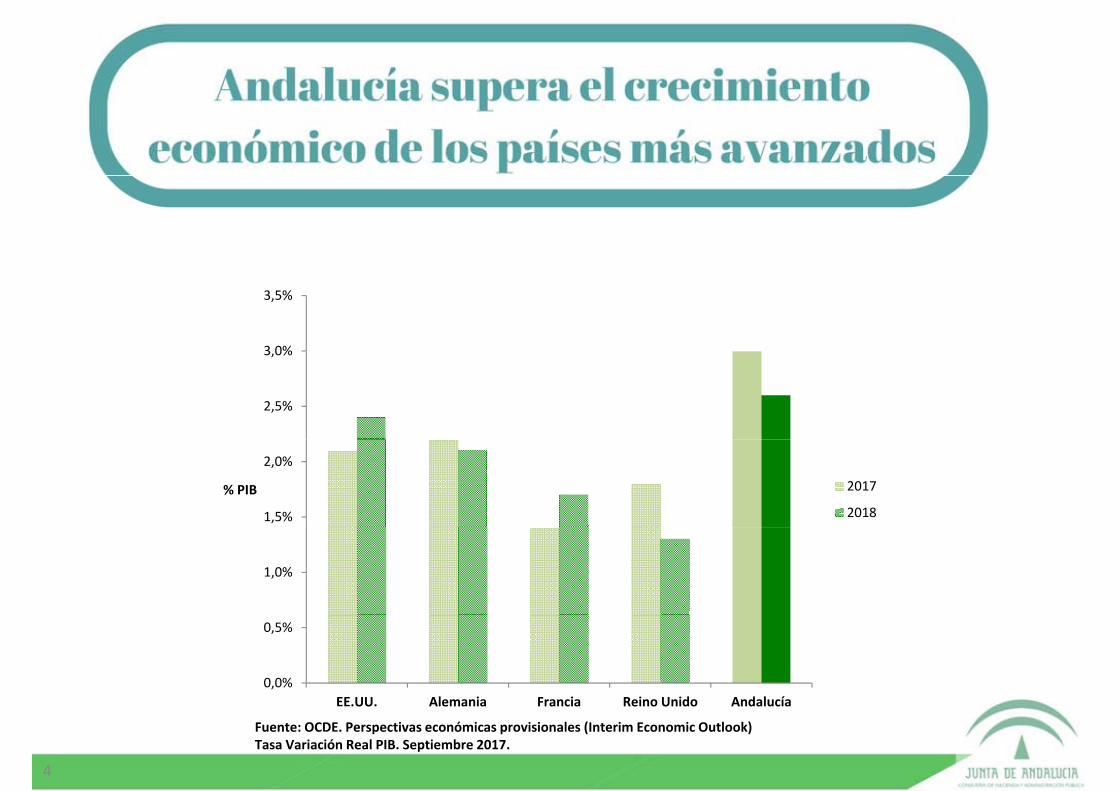
3 0%
3,5%
2,5%
3,0%
1,5%
2,0%
% PIB 2017
2018
1,0%
0,0%
0,5%
EE UU Alemania Francia Reino Unido AndalucíaEE.UU. Alemania Francia Reino Unido Andalucía
Fuente: OCDE. Perspectivas económicas provisionales (Interim Economic Outlook)Tasa Variación Real PIB. Septiembre 2017.
4

170.000166.000
160.000
165.000 Hemos superado
el nivel previo
150.000
155.000
p
a la crisis
157.147 M€
140.000
145.000 (PIB 2008)
130.000
135.000
125.0002013 2014 2015 2016 Prev. 2017 Prev. 2018
PIB precios de mercado (millones euros corrientes)
5

6

7

8

9
10

11

12

13

Déficit 2016 Déficit 2017
CCAA 0,7%
SS1,1%
AGE 1 8%
Gob Central 2,9%
CCAA 0,6%
SS 1,4%
AGE
GobCentral1,1%1,8% 1,1%,
Déficit 2018
SS 1,1%
Déficit 2019
CCAA 0,4%
1,1%
AGE0,7%
GobCentral 1,8%
CCAA0,1%
SS0,9%AGE0,3%
GobCentral; 1,2%
14

15

16
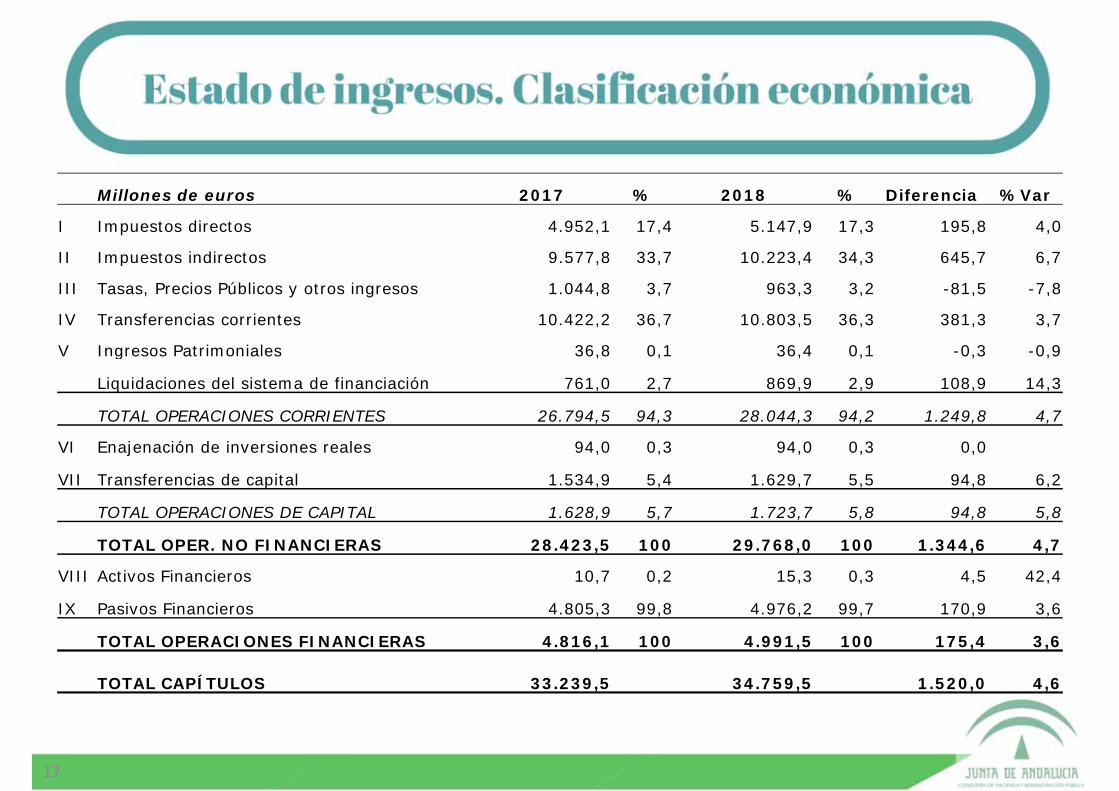
Millones de euros 2017 % 2018 % Diferencia %Var
I Impuestos directos 4.952,1 17,4 5.147,9 17,3 195,8 4,0
II Impuestos indirectos 9.577,8 33,7 10.223,4 34,3 645,7 6,7p , , , , , ,
III Tasas, Precios Públicos y otros ingresos 1.044,8 3,7 963,3 3,2 -81,5 -7,8
IV Transferencias corrientes 10.422,2 36,7 10.803,5 36,3 381,3 3,7
V Ingresos Patrimoniales 36 8 0 1 36 4 0 1 -0 3 -0 9V Ingresos Patrimoniales 36,8 0,1 36,4 0,1 -0,3 -0,9
Liquidaciones del sistema de financiación 761,0 2,7 869,9 2,9 108,9 14,3
TOTAL OPERACIONES CORRIENTES 26.794,5 94,3 28.044,3 94,2 1.249,8 4,7
VI Enajenación de inversiones reales 94,0 0,3 94,0 0,3 0,0
VII Transferencias de capital 1.534,9 5,4 1.629,7 5,5 94,8 6,2
TOTAL OPERACIONES DE CAPITAL 1.628,9 5,7 1.723,7 5,8 94,8 5,8
TOTAL OPER. NO FINANCIERAS 28.423,5 100 29.768,0 100 1.344,6 4,7
VIII Activos Financieros 10,7 0,2 15,3 0,3 4,5 42,4
IX Pasivos Financieros 4.805,3 99,8 4.976,2 99,7 170,9 3,6, , , , , ,
TOTAL OPERACIONES FINANCIERAS 4.816,1 100 4.991,5 100 175,4 3,6
TOTAL CAPÍTULOS 33.239,5 34.759,5 1.520,0 4,6
17

Millones de euros2017 % 2018 % Diferencia %Var.
INGRESOS NO FINANCIEROS 28.423,5 85,5 29.768,0 85,6 1.344,6 4,7, , , , , ,Tributos Gestionados por la Comunidad Autónoma 2.301,5 6,9 2.387,1 6,9 85,6 3,7Entregas a Cuenta Sistema de Financiación 16.845,9 50,7 18.081,0 52,0 1.235,2 7,3Liquidaciones Sistema de Financiación 761,0 2,3 869,9 2,5 108,9 14,3Trib Cedidos Gestión Estado no Sujetos a Liquidación 299 8 0 9 305 6 0 9 5 9 2 0Trib. Cedidos Gestión Estado no Sujetos a Liquidación 299,8 0,9 305,6 0,9 5,9 2,0Fondos Europeos 1.627,0 4,9 1.624,2 4,7 -2,8 -0,2Fondos de Compensación Interterritorial 159,4 0,5 160,9 0,5 1,5 1,0Transferencias Finalistas 979,9 2,9 968,3 2,8 -11,6 -1,2Otros Ingresos no Financieros 1.398,6 4,2 1.320,6 3,8 -78,0 -5,6Intermed. Financiera (PIE de CC. LL., FEOGA Garantía y LAE) 4.050,4 12,2 4.050,3 11,6 -0,1 0,0INGRESOS NO FINANCIEROS SIN IF 24.373,1 85,7 25.717,8 86,4 1.344,7 5,5INGRESOS FINANCIEROS 4.816,1 14,5 4.991,5 14,4 175,4 3,6Endeudamiento para Amortización 3.682,2 11,1 4.037,8 11,6 355,6 9,7Endeudamiento Neto 1.067,1 3,2 870,0 2,5 -197,1 -18,5Otros Ingresos Financieros 66 8 0 2 83 7 0 2 16 9 25 3Otros Ingresos Financieros 66,8 0,2 83,7 0,2 16,9 25,3TOTAL INGRESOS 33.239,5 100 34.759,5 100 1.520,0 4,6
18

19

20

2121

22

23

24
25

26
27

28

29
30
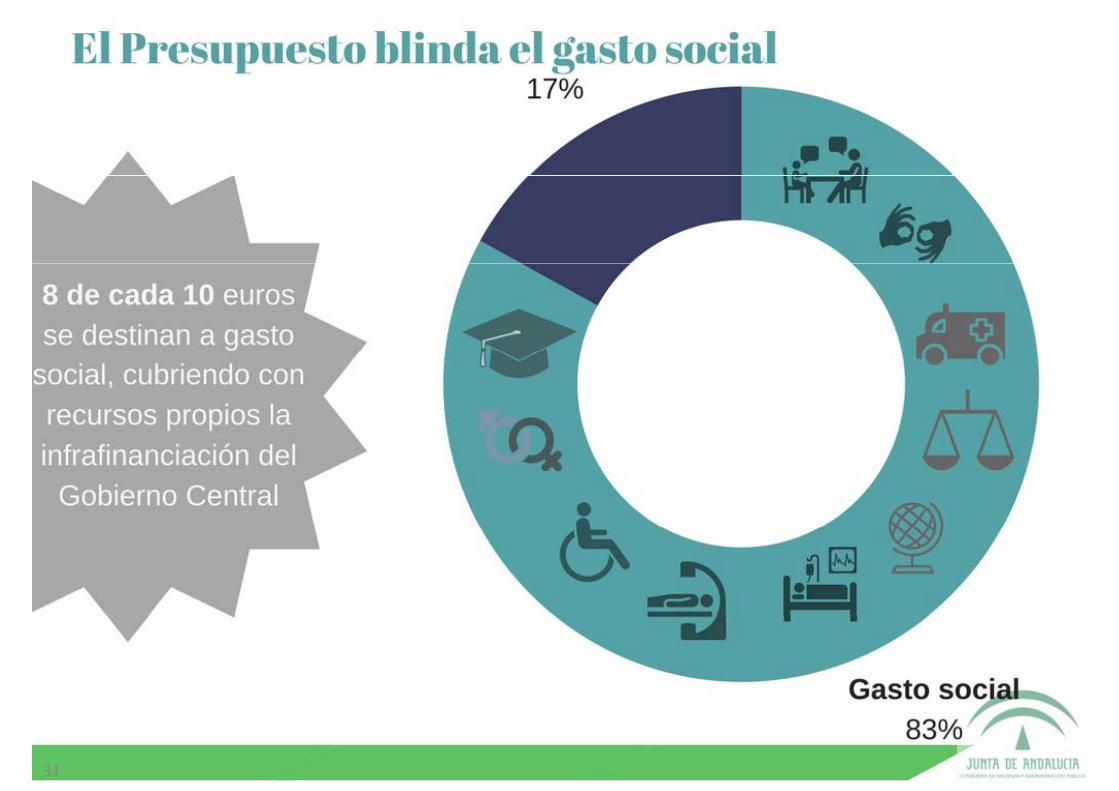
31
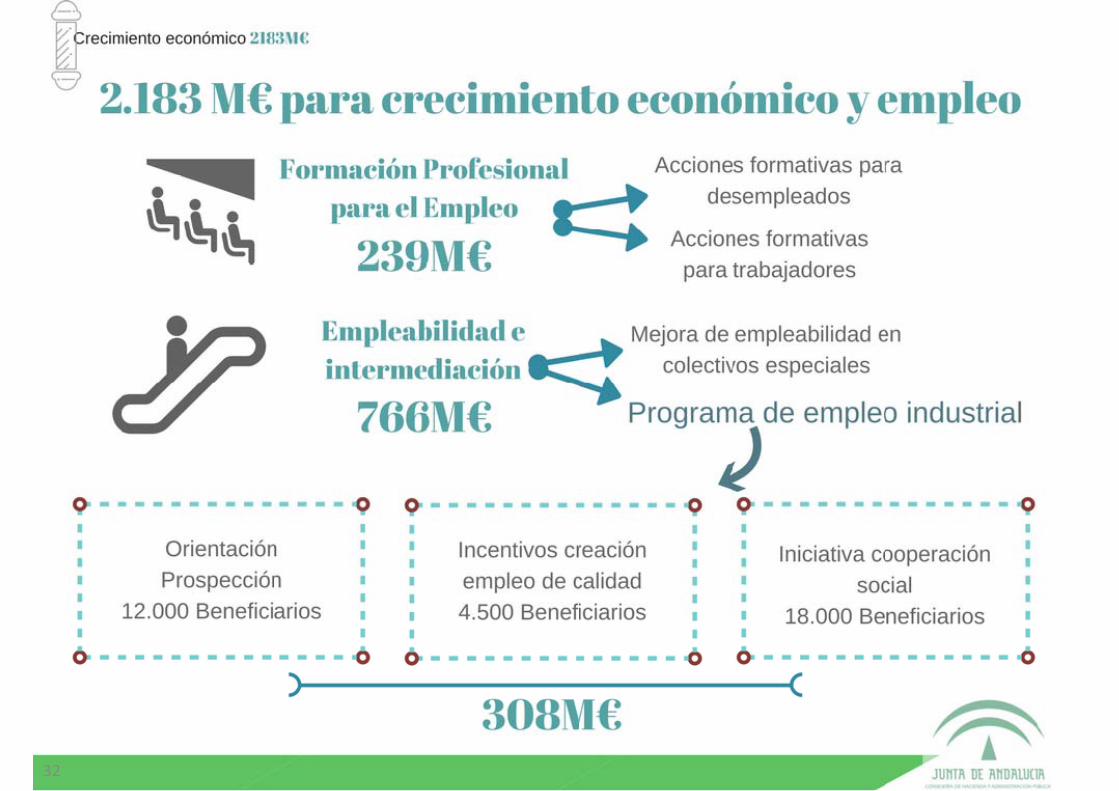
32

33

34

35

36

37

38

39

Cto. Inicial 2017 (1)
%s/Total
Presupuesto 2018 (2)
% s/Total
Diferencia Absoluta (2)‐(1)
Incremento (2)/(1)
1. Personal 10.242.822.142 30,8% 10.668.093.747 30,7% 425.271.605 4,2%2. Bienes Corrientes y Servicios 3.276.680.244 9,9% 3.430.221.056 9,9% 153.540.812 4,7%3. Financieros 502.565.487 1,5% 555.504.819 1,6% 52.939.332 10,5%4. Transferencias Corrientes 11.774.258.746 35,4% 12.249.595.710 35,2% 475.336.964 4,0%5. Fondo de Contingencia 16.000.000 0,0% 16.000.000 0,0% 0 0,0%
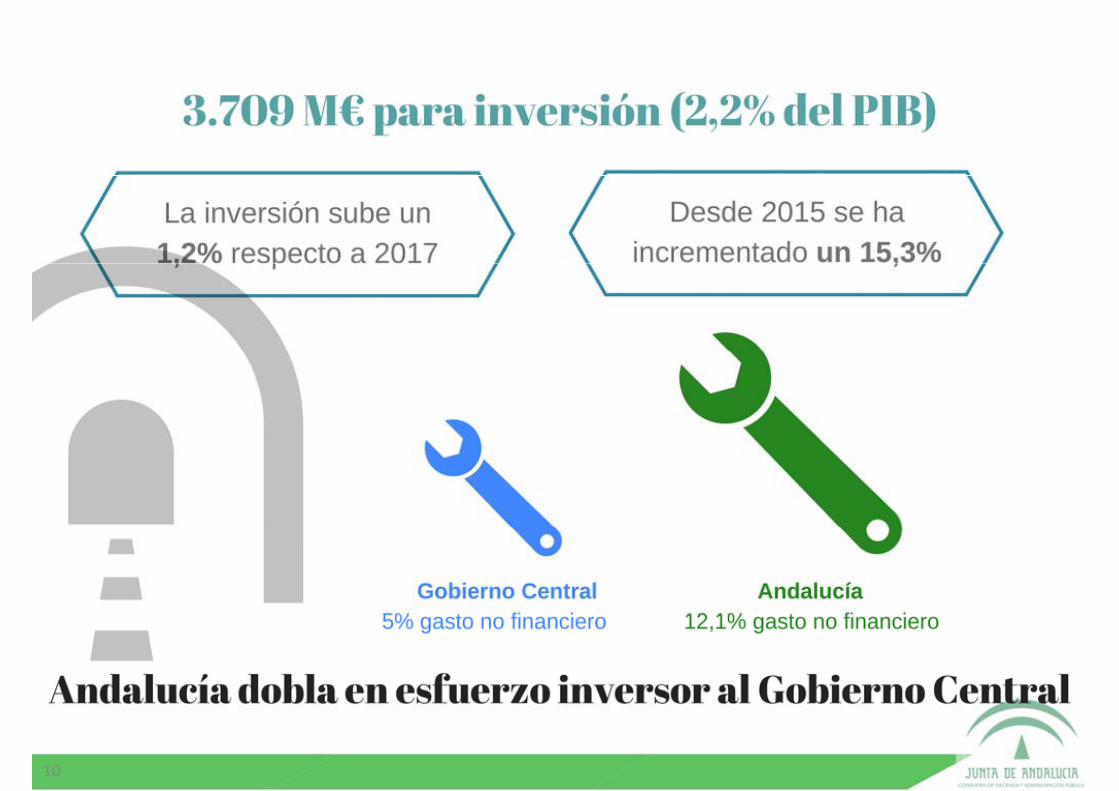
Gasto Corriente 25.812.326.619 77,7% 26.919.415.332 77,4% 1.107.088.713 4,3%6. Inversiones Reales 1.313.089.267 4,0% 1.302.632.060 3,7% ‐10.457.207 ‐0,8%7. Transferencias de Capital 2.352.377.266 7,1% 2.406.876.401 6,9% 54.499.135 2,3%
Gasto de Capital 3.665.466.533 11,0% 3.709.508.461 10,7% 44.041.928 1,2%Gasto No Financiero 29.477.793.152 88,7% 30.628.923.793 88,1% 1.151.130.641 3,9%
8. Activos Financieros 22.356.071 0,1% 64.772.779 0,2% 42.416.708 189,7%9. Pasivos Financieros 3.739.359.808 11,2% 4.065.826.778 11,7% 326.466.970 8,7%
G Fi i 3 761 715 879 11 3% 4 130 599 557 11 9% 368 883 678 9 8%Gasto Financiero 3.761.715.879 11,3% 4.130.599.557 11,9% 368.883.678 9,8%Total 33.239.509.031 100,0% 34.759.523.350 100,0% 1.520.014.319 4,6%
40

Sección 2017 2018 Var 2018‐17PRESIDENCIA, ADMINISTRACIÓN LOCAL Y MEMORIA HISTÓRICA 324.322.929 327.452.773 3.129.844 1,0%PARLAMENTO DE ANDALUCÍA 45.459.748 45.842.275 382.527 0,8%DEUDA PÚBLICA 4.162.050.097 4.556.261.169 394.211.072 9,5%Á Í %CÁMARA DE CUENTAS DE ANDALUCÍA 10.408.549 10.589.913 181.364 1,7%
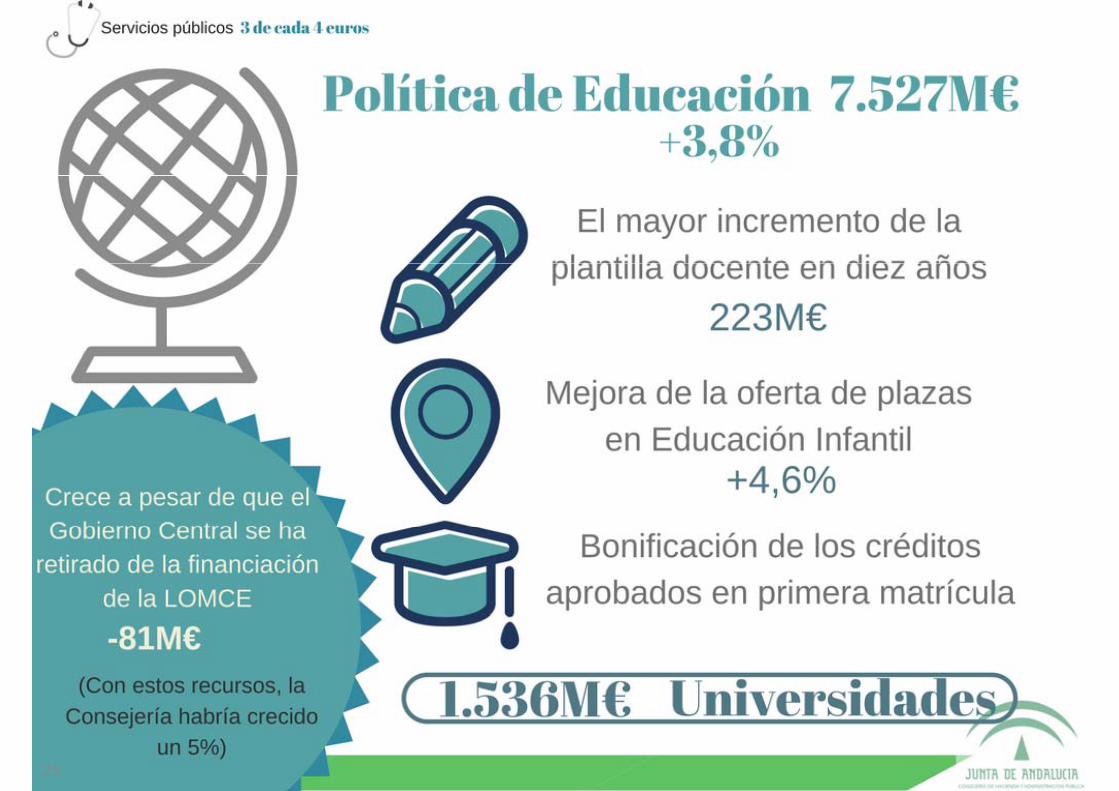
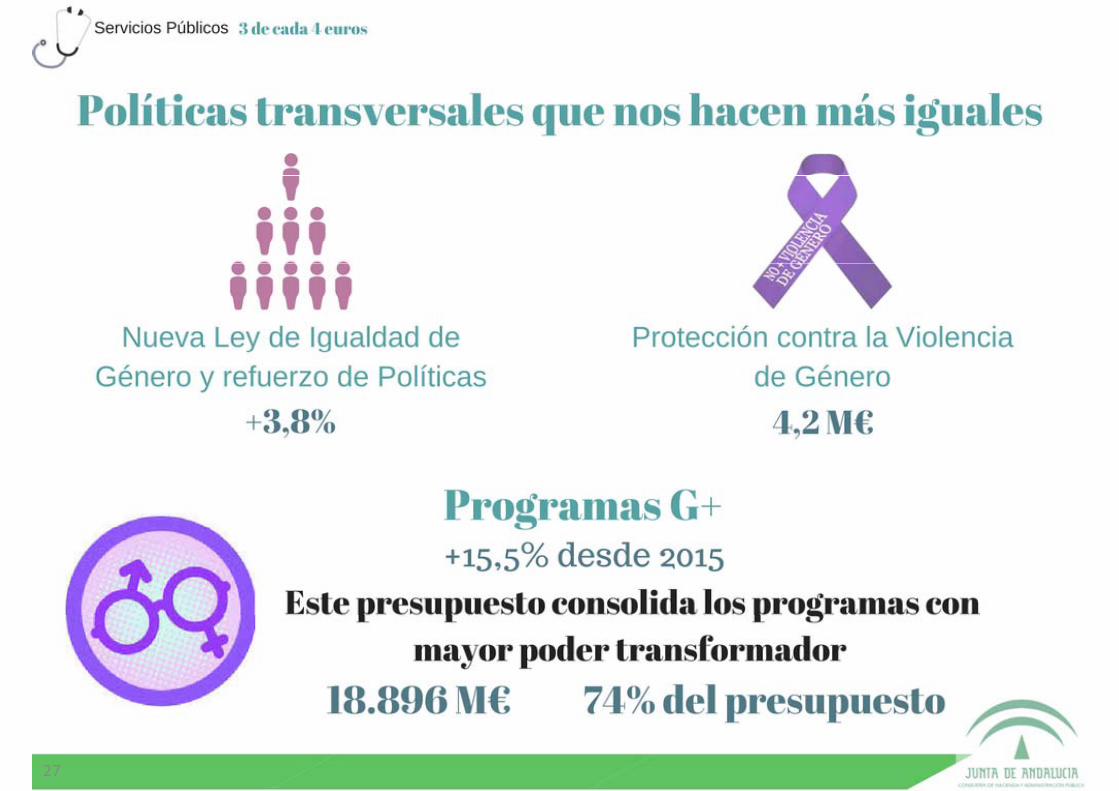
CONSEJO CONSULTIVO DE ANDALUCÍA 3.762.607 3.831.295 68.688 1,8%CONSEJO AUDIOVISUAL DE ANDALUCÍA 4.524.158 4.566.551 42.393 0,9%CONSEJO DE TRANSPARENCIA Y P.D. DE ANDALUCÍA 1.313.509 2.660.590 1.347.081 102,6%ECONOMÍA Y CONOCIMIENTO 1 756 696 771 1 821 264 685 64 567 914 3 7% Un 5%ECONOMÍA Y CONOCIMIENTO 1.756.696.771 1.821.264.685 64.567.914 3,7%HACIENDA Y ADMINISTRACIÓN PÚBLICA 184.465.892 190.584.129 6.118.237 3,3%EDUCACIÓN 6.103.357.212 6.329.128.326 225.771.114 3,7%SALUD 9.304.653.450 9.809.930.785 505.277.335 5,4%IGUALDAD Y POLÍTICAS SOCIALES 1 912 775 956 2 053 785 980 141 010 024 7 4%
Un 5%sin la retirada
dela financiación
LOMCE IGUALDAD Y POLÍTICAS SOCIALES 1.912.775.956 2.053.785.980 141.010.024 7,4%JUSTICIA E INTERIOR 572.792.512 598.077.639 25.285.127 4,4%EMPLEO, EMPRESA Y COMERCIO 1.478.813.410 1.530.664.029 51.850.619 3,5%FOMENTO Y VIVIENDA 832.575.420 857.942.806 25.367.386 3,0%TURISMO Y DEPORTE 156 314 766 161 732 415 5 417 649 3 5%
por el Estado
TURISMO Y DEPORTE 156.314.766 161.732.415 5.417.649 3,5%CULTURA 192.288.093 202.078.046 9.789.953 5,1%AGRICULTURA, PESCA Y DESARROLLO RURAL 696.289.505 730.225.977 33.936.472 4,9%MEDIO AMBIENTE Y ORDENACIÓN DEL TERRITORIO 782.294.455 801.074.183 18.779.728 2,4%GASTOS DIVERSAS CONSEJERÍAS 158 200 744 166 673 998 8 473 254 5 4%GASTOS DIVERSAS CONSEJERÍAS 158.200.744 166.673.998 8.473.254 5,4%A CC.LL. POR P.I.E. 2.653.530.358 2.653.530.358 0 0,0%F.A.G.A. 1.400.000.000 1.400.000.000 0 0,0%PENSIONES ASISTENCIALES 22.618.890 21.625.428 ‐993.462 ‐4,4%PATRICA 480.000.000 480.000.000 0 0,0%C 80 000 000 80 000 000 0 0,0%
TOTAL JUNTA DE ANDALUCÍA 33.239.509.031 34.759.523.350 1.520.014.319 4,6%
41

42