Embed Size (px)
Citation preview

PREPARING SOLUBILITY DATA FOR USE BY THE GAS PROCESSING INDUSTRY:
UPDATING KEY RESOURCES
Darryl Mamrosh and Kevin Fisher Trimeric Corporation
Jeff Matthews URS Corporation
Mapping Midstream’s Future 2012 GPA Convention

Background
• GPA sponsored a number of projects for the collection of VLE and LLE data to describe solubilities of interest to gas processors: – Methanol in natural gas and liquid phases – CO2 and H2S in TEG and EG – Hydrocarbons (BTEX) in Amines & Glycols
• GPSA Engineering Data Book (EDB) – These topics in EDB have not been updated to the
most recent data 2

Background
• This project: create models, graphs, etc., as updated content for EDB, and make the data readily usable to GPA members
• Projects 975-5, 975-7, 975-8
• This work focuses on simple, generalized representations of data – Use for quick process calculations
3

Summary
• Topics will be covered separately – Solubility of methanol in natural gas and liquids – CO2 and H2S solubility in glycols – Hydrocarbon solubility in amines & glycols
• To Include – Review of current EDB (12th) content – Treatment of new data – Using the information
• Not all is covered: The paper available on-line 4
Solubility: What does it mean?
• Concentration, at specified conditions of equilibrium, of a solute dissolved in a solvent.
• In gas processing: – Concentration of a solute in a gas in equilibrium
with a liquid phase – Concentration of a light solute in a liquid in
equilibrium with a gas phase – Concentration of a solute in a liquid in equilibrium
with another liquid phase
• Always refers to an equilibrium condition
5

Approach
1. Use common terminology and units for expressing solubility concentrations
2. When feasible use same formats as in existing EDB content
3. When appropriate, create a mathematical model of data. If not, create a graph and/or table.
• Models should be easy to use (not EOS for simulation software)
6

Approach
4. Generalize the data and simplify – Ignore minor variables – Group data that are similar
7
Solubility of methanol in natural gas and HC liquids: GPA Project 975-7
Importance of Data • Methanol used in hydrate inhibition, dehydration,
sweetening • In Hydrate inhibition:
– Predict loss of injected methanol in natural gas phase – Predict loss of injected methanol in liquid hydrocarbon
phase (if present) Material balance calculations used to predict methanol
injection rate required to prevent hydrates
8

9 Lb MeOH per MMSCF Gas per wt% MeOH in Aq Phase
Pres
sure
(psi
a)
Degr. F
Solubility of Methanol in the Natural Gas Phase. EDB Graph (12th)

10
Compare with new data. Red & Green lines are traces of current figure 20-65. Red and Green Points are expt’l data
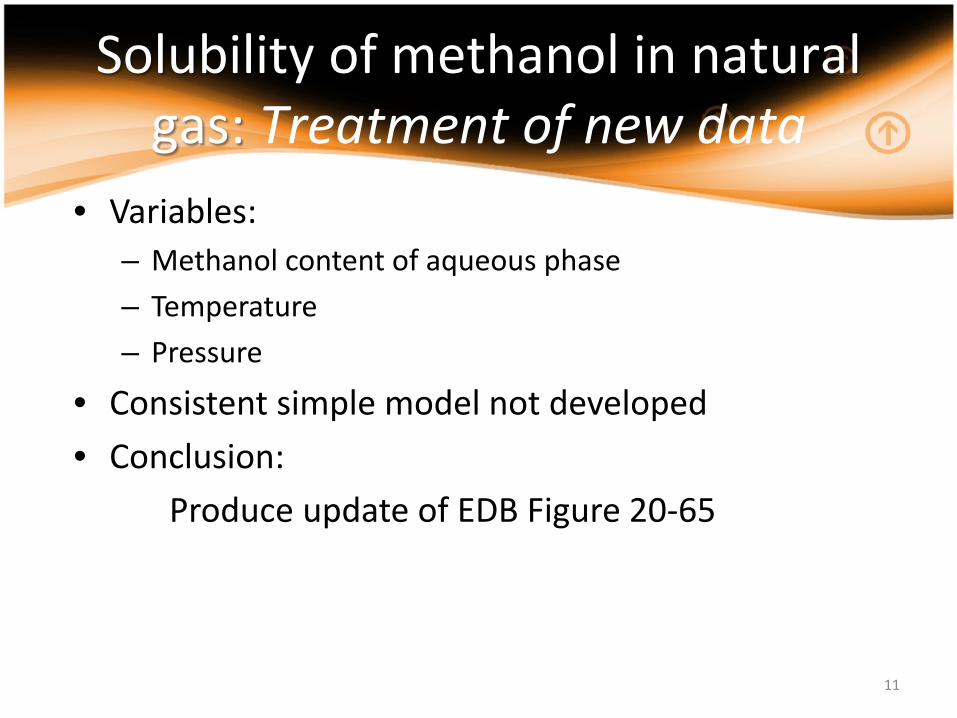
Solubility of methanol in natural gas: Treatment of new data
• Variables: – Methanol content of aqueous phase – Temperature – Pressure
• Consistent simple model not developed • Conclusion: Produce update of EDB Figure 20-65
11

12

Solubility of methanol in hydrocarbon liquids (975-7)
13
Mol
% M
eOH
in H
C Li
quid
Temperature (F)
Wt% MeOH in Aq Liquid

Solubility of methanol in hydrocarbon liquids: Treatment of Data
• Variables: – Methanol content of aqueous phase – Temperature – Composition of HC liquid phase – Pressure – small impact (ignored)
• Express in terms of distribution ratio:
14

Solubility of methanol in hydrocarbon liquids: Treatment of Data
Liquid hydrocarbon phase composition – Typical hydrocarbon components had minor effect
on solubility – Toluene had a significant effect
• Implies that all aromatics will probably be signficant
15

16
Methanol solubility in liquid hydrocarbons: Proposed representation of data. Groups all hydrocarbons except toluene (aromatics).
1
10
100
1000
-50 -30 -10 10 30 50 70 90 110 130
Temperature (oF)
Figure 2. Liquid-Liquid Methanol Distribution Ratios.
No Toluene
28-33mol% Toluene
50-70 mol% Toluene
70-80 mol% Toluene
Distribution of methanol between aqueous and hydrocarbon phases, data from various sources. Hydrocarbon phases includes various alkane and cycloalkane compounds. Data shows the variation of distribution with changes in the amount of toluene in the hydrocarbon phase.

Solubility of CO2 and H2S in TEG & EG: Project 975-8
Importance of Data • H2S and CO2 in gases being dehydrated can dissolve
in the solvent under pressure and then be released to the gas phase during flash and regeneration steps
• Important for a few reasons: – Product Quality – Environmental – Safety – Design of equipment (e.g., flash drum)
17

18
Current EDB Content. Solubility in TEG as function of temperature and H2S or CO2 partial pressure Solubility defined in terms of std vol of gas per gallon solvent

19
Compare with new data. Purple points are expt’l data (scf / gallon) at the T & Pi of the red data point.

Solubility of CO2 and H2S in TEG & EG: Treatment of Data
• Modeling versus graphing – The new data was not amenable to parametric
graphing – Various mathematic models were attempted
• Final model based on one used by source data authors
20

Solubility of CO2 and H2S in TEG & EG: Treatment of Data
• Pi is the partial pressure of the acid gas (component i: CO2 or H2S) Pi = yi P • yi is the mole fraction of acid gas in the vapor phase • xi is the mole fraction of the acid gas in the liquid phase • T is the absolute temperature • xH2O is the mole fraction of water in the liquid phase • P is the absolute pressure • Different A, B, C, D constants for each of the four systems based on data fit
xi can be used to calculate the solubility of CO2 or H2S in units of std vol of gas per volume of solvent
21

22
0.00
0.05
0.10
0.15
0.20
0.25
0.30
0.35
0 0.05 0.1 0.15 0.2 0.25 0.3 0.35
Mod
el o
r Sim
ulat
or P
redi
cted
H2S
con
cent
ratio
n in
Liq
uid
(mol
e fr
ac)
Source Data H2S concentration in Liquid (mole frac)
Figure 9. Solubility of H2S in TEG: Correlation of Reference 2 data with the Model-Generated and Process Simulation Software-Generated Data.
Model
Simulator
SourceData
Correlation plot of model to data Simulation software VLE method: Peng-Robinson

23
0.001
0.01
0.1
1
60 80 100 120 140 160 180 200
CO2
Solu
bilit
y, s
cf C
O2
/ ga
llon
TEG
sol
utio
n
Temperature, °F
FIGURE 10. Approximate Solubility of CO2 in Triethylene Glycol at 50 psia vs. Temperature, H2S Content of Gas Phase, and Water Content of TEG

Solubility of CO2 and H2S in TEG & EG Uses of Data
• Charts and models can be used to estimate the equilibrium content of gases in glycols – Can be used to estimate the uptake of CO2 and
H2S in TEG contactor, and the subsequent release to the gas phase in the flash and regeneration
• Can also use as a check of other models (e.g., simulations)
24

Solubility of Hydrocarbons in Glycols and Amines
• Project 975-5 • Vapor-liquid and liquid-liquid equilbria • Data collection focused on BTEX compounds,
and the differences between similar aromatic and non-aromatics
25

Solubility of Hydrocarbons in Glycols and Amines
Importance of Data
• Predict hydrocarbon absorption from gas during amine and glycol treating
• Vaporization during flash and regen – Equipment design – Product loss – Environmental (VOC, BTEX)
26

Solubility of Hydrocarbons in Glycols
• VLE data for BTEX distribution between TEG and gas phase – Bulk gas phase: methane – Data taken at conditions typical of TEG dehy
regenerator, contactor, and flash drum – Use equilibrium ratios (K values) to represent data
Ki = yi / xi
27

Solubility of Hydrocarbons in Glycols
Benzene, 0 w% Water
Toluene, 0 w% Water
Ethyl Bz, 0 w% Water
o-Xylene, 0 w% Water
Benzene, 5 w% Water
Toluene, 5 w% Water
Ethyl Bz, 5 w% Water
o-Xylene, 5 w% Water
Benzene, 1 w% Water
Toluene, 1 w% Water
EthylBz, 1 w% Water
o-Xylene, 1 w% Water
0
0.01
0.02
0.03
0.04
0.05
0.06
0.07
0.08
0.09
0.1
70 80 90 100 110 120 130
Equi
libriu
m R
atio
y i/x
i
Temperature (°F)
Figure 4.3. Equilibrium Ratios for BTEX in TEG Typical Contactor Conditions
DATA FROM RR-131. PRESSURE: 1000 psiaWATER CONCENTRATION IS FOR GLYCOL LIQUID PHASE
28

Solubility of Hydrocarbons in Amines
• Two data groups: – LLE measurements “solubility limit” – VLE measurements “subsaturation solubility”
• Majority of data taken via LLE measurements – Can be used directly for binary interaction
parameters – Maybe not as directly useful for most gas treating
calculations
29

Solubility of Hydrocarbons in Amines
• Solubility limit data (LLE) – Solubility in terms of SCF vapor / gallon solution – Variables: Temperature, amine, hydrocarbon, water
content of amine – Little variation with pressure above solubility limit
• Solubility limit data can be modeled
S is the solubility limit (SCF/gallon sol’n), W is the amine
concentration, A, B, C values for each amine – hydrocarbon pair
30
Solubility of Hydrocarbons in Amines
0.1
1
10
50 70 90 110 130 150 170 190 210 230 250
Solu
bilit
y Li
mit
of T
olue
ne (s
cf V
apor
/ G
allo
n So
luti
on)
Temperature °F
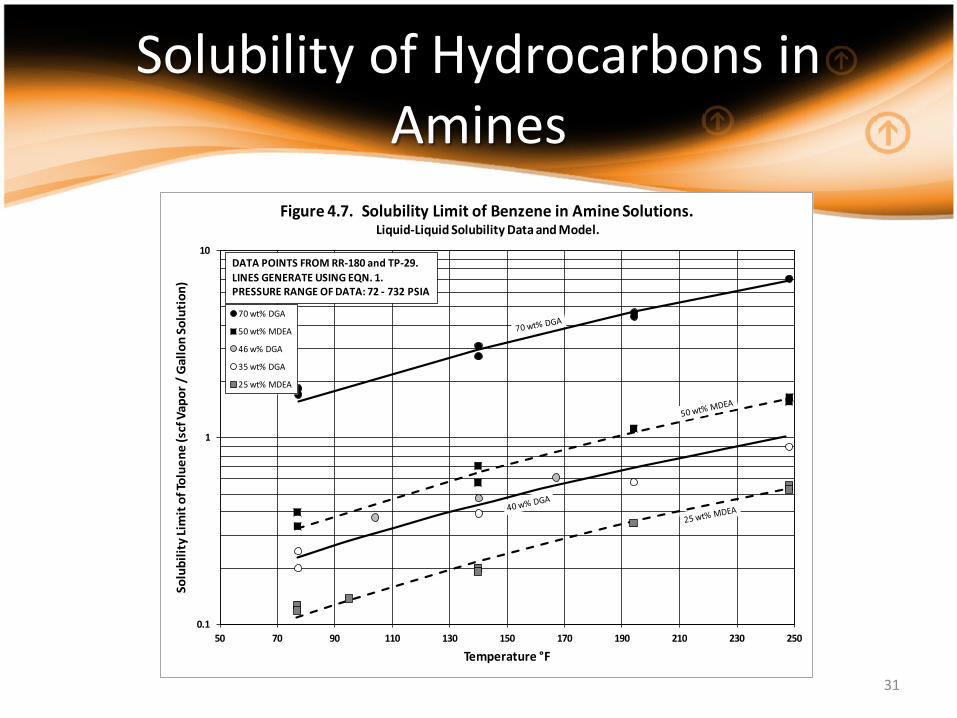
Figure 4.7. Solubility Limit of Benzene in Amine Solutions. Liquid-Liquid Solubility Data and Model.
70 wt% DGA
50 wt% MDEA
46 w% DGA
35 wt% DGA
25 wt% MDEA
DATA POINTS FROM RR-180 and TP-29.LINES GENERATE USING EQN. 1.PRESSURE RANGE OF DATA: 72 - 732 PSIA
31

Solubility of Hydrocarbons in Amines
• VLE data (subsaturation)
– Less data available – Represented as equilibrium ratio (K) values
• Rough approximation: base subsaturation solubility on solubility limit data
32

Solubility of Hydrocarbons in Glycols and Amines
Generic graph showing solubility limit & subsat
33
Conc
entr
atio
n of
hyd
roca
rbon
in a
min
e (a
queo
us)
phas
e
Partial Pressure of Hydrocarbon
Figure 16. General Approximation of Hydrocarbon Solubility.
Constant Temperature
xi,s Solubility Limit
P i*
Satu
ratio
nPr
essu
re
Two Liquid Phases
One Liquid Phase (Aqueous)
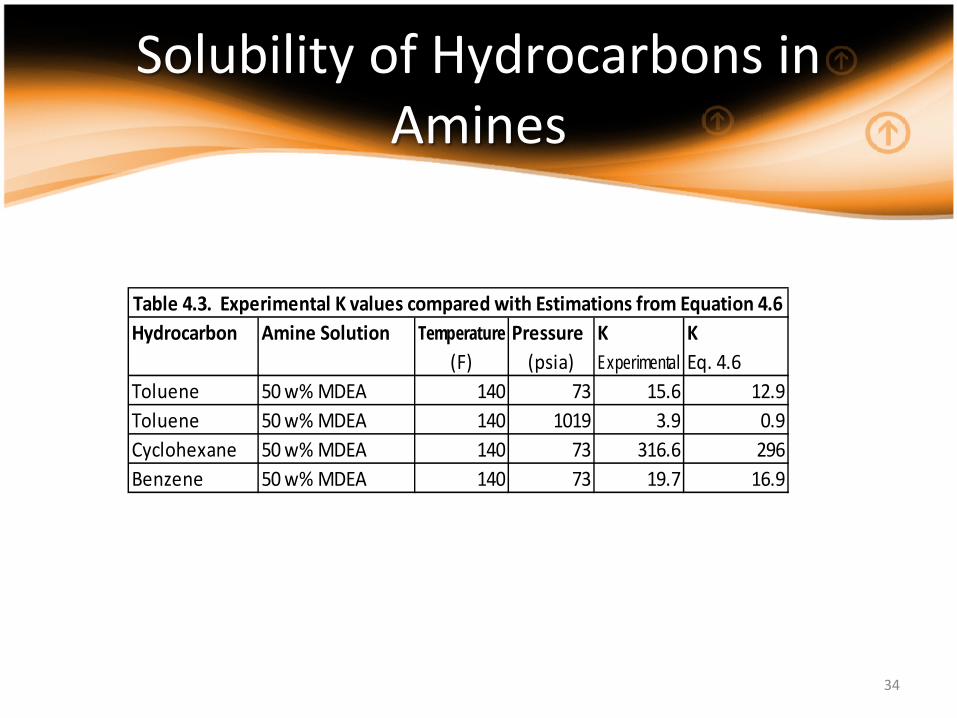
Solubility of Hydrocarbons in Amines
34
Hydrocarbon Amine Solution Temperature Pressure K K(F) (psia) Experimental Eq. 4.6
Toluene 50 w% MDEA 140 73 15.6 12.9Toluene 50 w% MDEA 140 1019 3.9 0.9Cyclohexane 50 w% MDEA 140 73 316.6 296Benzene 50 w% MDEA 140 73 19.7 16.9
Table 4.3. Experimental K values compared with Estimations from Equation 4.6

Conclusions
• See reports (presentation and Research Reports) for: – More data and details, graphs – Discussion of general trends
• Research reports contain reference for the source data
• Updated content submitted for consideration for next version of EDB
35


![SOLUBILITY AND SOLUBILITY PRODUCT - Instruct · SOLUBILITY AND SOLUBILITY PRODUCT [MH 5; 16.1 & 16.2] • In this section we are going to consider the solubility of ionic solids in](https://img.dokumen.tips/doc/110x75/5ae1efb27f8b9a90138bbc8f/solubility-and-solubility-product-instruct-and-solubility-product-mh-5-161.jpg)