Embed Size (px)
Citation preview
Preparing for the OPEB Tsunami
August 22, 2006
National Association of State Auditors, Comptrollers, and Treasurers
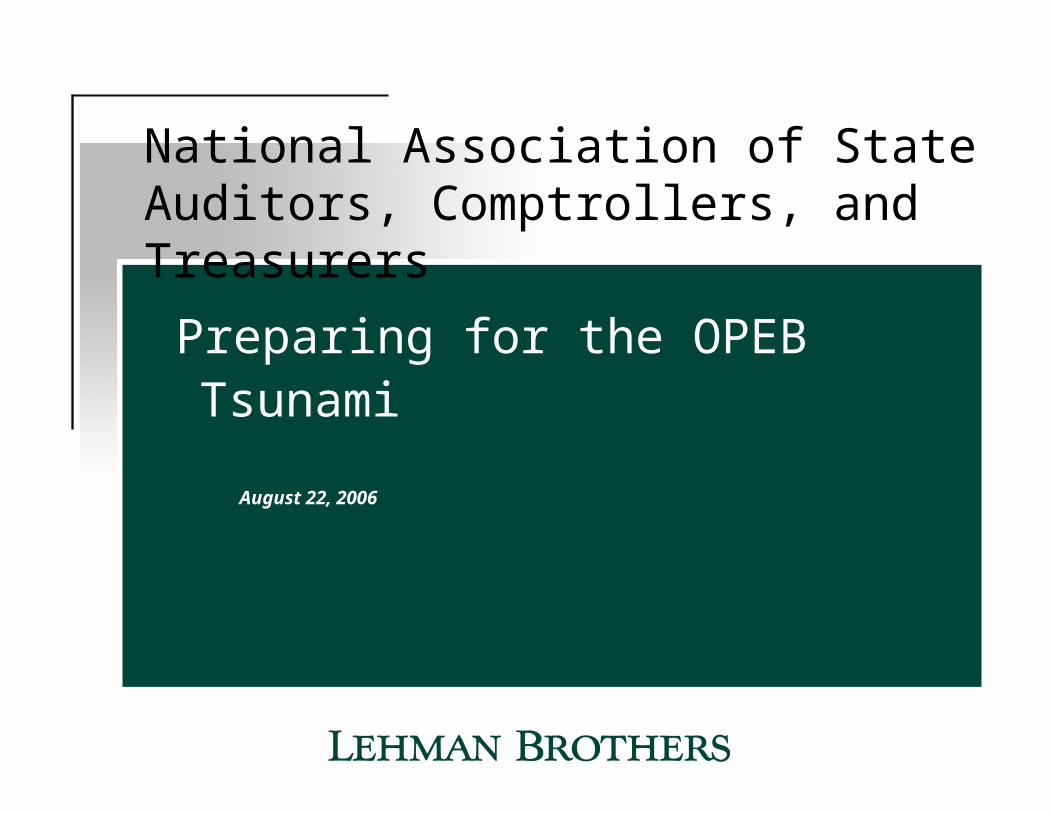
GASB standard aims to recognize the true financial cost of benefits
GASB 45 requires public sector entities to quantify and disclose – but not fund – their OPEB liabilities
Under GASB, liability calculated using discount rate commensurate with funding approach
– Pay-Go plans use “cash” discount rate (3-4%)
– Funded plans can use higher rate reflecting term/asset allocation (6-8%)
– Higher discount rate lower unfunded liability (UAAL)
Under GASB 45, States will be required to account for the cost of OPEB liabilities beginning with financials for FY 2007-08
What You Need to Know
Annual Effective for Fiscal Revenue Years Beginning after:
> $100mm December 15, 2006
$10-$100mm December 15, 2007
<$10mm December 15, 2008
Effective Dates
1
0
500
1,000
1,500
2,000
2,500
3,000
3,500
4,000
4,500
5,000
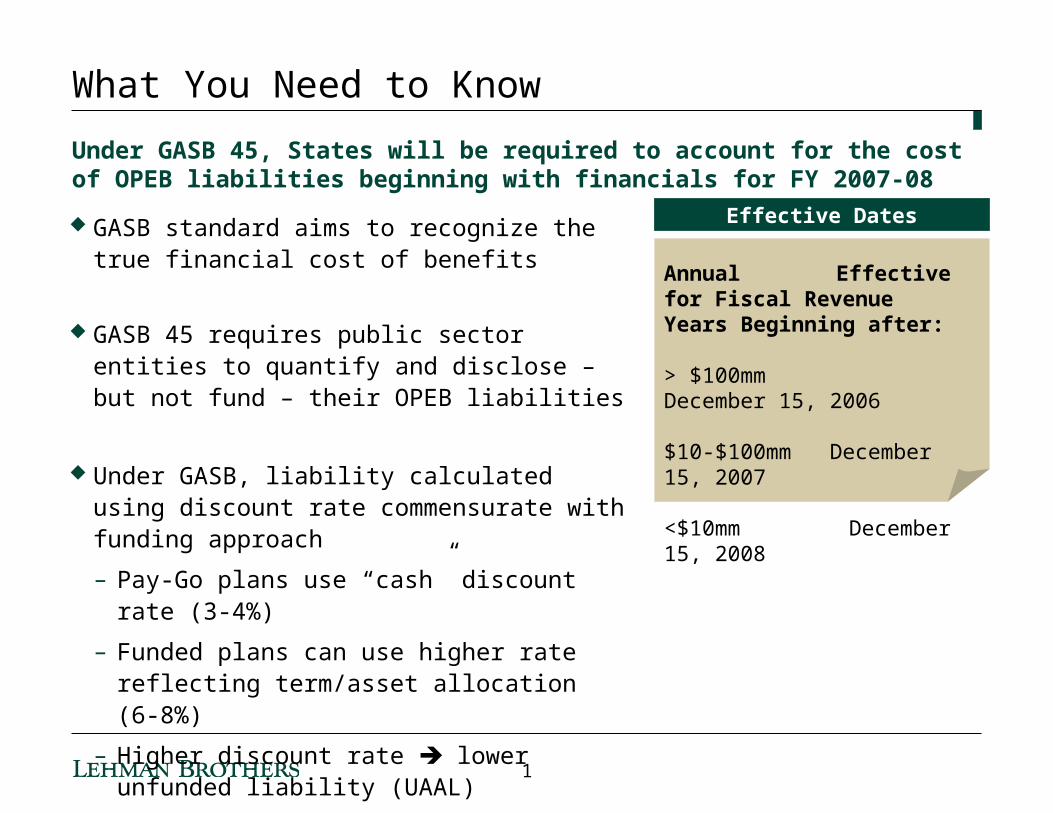
$Billions $4.3 TrillionTotal U.S.
Treasury Debt Outstanding
OPEB Funding Has Moved to the Forefront
Aggregate OPEB UAAL of the U.S. Public Sector estimated at $1 trillion
– Aggregate OPEB UAAL for the S&P 500 ≈ $292 billion
As the baby boomers retire, many issuers’ Pay-Go expense will double or triple over the next 10-15 years
ARC funding may be 3-10x the Pay-Go amount
Putting the OPEB UAAL in Perspective
$1.9 TrillionTotal U.S.
Municipal Debt Outstanding
$292 BillionEstimated S&P
500 OPEB UAAL
$1 TrillionEstimated U.S. Public Sector OPEB UAAL
2
0
50
100
150
200
250
300
350
2005 2015 2025 2035 2045 2055
$Mill ions
ARC = Normal Cost + UAAL
Pay-Go Cost
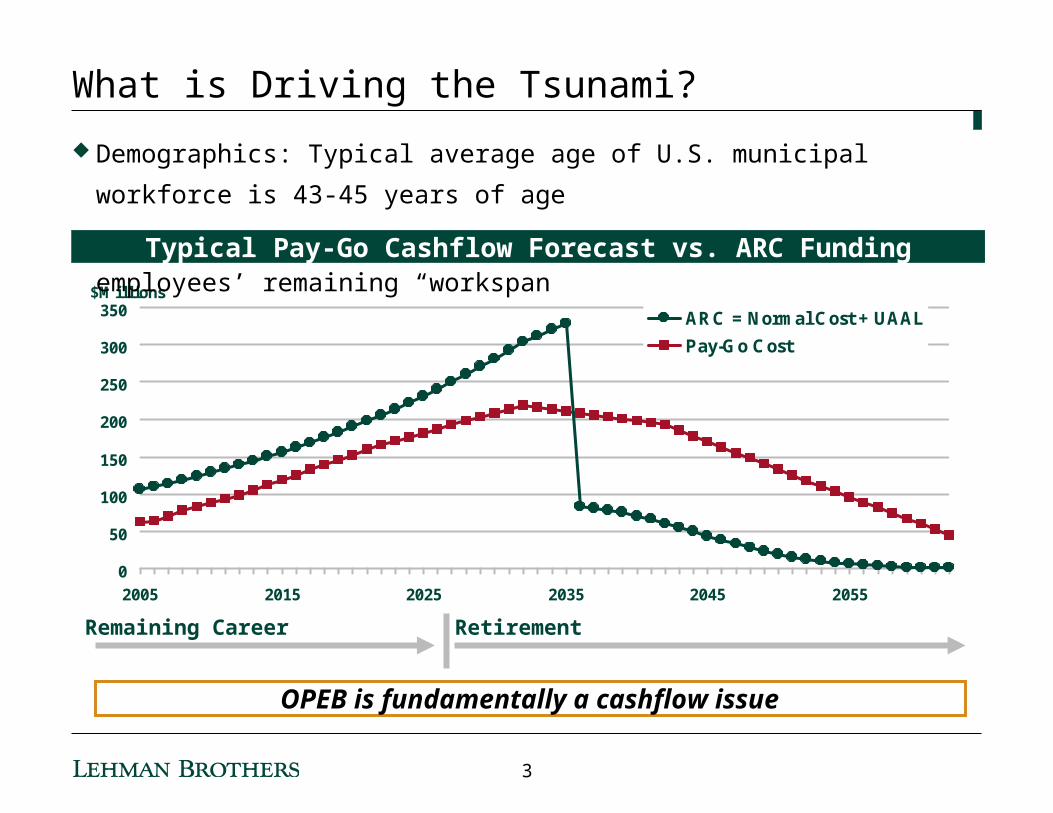
What is Driving the Tsunami?
Demographics: Typical average age of U.S. municipal workforce is 43-45 years of age
GASB’s rules compress a lifespan of benefits into employees’ remaining “workspan”
OPEB is fundamentally a cashflow issue
Typical Pay-Go Cashflow Forecast vs. ARC Funding
Remaining Career Retirement
3
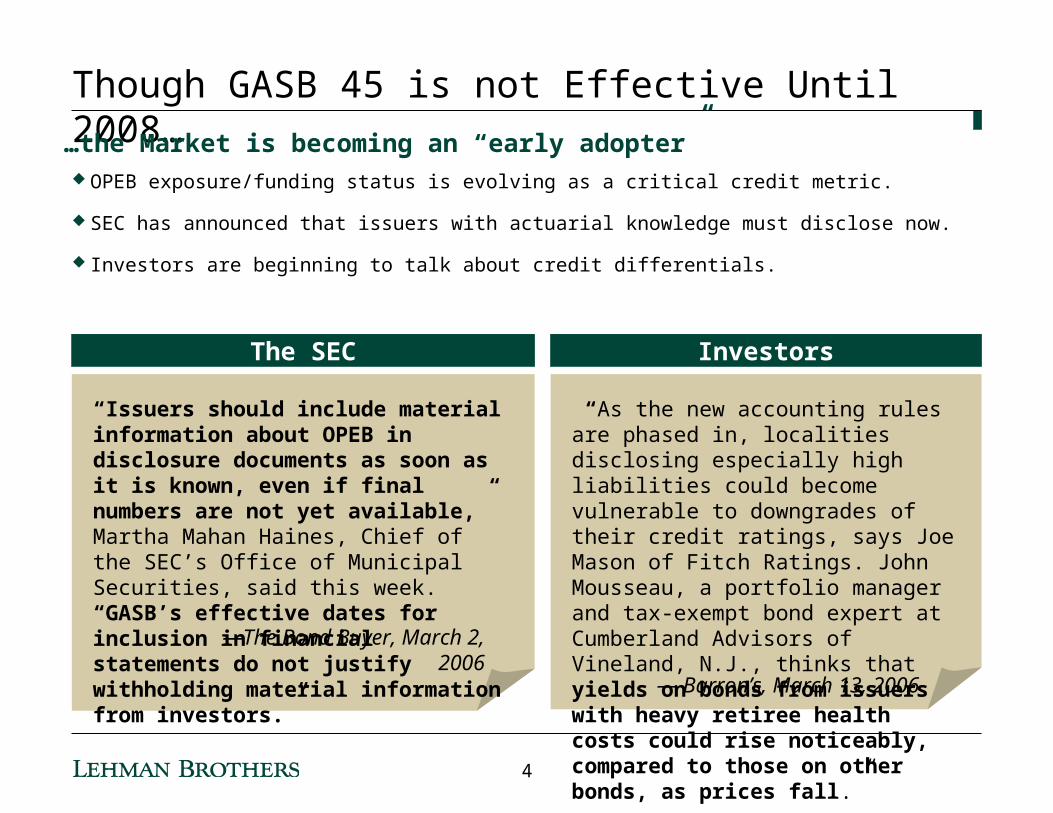
Though GASB 45 is not Effective Until 2008…
OPEB exposure/funding status is evolving as a critical credit metric.
SEC has announced that issuers with actuarial knowledge must disclose now.
Investors are beginning to talk about credit differentials.
…the Market is becoming an “early adopter”
“Issuers should include material information about OPEB in disclosure documents as soon as it is known, even if final numbers are not yet available,” Martha Mahan Haines, Chief of the SEC’s Office of Municipal Securities, said this week. “GASB’s effective dates for inclusion in financial statements do not justify withholding material information from investors.”
—The Bond Buyer, March 2, 2006
“As the new accounting rules are phased in, localities disclosing especially high liabilities could become vulnerable to downgrades of their credit ratings, says Joe Mason of Fitch Ratings. John Mousseau, a portfolio manager and tax-exempt bond expert at Cumberland Advisors of Vineland, N.J., thinks that yields on bonds from issuers with heavy retiree health costs could rise noticeably, compared to those on other bonds, as prices fall.”
— Barron’s, March 13, 2006
InvestorsThe SEC
4
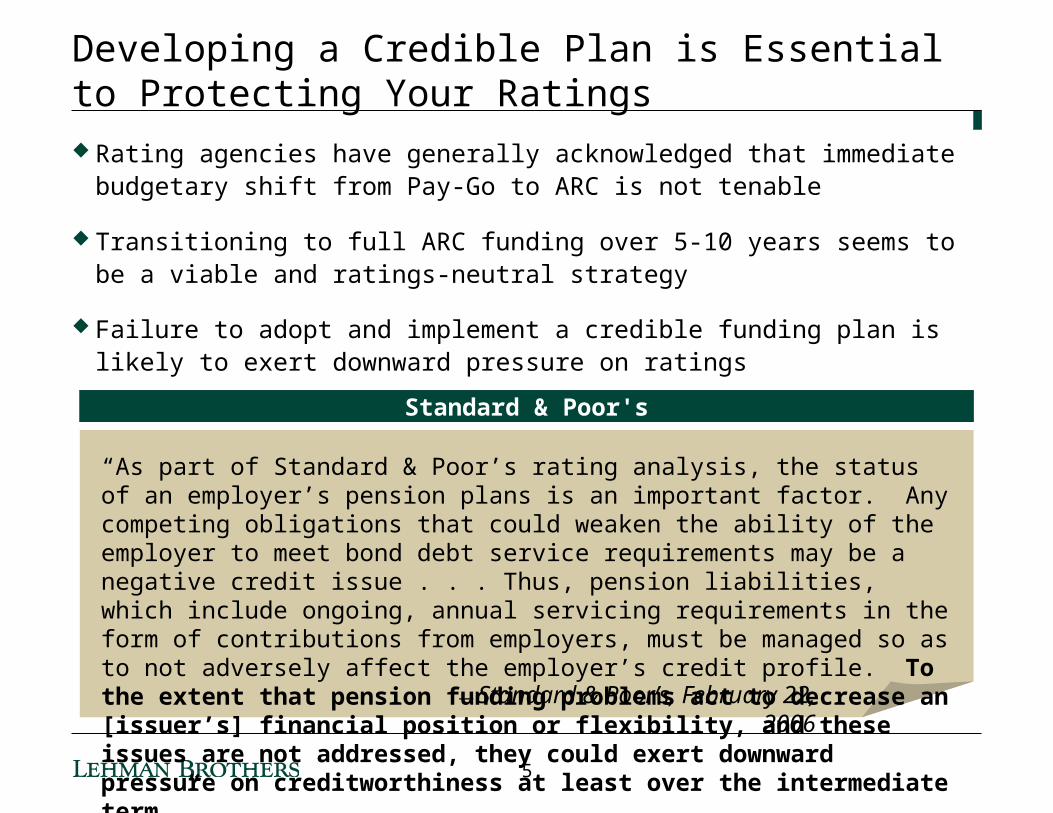
Developing a Credible Plan is Essential to Protecting Your Ratings Rating agencies have generally acknowledged that immediate budgetary shift from
Pay-Go to ARC is not tenable
Transitioning to full ARC funding over 5-10 years seems to be a viable and ratings-neutral strategy
Failure to adopt and implement a credible funding plan is likely to exert downward pressure on ratings
“As part of Standard & Poor’s rating analysis, the status of an employer’s pension plans is an important factor. Any competing obligations that could weaken the ability of the employer to meet bond debt service requirements may be a negative credit issue . . . Thus, pension liabilities, which include ongoing, annual servicing requirements in the form of contributions from employers, must be managed so as to not adversely affect the employer’s credit profile. To the extent that pension funding problems act to decrease an [issuer’s] financial position or flexibility, and these issues are not addressed, they could exert downward pressure on creditworthiness at least over the intermediate term.”
Standard & Poor's
— Standard & Poor’s, February 22, 2006
5
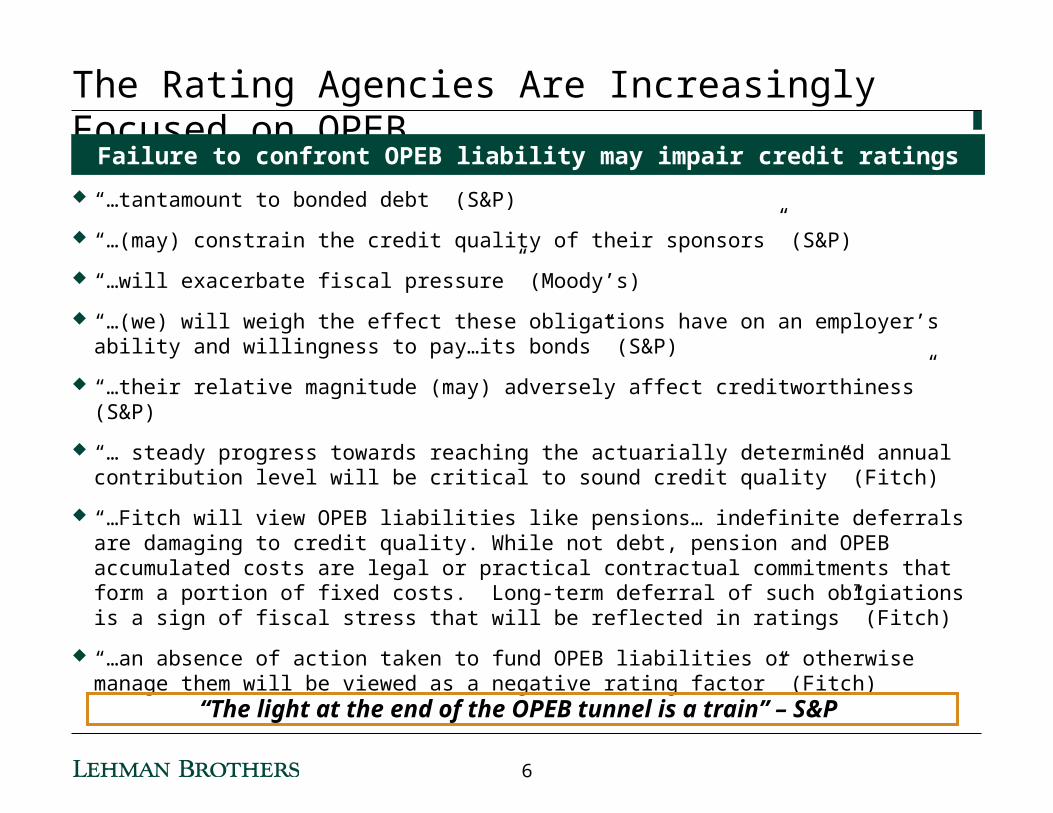
The Rating Agencies Are Increasingly Focused on OPEB
“…tantamount to bonded debt” (S&P)
“…(may) constrain the credit quality of their sponsors” (S&P)
“…will exacerbate fiscal pressure” (Moody’s)
“…(we) will weigh the effect these obligations have on an employer’s ability and willingness to pay…its bonds” (S&P)
“…their relative magnitude (may) adversely affect creditworthiness” (S&P)
“… steady progress towards reaching the actuarially determined annual contribution level will be critical to sound credit quality” (Fitch)
“…Fitch will view OPEB liabilities like pensions… indefinite deferrals are damaging to credit quality. While not debt, pension and OPEB accumulated costs are legal or practical contractual commitments that form a portion of fixed costs. Long-term deferral of such oblgiations is a sign of fiscal stress that will be reflected in ratings” (Fitch)
“…an absence of action taken to fund OPEB liabilities or otherwise manage them will be viewed as a negative rating factor” (Fitch)
“The light at the end of the OPEB tunnel is a train” – S&P
Failure to confront OPEB liability may impair credit ratings
6
Quantify exposure through Actuarial Valuation
1.
Developing an OPEB StrategyBonds are the tail of the OPEB dog
Re-evaluate benefits package in context of Employer’s ability to pay/ taxpayers’ expectations of services (“something’s gotta give”)
2.
Consider financing and reinvestment alternatives
4.
Evaluate funding alternatives:• Pay As You Go• Prefunding • Employer/ Employee ratio• Defined Contribution• Plan Termination• Combination Approach
3.
7
How Can OPEB Bonds Facilitate a Transition To ARC Funding?
Isolate and address OPEB liability, demonstrating pro-active financial management
– Pay true annual cost of providing OPEB
– Avoid negative ratings action
Create Trust Fund from which benefits can be paid
– Funding “legacy liability” may provide constructive tool to facilitate transition to 2nd tier of benefits
Take advantage of low interest rate environment and GASB’s discounting rules to refinance liability in public market
– Reduce budget impact
Ideal: Normal Cost + UAAL Amortization < Pay-As-You GoAttaining this “ideal” can be challenging for some agencies
8
OPEB Bonds: What’s the Right Metric?
Solve against Pay-Go cashflow?
– The most “real world” scenario
Solve against the ARC?
– Benchmarking against the ARC’s time compressed cashflow may present significant budget challenges
– ARC forces a lifespan of benefits into much shorter funding window
Solve in context of State’s macro-financial picture?
– Level % of Budget
– “Sculpted” debt service
9
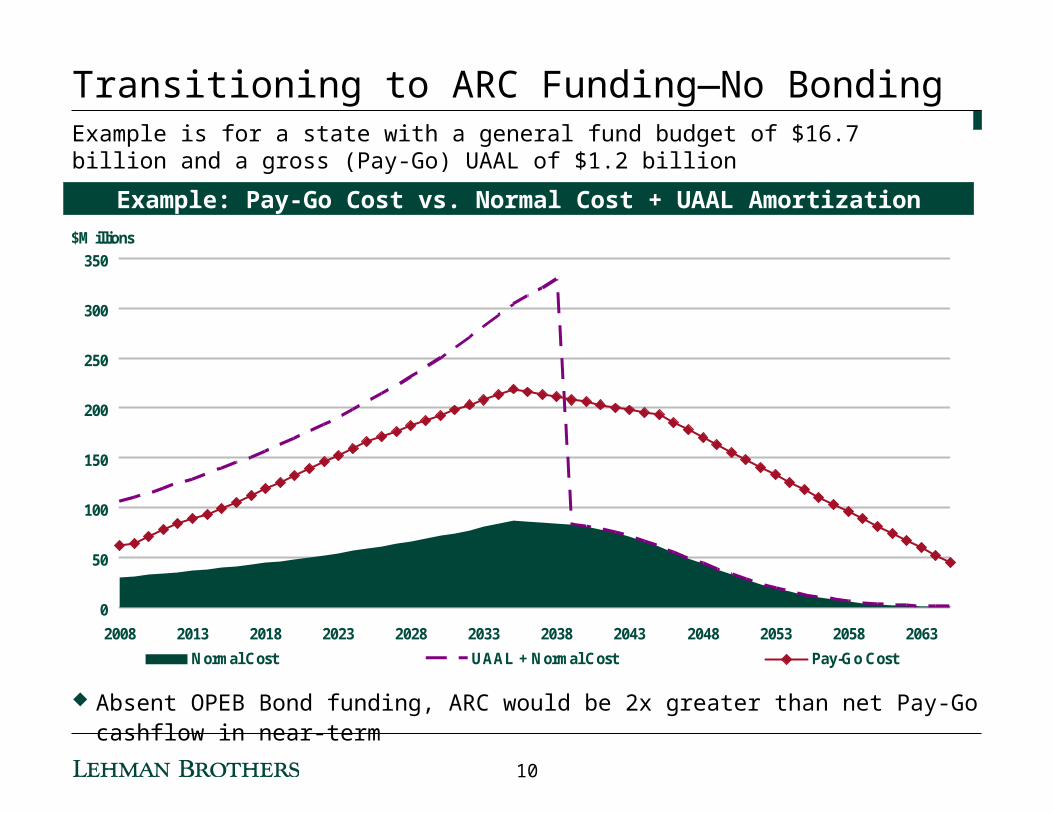
Transitioning to ARC Funding—No Bonding
Absent OPEB Bond funding, ARC would be 2x greater than net Pay-Go cashflow in near-term
0
50
100
150
200
250
300
350
2008 2013 2018 2023 2028 2033 2038 2043 2048 2053 2058 2063
$Millions
Normal Cost UAAL + Normal Cost Pay-Go Cost
Example: Pay-Go Cost vs. Normal Cost + UAAL Amortization
Example is for a state with a general fund budget of $16.7 billion and a gross (Pay-Go) UAAL of $1.2 billion
10
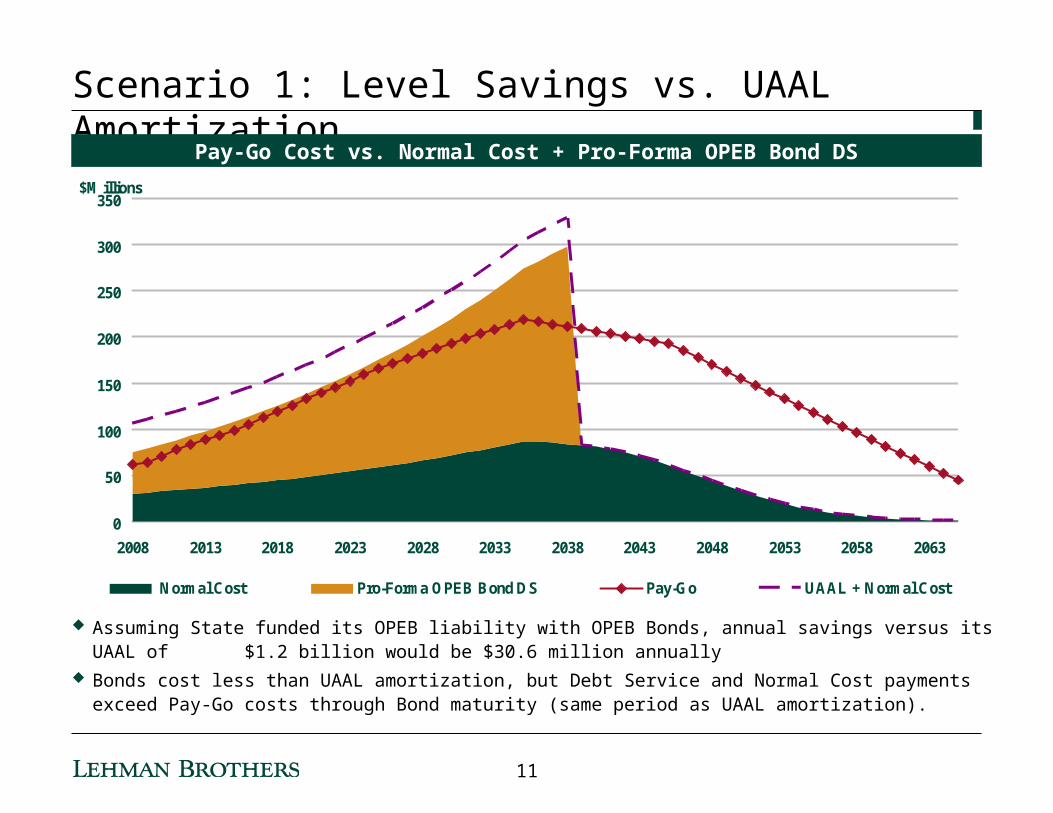
Scenario 1: Level Savings vs. UAAL Amortization
Assuming State funded its OPEB liability with OPEB Bonds, annual savings versus its UAAL of $1.2 billion would be $30.6 million annually
Bonds cost less than UAAL amortization, but Debt Service and Normal Cost payments exceed Pay-Go costs through Bond maturity (same period as UAAL amortization).
0
50
100
150
200
250
300
350
2008 2013 2018 2023 2028 2033 2038 2043 2048 2053 2058 2063
$Millions
Normal Cost Pro-Forma OPEB Bond DS Pay-Go UAAL + Normal Cost
Pay-Go Cost vs. Normal Cost + Pro-Forma OPEB Bond DS
11
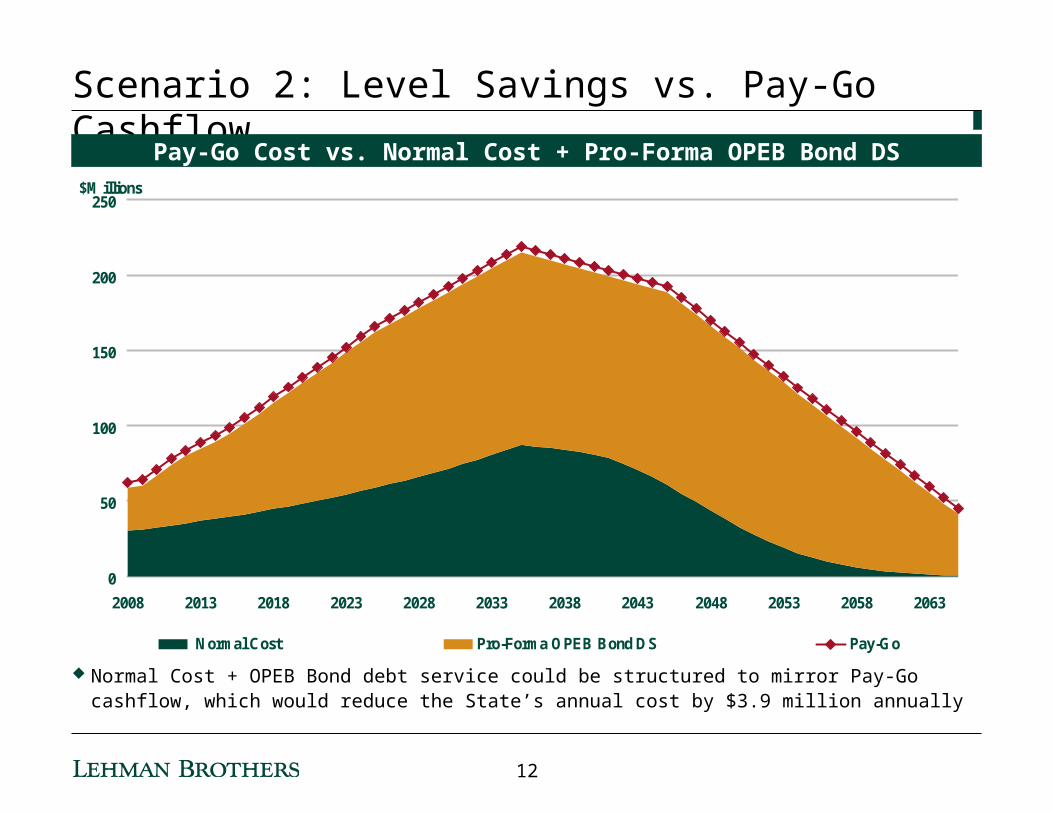
Scenario 2: Level Savings vs. Pay-Go Cashflow
0
50
100
150
200
250
2008 2013 2018 2023 2028 2033 2038 2043 2048 2053 2058 2063
$Millions
Normal Cost Pro-Forma OPEB Bond DS Pay-Go
Pay-Go Cost vs. Normal Cost + Pro-Forma OPEB Bond DS
Normal Cost + OPEB Bond debt service could be structured to mirror Pay-Go cashflow, which would reduce the State’s annual cost by $3.9 million annually
12

Scenario 3: POBs Structured at Level Percentage of Budget
0
50
100
150
200
250
300
350
400
2008 2013 2018 2023 2028 2033 2038 2043 2048 2053 2058 2063
$Millions
Normal Cost Pro-Forma OPEB Bond DS Pay-Go
Pay-Go Cost vs. Normal Cost + Pro-Forma OPEB Bond DS
Assuming ARC funding levels, State would pay 0.63% of General Fund revenues (with 4% annual revenue growth assumed).
13
$0
$2,000,000
$4,000,000
$6,000,000
$8,000,000
$10,000,000
$12,000,000
$14,000,000
2006 2011 2016 2021 2026 2031 2036 2041 2046 2051 2056 2061 2066 2071 2076 2081
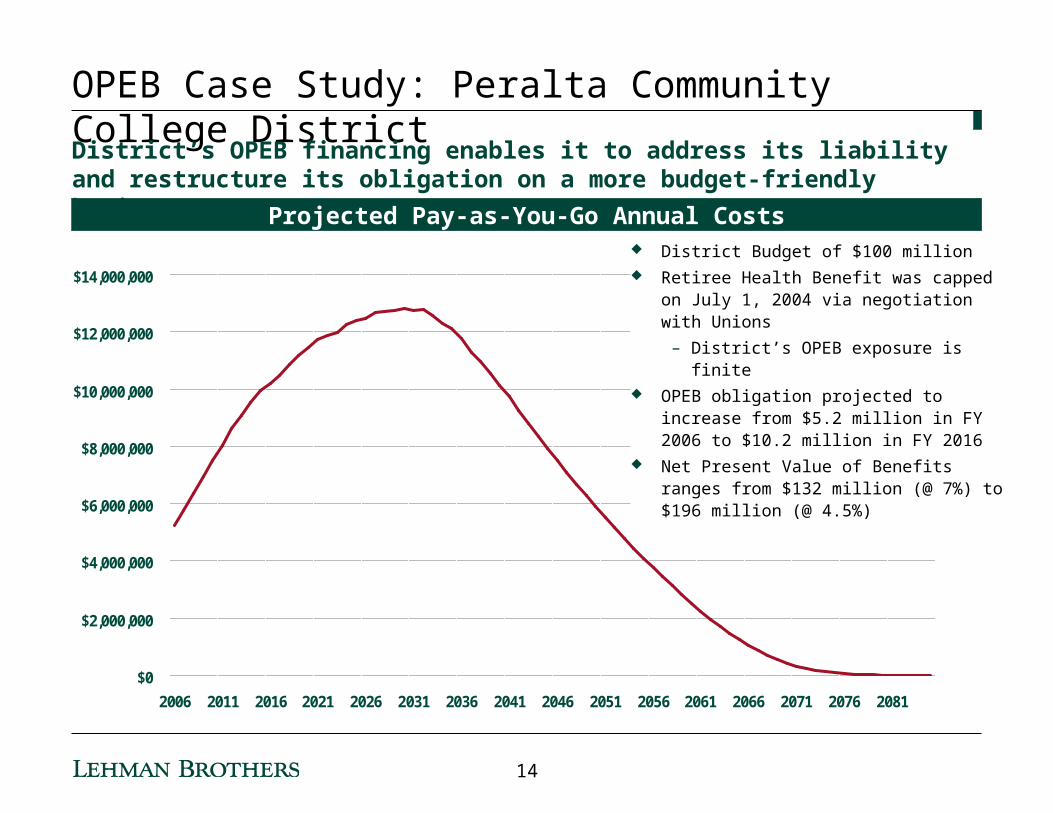
OPEB Case Study: Peralta Community College District
Projected Pay-as-You-Go Annual Costs
District’s OPEB financing enables it to address its liability and restructure its obligation on a more budget-friendly basis.
District Budget of $100 million Retiree Health Benefit was capped on
July 1, 2004 via negotiation with Unions
– District’s OPEB exposure is finite OPEB obligation projected to increase
from $5.2 million in FY 2006 to $10.2 million in FY 2016
Net Present Value of Benefits ranges from $132 million (@ 7%) to $196 million (@ 4.5%)
14

Peralta Bond Structure Creates Manageable Annual Cost
Structure enables District to: – Fund its OPEB liability
– Maintain contributions at a constant and reasonable percentage of General Fund Revenues
– Retain future callability
Debt service structured assuming 2.5% annual growth in General Fund Revenues
$20MM of Current Interest Bonds and $133.7MM of Convertible Auction Rate Securities (CARSSM)
– 6 series of CARSSM minimizes interest rate risk
District will contribute a constant percentage of General Fund Revenues towards debt service.
0.00%
1.00%
2.00%
3.00%
4.00%
5.00%
6.00%
7.00%
8.00%
9.00%
10.00%
2007 2012 2017 2022 2027 2032 2037 2042 2047
Pay-Go Costs OPEB Debt Service
Debt Service & Pay-Go as a % of General Fund Revenues1
OPEB Debt Service is a constant 7% of GF Revenues at
2.5% Annual Growth
________________1. General Fund Revenues grown at 2.5% annually.
15
Conclusion
OPEB is the next financial tidal wave facing the public sector
Although GASB does not require governments to fund these liabilities, the market will be “the enforcer”, requiring plan sponsors to develop viable funding plans
OPEB bonds can be a constructive component of a funding plan, but bonds are a tool, not a strategy
Given effective dates of GASB 45, prevailing workload of actuaries, and complexity of valuation process,
the time to start is NOW.
16
Contact Information
Robert Larkins
Managing Director
Phone: (415) 274-5355
Email: [email protected]
Barbara A. Lloyd
Senior Vice President
Phone: (310) 481-4963
Email: [email protected]
Elizabeth Yee
Vice President
Phone: (212) 526-8863
Email: [email protected]
17