Embed Size (px)
Citation preview
f7F91st Congress \ JOINT COXIITTEE PRINT
2d Session J
THE ECONOMY, ENERGY, AND THE
ENVIRONMENT
A BACKGROUND STUDY
PREPARED FOR THE USE OF THE
JOINT ECONOMIC COMMITTEE
CONGRESS OF THE UNITED STATES
BY THE ENVIRONMENTAL POLICY DIVISION
LEGISLATIVE REFERENCE SERVICE
LIBRARY OF CONGRESS
SEPTEMBER 1, 1970
Printed for the use of the Joint Economic Committee
U.S. GOVERNMENT PRINTING OFFICE
46-366 0 WASHINGTON: 1970
For sale by the Superintendent of Documents, U.S. Government Printing OfficeWashington, D.C. 20402 -Price 55 cents
JOINT ECONOMIC COMMITTEE[Created pursuant to sec. 5(a) of Public Law 304, 79th Cong.]
WRIGHT PATMAN, Texas, ChairmanWILLIAM PROXMIRE, Wisconsin, Vice Chairman
HOUSE OF REPRESENTATIVES SENATERICHARD BOLLING, Missouri JOHN SPARKMAN, AlabamaHALE BOGOS, Louisiana J. W. FULBERIGHT, ArkansasHENRY S. REUSS, Wisconsin HERMAN E. TALMADGE, GeorgiaMARTHA W. GRIFFITHS, Michigan STUART SYMINGTON, MissouriWILLIAM S. MOORHEAD, Pennsylvania ABRAHAM RIBICOFF, ConnecticutWILLIAM B. WIDNALL, New Jersey JACOB K. JAVITS, New YorkW. E. BROCK 3D, Tennessee JACK MILLER, IowaBARBER B. CONABLE, JR., New York LEN B. JORDAN, IdahoCLARENCE J. BROWN, Ohio CHARLES H. PERCY, Illinois
JOHN R. STARK, Ezecutive DirectorJAMES W. KNcOWLES, Director of Research
ECONOMISTS
LOUGHL5N F. MCHUGH JOHN R. KARLIs RICHARD F. KAUFMANCOURTENAY M. SLATER
Minority: DOUGLAS C. FRECHTLING GEORGE D. KRUMBHAAR
(II)
LETTERS OF TRANSMITTAL
SEPTEMBER 1, 1970.To the members of the Joint Economic Committee:
Transmitted herewith for your use is a background study preparedat the committee's request by the Legislative Reference Service ofthe Library of Congress, entitled "The Economy, Energy, and theEnvironment." This study surveys the existing literature relating tovarious technical aspects of electric power production, with primaryemphasis on the supply of the various fuels used in the production ofelectricity and on the environmental consequences of energyconversion.
The committee requested this study in order that the members mighthave needed background material conveniently available as we under-take our investigation of the economic aspects of electrical power pro-duction. As we proceed in our study, I anticipate that, with the assist-ance of the committee staff and of such experts as we may call totestify, we will be examining such aspects of energy production aspricing and advertising policies, regulatory policy, credit requirements,research needs, and means of achieving adequate electrical suppliesin a manner consistent with preservation of our natural environment.
The study transmitted herewith was not designed to cover all ofthese economic questions in depth, but to provide the background in-formation on which to build our further study. On behalf of the com-mittee, I express our appreciation for the fine service rendered by theEnvironmental Policy Division of the Legislative Reference Servicein preparing this study.
Opinions or conclusions expressed in this study should not be takennecessarily to represent the views of members of the Joint EconomicCommittee or of the committee staff.
Sincerely,WRIGHT PATMAN,
Chairman, Joint Economic Committee.
THE LIBRARY OF CONGRESS,LEGISLATIVE REFERENCE SERVICE,
Washington, D.C., August 31, 1970.Hon. WRIGHT PATMAN,Chairman, Joint Economic Committee,U.S. House of Representatives, Washington, D.C.
DEAR MR. CHAIRMAN: I am pleased to transmit herewith a report"The Economy, Energy, and the Environment" prepared at yourrequest in our Environmental Policy Division under the direction ofMr. Richard A. Carpenter, Chief. As you suggested, we have surveyedthe major recent literature concerning the growth and compositionof energy conversion and its environmental impact, with primary
(m)

IV
emphasis on electricity generation and the fuels for this industry.The sections on electricity were written by Dr. Warren H. Donnelly,specialist in the Science Policy Research Division. The review offuels availability was prepared by Dr. John K. Rose, senior specialistin natural resources and conservation.
Sincerely,LESTER S. JAYSON,
Director, Legislative Reference Service.

CONTENTS
PageLetters of transmittal - __-- __--____--______-_____-_-__---- I]An overview - -
Energy- - 1Energy and the society and economy of the United States- 5The situation for electrical energy - - 7Issues of energy, electricity, and the environment - -11Congressional interest in environmental pollution - -17
Is there an energy gap? -- 18An overview - -18Some views - -18Some reported power shortages - -19Prospects for future shortages - -21Construction delays as a factor - -21Delays in transmission facilities - -22
Energy for the electricity industry - -24Supply-demand forecasts and their fallibilities - - 24Year 2000 estimates -- 25Fossil fuels for the electricity industry - -30The competitive situation of fossil and nuclear fuels-by region 31Coal for electricity -- 32
Adequacy of coal resources -- ------- 33The geological survey of 1967 - -33Recoverable coal resources - -35Geographic location -- 35
Strip mining of coal -- 38Strip-mining technology - -40Strip mining will increase - -40Adequacy of production - ---- 40
Environmental effects of strip mining - -42Extent of strip mining -- 45Cost of reclaiming strip mines - -45Limitations upon reclamation - -45Regulation of strip mining - -46
Underground mining -- 46Environmental effects -- 46
O il-- 46Oil and total energy -- 46The world supply situation - -47Oil for electricity -- 51
Exploration and reserves - -51The decline in U.S. drilling for oil - -53Present balance of reserves and demand - -54
Environmental effects of oil production- 55Effects of oil operations at sea - -56Effects of oil operations on land - -56
Regulation - -58A go slow policy for offshore drilling? - -58
Natural gas ----- 58Supply and demand -- 59The possibility of shortage - -60Environmental effects of producing natural gas - -62
Nuclear fuels -- 62Domestic uranium resources - -63Uranium requirements -- 65Uranium mining - -65Uranium processing -- 66Environmental effects of uranium mining - -66
Hazards of uranium mining - -66Wastes from uranium milling - -- 67
Regulation of uranium production - -68
(V)
VI
Energy for the electricity industry-Continued PageHydropower -68
Environmental effects -68Imported electricity -69
The electricity industry -70The electricity industry in 1964 -70The organization of the electricity industry -70Components of electric power supply -71The electricity industry today -72
Users of electricity -72Electric utility sales -73Residential sales -73
Patterns for 1980-The FPC forecast of 1964 -74Projected capacity -75Cost of generating electricity -76Mine-mouth generation -76Size of generating units -77
Financing the growth of the electricity industry -77Patterns of capital expenditures -78Sources of capital -79External financing -80
Financing the energy industries -80Trends in the electricity industry -81
Prospects for growth-1964 -- --------------------------- 81Current projections of electric power requirements -81Current forecasts of generating capacity -82The price and cost of electricity -83The importance of low cost electricity -84Component costs of electricity -85A pessimistic recent estimate -_--- - -- - _ 87Technological trends in the electricity industry -87
Magnetohydrodynamic generation of electricity -88Increasing size of powerplants -88The trend toward nuclear power -90
Environmental effects of generating electricity and their economic impli-cations -92
Conversion of heat energy into electricity -92Wastes from steam-electric generating plants -93Waste heat -93
Removal of waste heat from a powerplant -93Heat and water quality -94
Effects upon water life -95Physical effects -96
Regulation of waste heat in water -96Provisions of the Water Quality Act -96State thermal criteria for waste heat -96Turkey Point and Federal regulation -97
Byproduct use of waste heat -97Dissipation of waste heat to the environment -98
Cooling ponds and lakes -98Cooling towers -99
Evaporative cooling towers -99Environmental effects of evaporative cooling towers- 99Water requirements of cooling towers -99Water pollution from cooling towers -99
Dry cooling towers -100Environmental effects of dry cooling towers -100
Costs of cooling tower systems -100Cooling water requirements -101
VII
Environmental effects-Continued PageAirborne wastes from electrical powerplants -102
Sulfur oxides -102Effects of sulfur oxides -102Regulation of sulfur oxides -103
Federal legislation -103State legislation -103State regulation -103Action in California -104
Technological alternatives to reduce sulfur dioxide emissions. 104Use of low sulfur fuels -104
Low sulfur coal -104Low sulfur fuel oil -105Gas -105
Removal of sulfur from fuels -106Removal of sulfur during combustion -106Improving the combustion of coal -107Dispersing and diluting sulfur emissions in the air -107
Nitrogen oxides -108Effects of nitrogen oxides -108Regulation of nitrogen oxides -108Control systems -108Cost of control -108
Solid wastes from powerplants -108Effects of fly ash -109Regulation of particulate emission -109Control of particulate emissions -109
Radioactive wastes from nuclear power -109Effects of radioactive wastes -110Regulation of radioactive wastes -111Consequences of a major nuclear accident -112Disposal of high level radioactive wastes -112
Environmental aspects of transmitting electricity -114Primary functions of a transmission system -114Some effects of transmission systems -114Technological trends in transmission systems -115Forecasts for transmission lines -115
The FPC report of 1967 -115The current forecast -116
Environmental effects of transmission lines -116Regulation of transmission lines -117Corrective measures -117
Underground transmission -117Multiple land use -- 117
The Electric Power Council on the Environment -118Appendix I. Electric power, fuels development and protection of the en-
vironment: legislation introduced in the 91st Congress -119Appendix II. Hearings relating to environmental matters -126Appendix III. Selected articles on energy development -129
TABLES
1. Total horsepower of all prime movers: 1940-68- 22. Consumption of energy resources, by major consumer group: 1963,
1965, and 1967 ----------------------- 23. Primary energy sources and production of electricity, 1950, and a
possible pattern of sources and production, 1975 -254. Electric energy production and installed generating capacity, by class
of ownership and type of prime mover: 1940-68 -265. Resources used to generate electricity -266. Projections of domestic energy consumption -277. U.S. energy and petroleum requirements for 1980 -27

VIII
Page8. Forecasts of total energy requirements -289. Forecasts of U.S. electric utilities fuel requirements -29
10. Weighted average of fuel costs for electricity generation, 1960-68 3011. Consumption of fossil fuels, 1960-68 -3112. Total estimated remaining coal resources of the United States,
January 1, 1967 -3413. Coal-production, by States: 1941-67 -3514. Production of coal by stripping in the United States in 1965, by State 3815. Number of strip pits in the United States reporting production of
bituminous coal and lignite in 1965, by tonnage category and State- - 3916. Estimated original resources of stripping coal in the United States
in beds generally less than 100 feet below the surface -4117. Estimated remaining coal reserves of the United States, by rank,
sulfur content, and State on January 1, 1965 -4318. Producing oil wells in the United States and average production per
well per day, by States, 1966-67 -4919. States' share of total U.S. crude oil output, 1967 -5020. Estimates of proved crude-oil reserves in the United States on Decem-
ber 31, 1967, by States -5421. Natural gas-production, 1940-67, and reserves, 1965-67, by States- 6022. U.S. natural gas reserve-Production history -6123. Exploration statistics - -------------------------------- 6124. Natural uranium resources -6325. Uranium ore reserves -6426. Water power-developed, 1950, 1960, and 1967, and estimated
undeveloped, 1967, States -6927. Number of systems, generating capacity, and customers served by
U.S. electric power industry, by ownership segment, 1962 -7128. Composition of the U.S. power industry by size and ownership, 1962 7129. Total delivered cost of power-1962 -7230. Selected indicators for the pluralistic electric utility industry -7231. Electric utility sales ------------- 7332. Average residential use and residential sales -7433. Estimated U.S. generating capacity 1980 -7534. Estimated 1975-80 cost of bulk power generated at large baseload
thermal stations delivered to load centers -7735. Total electric power system capital expenditures -7836. Capital expenditures in the electricity industry, 1960-85 -7937. Sources of construction funds, investor-owned electric utilities, 1950-62 7938. Electric utility requirements and supply, 1965-90 -8339. Price of electricity by region -8440. Total delivered cost of power-1962 -8541. Component costs of power supply - 8642. Composition of total cost of electric power-total industry-1962 actual
and 1980 estimated -8643. Cost of electricity for nuclear plants in 1976 versus coal plants in 1975 8744. Maximum sizes of generating units in the United States -8845. Number and size of large powerplants put into operation, 1958-68 --- 8946. Forecast of powerplant sizes - -- 8---------------- 8947. Comparative costs of cooling water systems for steam-electric plants- 10048. Sources of air pollution -10249. Maximum transmission voltages in the United States -11550. Projected total installation of major transmission lines -116
FIGURES
1. Consumption of energy resources by major consumer group, 1963, 1965,and 1967 ---------------------------------------------- 3
2. Coal fields of the conterminous United States ------------ 363. Remaining coal resources of the United States as determined by map-
ping and exploration, January 1, 1967, by States, according to tonnageand heat value --------------------- 37
4. Production of crude petroleum in the United States, by principal pro-ducing States ----------------- 50
5. Occurrence of oil and gas in the United States -- -- ---------- 57

THE ECONOMY, ENERGY, AND THE ENVIRONMENT
AN OVERVIEW
ENERGY
Our civilization and economy differ from those of early times inone vital characteristic, which is the enormous use of energy by ourpeople throughout their lives.
Energy is the ability to do work. Power is the rate of doing work.For centuries the only sources of energy wvere the muscles of manand beast, supplemented slightly by energy that could be tappedfrom moving winds and waters. With the invention of the steamengine and the coming of the industrial revolution, modern man beganto use large amounts of energy derived from burning fuels, and thepower output of his machines increased.
A full-grown man is capable of an average power output of aboutMoth of a horsepower during an 8-hour working day, equivalent to anoutput of about 37 watts of electrical energy. Thus, when a childturns on a 150-watt television receiver, he commands electricalenergy equivalent to the energy output of four grown men. As longas human progress depended mostly on the energy of human muscles,there could not be much physical change in the conditions of primitivelife.
Today human labor provides energy for far less than 1 percent ofthe work performed in factories, refineries, and mills in the productionof their products. Literally, our economy and our way of life couldnot continue without use of vast amounts of energy.
One measure of this situation is the increase in the total power forall engines, turbines, and work animals over the past 3 decades.Table 1 shows the increase from 2.7 billion horsepower available inthe United States in 1940 to 17.9 billion for 1968. Of this, enginesin trucks, buses, and automobiles accounted for by far the largestpart, increasing from 2.5 billion horsepower in 1940 to 16.9 billionhorsepower in 1968. Over the same period, the powver of electricgenerating stations increased from 53 million horsepower to 371million horsepower.
(1)

2
TABLE 1.-TOTAL HORSEPOWER OF ALL PRIME MOVERS: 1940-68
[in thousands. As of January, except as noted. Prior to 1960, excludes Alaska and Hawaii, except as noted. Prime moversare mechanical engines and turbines, and work animals, which originally convert fuels or force (as wind or failing water)into work and power. Electric motors, which obtain their power from prime movers, are excluded to avoid duplication.See also Historical Statistics Colonial Times to 1957, series S 1-141
1968 (pre-Item 1940 1950 1955 1960 1965 liminary)
Total horsepower - 2,773,316 4,867,538 7,158,229 11,007,889 15,096,332 17,912,944
Work animals - --------- 12, 510 7, 040 4,141 2,790 2,000 1,460Inanimate- 2,760,806 4,860,498 7,154,088 11,005,099 15,094,332 17,910,684
Automotive .- 2,511,312 4,403,617 6, 632,121 10, 366, 880 14, 306, 300 16,937, 725Nonautomotive -249,494 456, 881 521,967 638, 219 788, 032 972,959
Factories -21,768 32,921 35,579 42, 000 48,400 52, 000Mines -------------------- 7, 332 22, 000 30, 768 34, 700 40, 300 43, 400Railroads ----------------- 92 361 110, 969 60, 304 46, 856 43 838 57, 607Merchant ships, powered 4 9,408 23, 423 4 24, 155 23,890 24, 015 20, 413Sailing vessels- 4 26 11 4 5 2 2 1Farms -57,472 157,533 207,742 237,020 269,822 290,600Windmills -130 59 59 44 30 24Electrical central stations '. . 53 542 87, 965 137, 576 217, 173 307, 025 371, 756Aircraft5- 4 7,455 4 22, 000 25, 779 36, 534 54, 600 137, 158
1Includes passenger cars, trucks, buses, and motorcycles.2 As of July 1.I Beginning 1965, not strictly comparable with earlier years.' Includes Alaska and Hawaii.o Includes private planes and commerical airliners.Source: Statistical Abstract of the United States, 1969, p. 509.
Another way of looking at use of energy is to ask who is using it.Table 2 and figure 1 show the consumption of energy resources bymajor consumer for the years 1963, 1965, and 1967. The use of energyis rather evenly divided between household and commercial use,industrial use, transportation, and generation of electricity. Industrialuse accounts for almost one-third of the total. The British thermalunit is the standard unit for measuring heat energy and representsthe amount of heat that will increase the temperature of 1 pound ofwater by 1° degree Farenheit.
TABLE 2.-CONSUMPTION OF ENERGY RESOURCES, BY MAJOR CONSUMER GROUP: 1963, 1965, AND 1967
[in trillions of British thermal units, except percentl
Energy inputs Percent distribution
Consumer group 1963 1965 1967 1963 1965 1967(prel.) (pro.)
Total -49, 649 53, 785 58, 853 100. 0 100. 0 100.9
Household and commercial - - 11,059 11,867 13, 025 22.3 23.1 22.1Industrial - -16,225 17,550 18,634 32.7 32.6 31.7Transportation I-- 11,964 12 715 14, 021 24.1 23.6 23. 8Electrical generation, utilities 'i _ 9,663 11, 104 12,875 19.5 20. 6 21. 9Miscellaneous - -738 549 298 1 5 1.0 0. 5Utility electricity purchased - - 3,128 3,600 4,134 (4) (4) (4)
I Includes bunkers and military transportation.2 Represents outputs of hydropower and nuclear power converted to theoretical energy imputs at prevailing rate of
pounds of coal per kilowatt-hour at central electric stations using 12,000 Btu per pound coal. Excludes imputs for powergenerated by nonutility plants which are included within the other consuming sectors.
a Electricity generated and imported.4 Not applicable.
Source: Statistical abstract of the United States, 1969, p. 510.

3
FIGURE I
Consumption of energy resources by major consumer group, 1963, 1965, and 1967
50,000 .lectric generation,utilities
40,0 0 Transportation
30,000
Industrial
20,000
10,000- Household and
commercial
1963 1965 1967
The growth in use of energy in the United States is dynamic and isoutpacing the growth in population. If the past is any indication of thefuture, new energy sources will crowd into the energy marketplacebefore existing sources are depleted. During the 1860's, about 75
ercent of the Nation's inanimate energy supply came from wood.By 1900, wood supplied only 21 percent of the energy with coal,dominant with 71 percent of the energy market. By the later 1930's,oil and gas were challenging the position of coal and shortly afterWorld War II were supplying more energy than coal.
The years following World War II saw another shift as the use ofnatural gas grew faster than crude oil. In 1968, natural gas production,including liquids made from natural gas, supplied 34.7 percent of theNation's energy. Domestic crude oil supplied 35.3 percent, includingoil imports raises the oil's share to 40.1 percent. The higher rate of gasconsumption combined with increase demands for protection of thequality of the environment, logically could result in natural gasbecoming the Nation's largest energy source within a few years ifadqeuate supplies are available. However, there is present doubt aboutthe adequacy of natural gas supply.
As for present use of energy, according to a recent report of theBureau of Mines,' the energy consumption of the United States in1969 was the highest ever.I U.S. Department of the Interior, Bureau of Mines, "Nation's Energy Consumption at Record High."
News release, Apr. 6, 1970.

4
Energy equivalent to 65,645 trillion British thermal units was re-quired to meet the Nation's total 1969 requirements for heat, light,and all forms of power. This represents a 5.1-percent increase over 1968consumption, slightly below the previous year's growth rate.
The record energy demand was met principally through increaseduse of natural gas and petroleum, plus slight increases in the use ofcoal, hydropower, and nuclear power.
Compared with 10 years ago, 1969 energy consumption representsa 51.2-percent increase at an average growth rate of 4.2 percentannually over the past decade. Over that 10-year period, the Bureaunoted, consumption of dry natural gas grew 75.4 percent; water power,55.8 percent; petroleum and natural gas liquids, 44.4 percent; andbituminous coal and lignite, 37.7 percent. Anthracite consumptiondeclined 49.8 percent. Nuclear energy, whose use in generating electricpower was negligible 10 years ago, jumped to 141 trillion Btu.
In terms of consumption, the largest energy increase of 1969 wasin electric utility power (12.1 percent), followed by energy for house-hold and commercial needs (6.9 percent), industrial uses (5.2 percent),and transportation (4 percent).
Petroleum, continuing as the dominant fuel, supplied 43.2 percentof all U.S. energy demands in 1969. The other energy sources, and eachone's share in meeting the year's total energy needs were natural gas(excluding natural gas liquids), 32.1 percent; bituminous coal andlignite, 20.1 percent; waterpower, 4 percent; anthracite, 0.4 percent;and nuclear energy, 0.2 percent.
Coal was still the major fuel for generating electric power in 1969,but its share of the electric utility market declined from 61.7 percentin 1968 to 57.5 percent last year. Electric utilities accounted for 61percent of total coal consumption.
Domestic demand for petroleum and natural gas liquids increased5.1 percent to 5,152 million barrels; dry natural gas demand was up7.5 percent to 20,385 billion cubic feet; and demand for bituminouscoal rose 1.1 percent to 505 million tons.
Domestic crude oil production was up only 1 percent last year,compared to 3.5 percent in 1968. Imports accounted for most of theincrease in oil consumption.
Natural gas gained in all its consumer sectors, particularly in electricpower generation by utilities.
Given a dynamic, changing pattern in energy demand and supply,one can understand the different opinions about the future of theU.S. energy market shown by various forecasters. Although nuclearpower supplies only a minute part of present energy demands, someforecasters expect uranium and thorium will become the largestsingle source of energy for the Nation within the next three decades.However, given our larger resources of coal and oil shale, and thetechnological prospects for converting them into fluid fuels, thedominance of the petroleum like fuels is thought likely to continuefor the rest of this century. For the more distant future, there arehopes that certain forms of hydrogen atoms, which are present innature, can be used as fuel in the fusion process, which in essencecould provide an inexhaustible supply.
As for the future, the Office of Science and Technology recentlyreleased the results of a study made for it by the Battelle MemorialInstitute which compared many recent forecasts of energy supply
5
and demand. According to this report,' energy consumption in theyear 2000, including nonfuel uses, is expected to be about 170,000trillion British thermal units if real gross national product growsat about 4 percent per year. Consumption in 1968 was slightly over62,000 trillion B.t.u. The average annual indicated growth rate isabout 3.2 percent.
Although a figure of 170,000 trillion B.t.u. in the year 2000 appearsreasonable to the Institute, on the basis of extrapolating currenttrends, it does not reflect the effect of new factors which are alreadyemerging. Most important of these is the growing concern for protectingthe environment. Also this figure may not adequately reflect possiblechanges in efficiency of energy conversion and changes in the patternof energy use, especially the larger share expected to go into electricpower production.
All of the existing projections analyzed by the Institute estimatethat oil (including natural gas liquids) will continue to be the Nation'slargest source of energy through the year 2000. Natural gas, excludingliquid fuels made from natural gas, is expected to continue to be thesecond largest source of energy. Of three projections for both nuclearpower and coal at the end of the century, one estimates that coal willprovide slightly more energy than nuclear, another estimates justthe opposite, and one foresees a large margin for nuclear. At themoment the Federal Power Commission and the Atomic EnergyCommission favor the second estimate.
Hydroelectric power is expected to continue to grow but to be ofdecreasing relative importance and to supply the smallest amount ofany of the commercial energy sources in the year 2000. Nucleargeneration is expected to exceed hydroelectric generation some timebetween the years 1975-80.
A consistent rate of growth of energy consumption toward theexpected figure of 170,000 trillion B.t.u. for the year 2000 wouldrequire 3.4 quintillion (3.4X10's) B.t.u. in the 32 years from 1968 to2000. This is equivalent to the energy in 590 billion barrels of crudeoil or 170 billion tons of average grade U.S. coal resources, assuming20 million B.t.u. per ton.
Relative to past consumption, expected consumption in the 32 years1968 to 2000 will be almost three (2.8) times that at the prior 32 years,1936 to 1968. Providing fuel to generate such quantities of energy willpose a substantial problem for the energy industries and for Govern-ment policy, since the Nation has been consuming its higher grade,more accessible resources first and since even the much smaller energyconsumption of the last'three decades has already created serious en-vironmental problems.
ENERGY AND THE SOCIETY AND ECONOMY OF THE UNITED STATES
The economy of the United States and the technologically advancednations is based on energy. Energy is the ultimate raw material whichpermits the continued recycle of resources into most of man's require-ments for food, clothing, and shelter. The productivity (and consump-tion) of society is directly related to the per capita energy available.
' Executive Office of the President, Office of Science and Technology, "A Survey and Comparison ofSelected United States Energy Forecasts." Prepared for the * by the Pacific Northwest Laboratoriesof Battelle Memorial Institute, December 1969, 79 pages.
6
Population growth and an increased standard of living throughtechnological activity have spurred a steady expansion of energy con-sumption. The extraction, transportation, and preparation of fuels;the manufacture of energy conversion machinery; the production ofelectric power; and the management of waste products and waste heatare industrial activities which have grown exponentially in the pastfew decades.
Predictions of future levels for the economy and energy are begin-ning to reveal limits imposed by environmental factors. The recogni-tion of finite abilities for the air and water, and landscape to yieldfuels and assimilate wastes poses a direct challenge to growth. Eco-logical information suggests the possibility of irreversible changesin the environment through energy exploitation. Decisions arenecessary in the near future in order to preserve options for thelong term survival of society.
It is clear that the environment cannot support unlimited growthof energy conversion because all energy eventually is discharged inthe form of heat. Local thermal effects around major cities are alreadynoticeable. However, by clever application of scientific knowledgeand prudent allocation of energy resources, a high standard of livingcan be obtained for a rather large world population.
Within this global limitation imposed by the interactions of theeconomy, energy, population, and the environment, lie several sub-sets. Some energy resources will be exhausted in the near future.Certain geographical locations may be at an economic disadvantagebecause of high fuel costs while other areas may be saturated as totheir abilities to absorb wastes. Shifts from one fuel to another willoccur.
The current high level of concern for environmental quality isdramatizing the basic conflicts among alternative uses for naturalresources. Choices must be made which will preserve the long-termhealth of the renewable environment (air, water, and living systems),yet will allow the prudent exploitation of fuels and minerals. Theconcept of recycling materials is growing in importance and willprovide the ultimate answer to many of the mineral supply questions.
However, fuels are degraded permanently as they are used-endingup in the form of thermal energy which is radiated from the earth intospace. To this extent the fuel supply of the planet is always finite anddecreasing. The constant supply of incoming solar energy is very largein comparison to fossil or nuclear fuels but it is difficult to concentratefor industrial purposes and is not considered a significant capturablesource for a high technology society.
Conventional economics emphasizes the short-term, localized gainas opposed to the long-term, worldwide balance of cost and benefit.In addition, the newly appreciated values of affluent nations are noteasily quantified or expressed in monetary units. Thus the marketplace as a decisionmaking institution may fail to produce the bestchoices.
In seeking the long-term optimum for worldwide development,technological and economic forecasting are essential tools for thedecisionmaker. Forecasts are based on extrapolations of past andpresent trends, new possibilities through applied science, populationgrowth rates, anticipated changes in human activity, and so forth.

7
Inspection of past forecasts for energy consumption in the light ofpresent facts shows that they have quite often been too conservative.However, limitations from environmental factors may make currentforecasts turn out to be too expansive.
Another aid to management judgment is the calculation of re-serves of fuel-oil, gas, coal, hydropower, uranium, thorium, etc. Alesser degree of uncertainty accompanies these statistics since theyhave been developed for many years and the exploration of theearth's surface is well advanced. Nevertheless, the economics of extrac-tion, preparation, and transportation has been complicated by en-vironmental considerations such as oil spills from tankers and theremoval of sulfur from coal and oil. While the supplies of fuel in termsof heating value alone may be calculated fairly accurately, the avail-ability ol fuels suitable for specific applications or geographical areascan be altered radically and quicklyin the name of pollution abatement.
Thus, reliable information for decisionmaking is badly needed inthe energy based economy at a time when precision is threatened bymany new factors-foremost among them being environmentalquality. This report analyzes the recent literature pertinent to energy-particularly electricity, the economy and the environment. A sum-mary of existing knowledge is presented as a backdrop for possiblecongressional hearings which would elucidate the difficult conflictsto be resolved and point the way for government and private sectororganizations to obtain additional data.
THE SITUATION FOR ELECTRICAL ENERGY
As the Nation enters the remaining third of the 20th century,electricity literally has become a necessity for urban, suburban, andrural life, in both its economic and social aspects. At present most ofthe electricity is generated and delivered by electric utilities, and thedecisions affecting the future supply of electricity in large part willbe those of the management of those utilities.
Three interacting questions about electricity arise for the remainingthree decades of the 1900's. These are:
(1) Is there a gap, now or later, between demand and supplyfor electricity?
(2) What are the environmental effects of the electricityindustry, what can be done about undesirable effects, and whatare likely to be the costs of control or abatement of these effects?
(3) What will environmental quality protection regulationsdo to alter the choice among fuels for electricity generation?
A review of current thought about these three questions suggeststhe following summary answers:
Concerning an electricity gap, some responsible officials and utilityofficers expect there will be occasional shortages of electricity againthis summer. The results of the shortage may be a decrease in thequality of electrical service by lowering the voltage, or, in more severeinstances, the temporary cutting off, or shedding, of some users tokeep the total electrical demand of a system within its ability tosupply. As for the longer term outlook, the industry and Governmentexpect that powerplanlts can be built to supply future requirements,but only if a series of assumptions turn out favorably.

8
Concerning the environmental effects of generating electricity andcarrying it to its users, the wastes from very large powerplants arecertain to cause definite and probably unacceptable environmentaleffects unless equipment and procedures are used to control andabate discharge of wastes to the air and water. The added capitalinvestment for waste control facilities, their costs of operation andtheir possible adverse effect upon operating efficiency of powerplantsall can be expected to increase the cost of generating electricity,which ultimately must be reflected in an increase in the price paidby the user. How much this increase will be is conjectural. It seemslikely to be acceptable for residential users, except that the effectwill bear most heavily upon the poor. However the increase maychange the economics of certain industries that use large amounts ofelectricity, such as metal refining and processing.
Unless methods are developed to permit the use of fossil fuelsof high natural sulfur content, present trends in public insistenceupon use of low sulfur fuels can lead to a rapid use of our naturalgas reserve, a growing reliance of parts of our country upon importedfuels and a diminished use of coal even though this is the mostplentiful of the fossil fuels. Furthermore, expectations that the supplyof electricity will be adequate to meet future demand also assumes amajor technological step forward in nuclear power-use of the breederreactor-will be commercially attractive and feasible by the 1980's.Some perspectives
The Federal Power Commission expects that by the year 1990the Nation's electricity industry will have to plan, finance, buildand bring into operation nearly 900 million kilowatts of new electricalgenerating capacity, almost three times that available in 1970. Inaddition, the industry must also replace existing powerplants asthey become too obsolete to continue in use. Over recent years,utilities have retired old steam generating plants at an average ratein excess of 0.6 million kilowatts per year.
This expansion will require the utilities to find some 225 new sites forvery large new steam electric plants for individual units of 500megawatt output or larger. Of these 91 are expected to be for fossilfuels and 164 for nuclear power. The expansion of generating plantsand transmission lines will require the industry, in its privately,publicly, and cooperatively owned segments, to raise an estimated$350 billion during the next two decades. The combined output of thenew steam-electric plants approximates 450 times that of the largeststeam electric plants currently in operation in the United States, orof 670 new Hoover Dams.
To supply the utilities with fossil and nuclear fuels for future genera-tion of electricity will also demand a marked expansion in the supplyof coal, oil, gas, and uranium. Complicating factors are:
(1) Regulations that limit the sulfur content of fossil fuels.(2) Opposition to the import of low sulfur fuels.(3) The possibility that new discoveries of natural gas will notkeep pace with expanding use for generation of electricity.(4) The technical and economic practicability of the breeder
reactor remains to be demonstrated.
9
To transmit the electricity generated at these plants to the usingareas within and between the States will require obtaining rights-of-way for and building an estimated 188,000 miles of new high voltagetransmission lines.
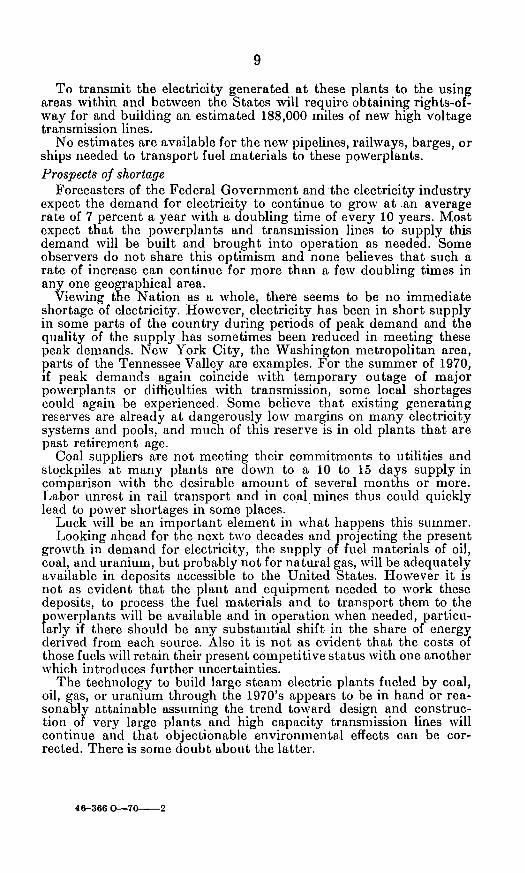
No estimates are available for the new pipelines, railways, barges, orships needed to transport fuel materials to these powerplants.Prospects of shortage
Forecasters of the Federal Government and the electricity industryexpect the demand for electricity to continue to grow at an averagerate of 7 percent a year with a doubling time of every 10 years. Mostexpect that the powerplants and transmission lines to supply thisdemand will be built and brought into operation as needed. Someobservers do not share this optimism and none believes that such arate of increase can continue for more than a few doubling times inany one geographical area.
Vieving the Nation as a whole, there seems to be no immediateshortage of electricity. However, electricity has been in short supplyin some parts of the country during periods of peak demand and thequality of the supply has sometimes been reduced in meeting thesepeak demands. New York City, the Washington metropolitan area,parts of the Tennessee Valley are examples. For the summer of 1970,if peak demands again coincide with temporary outage of majorpowerplants or difficulties with transmission, some local shortagescould again be experienced. Some believe that existing generatingreserves are already at dangerously low margins on many electricitysystems and pools, and much of this reserve is in old plants that arepast retirement age.
Coal suppliers are not meeting their commitments to utilities andstockpiles at many plants are down to a 10 to 15 days supply incomparison with the desirable amount of several months or more.Labor unrest in rail transport and in coal mines thus could quicklylead to powver shortages in some places.
Luck will be an important element in what happens this summer.Looking ahead for the next two decades and projecting the present
growth in demand for electricity, the supply of fuel materials of oil,coal, and uranium, but probably not for natural gas, will be adequatelyavailable in deposits accessible to the United States. However it isnot as evident that the plant and equipment needed to work thesedeposits, to process the fuel materials and to transport them to thepowerplants will be available and in operation when needed, particu-larly if there should be any substantial shift in the share of energyderived from each source. Also it is not as evident that the costs ofthose fuels will retain their present competitive status with one anotherwhich introduces further uncertainties.
The technology to build large steam electric plants fueled by coal,oil, gas, or uranium through the 1970's appears to be in hand or rea-sonably attainable assuming the trend toward design and construc-tion of very large plants and high capacity transmission lines willcontinue and that objectionable environmental effects can be cor-rected. There is some doubt about the latter.
46-366 0-70--2

10
Some underlying assumptionsThe expectations that the supply of electrical energy wvill keep pace
with demand through the 1980's and 1990's appear to rest upon manyassumptions. Some of those identified during the course of this studyinclude the following:
1. The demand for electricity will continue to grow as in the past.The historical growth of 7 percent, with a doubling time of 10
years, will continue. However, for 1968 and 1969 the loads havebeen about 9 percent.
The electricity industry will continue to promote greater use ofelectricity.
2. The environment can absorb the wastes of doubling electric powerevery decade with whatever control is afforded by present technology.
3. Competition among fuels will remain effective.The competition among present fuels for steam-electric plants-
oil, coal, gas, and uranium-will remain effective and that thesefuels will be sufficiently available for utilities to change from one toanother on short notices as prices dictate.
Such competition assumes also that time and capital will be avail-able to provide the plant and equipment to work the deposits of thesematerials and do whatever fuel processing is necessary before deliveryto the powerplants.
4. Nuclear powerplants will generate much of the future electricity.Nuclear power will supply perhaps 25 percent of the electricity
by the year 1980, 40 percent by 1990 and 60 percent by the year2000. This in turn assumes that the breeding reactor will becomecommercially feasible and available by the mid 1980's and also thatthe costs of nuclear power will reverse their recent slight upwardtrend and will be competitive with fossil fuels. It assumes also thatsuch plants can work within future limits governing emission ofradioactive wastes and waste heat.
5. Very large steam-electric plants will prove feasible to build andoperate.
Larger nuclear reactors, new generators, transformers, and com-ponents for the very large powerplants require a large step beyondexisting techonology that could increase outage risks which are alreadylarge because powerplant equipment is not being built with sufficientquality control to assure reliable performance.
Further, much of the new capacity in the near future must comefrom the first generation of large nuclear powerplants which havestill to demonstrate their working characteristics.
Unit sizes already are so large that one or two unscheduled shut-downs can cause a power shortage on an entire system.
6. The economies of scale will be realized.The present trend toward fewer but larger steam-electric power-
plants will continue and bring economies in operation not to be hadwith more but smaller powerplants.
7. Sites for powerplants will be available as needed.Environmental effects of very large powerplants will be as tolerable
to the public as the effects of smaller plants.
1'1
The waste heat, combustion products, and radioactive materialsfrom very large powerplants or groupings of powerplants will notproduce unacceptable environmental effects.
8. Rights-of-way for transmission lines will be available as needed.The environmental effects of transmission lines will be or can be
made tolerable enough so that rights-of-way for new lines can beobtained as needed. The trend toward fewer but larger powerplantsbrings with it the concentration of transmission lines in the vicinityof these plants.
9: The performance of transmission lines will be improved.The technology of transmitting electricity over long distances with-
out excessive loss of power or costs will be available.Private interests with little or no Federal assistance will fund the
requisite research and development to improve and demonstrateimprovements in transmission line technology such as direct currenttransmission and use of superconducting cables.
10. Fossil fuels will not be diverted significantly to chemical markets.Through the next several decades, the demand for coal, oil and gas
as a raw material for chemical and food industries will not become solarge as to divert these materials from fuel use, and that nationalconservation policies will not give a higher priority to non-fuel uses.
11. The electricity industry can finance the new plant and equipmentneeded.
Financing will be available to the privately, publicly, and coopera-tively owned sectors of the electricity industry to build new power-plants and transmission lines as needed.
12. Delays will not get worse.Schedules for acquiring plantsites, rights-of-way for transmission
lines, manufacture of equipment, construction of powerplants andtransmission lines can keep to schedules.
13. Economic concentrations in the industry will not violate antitrustlaws.
The trend toward very large powerplants and consequent formationof large joint ventures to fund and operate them, and the parallelpossible concentration of economic power in the financing of the vastfuture capital investments required by the electricity industry willnot violate anti-trust legislation.
ISSUES OF ENERGY, ELECTRICITY, AND THE ENVIRONMENT
Many issues possibly warranting the attention of Congress ap-peared during the course of this study. These may be classified asoperational, economic, technological, environmental, resource, andregulatory. Many of these issues are so interrelated that they couldreadily appear in more than one category. The issues identifiedduring this study follow, posed in the form of questions.Operational issues
1. National energy policyTo what extent is the marketplace still an adequate decisionmaking
institution to assure adequate supplies of energy in appropriate formand quality?
12
Is a government policy needed to assure industry access to principalenergy resources in the future, both domestic and imported?
What are the alternatives to Federal regulation of the entire energymarket?
2. Economic and defense implications of fuel importsWhat are the defense and economic implications of increasing
imports of residual fuel oil and liquified natural gas for the east coastand the Midwest?
Are defense uses sufficiently different from civilian consumption towarrant separate policy decisions based on wvar-or-peace forecasts?
3. Planning for electric powerTo what extent are present arrangements for regional planning
in the electric power industry likely to assure the generating capacitywill be available when and where needed?
What factors may upset the current forecasts of the Federal PowerCommission as to future demand for and supply of electricity?
What are the consequences to home users and industry of badplanning?
4. Avoiding shortagesWhat changes may be needed in FPC authority and functions to
fix the responsibility and authority for Federal action replanning andoperations to supply electricity?
What short-term measures may be taken by the industry to avoidor alleviate the possible brown-out type shortages this summer?
Should advertising for appliances and other uses be curtailed?What can be done to prevent further slippage in the scheduled time
to build and put into operation large powerplants?What is the effect of environmental protection requirements on new
plant construction?
5. Powerplant sites and transmission rights-of-wayWhat, if any, Federal authority should there be to assist in, and,
if necessary, obtain by legal action sites for large powerplants andrights-of-way for transmission lines?
How would the public's interest in preserving the environment berepresented in such proceedings and balanced against the need forelectricity?
6. Policy on promoting use of electricityShould the FPC and the utilities continue with their philosophy of
promoting additional per capita use of electricity? If not, what policyshould replace it?
7. Policy on discouraging use of electricityShould the Government adopt a policy of discouraging use of elec-
tricity, at least until present shortages are remedied, or in those placeswhere, because of limitations on generating sites and transmissionrights-of-way, additional power cannot be readily had?Economic issues
A. Will changing costs and supply conditions be reflected in changingrelative prices for different energy sources? What magnitude of relativeprice change will be needed to shift demand toward the relativelymore abundant sources of supply?

13
B. Should electricity pricing schedules be revised to discouragerather than encourage marginal use?
1. Pricing electricityTo what extent should the price charged for electricity include:
(a) Costs of preventing and abating environmental effects ofgenerating and transmitting electricity?
(b) Costs of dealing with the effects already caused by previousgeneration?
(c) Costs of requirements upon fuel suppliers that they in turncontrol and abate the environmental effects of removing fuelmaterials from nature and processing them?
(d) Research and development to:(1) Improve the efficiency of electricity generation?(2) Improve waste control equipment and procedures?(3) Develop new sources of energy for conversion into
electricity?
2. Sale of AEC gaseous diffusion plantsWhat are the economic implications for the future of nuclear
power of the terms and conditions of the sale by AEC of its gaseousdiffusion plants to private industry, which has been proposed?
3. Trend toward larger powerplantsWhat are the effects upon the electricity industry of the trend
toward fewer but larger powerplants that generate more elec-tricity than is needed by an individual utility? What are the effectson the environment?
What is the implication of the trend toward larger powerplantsand larger transmission facilities for the smaller power companies-privately, publicly, and cooperatively owned?
4. Requirements for capitalThe electricity industry is capital intensive. What are the prospects
that it can in fact raise $350 billion during the next 20 years for newplant and equipment? What will be the credit market impact of theseheavy capital demands?
What estimates are there of the capital required by the energyindustries over the next 20 years for their total estimated production?For that part of their production dedicated to the electricity industry?
What capital investment is expected for plant and equipment tomove energy materials-rails for coal, pipelines for oil and gas, etc.-to supply the electricity industry of the 1980's and 1990's?
5. Economic limitations on growth in demandWhat economic factors might influence the demand for electricity
during the next two decades?Technological issues
1. The breeder vectorWhat are the prospects that the breeder reactor will in fact be
commercially available and economically attractive by the mid-1980's when it will be needed if projections of the role of nuclearpower are to be met?
How much does this depend on Federal R. & D. funding?

14
2. Byproduct use of waste heatWhat are the prospects for developing byproduct uses of large
amounts of low quality heat as an alternative to discharging into theenvironment?
What economic measures could be taken to foster the byproductuse of heat?
Should nuclear utilities be encouraged to demonstrate such uses?To diversify their operations into such applications?
3. Technical limits to powerplant sizeWhat limiting factors are there, if any, to the ultimate size of indi-
vidual generating units, of individual powerplants (which may includeseveral units)?
4. Efficiency of steam-electric plantsWhat measures can be taken to accelerate improvements in increas-
ing the efficiency of steam-electric plants so that less heat is wasted?When will MHD be commercially proven at the present rate of
development?Whose responsibility are these measures?What is now being done by the utilities? By Government?
5. Prospects for the fuel cellWhat are the prospects for the fuel cell as a competitive source of
turbine generated electricity for larger users? What are the limitingfactors such as catalysts availability, size of units, capital cost, etc?
Resource issues1. Natural gas
With respect to fossil fuel energy resources available for generatingelectricity during the next three decades, natural gas appears to bein the weakest position. It is often found and produced in conjunctionwith oil.
To what extent are published reserve data, particularly on naturalgas, extremely misleading, as some have claimed?
What is the potential for increased importation of natural gas?How do costs of importation compare with costs of domesticproduction?
2. Drilling for gas and oilIn view of the as yet unsolved environmental pollution problems
which have arisen with respect to offshore drilling for oil and gas, isit desirable that exploration and discovery drilling for these fuels beencouraged on land in the contiguous states? If so, what incentivewould be desirable? Should offshore drilling be further restricted orhalted until more adequate environmental safeguards are developed?
How can natural gas discovered on the Alaskan North Slope bemost wisely used?
3. Coal productionAlthough coal resources overall are very large there are increasing
indications that production by coal mines in the present large pro-ducing areas has not been very responsive to the condition of in-creased demand, slightly higher prices, and generally reduced stockson hand. This situation poses several related questions:
15
(a) To what extent are present mining establishments even moreovercommitted (with respect to probable demand, present and future)for low-sulfur coals than for other types?
(b) What major developments are now in motion or firmly plannedfor development of large but only slightly developed resources oflow-sulfur sub-bituminous coals and lignite found in the NorthernPlains and Mountain States?
(c) Is it desirable that there be private or public stimulation ofthe mining of such coals in those areas?
(d) Prospectively, what provisions would need to be made, and atwhat capital cost for production and transportation? Is there nowadequate technology for reclamation of these sub-humid lands afterstrip mining and at what cost?Environmental issues
1. Control of sulfur dioxideMany local air pollution control agencies are restricting the use
of fossil fuels that contain sulfur. Are fossil fuel supplies of low sulfurcontent available presently and in the future to meet federally recom-mended air quality standards for sulfur oxides?
If not, who has the responsibility for expediting development anddemonstration of methods and equipment to remove sulfur oxidesfrom stack gases of power plants? What priority should be given tothis?
Concerning the effect upon fossil fuel supply of sulfur contentlimitations, what are their effects upon present import of residualfuel oil? What are the projected demands for low-sulfur oil fromforeign sources-assuming no limitation of import by governmentaction?
2. Bypassing the use of electricityAs a means of reducing consumption of electricity, and thus reduce
environmental effects, to what extent could or should Governmentpolicies seek to encourage the direct conversion of fuels to mechanicalenergy or heat energy in preference to converting fuel into electricitywhich then is converted into mechanical or heat energy, with theinevitable 60 percent loss of heat energy at the first conversion step?
S. Comparison of nuclear and fossil fuelsWhat definitive Government analysis of the comparative environ-
mental effects of nuclear and fossil fuels for generation of electricityhas been performed? Is one feasible? Who should do it?
How would electricity generated from nuclear versus fossil fuels com-pare in cost if each system had to meet a "zero pollution" standard?
4. A policy of zero pollution?Should the Federal Government adopt and enforce a national policy
of zero pollution from all new power generating facilities? "Zeropollution" means no emissions in excess of Federal standards.
5. Evaluating environmental effectsWhat reasons are there to develop a uniform method of evaluating
environmental effects of major power projects, perhaps a methodbased upon cost-benefit analysis?

16
What weight should environmental considerations carry in decisionsby utilities as to where and how to generate electricity and to transmitit, and associated review and decisions by Government agencies?
6. AdministrationTo what extent would the users of electricity, the utilities, and the
environment be better served by consolidating in a single Federaloffice and in single State counterpart offices whatever Governmentaction is related to protection of the environment?
7. Protection of amenitiesIs there needed a national policy for amenity protection and
supporting legislation so that the Federal Government would setstandards and criteria to guide State, local, and regional agencies indeciding where power facilities and transmission lines should belocated and their appearance? Who would apply and enforce suchstandards? How can State governments cause zoning agencies togive special attention to siting of power generation and transmissionfacilities?
8. Transportation of oilTo what extent should the environmental problems from long-
distance transportation of oil be considered in deciding what fuelswill be used by steam-electric powerplants?
9. Costs of "clean electricity"How much will it cost to keep the environmental effects of genera-
tion and transmission of electricity, including effects of the fuelsuppliers, within limits acceptable to society? How should thesecostsbe divided between:
(a) The taxpayers-Federal, State, and local.(b) The ratepayers.(c) The utilities, from income in excess of expenses.
How much agreement is there concerning costs of controllingenvironmental effects of generation and transmission of electricityfor:
(a) What capital and operating costs should be recognizedby State public utility commissions in the setting of rates?
(b) The amount of those costs.10. Reclaiming strip mines
How should the costs of reclaiming abandoned deep and pit minesin the coalfields be divided between present coal producers and thetaxpayer?
11. Tax incentivesTo what extent should local agencies of Government be encouraged
to give special tax benefits for capital investments that reduce theenvironmental effects of generating and transmitting electricity?
12. Equally vigorous standardsShould all limits for emissions from powerplants have as rigorous
a safety factor as those set by AEC for emission of radioactive effluents?

17
1S. Coal mining in the RockiesConcerning plans to use low-sulfur coal in the Rocky Mountain area,
what is known of the likely environmental effects of mining these coal-fields in this topography?Regulatory issues
1. How should Federal agencies consider social and economic valuesin the regulation of utilities and also the public interest for suchmatters as:
(a) Balanced energy economy.(D) Efficiency in allocation and use of the Nation's natural
resources of fuel, land, air, and water?(c) Social performance of the electric utility industry in con-
tributing to the Nation's overall economic and environmentalwelfare.
CONGRESSIONAL INTEREST IN ENVIRONMENTAL POLLUTION
Many committees of Congress have examined various aspects ofenvironmental pollution and in doing so have helped to illuminatethe nature and extent of the effects of generating electricity upon theenvironment. In the House, the Committee on Education and Labor,the Committee on Government Operations, the Committee on Scienceand Astronautics, the Committee on Interstate and Foreign Commerce,and the Committee on Public Works have held hearings.
In the Senate, the Committees on Commerce, District of Columbia,Government Operations, Interior and Insular Affairs, and PublicWorks also have held hearings on matters such as air and waterpollution and environmental quality. The Joint Committee on AtomicEnergy likewise has done so and during 1969 and 1970 has held ex-tensive hearings specifically on the environmental effects of generatingelectricity. A list of the hearings and publications of these committeesappear in appendix II.
This extensive background of hearings and reports makes it possibleto proceed more directly to laying out the overall environmentaleffects of all of the industrial operations involved in the generatingof electricity, the supplying of fuel to the powerplants, and the trans-mission of the electricity to the using areas; and to identifying andexamining the economic factors involved.
Is THERE AN ENERGY GAP?
AN OVERVIEW
Until quite recently it was assumed that because the United Stateshad large reserves of fuels in the form of coal and oil shales and nuclearfuels-provided the breeder reactor can be perfected, there was littleprospective shortage of available, useful energy. Recently warningsare heard that the United States may be passing from a situation ofenergy abundance into one of energy scarcity. If so, this would havegrave implications for prospects of further increasing the standard ofliving and also increasing the productivity of labor. The imports ofresidual fuel oil to the northeastern United States, present plans toimport it into the Midwest, and future plans to import liquified naturalgas may reflect a decrease in availability of energy from domesticsources to meet rising demands.
As for electricity, some local shortages during peakload periods oflast summer and this past winter have occurred. These shortages seemlikely to be repeated during 1970, particular should peak demandscoincide with interruption of the output of large powerplants. Theshortages are likely to be aggravated in those densely populated partsof the country that use large amounts of electricity but where land isnot readily available for either large new powerplants or transmissionlines. Some shortages may occur because of shortages in the supply ofcoal and because of changes from coal to oil or gas because of increas-ingly severe limitations upon the permissible amount of sulfur in coalburned in powerplants. Present restrictions on imports of residualfuel oils and signs of a shortage in natural gas seem likely to complicatethe fuel supply for large new powerplants as they are ordered andand built.
SOME VIEWS
The past year has produced wide-spread concern over the imminenceand severity of possible shortages in electricity.
Lee C. White, past Chairman of the Federal Power Commission,in his last official press conference at the FPC, said that his biggestdisappointment was "the inability to persuade the electric-powerindustry and the Congress that we are rushing, I am afraid almostheadlong, into a situation where we may not have enough electricenergy in this country to go around."
John T. Ryan, commissioner, New York State Public Service Com-mission concerning the ability of the Consolidated Edison Co. of NewYork to meet electric demands this summer, he said:
* * * Based on 1969 experience, if the peak load forecast for 1970 is reached inJune and the level of system deratings experienced in 1969 again prevails, thecapacity available to meet forced outages would be very small or even negative.
Glenn T. Seaborg, Chairman of the U.S. Atomic Energy Commission,in testimony before the Joint Committee on Atomic Energy onOctober 29, 1969:
(18)

19
* * * In the years ahead, today's outcries about the environment will benothing compared to the cries of angry citizens who find that power failures dueto a lack of sufficient generating capacity to meet peak loads have plunged theminto prolonged blackouts-not mere minutes of inconvenience, but hours-perhaps days-when their health and well-being and that of their families, maybe seriously endangered.
Philip Sporn, member of the National Academy of Engineering andformer president of the American Electric Power Co.:
Recently, the expansion of electric-power generating capacity has been stoppedor delayed at a growing number of points in the United States. These delaysare a result of well-intentioned activities that have caused rising public anxietyabout the environmental impact of the operation of electric generating stationsand, particularly, of atomic generating plants. * * * Because of delays in theinstallation of new generating capacity many major power grids are withoutcomfortable reserves to meet emergencies. And if this opposition to expandingour electric energy supply continues, surely we are going to bring about a cat-astrophic situation. This we simply must avoid. The implication this carries forour national policy is clear. A major effort is called for to make possible continuingand expanding use of energy by man and to assure compatibility of this energywith a healthy environment.
John A. Carver, Jr., Commissioner, Federal Power Commission:A crisis exists right now. For the next three decades we will be in a race for
our lives to meet our energy needs.
David Freeman, Director, Energy Policy Staff, Office of Science andTechnology:
* * * anyone who looks at the facts on power supply today and doesn't believethat the industry is in trouble is living in a dream world.
Generating reserves are already at dangerously low margins on many systemsand pools, and much of it is old plants that are past retirement age.
* * * the real question is not whether we will have a power shortage in thenear future, but rather whether the shortage of the past year will intensify.
Charles A. Robinson, Jr., staff counsel to the National RuralElectric Association:
America's electric utility systems are currently attempting to remedy what iscertainly the most critical power shortage since World War II, if not the worstin the entire 82-year history of the industry.
SOME REPORTED POWER SHORTAGES
Shortages of generating capacity resulting from various causeshave produced relatively critical situations in electric power supplyin several areas of the United States in recent years. The followingare examples of shortages of sufficient severity to cause concern.
During the 1969 summer peak load season, electric systems com-prising the Pennsylvania-New Jersey-Maryland interconnection(PJM pool) ordered 3-percent voltage reductions on five separateoccasions and 5-percent reductions on six occasions, including onegeneral public appeal for voluntary load curtailment. The actualPJ'M summer reserve margin was 4.5 percent compared with thepreviously forecast 11 percent and a desirable level of 20 percent.
An emergency meeting of PJM area regulatory commissions andutility executives representing Pennsylvania, New Jersey, Maryland,Delaware, and the District of Columbia wvas held on December 23,1969, to consider the equally critical situation developing for 1970and 1971. All possible remedies were evaluated, including cold reserveidentification, advancement of construction schedules, postponingretirements, and identification of customer-owned capacity. All of

20
these possibilities were found to have been already exhausted. More-over, all U.S. power pools east of Chicago were contacted withoutdiscovering any firm summer reserves. The PJM utilities were thenasked by the commissions to order 883,000 kilowatts of additional gasturbine capacity for 1971 availability, but U.S. manufacturing capac-ity in this area was found to be already saturated.
On December 16 and 17, 1969, and on January 8 and 9, 1970, thePJM pool again ordered 5-percent voltage reductions because ofunscheduled loss of capacity in Pennsylvania and New Jersey andthe need to avoid a cascading failure by helping other pool, to thesouth and west which were in even more serious condition.
These situations resulted from a combination of circumstances-agreater increase in summer peak demands than projected and signifi-cant delays in getting new capacity and new transmission lines inservice, notably the more than 2-year delay in the Oyster Creeknuclear plant and a delay in the start up of the large Keystone UnitNo. 2 coal-fired unit, which prevented its dependable use to help meetthe summer loads for which it had been scheduled.
The Consolidated Edison system, serving metropolitan New York,experienced serious power shortages on several days during July,August, and September 1969, finding it necessary to reduce voltageby as much as 8 percent and in several instances to appeal to the publicfor a voluntary cutback in its use of electricity. The situation wasaggravated by an unusual pyramiding of losses of several of its largergenerating facilities during peak demands and by the absence ofstrengthened interconnections with neighboring utilities which hadbeen scheduled for earlier completion.
On several occasions during the summer of 1968, the Chicago,Detroit, New York, and New England areas resorted to voltagereductions as a means of reducing loads because of deficiencies ingenerating capacity needed to supply peak loads on particular days.The Commonwealth Edison Co., serving Chicago and northernIllinois, was particularly short of supply during the summer of 1969because of the delay in the completion of the new 715 mw. nuclearunit under construction in the company's Dresden generating station.Arrangements were made to import power over a wide geographicarea of the Midwest and Central East regions. Fortunately the absenceof extremely hot weather during the summer helped to avert a moreserious situation.
During the past winter, TVA and many other systems were forcedto reduce voltage on their systems to meet peak loads.
During this period, even the highly controversial 100 mw. unitowned by Hoosier Energy, Inc., an REA financed cooperative inIndiana, was pressed into service to help avert disaster on the TVAsystem. This unit had been under legal attack from Indiana powercompanies for 10 years. For many months it had remained closeddown pursuant to a Federal court injunction. So critical was the need,however, that on January 8, and for several days following, the unitwas operated by mutual agreement of all parties.
Chairman Nassikas, of the FPC has indicated that 22 major systemsreported summer reserves in 1969 of less than 10 percent. Specifically,he mentioned the Southern Co. system (1.6 percent), which servesAlabama, Mississippi, and Georgia; The Cleveland Electric Illuminat-
21
ing Co. system (3.1 percent); and the American Electric Power Co.system (5.1 percent), which serves parts of Virginia, West Virginia,Ohio, Kentucky, Tennessee, Michigan, and Indiana. The FPC furtherreported in November 1969 that 39 out of 181 major systems facedthe winter with less than 10 percent reserves.
PROSPECTS FOR FUTURE SHORTAGES
Forecasts for the immediate future are not a great deal more opti-mistic. According to Maryland PSC chairman, Williom 0. Doub,utilities nationwide will face the 1970 summer peak load with overallreserves of 16 percent compared with 32 percent in 1960, and a de-sirable level, 20 percent. Doub also has forecast 1971 PJM summerreserves at 15 percent or less, even if all planned new gas-turbine unitsare installed on time. Consolidated Edison Co. of New York plansto use "barge power" for several years to meet summer peaks. Gas-turbine generators will be mounted on barges and towed aroundManhattan Island to be plugged in wherever and whenever the needis greatest.
Under these minimum reserve conditions, any unanticipated largescale loss of generation or transmission at the time of peak load couldresult in power failures over a wide geographical, area unless load isquickly dropped.
On the other hand, the Edison Electric Institute is more optimistic.EEI president, A. H. Aymond, in January 1970 asserted that in thesummer of 1969 the gross margin of capability over demand was16.9 percent for the contiguous United States, which is adequate toassure reliable service. He noted that some regions or areas may haveinsufficient reserves when the gross national reserve is not spreadevenly. However, none of the eight power-supply regions had less thana 10.7-percent margin. Conceding this to be a bit on the low side, heexpects that for 1970 and 1971 the overall summer margin will be18.4 percent. This is not to say, he concluded, that certain systemsin limited areas may not have difficulties in 1970 because of inadequatereserves. "The reason for this, in most cases, is not that the utilitiesdid not plan for the future, but that events or intervention beyondtheir control conspired to prevent completion of additional capacitywithin reasonable time."
CONSTRUCTION DELAYS AS A FACTOR
At present a fossil-fueled powerplant requires 4 years to build fromthe placing of the contracts and a nuclear-powered plant requires ayear or so more.
Much of the possible shortage of electricity will be attributed todelays in getting new powerplants built and into routine operation.The electric utilities face a vast construction program of very largepowerplants with many possibilities of delays. Chairman Nassikas ofthe Federal Power Commission has called attention to the probabilityof increasing lead times for construction and the extended breakingin periods for the large units that will be used during the 1970's and1980's. Even after these are in regular operation, he notes the possi-bilities of longer times out of service because of maintenance.'
I Hearings before the Senate Commerce Committee, Jan. 1, 1970, p. 37 of prepared statement.

22
A survey by the Edison Electric Institute for the Federal PowerCommission of 85 large steam generating plants of 200 megawattssize or over installed during the years 1966 to 1968 indicated thatabout two-thirds of the total were delayed in being put into service.All four nuclear units scheduled for installation during this periodwere delayed for periods of 3, 9, 11, and 12 months, respectively. Ofthe 51 fossil fired units which were delayed during the period, onlyfive extended 6 months beyond scheduled in-service dates and threeof these were purposely deferred because of changes in load requirements.
Equipment component failures and shortage of construction laborwere the most frequent causes of delays found in this survey. Latedelivery of major equipment and construction labor strikes were thenext greatest causes. Over 80 percent of all the delays were attrib-utable to these four categories. Late delivery of equipment was ex-pected to be the prime reason for delay during the period 1969-71.No delays were attributed so far to public opposition to sites forpowerplants because of their environmental effects and only fourdelays were caused by regulation. However, the institute cautionsthat future delays attributable to environmental problems may wellbe more serious and more widespread than at present. Therefore, it isimperative to work out a basis for resolving conflicting viewpointsabout use of land for power and other purposes.
Looking ahead through 1976, the Federal Power Commission expects138 fossil-fired steam electric plants and 64 nuclear units of 300megawatts capacity and over to come into service. At present, 27of the fossil-fired units totaling 15,000 megawatts are reported asdelayed, and 27 nuclear units totaling 21,000 megawatts are alsodelayed as of January 30, 1970. Eighty-three fossil-fired units and 37nuclear units are reported on schedule. However since most of theseunits are scheduled for service in later years, FPC thinks it likely thatsome of them too will experience delays and fail to meet presentlyscheduled service dates.i
Wilson M. Laird, director of the Office of Oil and Gas, Departmentof the Interior, attributes some of the trend toward delay to the head-long rush to order nuclear powerplants in 1966 and 1967 followed by aprecipitate return to ordering coal-fired plants in 1969. This, he says,threw the expansion plans of both the coal and electric power industriesinto disarray. "Now both are off schedule; perhaps as much as 2years have been lost by the premature commitment to nuclear power,and it shows in the reduced margin between demand for electric powerand the capacity to supply it."2
DELAYS IN TRANSMISSION FACILITIES
Both the adequacy and reliability of electric service depends uponthe timely construction of the transmission lines to carry electricityfrom the powerplants to the areas of use. With the trend towardsfewer but larger powerplants, the availability of transmission capacitybecomes increasingly important. Delays in the completion of such linesnecessarily increases the vulnerability of an electric utility both to the
I Statement of John N. Nassikas, Chairman, Federal Power Commission, before the Senate CommerceCommittee, Jan. 30, 1970.
2 Wilson M. Laird, remarks before the Institute on Petroleum Exploration and Economics, Dallas, Tex.,Mar. 5,1970. Department of the Interior news release, Mar. 5, 1970, p. 2.

23
type of power failure that blacked out much of the eastern UnitedStates in 1965, and to power shortages. Temporary power shortagescan occur when the construction of powerplants and transmission linesget out of step.
There are delays.For example, a high-voltage transmission line to connect south-
eastern New York with a system in the mid-Atlantic States was firstscheduled for operation in 1967. It probably will not be available forservice by the summer of 1970 because of difficulties in acquiringrights-of-ways. Again, a high-voltage transmission line to connect thePennsylvania-New Jersey-Maryland power pool with New York City,which might have averted the 1965 blackout, has still to be completed.Rights-of-way are increasingly difficult to get through densely populatedareas. Public opposition to construction of transmission lines, par-ticularly in the densely populated East, may prove a greater impedi-ment to the future supply of electricity than opposition to powerplantssites.

ENERGY FOR THE ELECTRICITY INDUSTRY
In 1970 the Nation's electrical powerplants are expected to generatesome 1.52 trillion kilowatt hours of electrical energy. None of thisenergy is created within the plants. Rather it must come from ex-ternal sources and be converted into electricity. Without the energyfrom water passing through turbines or from heat released by burningcoal, oil or gas, or from fissioning nuclear materials, our electricpowerplants would stand idle and useless.
Of principal concern, therefore, to any review of the electricityindustry is the supply of energy for the power stations. Since by farthe largest part of this input energy presently comes from the fossilfuels-oil, coal, and gas-the supply and demand for these commod-ities, their production, the environmental effects of that productionand corrective measures for those effects, require consideration.
Since the electricity industry must compete with other users ofbasic energy resources, an appropriate starting point for this chapteris to look at some recent estimates for supply and demand for energyin the United States.
SUPPLY-DEMAND FORECASTS AND THEIR FALLIBILITIES
During the past several decades many observers of supply and de-mand for energy resources have forecast future trends. In examiningthese forecasts, two related points are worthy of notice. First of all,there has been a substantial short-fall in previous careful estimatesand thus current projections may be met with skepticism. The PaleyCommission in its 1952 report' included a projection of the productionof electricity in 1975. The projection by the Commission of the extentto which the several possible sources would then be used is shown herein table 3. It may be noted that the projected 1975 total of 1,400 billionkilowatt-hours had been exceeded by 1968. Generation of electricitywith hydropower was projected at more than 21 percent of the totalin 1975 but in 1968 had declined to less than 17 percent. Fuel oil andnatural gas were each projected as supplying about 11 percent of thetotal in 1975. For oil, this estimate was very nearly the same per-centage it supplied in 1950-it has in fact, according to recent data(1968), fallen significantly below that level. In the case of gas, theprojection involved moderate decline, as compared with 1950, in itscontribution to the total. To date, that projected decline has nottaken place; instead, in recent years natural gas has supplied morethan one-fifth of the total energy resources used to generate electricity;
I "Resources for Freedom," a report to the President by the President's Materials Policy Commission,vol. III, "The Outlook for Energy Resources," June 1952.
(24)

25
this aspect of the demand for gas has performed very differently fromwhat was estimated in 1952. Finally, use of nuclear fuel was notprojected-even in 1968 the table presented above (table 2) does notestimate its development in that year, but blankets it in with coal asa miscellaneous resource.
TABLE 3.-PRIMARY ENERGY SOURCES AND PRODUCTION OF ELECTRICITY, 1950, AND A POSSIBLE PATTERN OFSOURCES AND PRODUCTION, 1975
Consumption of basic Kilowatt-hour productionSource energy (billions)
1950 1975 1950 1975
Coal -1113 1 320 191 800Gas- 2777 21,600 55 150Oil -- 0--------------------------------------------- 393 3 300 42 150
Total thermal production -288 1,100Hydroelectric- 19 4 60 101 300
Grand total -389 1, 400
1 Millions of short tons.2 Billions of cubic feetI Millions of barrels.4 Millions of kilowatts capacity.Source: "Resources For Freedom," President's Materials Policy Commission (Paley Commission), 1952, vol. 111, p. 36.
YEAR 2000 ESTIMATES-THEIR RELIABILITY
With that background, it is not to be anticipated that projectionsby the Department of the Interior to the year 2000 which are foundin table 5 are likely to prove to be more than rough approximationsof what is yet to develop over the next three decades. Whereas coalprovided more than half of the resources used to generate electricityin 1968, it is estimated that coal will contribute only about 30 percentof the total in year 2000. The comparative contribution of oil to thelarger supply of electricity in 2000 is estimated at only 5.5 percent,against 7 percent in 1968. Use of natural gas would decline from itspresent 23 percent of the total to 4.8 percent. Hydropower woulddecline comparatively to 7 percent from the recent 17 percent of thetotal. Nuclear power as a resource for the generation of electricitywould, by that recent estimate, increase from a barely significantfactor of less than 1 percent of the total in 1968 to the dominantposition of 52.5 percent in the year 2000.
Now, and as projected 30 years hence, geothermal sources, anddirect solar energy are both indicated as probably of little significanceas a resource in the generation of electricity. Much the same maywell be the case for tidal power, considering the substantial lagtime involved.
In any case attempts to project energy consumption or require-ment at future dates are relatively numerous. Because of differingassumptions used, they are not for the mostfpart directly comparable.Tables 6 and 7, provide some information on a number of projectionsmade from the time of the Paley Commission and prior to thoseshown in table 5.
46-366 0-70-3

26
TABLE 4.-ELECTRIC ENERGY PRODUCTION AND INSTALLED GENERATING CAPACITY, BY CLASS OF OWNERSHIPAND TYPE OF PRIME MOVER: 1940-68
[Production fur calendar years; other data as of Dec. 31. Prior to 1965, excludes Alaska and Hawaii. See also HistoricalStatistics, Colonial Times to 1957, series 5 15-35 and S 44-69j
Item 1940 1945 1950 1955 1960 1965 1967 1968 1
Production (bil. kw.-hr.)--------- 180 271 389 629 842 1,158 1,317 1,433Industrial plants 2....... -....... 38 49 60 82 88 '102 '103 '106Electric utilities (for public use)-142 222 329 547 753 1,055 1,214 1,327Privately owned 3------------- 125 181 267 421 579 809 928 1,019Percent of otility production ---- 88.4 81. 3 81. 1 76. 9 76.8 76.7 7.5 76. 8Publicly owned 3------------- 16 42 62 126 175 246 286 308Municipal- -~------------ 6 10 15 26 37 50 58 64Federal -- - 9 28 40 89 112 145 162 171Cooperatives and other ------- ---- 1 3 6 11 26 51 66 74Source of energy (percent):Coal o - 54.6 51.7 47.1 55.1 53.6 54.5 52.6 52. 5Oil- ------- --- -------------- 4.4 3.5 10.3 6.8 6.1 6.1 7.4 7.8Gas- - 7.7 8.9 13. 5 17. 4 21. 0 21. 0 21. 8 23. 0Hydro -33.4 35.9 29.2 20.7 19.3 18. 4 18.2 16.7Per kw. of capacity (kw.-br.)----3, 552 4,440 4,776 4, 779 4,484 4,469 4, 510 4, 570Installed capacity (mil. kw.) -51 63 83 131 186 255 288 309Industrial plants2 11 13 14 16 18 18 19 19Electric utilities (for public use) -40 50 69 114 168 236 269 290Privately owned - 34 40 55 87 128 178 204 220Percent of utility capacity -86.2 80.4 80.1 75.9 76. 5 75.2 75. 6 75. 8Publicly owned 3a ------------------------ 6 10 14 28 40 59 66 70Municipal -3 4 5 8 11 15 18 19Federal --------------- 2 5 7 17 22 32 34 35Cooperatives and other -(5) 1 2 3 6 11 14 16
TYPE OF PRIME MOVER
Electric utilities (for public use):Numberof plants, total- 3,918 3,886 3,867 3,587 3,435 3,290 3,378 3,439Hydro ----------------------------- 1 474 1,505 1,458 1,381 1,331 1,231 1,211 1,214Steam 1 153 1 057 1, 051 1 045 1, 060 1,068 71,149 '1200Internal combustion --------- 1 291 1324 11,358 1, 161 1, 044 11991 '1,0198 1,:0205Production (bil. w-hr.) - 142 222 329 547 753 1,055 1,214 1,327Hydro (bli. kw.-hr.)---------- 47 80 96 113 146 194 222 222Steam (bil. kw.-hr.) ---- - - 93 140 230 430 603 856 988 1 105Internal combustion (bil. kw.-hr.) --- 2 2 4 4 4 5 5 1Installed capacity (mil. kw.) -40 50 69 114 168 236 269 290Hydro -11 15 18 25 32 44 48 51Steam---------------- 28 34 49 87 133 189 7'217 7 235Internal combustion -1 I 1 2 2 3 3 4 4
I Preliminary.2 Plants of 100 kilowatts and over, including stationary powerplants of railroads.3 Noncentral stations included only in total prior to 1955; distributed to other publicly owned classes thereafter.4 Includes small percentage from wood and waste and also, in past few years, from nuclear fuel.
Less than 500,000 kw.6 Each prime mover type in combination plants counted separately.7 Includes gas turbine capacity: 3,000,000 kilowatts in 1967 at 140 plants and 6,000,000 kilowatts in 1968 at 197 plants.Source: Statistical Abstract of the United States, 1969. U.S. Department of Commerce, 90th ed., p. 511.
TABLE 5.-RESOURCES USED TO GENERATE ELECTRICITY
Percent of total Quantities '
1968 2000 1968 2000
Coal - .51.9 30.2 297 1,000 (millions of tons).Oil -7. 0 -5. 5 187 800 (millions of barrels).Gas- -powe 23.0 4.8 3.1 4 (trillions of cubic feet).Nuclear power --------------- .8 52.5 .-------Hydropowerw--17.3 7. :- -0
I Assuming no changes in generation technology.Soorce: Statement of Mr. Harry Perry, research adviser to the Assistant Secretary for Mineral Resources before theJoint Committee on Atomic Energy, Nov. 4, 1969, in "Environmental Effects of Producing Electric Power." Henrings beforethe Joint Committee on Atomic Energy, 91st Cong., 1st ness., 1969, p. 321.

27
TABLE 6.-PROJECTIONS OF DOMESTIC ENERGY CONSUMPTION
Year Data on-
Source and publication date Popula- Fuel Fuel Elec-1975 1980 2000 tion form function tricity
Paley (1952)- X--- X- X- X- XPutnam (1953)- - X- XBureau of Mines (1956) --- - X---- XInterior-McKinley (1956)- - X --- XTeitelbaum (1958) - -X-- X- X------------ XLamb (1959)-- X-- X-X-- XSporn (1959) -X-- X- X- X-- XSchurr and Netschert (1960)- X --- X- X- X- XSearl (1960) - - X- X- X- XWeeks (1960)- - X- X-- XTexas Eastern Transmission Corp. (1961)- X- - X- X- X- XHubbert (1962)- - X- XAtomic Energy Commission (1962)-- X- X- X --- XLasky Study Group (1962)-- X-- X- X-- XLandsberg (1963)- - X- X- X- X- X- X
Source: Energy R. & D. and National Progress prepared for the Interdepartmental energy study by the Energy StudyGroup under the direction of Ali Bulent Gambel, 1964, p. 16.
TABLE 7.-U.S. ENERGY AND PETROLEUM REQUIREMENTS FOR 1980'
Oil GasTotal
energy Million Trillionquad. barrels Percent cubic Percent of
Source Date B.t.u. per day total feet total
National Fuels and Energy Study Group2 1962 82.0 16.7 41 21.2 28Department of Interior -1965 85.9 17.5 40 25.6 31Pan American Petroelum Corp.2 1966 87.0 - 18.6 43 28.0 33American Gas Association 2- ----------------------- 1966 -27.2Stanford Research Institute - 1967 92. 0 18.2 39 27.9 31The Gas Industry Committee -1967 ---- 28.6First National City Bank of New York 2_ _----------- 1967 87.2 17.2 38 23.6 28The Petroleum Industry Research Foundation - 1968 92.0 18.0 39 28. 0 31Texas Eastern Transmission Corp -1968 97.8 18.9 41 30.8 33Humble Oil & Refining Co -1968 97.3 18. 2 37 29.8 32Department of Interior (current survey) -1968 88.1 18.2 41 24.6 29
I Exptanation provided by the Department of the Interior included: "Energy projectiun claims the attention of many ingovernment and industry alike. Shown below are extracts trom 10 recent studies by various sources giving estimates ofthe 1980 requirements at the United States for oil, gas, and total energy. Totals arrived at in this survey are shown as thelast item for purpnses at comparison. Although not directly comparable because of differing assumptions used, the es-timates do provide a useful guide to current opinion on the energ outlook."
roiI and gas consumption obtained by converting B.t.u. to barrels and cubic feet at the rate of 5,400,000 B.tu. per barreland 1,035 B.t.u. per cubic font
Source: "United States Petroleum Through 1980," U.S. Department of the Interior, 1969. p. 5.

28
TABLE 8.-FORECASTS OF TOTAL ENERGY REQUIREMENTS
[Trillions of B.t.u:'sj
Date ofpubli- Base Base
Source document cation years value 1970 1975 1980 1985 2000
CGAEM I-1968 1947-65 30,838 64,444 79,611 97,825 119,597 .52, 350
EUS -- Seoft1960-65 41,453 60,827 79,944 93,374 118,126
P967 50,314N.F. & ES - Sept 1961 44, 064- - 3 82, 000RAF -Sept. 1960 45, 250 60,190 -79, 200 -135, 200PEC -Dec. 1947 33,168 -85, 934 .
1968 1962 47,897ER -Dec. 190740 14,600 --- 461,0001962 44, 900
OEUS -Oct 1950-65 ---- 5 97, 0001968
USP -July 1965 54,000 --- 88,1001968
EMUS -July 1947465 33,168 64,276 75, 605 88,075 -168, 6001968 53,791 283,900 2158,951PCCP2 -May 1948-65 54,000 --- 91,000 -155, 0001968
FFF -October 1953 41,000 -- 73,000 86,200 -170,0001960
TCUSEC -1968 1960 48,200 --- 90,300 174, 000(99, 700) (213, 000)
H Nydro accounted for at kw.-hr. energy equivalent2 Excludes nonfuel uses.3 Consensus of 11 forecasts.' Minimum.' Converting their 17,000 million barrels of oil equivalent to B.t.u. 5,800,000 B.tu. per barrel.'GNP growth rate at 3.5 percent per year and (4.0 percent per year.Source: "Review and Comparison of Selected United States Energy Forecasts," Op. cit, p. 12.
In March 1970, the Office of Science and Technology, of the Ex-ecutive Office of the President released a report prepared for theEnergy Policy Staff of OST by the Battelle Memorial Insitute.1 Itsprimary purpose was to analyze the adequacy of existing, publishedenergy forecasts for public policy purposes. The essence of nineteenrecent energy forecasts published by private organizations, govern-ment agencies and individuals was collected and studied. Perhaps notunexpected in view of the differences in terminology, coverage andassumptions, significant deficiencies for policy planning purposeswere found in the existing forecasts studied. In particular, most ofthe forecasts were prepared prior to the recent concern with environ-mental quality and hence do not reflect the possible effects of develop-ing environmental policies on energy supply and demand.
The Study Group examined the following 19 forecasts:NF&ES - Report of the National Fuels and Energy Study Group on
Assessment of Available Information on Energy in theUnited States, Committee on Interior and Insular Affairs,U.S. Senate, September 1962.
ERDNP - Energy R. & D. and National Progress InterdepartmentalEnergy Study, Energy Study Group, Ali Bulent Cambel,June 1964 (U.S. Government Printing Office).
USP -United States Petroleum Through 1980, U.S. Department ofthe Interior, Office of Oil and Gas, July 1968.
FGNP -Forecast of Growth of Nuclear Power, WASH-1084, U.S.Atomic Energy Commission, Division of Operations Analysisand Forecasting, 1967.
I "A Review and Comparison of Selected United States Energy Forecasts," by PacifIc Northwest Labo-ratories of Battelle Memorial Institute, December 1969, Washington, D.C., U.S. Government PrintingOffice, 1970, 79 pages.
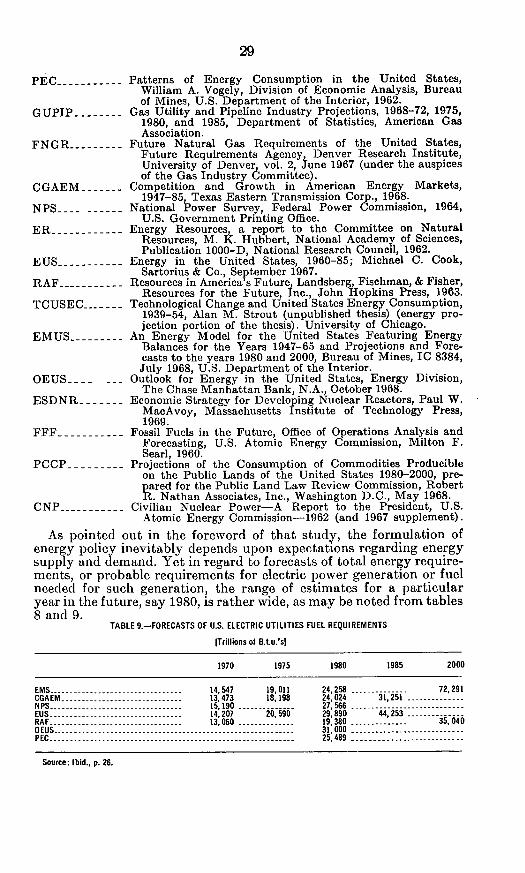
29
PEC --
GUPIP.
FNGR_
CGAEM
NPS-
ER.
EUS-
RAF -
TCUSE(
Patterns of Energy Consumption in the United States,William A. Vogely, Division of Economic Analysis, Bureauof Mines, U.S. Department of the Interior, 1962.
Gas Utility and Pipeline Industry Projections, 1968-72, 1975,1980, and 1985, Department of Statistics, American GasAssociation.
Future Natural Gas Requirements of the United States,Future Requirements Agency, Denver Research Institute,University of Denver vol. 2 June 1967 (under the auspicesof the Gas Industry dommiittee).
- Competition and Growth in American Energy Markets,1947-85, Texas Eastern Transmission Corp., 1968.
National Power Survey, Federal Power Commission, 1964,U.S. Government Printing Office.
Energy Resources, a report to the Committee on NaturalResources, M. K. Hubbert, National Academy of Sciences,Publication 1000-D, National Research Council, 1962.
Energy in the United States, 1960-85; Michael C. Cook,Sartorius & Co., September 1967.
Resources in America s Future, Landsberg, Fischman, & Fisher,Resources for the Future, Inc., John Hopkins Press, 1963.
… Technological Change and United States Energy Consumption,1939-54, Alan M. Strout (unpublished thesis) (energy pro-jection portion of the thesis). University of Chicago.
An Energy Model for the United States Featuring EnergyBalances for the Years 1947-65 and Projections and Fore-casts to the years 1980 and 2000, Bureau of Mines, IC 8384,July 1968, U.S. Department of the Interior.
Outlook for Energy in the United States, Energy Division,The Chase Manhattan Bank, N.A., October 1968.
Economic Strategy for Developing Nuclear Reactors, Paul W.MacAvoy, Massachusetts Institute of Technology Press,1969.
Fossil Fuels in the Future, Office of Operations Analysis andForecasting, U.S. Atomic Energy Commission, Milton F.Searl, 1960.
Projections of the Consumption of Commodities Producibleon the Public Lands of the United States 1980-2000, pre-pared for the Public Land Law Review Commission, RobertR. Nathan Associates, Inc., Washington D.C., May 1968.
Civilian Nuclear Power-A Report to the President, U.S.Atomic Energy Commission-1962 (and 1967 supplement).
EMUS-
OEUS_
ESDNR
FFF-
PCCPR
CNP -
As pointed out in the foreword of that study, the formulation ofenergy policy inevitably depends upon expectations regarding energysupply and demand. Yet in regard to forecasts of total energy require-ments, or probable requirements for electric power generation or fuelneeded for such generation, the range of estimates for a particularyear in the future, say 1980, is rather wide, as may be noted from tables8 and 9.
TABLE 9-FORECASTS OF U.S. ELECTRIC UTILITIES FUEL REQUIREMENTS
[Trillions of B.Lu.'sl
1970 1975 1980 1985 2000
EMS 14,547 19,011 24,258 -- 72,291CGAEM -13,473 18,198 24 024 31,251NPS -15,190 27,566.EUS -14,207 20,590 29,890 44,253.RAF 13, 060 -19, 380 - - 35,040OEUS -31, 000 .PEC -25,489-
Source: Ibid., p. 26.
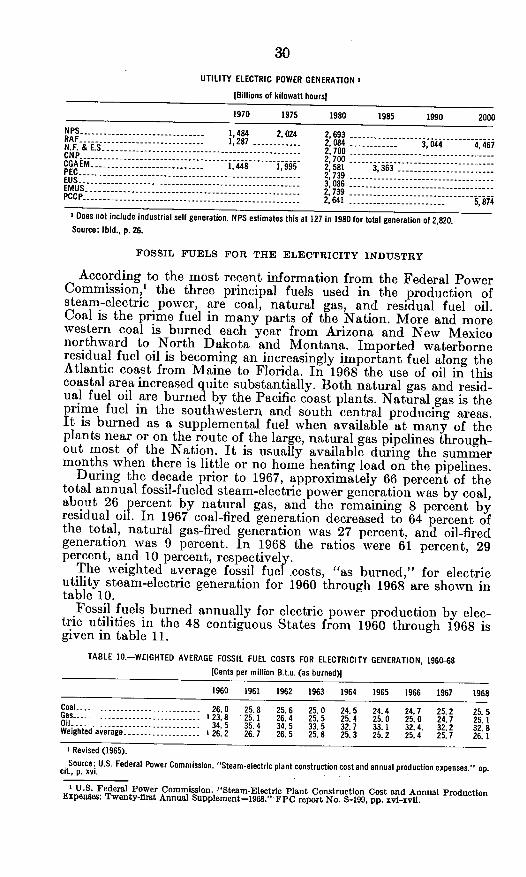
30
UTILITY ELECTRIC POWER GENERATION I
IBillions of kilowatt hoursi
1970 1975 1980 1985 1990 2000
NPS___ ---------.----------------- I 484 2,024 2 693N.F. & E.S 1,287-2,084-3,04 4,46C N Pi ----------------------------- .......... 2,700 ..CGAEM ~ ~ ~ ~ ~ ~ .............. 2,700 -----------------CGAEM -1,448 1,995 2, 581 3,363EUS ---------------------- 2,739EMUS ----------------------------------- - --------- 3,086-EMS----------------------------- - 2,739 ------------------PCCP___ ___--__--____--__------_____--_--___--_--_----____- 2,641 -5,874
X Does not include industrial sell generation. NPS estimates this at 127 in 1980 for total generation of 2,820.Source: Ibid., p. 26.
FOSSIL FUELS FOR THE ELECTRICITY INDUSTRY
According to the most recent information from the Federal PowerCommission," the three principal fuels used in the production ofsteam-electric power, are coal, natural gas, and residual fuel oil.Coal is the prime fuel in many parts of the Nation. More and morewestern coal is burned each year from Arizona and New Mexiconorthward to North Dakota and Montana. Imported waterborneresidual fuel oil is becoming an increasingly important fuel along theAtlantic coast from Maine to Florida. In 1968 the use of oil in thiscoastal area increased quite substantially. Both natural gas and resid-ual fuel oil are burned by the Pacific. coast plants. Natural gas is theprime fuel in the southwestern and south central producing areas.It is burned as a supplemental fuel when available at many of theplants near or on the route of the large, natural gas pipelines through-out most of the Nation. It is usually available during the summermonths when there is little or no home heating load on the pipelines.
During the decade prior to 1967, approximately 66 percent of thetotal annual fossil-fueled steam-electric power generation was by coal,about 26 percent by natural gas, and the remaining 8 percent byresidual oil. In 1967 coal-fired generation decreased to 64 percent ofthe total, natural gas-fired generation was 27 percent, and oil-firedgeneration was 9 percent. In 1968 the ratios were 61 percent, 29percent, and 10 percent, respectively.
The weighted average fossil fuel costs, "as burned," for electricutility steam-electric generation for 1960 through 1968 are shown intable 10.
Fossil fuels burned annually for electric power production by elec-tric utilities in the 48 contiguous States from 1960 through 1968 isgiven in table 11.
TABLE 10.-WEIGHTED AVERAGE FOSSIL FUEL COSTS FOR ELECTRICITY GENERATION, 1960-68[Cents per million B.t.u. (as burned)]
1960 1961 1962 1963 1964 1965 1966 1967 1968
Coal - 26.0 25.8 25.6 25.0 24.5 24.4 24.7 25.2 25.5Gas - 23. 8 25.1 26.4 25.5 25.4 25.0 25.0 24.7 25.1Oil ----------------- 34.5 35.4 34.5 33.5 32.7 33.1 32. 4. 32.2 32.8Weighted average - . .. 26.2 26.7 26.5 25.8 25.3 25.2 25.4 25.7 26.1I Revised (1965).Source: U.S. Federal Power Commission. "Steam-electric plant construction cost and annual production expenses." op.cit., P. Xvi.
' U.S. Federal Power Commission. "Steam-Electric Plant Construction Cost and Annual ProductionExpenses: Twenty-first Annual Supplement-1968."- FPC report No. S-199, pp. xvi-xvii.

31
TABLE 11-CONSUMPTION OF FOSSIL FUELS, 1960468
Total, millionCoal, million Gas, billion Oil, million tons coal
Year tons cubic feet barrels equivalent
1960 -176. 6 1,724.5 85. 3 266. 41961----------------------------- 182.1 1,825.t 85.7 276.41962 -1- - 193. 2 1,966. 0 85. 8 293.61963 -211.2 2,142.9 89. 3 320. 319864 -225. 3 2,321. 3 96.7 344. 41965 -244.9 2, 316.2 110. 5 367. 41966 -266.4 2,608. 8 140.9 418. 71967 - 274. 1 12,741.9 150. 0 1437. 01968 -- 296. 8 23,138.3 2182.1 244. 3
X Revised.2 Preliminary.
Source: U.S. Federal Power Commission. "Steam-electric plant construction cost and annual production expenses."Twenty-first annual supplement-1968. 1970, p. xvii.
Total fuel consumption in 1968 was approximately 10 percentgreater than in 1967.
Coal is inherently the most efficient of the three fossil-fuels usedfor power production purposes. A good grade of coal properly firedin a well-maintained boiler will produce more useful heat energy thanan equivalent amount of natural gas or fuel oil. This is because coalcontains less hydrogen than natural gas or oil. In the combustionprocess, the hydrogen in the fuel is converted to water and the latentheat of the water vapor resulting from the burning of the hydrogenis lost as useful work. Therefore, there are two values for a givenfuel, the higher heating value (HHV) which includes the energy inthe hydrogen, and the lower heating value (LHV) which excludesthis energy. Generally speaking fuel prices are compared on a B.t.u.content basis using higher heating values. The higher heating valuesof fossil fuels are the U.S. standard in determining thermal efficiencyor heat rate in the production of steam-electric power.
THE COMPETITIVE SITUATION OF FOSSIL AND NUCLEAR FUELS-BY
REGION
The following general appraisal by the Federal Power Commissionof the competitive positions of nuclear and fossil fuels by principalregions of the United States was presented to the Joint Committeeon Atomic Energy in November 1969.'
New England and Middle Atlantic States.-With the exception ofcentral and western Pennsylvania, where low-cost coal is abundantlyavailable, the New England and Middle Atlantic States do not haveaccess to low-priced coal. The competitive fuels in these areas are theimported low-sulfur-residual oils in locations with deepwater portfacilities, and nuclear fuels.
East North Central States.-In these States coal has a marginal ad-vantage over nuclear fuel. Most of the coal in this area, however, hasa very high sulfur content and is not a competitor where air pollutionregulations restrict the emissions of sulfur oxides.
West North Central States.-Both coal and natural gas competeeffectively throughout most of this area, in part because of the rela-tively small average size of units which are required to accommodate
' Testimony of F. Stewart Brown, Federal Power Comnmisston. In "Environmental Effects of ProducingPower." Hearings before the Joint Committee on Atomic Energy, 91st Cong., ist sess., 1969, pt. 1. pp.57-58.

32
the incremental energy demand in the region. Gas is expected to re-main the dominant fuel in Kansas, and very low-cost, low-sulfurlignite will predominate in North Dakota. In Missouri, high-suflurcoal has a significant advantage over nuclear fuel. The effectivenessof this price advantage can be expected to be diminished by airpollution control regulations.
South Atlantic States.-Although coal accounts for about 80 percentof the thermal generation (the use of residual fuel oil is significantonly in Florida) its competitive position vis-a-vis nuclear fuel isweak except for West Virginia, which is the leading coal-producingState in the Nation. In this State coal will continue to be the principalfuel for electric power generation.
East South Central States.-Low-cost coal will continue to be highlycompetitive with nuclear fuel in Alabama, Kentucky, and Tennessee.Natural gas will prevail in Mississippi.
West South Central States.-Practically all the thermal electric powerin this area is generated with natural gas. This region, including its off-shore areas, is the origin of 80 percent of the Nation's current consump-tion of natural gas. Gas will continue to be the principal source ofprimary energy for electric power generation in the foreseeable future.
Mountain States.-The Mountain States are well endowed withlow-cost, low-sulfur coal and this fuel will remain the dominant fuelin the electric utility market of the area. In addition, significantquantities of natural gas will continue to be used in Arizona, Nevada,and New Mexico.
Pacificc States.-Although plans are underway for the use of coal forelectric power generation in this region, to date, more than four-fifthsof thermal electric generation is produced with natural gas, and theremainder with residual fuel oil. The cost of fossil fuels in the PacificStates, however, is generally high, and nuclear fuels should be able tocompete effectively in the area, assuming that suitable sites fornuclear generation can be established.
In summary, it appears to the Federal Power Commission thatnuclear generation will be competitive with other fuels during the nexttwo decades in the New England States; in the Middle Atlantic Statesexcept Pennsylvania; throughout most of the South Atlantic Statesexcept for West Virginia; in parts of East Central States as they aresubjected to more stringent regulations on the emission of sulfuroxides; and in all of the Pacific Coast States.
COAL FOR ELECTRICITY
The United States is well endowed with coal resources. Coal isextensively used in power generation, accounting for more than 60percent of present thermal electric energy production. During muchof the 1950's and the first half of the 1960's, labor productivity andthe technology of mining and transportation advanced rapidly,resulting in a declining delivered price of coal to ultimate consumers.In the past several years, however, a number of developments havetended to exert upward pressure on the price of coal. Among thesedevelopments have been the general inflationary trends affecting thecost of labor and materials; laws requiring the restoration of minedlands; the need to pievent acid mine-water drainage into rivers,

33
lakes, and groundwater reservoir; air pollution regulations limitingthe sulfur content of the coal used; and more stringent health andsafety regulations for the operation of coal mines.Adequacy of coal resources
If the projections shown in table 5 are approximately correct, de-mands on coal resources for generation of electricity would be increasedfrom about 300 million tons per year at present to about 1 billion tonsin the year 2000 A.D. It should first of all be noted as regards thesematerials that there is no near-term U.S. shortage of resources innature. Coal is, so to speak, along with atomic power, our probableace in the hole for the next several centuries. Total U.S. coal productionin 1968 was 556,044,000 tons, very nearly the same as the 560,388,000tons of 1950. In very large part this production was of the bituminoustype, though small amounts of lignite and anthracite were included.About half of the 1967 total was used in generating electricity. Anunofficial estimate indicated that about 310 million tons of coal wereused by the utilities in 1969.1 If by the year 2000, U.S. productionpossibly should be increased to 2 billion tons per year, with half ofthat total supplying the 1-billion-ton demand projected for generationof electricity (table 5), coal resources in the ground appear to be fullyadequate for many decades. Capital, labor, and technology for economicremoval of coal from its geologic formation appear more likely toconstitute possible bottlenecks than the availability of the raw resourceitself.
Parenthetically, it has been noted by Hubbert 2 that although coalhas been mined for about 800 years, one-half of the coal producedduring that period has been mined during the last 31 years. For theworld, he finds that during a period from World War II to the presentthere has been a growth rate of 3.6 percent, with a doubling period of20 years.The Geological Survey estimate of 1967
It is true that coal resources are very largely underground andattempts are made from time to time at estimation, reevaluation andredefinition. The latest major official attempt was published in 1969.3In brief, it estimated coal resources of the United States at a total of3,210 billion tons, of which about half may be considered recoverable.About half of the total was determined from mapping and explorationat depths of 0 to 3,000 feet of overburden (table 12).
>"The Journal of Commerce" (New York), Mfar. 18, 1970, p. 10.' See M. King Hubbert, "Energy Resources," ch. 8 in "Resources and Man-a Study and Recommen-
dations," Committee on Resources and Man, National Academy of Sciences-National Research Council,W. H. Freeman & Co., San Francisco, 1969, p. 166.
"Coal Resources of the United States, Jan. 1, 1967," Geological Survey Bulletin 1275, GPO, Washing-ton, D.C., 1969, 116 pages.

TABLE IZ-TOTAL ESTIMATED REMAINING COAL RESOURCES OF THE UNITED STATES, JAN. 1, 1967
In millions of short tons. Figures are for resources in the ground, about half of which may be considered recoverable. Includes beds of bituminous coal and anthracite 14 inches or more thick and beds ofsubbitumninous coal and lignite 2.5 feet or more thick)
Overburden 0-3,000 ft thick Overburden3,000-6,000 EstimatedResources determined by mapping and exploration (from table 1) Estimated font thick, total
additional Estimated estimated remainingresources total remain- resources resources in
Anthracite in unmapped ing resources in deeper the ground,Bituminous Subbitu. and semni- and anon- in the structural 0-6,000 feetState coal minous coal Lignite anthracite Total plored area I ground basins I overburden
Alabama -13, 518Alaska - --------------------------------------- 19,415Arkansas -1,640Colorado -62,389Georgia -18Illinois -139, 756Indiana - -- ---------------------------------- 34,779Iowa- 6,519Kansas -18 686Kentucky -------------------------- 65,952Maryland - ------ ----------------------------- 1,172Michigan --------------------------- 205Missouri -23, 359Montana ------------------------ 2,299New Mexico ---------------------------------------- 10, 760North Carolina ------- 110North Dakota ----- -- 0Ohio -41,864Oklahoma -3,299Oregon -48Pennsylvania - , 57, 533South Dakota- 0Tennessee -2,652Texas- ------------------------------------------ 6048Utah -32,100Virginia -------------------------- ------- 9,710Washington -1,867West Virginia --- 102 034Wyoming -12699Other States - 618
0110, 674
018,248
000000000
131,87750, 715
0000
2840000
1500
4,1940
108,0117 4, 057
20
0000
0
000
87, 52500
350,6800
02 031
0
6,8780
11700
(2)e 46
0 13, 538 20, 000 33, 538(a) 130, 089 130, 000 260, 08940 2, 420 4, 000 6,420
78 80,715 146,000 226,7150 18 60 780 139,756 100,000 239,7560 34,779 22, 000 56, 7790 6, 519 14, 000 20, 5190 18,686 4,000 22.6860 65.952 52,000 117,9520 1,172 400 1,5720 205 500 7050 23,359 0 23,3590 221,701 157,000 378,7014 61,479 27,000 88,4790 110 20 1300 350, 680 180, 000 530,6800 41,864 2,000 43,8640 3,299 20, 000 23, 2990 332 100 432
12, 117 69, 650 110 000 79, 6500 2,031 1,000 3,0310 2,652 2,000 4.6520 12,926 14,000 26,9260 32, 250 48, 000 80, 250
335 10,045 3,000 13,0455 6,183 30,000 36,1830 102. 034 0 102,0340 120. 710 325,000 445,7100 4,721 1,000 5,721
6, 0005, 000
0145, 000
0000000000
21. 000500
10, 00000000
35,000100
15, 0000
100, 0000
39, 538265,089
6, 420371, 715
78239, 75656,77920, 51922,686
117, 9521, 572
70523 359
3783 701109, 479
130530, 68543,86433,299
43279,6503,0314,652
26 926115, 25013,14551. 183
102, 034545, 710
5, 721Total 671,049 428, 210 447,647 12, 969 1, 559, 875 1,313, 080 2,872,955 337,105 3,210,060
(hi Estimates by H. M. Belkman (Washington), H. L. Berryhill, Jr. (Virginia and Wyoming) R. A. Brant Small resources of lignite in beds generally less than 30 inches thick.(hio and North Dakota), W. C. Culbertson (Alabama), K. J. England (Kentucky), B. R. Haley (Ar- After Ashley (1944).kansas), E. R. Landis (Colorado and Iowa), E. T. Luther (Tennessee), R. S. Mason (Oregon) F C Arizona, California, Idaho, Nebraska, and Nevada.Peterson (Kaiparowits Plateau, Utah), J. A. Simon (Illinois), J. V. A. Trumbull (Oklahoma), C. E. Wier 7 Arizona, California, and Idaho.(Indiana), and the author for the remaining States. -i California, Idaho, Louisiana, Mississippi, and Nevada.
S alresources and production of lignits included ne a bt mn a ola Small resourcesof anthraciteinthe BeringRinerfield believedtobetoobadlycrushedand faulted Source: "Coal Resources of the United States, Jan. 1, 1967," op. cit. pp. 12-13.
to be economically recoverable. (See Barnes, 1951).
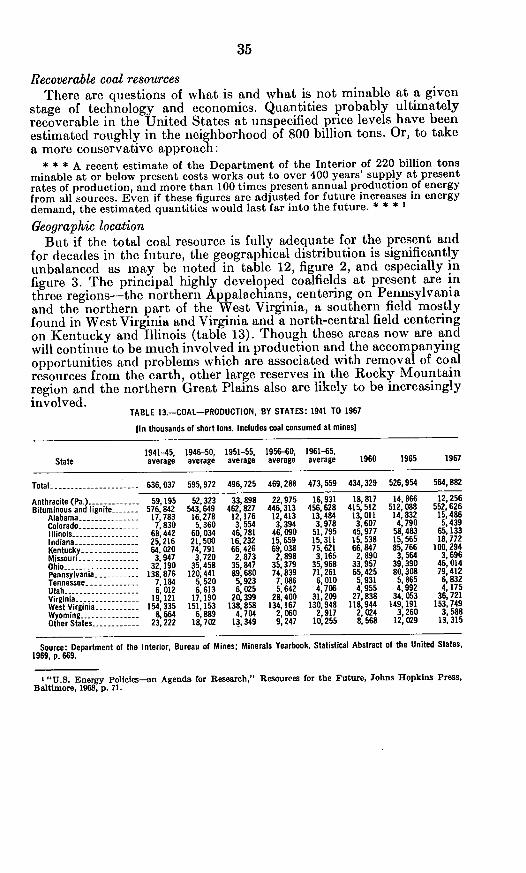
35
Recoverable coal resourcesThere are questions of what is and what is not minable at a given
stage of technology and economics. Quantities probably ultimatelyrecoverable in the United States at unspecified price levels have been
estimated roughly in the neighborhood of 800 billion tons. Or, to take
a more conservative approach:* * * A recent estimate of the Department of the Interior of 220 billion tons
minable at or below present costs works out to over 400 years' supply at present
rates of production, and more than 100 times present annual production of energy
from all sources. Even if these figures are adjusted for future increases in energy
demand, the estimated quantities would last far into the future. ***
Geographic locationBut if the total coal resource is fully adequate for the present and
for decades in the future, the geographical distribution is significantly
unbalanced as may be noted in table 12, figure 2, and especially in
figure 3. The principal highly developed coalfields at present are in
three regions-the northern Appalachians, centering on Pennsylvaniaand the northern part of the West Virginia, a southern field mostly
found in West Virginia and Virginia and a north-central field centering
on Kentucky and Illinois (table 13). Though these areas now are and
will continue to be much involved in production and the accompanyingopportunities and problems which are associated with removal of coalresources from the earth, other large reserves in the Rocky Mountainregion and the northern Great Plains also are likely to be increasinglyinvolved.
TABLE 13.-COAL-PRODUCTION, BY STATES: 1941 TO 1967
[In thousands of short tons. Includes coal consumed at mines;
1941-45, 1946-50, 1951-55, 1956-60, 1961-65,State average average average average average 1960 1965 1967
Total -636, 037 595, 972 496, 725 469, 288 473, 559 434, 329 526, 954 564, 882
Anthracite (Pa.) -59,195 52, 323 33, 898 22, 975 16,931 18,817 14,866 12, 256
Bituminous and lignite - 576,642 543,649 462, 827 446,313 456, 628 415, 512 512, 088 552, 626
Alabama -17,783 16,278 12,176 12,413 13,464 13,011 14,832 15,486
Colorado -7,830 5,360 3,554 3,394 3,978 3,607 4,790 5,439
Illinois -68,442 60,034 46,781 46,090 51,795 45,977 58,483 65,133
Indiana --------- 25,216 21,500 16,232 15,659 15,311 15,538 15,565 18,772Kentucky -64,020 74, 791 66,426 69,038 75, 621 66,47 85, 766 100,294
Missouri -3,947 3,720 2,873 2,898 3,165 2,890 3,564 3,696
Ohio -32,190 35,458 35,847 35,379 35, 968 33,957 39,390 46,014
Pennsylvania- 138,876 120, 441 89,680 74,839 71,261 65,425 80,308 79,412
Tennessee- 7, 14 5,520 5,923 7, 086 6, 010 5,931 5, 865 6,832
Utah----------- 6, 012 6,613 6, 025 5,642 4,706 4,955 4,992 4, 175
Virginia -19,121 17, 190 20, 399 28, 400 31,209 27, 838 34 053 36,721
West Virginia - 154,335 151,153 138,858 134,167 130,948 118,944 149,191 153,749
Wyoming- 8,664 6,889 4,704 2,060 2,917 2,024 3,260 3,588
Other States -23, 222 18, 702 13, 349 9,247 10,255 8,568 12,029 13,315
Source: Department of the Interior, Bureau of Mines; Minerals Yearbook. Statistical Abstract of the United States,
1969, p. 669.
X"U.S. Energy Policies-an Agenda for Research," Resources for the Future, Johns Hopkins Press,
Baltimore, 1968, p. 71.

FIGURE 2
Coal fields of the conterminous United States
EXPLANATI0 N| i
Low-volatile bituminou towl
Xedium. and high-volatil.bitominous Coal..
Bahhituminoua -l l
Source: Col Ro 400 600 MILS o
Source: Coal Resources of the United States, January 1, 1967, op. Cit., p. 5.
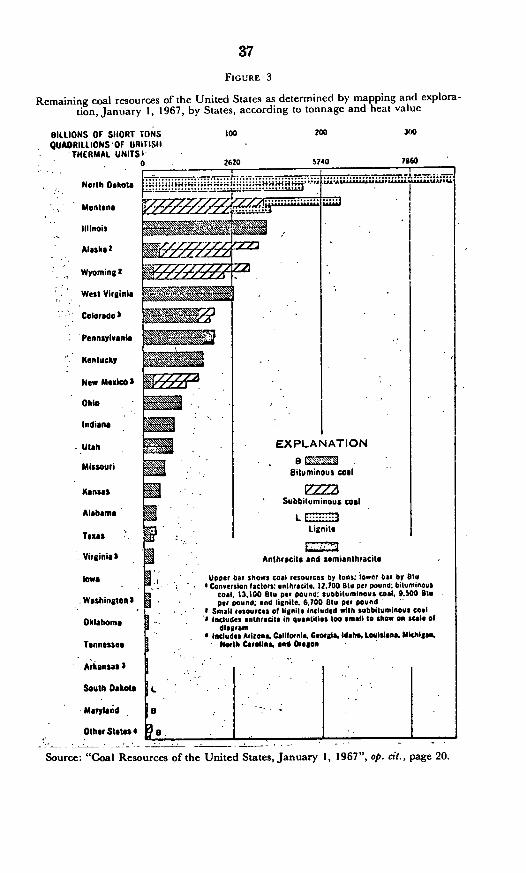
37
FIGURE 3
Remaining coal resources of the United States as determined by mapping and explora-tion, January 1, 1967, by States, according to tonnage and heat value
BILLIONS OF SIIORT TONS toO 200 300QUADRILLIONS OF URITISII
THERMAL UNITS '0 2620 5240 1560
North Dakota "22tttuz *'.. :1... - LWAUAAA.*tAAAA*A
Montana
Illinois ', .
AtaskaZ
Wyoming2 -
West Virginia | * :
Colorado 3
Pennsylvania
Kentucky
Now Mexico 3:
Ohio
Indiana
Utah i EXPLANATION
MfissouriEti Missouri Bituminous coal
Kansits gi -V//Subbituminous coal
Alabama ~Lignite
Texas:Linl
Virginial Anthracite and semianthracite
km& a Upper bar shows Coal resources by tons; lower bar by Btu.. ; |Converslon factors: anthracite. 12.100 Btu per Pound: biluminous
coatl 13.100 Btu per pound suobbiluminous coal, 9.500 SteWashingtonl per pound: and lignite. 6.700 Stu per pound
Small resources of lignite included with subbiluminots coalOklahoma a Includes anthracite in quantities too small to show on scale ofdiagira
a Includes Arizona. Calitolern. Ceorgla. Ideho. Louisiana. Michigsa.Tennessee North Caralina. at Oregao
Arkansas 3
South Dakotb L
Maryland it
Other States4 tt
Source: "Coal Resources of the United States, January 1, 1967", op. cit, page 20.

38
STRIP MINING OF COAL
In 1965 about 171,179,751 tons of coal were produced by "strip-ping," a form of mining which consists of removing the overburdenso as to expose the coal horizon or vein to removal by comparativelyeasy mechanical techniques (table 14). The 12,256,000 tons ofPennsylvania anthracite coal produced in 1967, and valued at$96,160,000 is estimated to be only slightly involved in fuelingelectricity generation and will not here be discussed separately.Bituminous and lignite coals, of which 552,626,000 tons valued at$2,555,377,000 were mined in 1967, are directly involved. Moreover,these types provide very substantial reserves which, because of theirquality and comparatively easy availability, are presumed likely toprovide an increasing fraction of the larger tonnage needed in thePuture.
In 1963, 6,305 "establishments" were engaged in production ofthese coals, down from 6,940 in 1958 and 6,865 establishments in1954. In 1968, the number of such mines had declined to 5,327 inwhich an average of about 131,000 men worked, producing 545,245,000tons valued at $2,546,340,000.1
Of the total production of slightly less than 550,000,000 tons of U.S.bituminous and lignite coals mined in 1968, 185,836,000 tons weremined by 1,492 strip mines.2 But information is not at hand as tohow much coal produced by stripping, as distinguished from coalsproduced by underground operation, were used for generation ofelectricity.
Statistics at hand (table 15) indicate that less than one-fourth ofU.S. coal mines are strip mines and that 46 percent of the strip minesare small and produced less than 25,000 tons in 1965, whereas about127 of the largest mines each produced 250,000 or more tons in thatyear.
TABLE 14-PRODUCTION OF COAL I BY STRIPPING IN THE UNITED STATES IN 1965, BY STATE
State Short tons State Short tons
Alabama -4,808,844 North Dakota -2,730,594Alaska -893,182 Ohio -26,634,829Arkansas ---------------- 151, 593 Oklahoma---------------- 964, 061Colorado -1,270,129 Pennsylvania -- 29,706,420Illinois -32,669,583 South Dakota -10,000Indiana -13,210,102 Tennessee -- ----------- - 2, 066,777Iowa -846,758 Virginia -3,080, 742Kansas --- I----------------------- 1,309,744 Washington -2,658Kentucky --- --------------------- 30, 142, 599 West Virginia -10, 462,246Maryland- 736,841 Wyoming ---- -- 3,135,955Missouri -3, 538, 042Montana -- 300,459 Total -171,179,751New Mexico -2,777, 593
I Includes anthracite, bituminous coal and lignite.
Source: "Surface Mining and Our Environment", U.S. Department of the Interior, 1967, p. 115.
1 Minerals Yearbook 1968, vols. 1-11, Washington, D.C., 1969, p. 301.2Ibid., pp. 344-345.

TABLE 15.-NUMBER OF STRIP PITS IN THE UNITED STATES REPORTING PRODUCTION OF BITUMINOUS COAL AND LIGNITE IN 1965,. BY TONNAGE CATEGORY AND STATE
500,000 tons and over 250,000-500,000 tons 100,000-250,000 tons 50,000-100,000 tons 25,000-50,000 tons Less than 25,000 tons Total
Production Production Production Production Production Production Production(thousand (thousand (thousand (thousand (thousand (thousand (thousand
State Mines net tons) Mines net tons) Mines net tons) Mines net tons) Mines net tons) Mines net tons) Mines net tons)
Alabama -2 1,085 2 521 12 1,812 10 746 13 455 19 190 58 4,809Alaska --- 1 435 2 454 ----- 1 4 4 893Arkansas ------- 1 87 1 41 2 23 4 181Colorado - 1 553 1 393 1 224 1 67 3 33 7 1,270Illinois -23 28, 783 8 3, 083 3 412 3 182 4 129 8 80 49 32, 669Indiana 11 10,846 5 1,940- - - 2 132 5 172 18 120 41 13,210Iowa --------------------------------- - - - 3 417 3 204 4 146 9 80 19 847Kansas------------ 1 842 1 261 1 181---------------------- - - - 3 26 6 1,310Kentucky -14 23, 622 6 2,202 14 2,288 12 867 21 704 49 460 116 30,143Maryland - - - - -1 203 1 73 7 235 26 226 35 737 CIOMissouri -3 2,888 1 442 - - - 2 112 2 61 5 35 13 3,538 coMontana --- 1 298------- 2 2 3 3002New Mesicn --------- 1 2,398 1 369-------------------------------- - - - - - 1 11 3 2,778North Dakota- 1 1,073 2 685 4 646 2 149 1 37 18 141 28 2,731Ohio------------- 12 12,923 8 2,681 32 4,704 50 3,407 45 1,605 117 1,045 264 26,365Oklahoma - - -1 296 2 380 3 208 2 62 3 18 11 964Pennsylvania -1 1,096 7 2,353 30 3,974 131 8,635 123 4,652 289 3,057 581 23,767South Dakota ------------ - -------------------------------------------------------------------------------- 1 10 I 10
6 896 11 693 7 264 17 214 41 2,067Virginia - ----------------------------- 3 971 5 685 10 767 15 508 23 150 56 3,081W a h ngoa - - -- - -- - -- - -- - -- - -- - -- - - -- ---- -- - -- - -- - -- - -- - -- - -- - - -- - -- - -1--- - -3--- - -- - -- - 13West Virginia1 639 3 1 218 27 4,280 30 2, 195 32 1, 088 98 1,042 191 10, 462Wyoming1 1,249 4 1 621 1 182 1 64 - - -2 20 9 3,136
Total - 72 87 997 55 19 769 144 21,738 273 18,588 282 10,159 715 6,990 1 541 165 251Percent of total - 4.7 53.3 3.6 i2.0 9.3 13.2 17.7 11.2 18.3 6.1 46.4 4.2 110.0 1bo0.0
Source: "Surtace Mining and Our Environment," op. cit. p. 114.
40
Strip-mining technologyThe yearbook describes the technology for strip mining in 1967 asfollows:Emphasis in surface mining continued to be on large-capacity earth-movingequipment. While no new marks were set in the maximum size of shovels used inoverburden removal, the upper limit in sizes of draglines used for this purposecontinued to rise. A 130-cubic-yard dragline of U.S. manufacture was placedin operation in Australia, surpassing the previous limit of 85 cubic yards. Thebeginning of construction on a 145-cubic-yard model in Indiana and a 220-cubic-yard model in Ohio portends new records in the capacity of earthmoving equip-ment. The new 220-cubic-yard dragline, with a 315-foot boom and a total weightof 27 million pounds, is scheduled for completion in 1968. Known as the "BigMuskie," this behemoth will remove 325 tons of overburden in one pass. Builtas a part of a $40 million expansion program, the shovel will uncover coal thatwill be transported by two 1,500-ton-capacity trains shuttling over an electricrailway system between the mine and an electric power generating plant. Al-though no coal-hauling trucks larger than the 2 4 0-ton-capacity unit announcedin 1965 were built in 1967, haulage units in the 100- to 12 0-ton-capacity rangeare being selected for new surface mines and to replace smaller sized haulageunits at existing mines.'
Strip mining will increaseIt would appear to be a safe assumption that if use of coal resourcesin generation of electricity is to be increased by a factor of 4 byyear 2000, a very substantial part of the demand surely will be supplied
by the stripping method of mining. It is probable that coal fieldsinvolved will in some degree shift in ways which are not now easy toforesee; with a rapidly growing population, new population and in-dustrial centers may be involved. Also transportation of coal bypipeline may prove feasible and long distance transmission of elec-tricity almost certainly will be involved. In spite of these uncertainties,one can reasonably anticipate increased future emphasis on the nowlargely underdeveloped coal resources of the western half of theUnited States, especially those of the Rocky Mountain area and thelignite deposits of the Northern Plains and even more particularlythose suited to strip mining (table 16).Adequacy of production
Though coal resources are so abundant that coal as a raw materialis not likely to cause any energy gap which may develop by year2000, problems nevertheless may arise in production of the muchlarger amounts which apparently are to be needed.
I Op. cit., p. 333.

41
TABLE 16.-ESTIMATED ORIGINAL RESOURCES OF STRIPPING COAL IN THE UNITED STATES IN BEDS GENERALLYLESS THAN 100 FEET BELOW THE SURFACE
[Figures are for resources in the ground, of which about 80 percent may be considered recoverablel
Millions of Millions ofState short tons State short tons
Alabama 800 North Dakota .--.----. 50 000Alaska -2,000 Ohio 5,000Arizona -100 Oklahoma -500Arkansas 263 Pennsylvania -8,000Colorado -1,200 South Dakota -400Illinois - 23, 000 Tennessee 200Indiana - 3,524 Texas- -- 3,282Iowa -600 Utah 300Kansas -600 Virginia -1,000Kentucky -6,000 Washington - ------------------- 100Maryland - -1------------------ I00 West Virginia 6,000Missouri -1,000 Wyoming -10,000Montana -15 000New Mexico - ---------- .- 1,000 Total 139,969
'Overburden 0-150 ft.Source: "Coal Resources of the United States, Jan. 1,1967," op. cit., p. 57.
An important factor contributing to availability of coal at competi-tive prices is the extent to which new productive capacity is added tothe coal industry. Without question, considerable capital investmentwill be required in the future if the demands for coal in the production.of electric energy are to be met. This problem has two aspects, onerelated to the sheer magnitude of the future gross tonnages to meetthe power industry's demands, and the other related to the growingamounts of coal required to supply specific powerplant projects.
Recently a serious coal supply problem has developed affecting allcoal users, including the electric power industry which consumes morethan one-half of the Nation's coal output. During the first 9 monthsof 1969, as compared to the same period of the previous year, U.S.consumption of coal has increased by about 20 million tons. At thesame time production of coal at the mines has declined by about 25million tons. This has resulted in a considerable drain on coal stock-piles of both the producers and the consumers. An FPC staff studyprepared early in October of 1969 showed that coal stocks of manycoal burning electric utilities have become seriously depleted. Someplants have as little as 15 days supply, in contrast to a desirable 60to 90 day supply.
The East Central Regional Advisory Committee of the FPC pointsout that very large generating plants mean correspondingly largecoal commitments and production rates not now available. TheCommittee said late in December 1969 that:
The trend toward increased size of fossil-fired generating units and plants inorder to achieve economies of scale, and the need to utilize fully the availableplantsites, means large coal commitments. For example, a generating plant with anaggregate capacity of 3,000 Mw., which can be considered reasonable in the future,will require an annual coal supply of approximately 7.5 million tons. For a usefullife for each of its units of 30 years, this means an overall guaranteed supply ofabout 200 million tons. Such large plants in many cases must utilize unit trainsand other large-quantity coal movements and they cannot be economically sup-
46-366 O-704

42
plied from a large number of scattered mines. Relatively few coal mines in thecountry today have a productive capacity in excess of 5 million tons a year. As amatter of fact, only five bituminous coal mines produced 5 million tons or more in1967, and only six additional mines produced over 3 million tons annually.'
The public press during the recent period has called attention tosharply lower coal stocks on hand, especially those held by utilitiesand steelmakers. Some are reported to have only 10 percent of stocksnormally carried and even these, as in the case of the TVA, may havean unsatisfactory location.2
Among the causes which have contributed to this situation are theshortage of labor in underground mines and the shortage of railroadcars for coal transportation. The labor force in coal mining has inrecent decades been overabundant; that may not be the case in theyears ahead. It is reported that few sons of miners wish to follow theoccupation of their fathers. Also, with greatly increased mechaniza-tion, the skills needed are rather different and more specialized thanwas formerly the case. This, in turn, may put additional emphasis onthose particular coal resources susceptible to economic stripping,which is more capital intensive, less labor demanding. In turn, theemphasis on stripping may accelerate certain resulting environmentalproblems, which, though not new, have recently received newattention.
ENVIRONMENTAL EFFECTS OF STRIP MINING
The visible insult to the landscape of unrestored strip mines needsno further description here. The desolation thereby produced is wellknown to the public. Unreclaimed strip mines also may adverselyaffect the more remote surroundings. In areas of considerable landslope, stripped overburden materials in larger and small particles aswell as those dissolved in water are likely to move down slope anddownstream to the detriment of valleys, streams, and their fish.Strip mine wastes may clutter stream channels. The dissolved ma-terials may reduce water quality for human and industrial use; andin some instances of intense erosion, valuable agricultural lands onthe flood plains below may be greatly damaged by debris deposited.
Two other undesirable effects of strip mining are the drainage ofacid mine wastes into streams and the burning of abandoned minesand waste or culm piles.
With regard to "acid" drainage aspects, as related to the minedarea, as well as to possible later environmental pollution resultingfrom the combustion of the coal, it may be noted in table 17 that alarge fraction of coal reserves are of low sulfur content, especiallythe lignite and subbituminous coals which largely remain to bedeveloped.
I "Electric Power in the East Central Region 1970-1980-1990," a report to the Federal Power Commis-sion prepared by the East Central Regional Advisory Committee, December 1969, p. III-10.
2 Thomas L. Ehrich, "Supply-Demand Paradox-Coal Industry's new Vigor Is Being Sapped: OutputPinch Threatens Electricity Levels," Wall Street Journal, Mar. 11, 1970, p. 38.

TABLE 17.-ESTIMATED REMAINING COAL RESERVES OF THE UNITED STATES, BY RANK, SULFUR CONTENT, AND STATE, ON JAN. 1, 1965
110 4 short tons 11
Sulfur content, percent
Coal rank and State 0.7 or less 0.8 to 1.0 1.1 to 1.5 1.6 to 2.0 2.1 to 2.5 2.6 to 3.0 3.1 to 3.5 3.5 to 4.0 Over 4.0 Total
Bituminous coal:Alabama 889. 2 1, 189. 3 5, 421. 7 5,182. 8 458. 8 417. 8 -18. 6 13, 577. 8Alaska 20,287.4 1,100.0 -------- 21,387.4Arkansas - - -1,128.4 293.1 154.0 -- 40. 3 1,615. 8Colorado 25, 178. 3 37,237.2 ....... 62,415.5G e rgi -- - - -- - -- - -- - - -- - -- - - -- - -- 76. - - -- - -- - - --0-- - -- - - -- - -- - - -- - -- - -- - - -- - -- - -76.-- - -- - - -- - -07 .Illinois 0 . . .1,808. 0 1, 139. 5 17, 871.9 36,264.0 62, 130. 0 20,i542.6 139,756. 0Indiana 197.5 173.0 3, 645.2 4,248. 8 3,543.3 4,110. 5 10,872. 8 5,105.9 2,944.0 34,841.1Iowa ----------------------- 117.1 6,405.4 6,522.5Kansas .519. 9 519. 7 1, 038. 7 2, 070, 6 4,148. 0 8, 287. 3 4.153. 8 20 738. 0Kentucky:
West ------ 1, 119.6 162.0 336.3 3,793.6 12,759.3 13,643.3 -5 081. 3 36,895.4East 13,639.9 8, 491, 9 2,286. 8 1, 658. 8 1,158. 3 2,154. 4 24. 7 29, 414. 8
Maryland ... 124.6 191.8 208.2 378.6 56.4 220.4 1,180. 0Michiganssou05 ----- ------------------- ---- - 205.0 205.0Missouri .... 6, 456.7 20, 669. 2 51, 634.1 78,760. 0Montana .51. 2 218. 2 205. 0 397.2 400.0 175. 0 40. 0 27. 0 591. 0 2,104. 6New Mexico.5,212.0 5, -------------------- 474.010,686. 0North Carolina .... 110. ° -110. 0Ohio ------..----------- 611. 0 369.0 2,110.2 2,750.4 7,810. 5 9,785.3 10,148.2 18,439.4 42, 024.0Oklahoma .250.6 77Z 2 825.0 368. 1 .. 577.2 19. 1 490.6 3,302. 8Oregon..14,0 ........----------------------------------------------- 914. 0Pennsylvania44.0 1, 154. 4 7,624,4 12,424.9 19,689.5 9,995.6 5,287. 6 1,150. 5 580.6 57,951.5Tennessee 3. 3 160,9 715.9 258.7 178.2 190.5 219.7 43.8 6.85 1,839.5Texas ..- 7,978,0 .... 7,978.0Utah 8, 551.4 13,584.0 .1,524.9 .... 3,997.7 27,658.0Virginia -------- 1,981. 5 6, 077 5 1,637.1 . . 123,9 .... 9, 820.0Washington 898.9 672. 1 --------------- 1,571.0West Virginia .20, 761.0 26,710.6 21,819.7 13,290.6 8,496.1 2,491.8 3,147.4 5,949.2 .102,666.4Wyoming 6,222.2 6, 596.6 ..... 1.1 12,819.9OtherStates . .616. 0 . . . . .616.0
Total .104,168.4 110,928.9 49,125.7 42,564.4 47,636.9 51,400.0 90,118.7 127,434.9 105,169.1 728,547.0Percentoftotal 14.3 15.2 6.7 5.8 6. 5 7.0 12.4 17.5 14.4 100.0
See footnotes at end of table, p. 44.

TABLE 17.-ESTIMATED REMAINING COAL RESERVES OF THE UNITED STATES. BY RANK, SULFUR CONTENT, AND STATE, ON JAN. 1, 1965-Continued
Sulfur content, percent
Coal rank and State 0.7 or less 0.8 to 1.0 1.1 to 1.5 1.6 to 2.0 2.1 to 2.5 2.6 to 3.0 3.1 to 3.5 3.5 to 4.0 Over 4.0 Total
Subbituminous coal:Alaska-71,115.6--715.Colorado -- ------- ---- 13, 320.8 4,908. 7 -------------------------- 18,229.Montana-94,084.4-----36,728----090, 5 1,303. 7-132,------------------------------ 11622.6New Mexico- 38, 735.0 12, 328- 0 0---50,735.-- 0_ ..... 1 1 6
Utah --- 150.0-~~~~~~~~~------------------ -1--------------------- 50 3.0OrU n- -- - - - -- - - - -- - - - 87. 0 87.0 -- - - - - -- - - - - - ---- --- - - - - - - - - - - - - - - - - - - - ----------------------------------- - 174i 0Washington - .. .---.-. _ 3, 693.8 500.0 -----. ---------- -4,193. 8Wyomning- . 35, 579. 7 72, 315. 6-8 6 107,903.9
Total -- -- 256, 616. 3 130, 586. 3 150. 5 1,303. 7-8. 6 388,665.4Percent of total--------------- 66.0 33. 6 .1 3 ------------------------------------ 100. 0
Lignite:Alabama--20.0Arkansas -280.0 70.0 . -----Montana - ---- 60,214.5 24,141.6 2, 660. 9 -4 7North Dakota-204,129.1 34, 987.3 31, 581. 664South Dakota - - 2, 031. 0Tas - ------------------------------- - 6, 902.0Washigton -- 116. 6 ----------------------------------------Other Staten--42.0
20.0350. 0
87,481.7350 698 0
2:031:0 t6, 902. 0
116. 642. 0
447, 641. 3100. 0
Total -344, 623. 6Percent of total - 77. 0
61,388.5 41, 164.513.7 9.2 _ - - - - - - - - - - - -
464.7 -.1 - - - - - - - - - - - - - - - - - - - _
Alaska-.2, 101. 0Arkansas---15. 5 286. 3
New Mexico ------------------------------- 6. 0 -------------------------------- -------------------------------- ---Pennsylvania -12, 211.0-- -- -- -- -- -- -- - -- -- -- -- - - --- - - -- -- -- -- -- -- --Virginia- -- -- - - - - - - - - --335.0°Washington-5.0.--.
2, 101. 0431. 890. 06.0
12, 211.0335. 0
5.0
Total -14, 652. 0Percent of total -96. 5
Grand total -720, 060. 3Percent of total -45. 6
=
96.0 ..6-
302,999.7 90, 440.719.2 5.7
145.5 286.3- I, f.9 2.0 --------------------------..- I
79. 8DO. 0
44,013.6 47,923.2 51,864.7 90,118. 7 127,434.9 105,177.7 1,580,033.52. 8 3.0 3. 3 5. 7 8. 0 6. 7 100. 0
'Coal in seams at leant 14 inches thick and less than 3,000 feet deep in explored areas. Approxi- 3 Illinois data are for 1966.
2 See reference 17 for modification of low-sulur coal reserves for Illinois. Source: Environmental Effects of Producing Electric Power, Hearings, Joint Committee on AtomicEnergy, 91st Cong., first session, pt. 1. October-November 1969.
45
The Bureau of Mines of the U.S. Department of the Interior has re-ported using thermal infrared data obtained by remote sensing tomonitor coal mine fires and burning culm banks. A wide variety ofairborne sensor data, plus space flight photography from Gemini andApollo missions, are being used in a study to determine their applica-bility to problems of observing and correcting surface effects of miningactivities.'Extent of strip mining
A rather comprehensive survey of "surface mining" was published1967,2 by the Department of the Interior as called for the Appa-lachian Regional Development Act of 1965 (Public Law 89-4 205(c)).Information presented therein for 1965 and shown here in table 14indicates that a very large part of the total coal recovery by stripmining was from only a few States in that year. At that time, of the3,187,825 acres which had been disturbed by strip and surface nimingfor one product or another, more than one-third or 1,301,430 acresrelated to coal production. Pennsylvania, Ohio, West Virginia, Ken-tucky, Illinois, and Indiana were high among the States affected.The total of about 1,302,000 acres affected by strip mining for coal wasrather evenly divided between the "area" type of stripping (637,000acres), and the "contour" type (665,000 acres). About 95 percentof the coal land acreage stripped in 1964 was privately owned. Oftotal acreage which had been disturbed by strip and surface mining(not just coal acreage), about two-thirds (2,040,600 acres) in 1965still required reclamation, whereas about one-third for one reason.or another did not require reclamation.Cost of reclaiming strip mines
Reclaiming of coal land in 1964,3 cost an average of $230 per acrefor areas completely reclaimed and $149 per acre for areas partiallyreclaimed. These terms apparently are not fully defined. Accordingto other information provided by that report 4 costs of reclamationeven at levels up to as much as $800 per acre average not much morethan 10 cents per ton of coal removed, though costs do vary ratherwidely from State to State. Though the cost does not appear high on aper-ton basis, the per-acre cost is large as compared with farmlandvalues. Fortunately, table 15 would appear to indicate the likelihoodthat reclamation costs may be relatively low on a per-ton basis inlignite areas and in the Rocky Mountain area, partly because ofthick beds and high tonnages per acre.
Limitations upon reclamationIt must not be assumed that in most areas, good farmland, once it
has been exploited for its subsurface mineral treasure by stripping, canbe quickly or ever fully returned again to its prior use for intensivecrop farming. Grazing, forestry, even recreation, are more likely to beits new uses. There is little assurance, especially in the more humidareas, that drainage water from the stripped area will not be seriouslyreduced in quality by contamination with chemicals leached out of thenewly exposed subsurface materials. In less humid areas the problemof reestablishing an adequate vegetative cover is reported to be moredifficult.
t"Aeronautics and Space Report of the President," transmitted to the Congress, January 1970, Execu-tlve Office of the President, National Aeronautics and Space Council, Washington, D.C., 1970, p. 51.
" Surface Mining and Our Environment," op. cit.rIbid., p. 113, table 5.
'Ibid., p. 114, table 7.

46
Regulation of strip miningThere has perhaps been too short a time since the 1967 report of
the Interior Department and some resulting steps to provide pre-ventative or remedial treatment for clear resolution of the environ-mental problems. It has been reported that the Department of theInterior in December 1969 undertook the review of current authorityand the drafting of proposed legislation, if necessary, whereby Interiorand Agriculture can assist local and State organizations in the restora-tion of past mined areas.' In a recent statement made in introducinga proposed mined land restoration and protection act of 1970, SenatorNelson has indicated that environmental regulation of strip miningis almost nonexistent at the Federal level, and at the State and locallevels, spotty, at best.2
UNDERGROUND MININGEnvironmental effects
Past experience with underground coal mining suggests that alterna-tive expansion in those techniques would also prove to be increasinglydestructive of some environmental qualities. Even if it be grantedthat the coal tipple and other surface appurtenances, along with thegenerally dreary mine villages are no more offensive to many personsthan some nonmining aspects of the environment, there remain gener-ally unsolved problems of acid drainage and of long-burning culmbanks.
On the other hand, old slag heaps have in some areas proven to beuseful as a source of industrial material. And a few artistic individualsare known to regard the old pink-gray mounds looming against theskyline of the flattish Midwest as interesting and attractive. Theyhave been compared favorably with the pyramids of Egypt. But thatpoint of view is exceptional. Few persons appear to regard coal miningin any of its versions as contributing favorably to the quality of theenvironment. To press on to higher levels of production will almostinevitably involve increased "exploitation" of present coal miningareas, large development of some new areas, and greater conflict withan increasingly critical public.
OIL
Because so much oil is used for purposes other than the generationof electricity, it is appropriate to first examine the role of oil in totalenergy supplies.Oil and total energy
Exploitation of petroleum resources as a source of extraneous energyis even more recent in human history than use of coal. Contribution ofoil to the total energy supply was almost negligible until after 1900,but since then use has grown very rapidly in several ways, particularlyin powering the internal combustion engine, Modern transportationon land and by air can hardly be imagined without the products ofpetroleum. Domestic production of crude petroleum has increased from1,353 million barrels in 1940, to 1,974 million barrels in 1950, and2,575 million barrels in 1960, to about 3,329 million barrels in 1968.World production has increased even more rapidly, with the U.S. pro-portion of the world total showing a decline from 63 percent in 1940
I Richard Harwood and Lawrence Stern, Washington Post, Feb. 4, 1970, p. A17.2 Senator Gaylord Nelson, statement on S. 3491, Congressional Record, Feb. 23, 1970, p. S2145.

47
to 25 percent in 1967. Though oil was the basic energy source of onlyabout 7.8 percent of the electricity generated in 1968, that use neverthe-less required about ]87,923,000barrelsinthatyear, againstonly 16,325,000barrels in 1940 and 85,340,000 barrels in 1960. If the 1968 figure ofnearly 188 million barrels is to rise to 800 million barrels by year 2000as estimated in table 5 above, demand on petroleum resources for thispurpose would be very substantially increased. Oil's contribution tototal energy resources utilized then in generating electricity shoulddecline to about 5 percent. The components presently used for thispurpose mostly fall in the heavy residual fuel oil category, a byproductof the refining industry; it appears unlikely that demands for othermajor products of the refining industry will be eased enough in theyears ahead to favor an increase in the residual fraction.
In table 7 are shown several estimates published since 1962 of theprobable U.S. requirements in 1980 for total energy, as well as for oiland gas. It may be noted that experts concede that values projected forfuture oil and gas consumption can be varied endlessly, dependingon assumptions employed for energy growth rate and interfuelcompetition.
The estimates present a considerable range with consequent sub-stantial differences in demand for capital investment. In general themore recent are higher; they indicate an overall probable demand of16 to 18 million barrels per day with other recent estimates ranging ashigh as 20 million barrels per day in 1980.1 A recent estimate for 1970indicates 14,680,000 barrels per day required-a 4.8-percent gain over1969. As projected, 1970 would be supplied by average production of9,525,000 barrels per day of domestic crude, an increase of 3.3 percentover 1969, plus natural gas liquids amounting to about 1,683,000 bar-rels per day, an increase of nearly 7 percent over 1969. Imports wouldbe sharply increased; crude would increase by 14.3 percent to 1,595,000barrels per day, and products by 4.7 percent to 1,830,000 barrels perday.2
World supply situationOn a basis wider than the domestic, there is evidence that for the
near future surplus rather than scarcity is probable. Commentingthat most conditions suggest a fairly tough period ahead for all theoil giants when it comes to business outside America, the Economistsaid in 1968: "The problem is partly a matter of the abundance of oil.Production and consumption are fairly well balanced at the moment,rising at about 7% percent a year, but both are outstripped by a 10-percent rise in the amount of newly discovered oil. At the present rateof consumption, proven reserves are now big enough to last until theyear 2001. Some 63 percent of these reserves are located in the MiddleEast, 11 percent in North America, 10 percent in Communist areas." 3
According to recently published research,4 free world petroleumexplorers have uncovered more than half (59 percent) of all existinggiant fields since 1950. Of the known 71 giant fields, defined as thosegood for at least 1 billion barrels of ultimate recoverable reserves (pastproduction plus remaining reserves) 21 were discovered in the 1950's
I Statement to New York Security Analysts by Robert 0. Anderson, chairman of the board of the At-lantic Richfied Co., Congressional Record, Feb. 23, 1970, p. S2156.
"Modest Gains Forecast for 1970," Oil and Gas Journal, Jan. 26, 1970, pp. 113-127.3 The Economist (London), Aug. 10, 1968, p. 48.4 Robert J. Burke and Frank J. Gardner, "The World's Monster Oil Fields, and How They Rank,"
Oil and Gas Journal, Jan. 13,1969, pp. 43-49.
48
and at least another21 have been found during the 1960's. Those71 fieldsoriginally held about 360 billion barrels of such reserves; of thatamount some 62.5 billion barrels have already been produced, leavingan estimated 297 billion barrels of recoverable reserves, or about 74percent of the free world reserve.
Of the 71 fields, 38 are in the Middle East and only 18 in theWestern Hemisphere, of which 11 are in North America. There are,of course, a good many known smaller fields, particularly in theUnited States. For example, if the cutoff size were set at an estimatedultimate recovery of 100 million barrels or more per field, the UnitedStates alone has 259 oil and 47 gas giants, which are indicated asnow producing about 51 percent of the national output and holding57 percent of the remaining reserve.
But for the free world, the six largest fields are indicated to containmore than 47 percent of total recoverable oil, and none of those sixis in North America; five are in the Middle East and one in Venezuela.Not only are few of the North American entries anywhere near thetop in size but for the most part they were discovered rather earlyand have been rather intensively developed. For example, of theU.S. monsters, East Texas, Wilmington, Yates, Kelly-Snyder,Midway-Sunset, and Huntington Beach were all discovered before1950, one of them as early as 1901, and have yielded about half ormore of their ultimate recoverable oil. Elk Hills is an exception;though discovered in 1920, the great bulk of its reserve is still inthe ground. That also is the case of the two monster Canadian fields,Pembina, discovered in 1953, and Swan Hills, 1957.
The discovery in 1968 on Alaska's North Slope (Prudhoe Bay) isnot included in the list of 71 monster fields, though respected expertshave estimated that the structure could hold 5 to 10 billion barrelsof recoverable oil. However, with few completed wells, the reservesare not yet regarded as proved. Moreover this is a relatively smallpart of the general area which will be explored.
Of some possible significance in the world supply situation areindications that the U.S.S.R. may have nearly completed its produc-tion of an excessive surplus of petroleum. In January 1969, the SovietUnion's petroleum minister, Valentin D. Shaskin, wvas reported aspredicting that Russian oil exports would not continue to rise sig-nificantly because of growing domestic requirements.' As reported,in 1968, total crude oil production was 309 million metric tons, ofwhich 57 million metric tons were exported in the form of crude oil andan additional 25 million tons as refined products, or roughly one-fourthof total production. Whether this situation will be notably changedby the recently announced new "north slope" Siberian field namedSamotlar in the Ob River area is unclear. Recoverable reserves wereestimated at 14 billion barrels. 2
Not only the oil wells (table 18) but even more, U.S. production ofpetroleum shows heavy concentration in a few States, notably Texas,Lousiana, and California which in 1967 accounted for about 70percent of the total (fig. 4 and table 19).
X New York Thmes, Son. 11, 1969, pp. 39 and.47.2 New York Thnes, Mar. 28, 1970, pp. I and 40.

49
TABLE 18.-PRODUCING OIL WELLS IN THE UNITED STATES AND AVERAGE PRODUCTION PER WELL PER DAY,BY STATES
Producing oil wells1966 1967
Approximate Average Approximate Averagenumber of production number of productionproducing per well producing per welloil wells, per day oil wells, per day
State Dec. 31 (barrels) ' Dec. 31 (barrels)
Alabama.AlaskaArizonaArkansasCaliforniaColoradoIllinois ---------------------------------------------IndianaKansas.Kentucky
524 42.2 53272 609.9 946 45.2 20
6,372 10.5 6,45941, 348 23.0 41,6082,371 42.6 1, 730
28, 608 5.9 27, 8875,300 5.5 '4 831
46 016 6.1 47 59714, 800 3.3 13, 255
38. 0961.161S6.4
9. 223. 745. 3
5. 75. 55. 83. 0
Louisiana:Gulf coastNorthern -- ---------------------
TotalMichiganMississippi.MontanaNebraska.
16,804 104.4 16,86714,259 10.4 13,803
117. 110. 7
31,0634, 1412,5493 5071 511
60. 3 30,6709.6 4,004
59.8 2, 55726. 5 3,39024.3 1,430
68. 79. 2
619.327. 824. 9
New Mexico:Southeastern.Northwestern - .-.-------------.-.-.----
Total -- --------------------------New YorkNorth Dakota -------------------------OhioOklahomaPennsylvania-South Dakota
Texas:3Gulf coast ---Glcos ----------------------------------East Texas field-West Texas-Panhandle-Other districts.
TotalUtah-West Virginia.Wyoming ----.-.------------------------------------
Other States:Florida.Missouri ------- ---------------------Nevada -- --- ---------------------------Tennessee -- ---------------------Virginia -- --------------------------
Total.
Total United States
14,9811, 523
19.9 15,21018.0 1,535
20. 919.9
16, 5042 11, 832
2, 01714, 19280, 583
2 50, 64529
19.7.4
37. 22. 17. 6.2
23. 0
16,74512,582
2, 06314 63880,970
2 45,42628
20.8.4
34. 01. 97. 8.3
20. 0
19 25516 84366,91013,92379, 377
196,830867
13,4678,434
27.8 18,9257.0 16,328
20.2 66, 0026 9 13,8629.9 76,884
14.7 192, 00177.4 869
.8 12,98944.6 8, 547
31. 08. 6
21.56. 8
10.4
15. 876.9
.744. 0
4215010322
236
583,302
123.21.8
88. 5.6.7
26.1
14. 2
4114613334
237
573, 159
103. 51.4
66. 5.6
2.7
22. 4
15.2
- =
I Based on the average number of wells during the year.2 Compiled by Bureau of Mines, all other number of producing oil wells furnished by State agencies.3Division of the Texas Railroad Commission.Source: Minerals Yearbook 1967, GPO, Washington, D.C., 1968, vols. 1-11, p. 863.
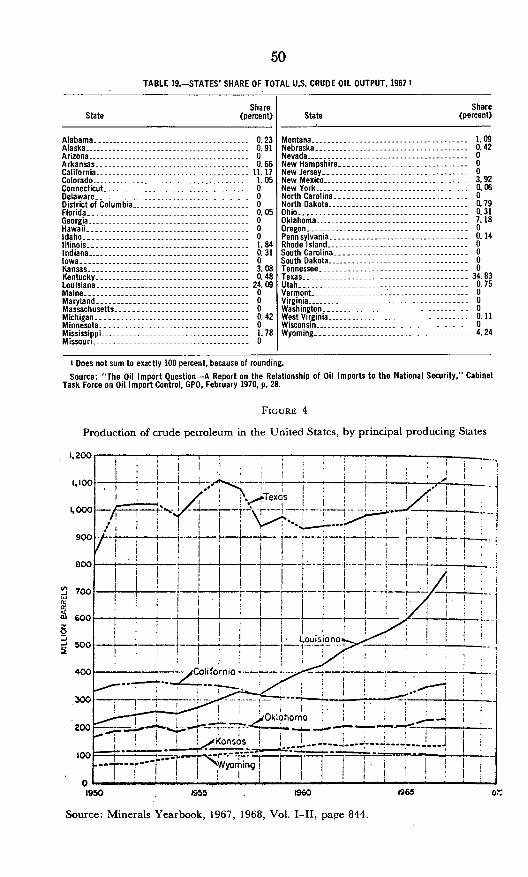
50
TABLE 19.-STATES' SHARE OF TOTAL U.S. CRUDE OIL OUTPUT, 19671
StateShare
(percent) StateShare
(percent)
Alabama -0. 23Alaska -0.91Arizona- 0Arkansas- 0.66California- : 11. 17Colorado -1.05Connecticut- 0Delaware- 0District of Columbia- 0Florida -0.05Georgia -0Hawaii- 0Idaho- 0Illinois -1.84Indiana -0. 31Iowa- 0Kansas -3.08Kentucky -0. 48Louisiana -24.09Maine - --------------------------------- 0Maryland- 0Massachusetts -0Michigan -0.42Minnesota- 0Mississippi -1.78Missouri0
Montana -1. 09Nebraska -0.42Nevada- 0New Hampshire- 0New Jersey -0New Mexico -3.92New York- 0. 06North Carolina- 0North Dakota -0.79Ohio -0. 31Oklahoma -7.18Oregon- 0Pennsylvania -0.14Rhode Island -0South Carolina- 0South Dakota- 0Tennessee ----------------------- 0Texas ----- 34.83Utah -0. 75Vermont- 0Virginia- 0Washington- 0West Vqrginia -0.11Wisconsin - ------------------------------- 0Wyoming -4.24
I Does not sum to exactly 100 percent, because of rounding.
Source: "The Oil Import Question-A Report on the Relationship of Oil Imports to the National Security," CabinetTask Force on Oil Import Control, GPO, February 1970, p. 28.
FIGURE 4
Production of crude petroleum in the United States, by principal producing States
I I '~~~~.Texos1,000- I
goo L~
6Oc-T I 1 F ~~~~~~~LouisiofloI ~~~~~~~~~~~~~~~~~~I,
(nW0:M.41
S
M
__ w t -wr _sorl- _ _ _ _
300
200F ~~~klhomo
- -~~~~~~~~~~-- - ~~- --- -- -.AAITA]* em r .- I I 2=T.w _�__F I 1 , yornmg __'�___F
-7 _ I I � i I I! 1 1_F1_1_1____ � -I IIv.195a 960 i965
Source: Minerals Yearbook, 1967, 1968, Vol. I-II, page 844.

51
Oil for electricitySince the residual fuel oil burned in steam electric powerplants
cannot be moved economically by pipeline over long distance, the useof oil for electric power generation is essentially limited to areasbordering low-cost water transportation or adjacent to petroleumrefineries.
Slightly more than one-quarter of the total annual residual oilsupply in 1968, was consumed by electric utilities. Domestic produc-tion of residual fuel oil has been steadily declining, but imports of thiscommodity have nearly doubled during the past decade. Unlike crudepetroleum and refined products, imports of residual oil are notrestricted by import controls, and its use for electric power generationhas been growving rapidly.
The abundant ~vorldwide supply of residual fuel oil at this time andthe associated lowering in price have accelerated the increase in itsuse. Furthermore, technology for the removal of most of the sulfurcontained in residual oil is available and the industry is investing con-siderable sums of money in oil hydrodesulfurization facilities. In thenext several years the oil industry, worldwide, is likely to acquire acapacity to supply large quantities of residual fuel oil capable of meet-ing the most stringent sulfur content regulations for air pollutioncontrol.
The projected fourfold increase in demand on petroleum for genera-tion of electricity by year 2000 apparently would be accompanied bya somewhat equivalent increase in the overall demand for petroleum.To meet the larger future demands for petroleum and its productswhether total or only for generation of electricity, we must either findit in this country, import from foreign countries, or resort to the oilshales and other synthetic production, as from coal.
Exploration and reserves.-Unlike coal which may in some instancesbe scooped up from strata near the surface, petroleum is found andharvested by probing deep into the earth with wells. The well mayprove to be "dry" or yield either petroleum or natural gas, or both.In other words, to a degree, oil and gas share a common domain andare sometimes referred to as the petroleum group of fossil fuels.
It is indicated that over 2 million wells have been drilled in theUnited States for oil and gas; and about 700,000 are currently pro-ducing, of which about 575,000 are "oil" wells. About 25,000 largerand (mostly) smaller oil and gas fields have been identified in 32States. Nevertheless, because of the erratic manner in which accumu-lations of oil and gas occur underground, the problem of estimatingthe quantities of these resources still undiscovered by drilling in anygiven region is indeed difficult and subject to a wide range of possibleinterpretation.
For example, Hubbert I has recently noted:* * * How accurately are the undiscovered resources of oil and gas in the
United States known? In this regard it may be mentioned that estimates pub-lished within the last 12 years of the ultimate production of crude oil in the UnitedStates, exclusive of Alaska, have a fourfold range from about 145 to 490 billionbarrels. Corresponding estimates for natural gas have a threefold range from 850to 2,650 trillion cubic feet.
I M. K. Hubbert, op. cit., p. 170.

52
In view of the wide range in these U.S. estimates, it may be notedthat they are the work of experienced and reputable scientists pro-ceeding on different but seemingly reasonable hypotheses and as-sumptions. All have been discussed and criticized. No attempt willbe made here to examine in detail or to justify either low or highestimates, except to report that the high estimate [Zapp] concludesthat it cannot be safely assumed that even the 20-percent mark hasbeen reached in exploration for petroleum in the United States, ex-cluding Alaska and excluding rocks deeper than 20,000 feet. On theother hand a comparatively low estimate [Hubbert], based essentiallyon rate of exploration activity, would appear to indicate that by year2000 the United States and adjacent continental shelves will have runthrough four-fifths of the complete cycle of crude oil production.
It may be noted that a comprehensive staff study in 1962 for theSenate Interior and Insular Affairs Committee concluded in part:
Attempting to assess the Nation's oil resources on information that is publiclyavailable is as frustrating as chewing on a mouthful of mashed potatoes: Thereis nothing to get one's teeth into.
e* * * * * *
The subject of oil reserves and resources has received exhaustive and spiritedprofessional attention for many years. The subject is highly speculative, but itseems safe to conclude that something of the magnitude of 400 billion barrels arerecoverable from oil pools in the United States. * * * I
At least two situations lend basic support to the assumption thatlarge domestic sources remain to be discovered and developed. Oneis the announcement that Alaska's new North Slope oil field is poten-tially one of the world's largest-containing possibly some 5 to 10billion barrels of recoverable oil.2
Another is the challenge of a possible big Atlantic coast oil potential.Though largely unexplored and almost undrilled, the sedimentsbeneath the coastal plain and the offshore shelf are indicated ascomparing favorably in volume, age, and general appearance withsimilar formations in the Gulf basin which have proven substantiallyproductive.3 Both Alaska and the Atlantic coastal plain will requirestringent environmental protection regulations as the exploration forand recovery of petroleum deposits proceeds.
A possible third encouraging aspect of the current situation is anew attempt to get a better idea of where and how much domesticoil and gas remains to be found. The Oil and Gas Journal of July 22,1968 (newsletter) reported:
National Petroleum Council's shooting for May 1, 1969, wrapup of first stageof in-depth study of possible future petroleum provinces in the U.S. * * *Nothing like it has been done since 1951. NPC Committee has divided countryinto 11 regions and picked a geologist in each to ramrod effort. Manuscripts fromeach region are due next May;, and NPC will weld them into overall report.
It is not the nearby situation which causes most concern. Theapproximate 573,159 wells reported at the end of 1967 as producingpetroleum provided in 1968 something like 3,329 million barrels'
I "National Fuels and Energy Study (Draft of May 18, 1962)," staff study to the Committee on Interiorand Insular Affairs, U.S. Senate, 87th Cong., 2d sess., Committee Print No. 3, Washington, D.C., 1962,p. 52.
2 Oil and Gas Journal, July 22, 1968, pp. 34-35.i Ibid., pp. 46-47.'Statistical Abstract, 1969, p. 670.
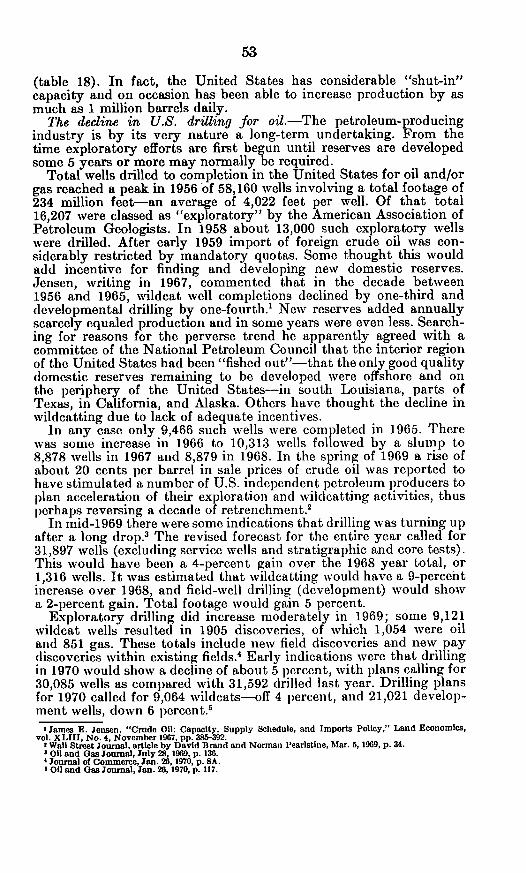
53
(table 18). In fact, the United States has considerable "shut-in"capacity and on occasion has been able to increase production by asmuch as 1 million barrels daily.
The decline in U.S. drilling for oil.-The petroleum-producingindustry is by its very nature a long-term undertaking. From thetime exploratory efforts are first begun until reserves are developedsome 5 years or more may normally be required.
Total wells drilled to completion in the United States for oil and/orgas reached a peak in 1956 of 58,160 wells involving a total footage of234 million feet-an average of 4,022 feet per well. Of that total16,207 were classed as "exploratory" by the American Association ofPetroleum Geologists. In 1958 about 13,000 such exploratory wellswere drilled. After early 1959 import of foreign crude oil was con-siderably restricted by mandatory quotas. Some thought this wouldadd incentive for finding and developing new domestic reserves.Jensen, writing in 1967, commented that in the decade between1956 and 1965, wildcat well completions declined by one-third anddevelopmental drilling by one-fourth.' New reserves added annuallyscarcely equaled production and in some years were even less. Search-ing for reasons for the perverse trend he apparently agreed with acommittee of the National Petroleum Council that the interior regionof the United States had been "fished out"-that the only good qualitydomestic reserves remaining to be developed were offshore and onthe periphery of the United States-in south Louisiana, parts ofTexas, in California, and Alaska. Others have thought the decline inwildcatting due to lack of adequate incentives.
In any case only 9,466 such wells were completed in 1965. Therewas some increase in 1966 to 10,313 wells followed by a slump to8,878 wells in 1967 and 8,879 in 1968. In the spring of 1969 a rise ofabout 20 cents per barrel in sale prices of crude oil was reported tohave stimulated a number of U.S. independent petroleum producers toplan acceleration of their exploration and wildcatting activities, thusperhaps reversing a decade of retrenchments
In mid-1969 there were some indications that drilling was turning upafter a long drop.3 The revised forecast for the entire year called for31,897 wells (excluding service wells and stratigraphic and core tests).This would have been a 4-percent gain over the 1968 year total, or1,316 wells. It was estimated that wildcatting would have a 9-percentincrease over 1968, and field-well drilling (development) would showa 2-percent gain. Total footage would gain 5 percent.
Exploratory drilling did increase moderately in 1969; some 9,121wildcat wells resulted in 1905 discoveries, of which 1,054 were oiland 851 gas. These totals include new field discoveries and new paydiscoveries within existing fields.4 Early indications were that drillingin 1970 would show a decline of about 5 percent, with plans calling for30,085 wells as compared with 31,592 drilled last year. Drilling plansfor 1970 called for 9,064 wildcats-off 4 percent, and 21,021 develop-ment wells, down 6 percent.5
I James E. Jensen, "Crude Oil: Capacity, Supply Schedule, and Imports Policy," Land Economics,vol. XLIH1, No. 4, November 1967. pp. 385-392.
' Wall Street Journal, article by David Brand and Norman Pearlstine, Mar. 5,1969, p. 34.3 OR and Gas Journal, July 28, 1969, p. 136.4
Journal of Commerce, Jan. 26,1970, p. 8A.OH and Gas Journal, Jan. 26, 1970, p. 117.

54
In view of the very substantial decline in drilling, both wildcatand developmental since the 1950's, it might appear to be contra-dictory that proved crude oil reserves did not decline sharply in the1960's (table 20). They were estimated at 30,613 million barrels at theend of 1968 as compared with 31,613 million barrels in 1960.
Present balance of reserves and demand.-In general, the domesticoil industry has managed to increase reserves and producing capacityas required to meet increases in demands. At the end of 1946 provedrecoverable liquid petroleum reserves in the United States wereestimated to be 24 billion barrels, or approximately 12 times the 1946production. Over the following 17 years, 44 billion barrels wereproduced, or 20 billion barrels more than had been estimated as provedrecoverable liquid petroleum reserves in 1946. Yet, proved reserves onJanuary 1, 1964, had increased to 31 billion barrels and are not muchbelow that level at present.TABLE 20.-ESTIMATES OF PROVED CRUDE-OIL RESERVES IN THE UNITED STATES ON DEC. 31,1967, BY STATES X
[Million barrels]
State 1963 1964 1965 1966 1967
Eastern States:IllinoisIndiana-Kentucky .-- ------MichiganNew YorkOhioPennsylvaniaWest Virginia
Total
Central and Southern States:AlabamaArkansasKansas -- ------------------------------LouisianaMississippiNebraskaNew MexicoNorth Dakota ---------------Oklahoma ----------Texas'2 - .......................
Total ------------------------------
Mountain States:Colorado :MontanaUtahWyoming
417 391 371 362 33663 61 57 48 47
100 118 108 101 9469 58 53 71 6318 14 12 10 1588 100 101 101 11492 87 77 73 6357 69 55 57 56
904 888 834 823 788
45 50 66 85 79225 205 201 181 176841 797 752 726 625
5, 089 5, 162 5,246 5,408 5, 455385 357 360 374 357
84 71 71 57 631,011 947 895 1,025 926
389 377 395 321 2991,628 1, 586 1, 517 1, 518 1,453
14,573 14,300 14, 303 14,077 14, 494
24, 270 23, 862 23, 806 23, 772 23, 925
368 346 327 344 340271 252 274 282 308220 219 197 213 201
1,254 1,204 1,169 1,073 1, 044
Total ----------------------------
Pacific Coast States:Alaska.California .
-.. . . . . .
Total 'Other States 4-
Total United States.
2,113 2,021 1,967 1,912 1,893
(3) 83 160 3223,600 4, 125 4, 567 4, 608
3814,369
3,600 4,208 4,727 4,930 4, 75093 12 18 15 21
30,970 30,991 31,352 31,452 31,377
I From reports of Committee of Petroleum Reserves, American Petroleum Institute. Includes crude oil that may beextracted by present methods from fields completely developed or sufficiently explored to permit reasonably accuratecalculations. The change in reserves during any year represents total new discoveries, extensions, and revisions, minusproduction.
2 Includes offshore reserves; the Dec. 31, 1967, total for Louisiana and Texas was 2,375.3 Included with "Other States."4 Includes Alabama, Alaska 1963 only, Arizona, Florida, Missouri, Nevada, South Dakota, Tennessee, and Virginia.Source: Minerals Yearbook, 1967, op. cit., p. 858.
55
In part this results from the definition itself. The term proved re-serves applied to crude oil is used to denote the amount of oil in knowndeposits which is estimated to be recoverable under current economicand operating conditions. Reserves, so defined, are probably on theconservative side.' In general they include only the producible con-tent of the explored portions of reservoirs-an underground inventoryso to speak. As the reservoir is further explored substantial amountsmay be added to the quantity proven.
Another point which may be helpful in understanding the situationis the improved recovery rate. The U.S. Department of the Interiorhas called attention to this factor as follows:
The crude oil recovery rate was estimated to be 30 percent at the end of 1965and is believed to be increasing at an annual rate of 0.5 percent of total originaloil in place. The bases for this increase are not well delineated, and there is nocertainty that it can be continued at the current rate. On the assumption that itwill be, however, the improvement of 7.5 percent in recovery rate to 37.5 percentby 1980 would yield an additional 29 billion barrels of economically recoverablereserves even if no new discoveries were made.2
That study, after making further points, which included thefollowing:
The calculated trend of crude oil discoveries from 1920 through 1980 will resultin discoveries of 72 billion barrels of oil in place between 1965 and 1980. On thebasis of 37.5 percent recovery, these discoveries will yield 27 billion barrels ofreserves.When reserves acquired by discovery are added to those obtained throughincreased recovery, the resulting 56 billion barrels will be adequate to offsetanticipated production and increase the reserve level by 4 billion barrels; however,
The calculated discovery rate is 4.8 billion barrels annually between 1965 and1980. Discoveries actually reported since 1957, adjusted to compensate for partiallydeveloped fields since 1957, have averaged 3.3 billion barrels annually, approxi-mately two-thirds the calculated rate. At the end of 1966 cumulative reporteddiscoveries were seven billion barrels below the calculated trend line.
The departure of reported (adjusted) discoveries from the historic trend since1957 coincides with large declines in activity indices normally identified with thediscovery of oil: Geophysical crew months worked; exploratory drilling; andnumbers of new oilfields found.
Concluded as follows:It therefore appears that the discovery rate observed since 1957 will not be
sufficient to offset withdrawals from proved reserves between 1965 and 1980 onthe basis of anticipated recovery rates. Specifically, either the recovery rate mustimprove even faster than the 0.5 percent annual improvement projected, ordiscoveries must be increased above the levels that have prevailed since 1957.
Environmental effects of oil productionA serious and complex problem which confounds most discussion
of petroleum availability in 1980 or even 2000 is that of pollution.The problem of oil pollution at the production stage comes mostlyfrom "blowouts." It is a reasonable statement that the oil industryhas long experienced and tried to prevent blowouts and that therecord is much better than it used to be-the number of such eventshas decreased. The problem nevertheless has become increasinglyserious in its implications respecting the environment. Earlier disasterswere very largely on land and for the most part afflicted small localareas, so the damage was generally restricted and the situationpromptly brought under control.
'"An Appraisal of the Petroleum Industry of the United States," U.S. Department of the Interior,January 1965 p. 13.."United itetes Petroleum Through 1980," U.S. Department of the Interior, GPO, Washington, 1968,P. vil.

56
Effects of oil operations at sea.-With major development of off-shore drilling and large-scale production from the subsurface of thesea bed, the oil involved in a single disaster in some instances becamemuch larger and control and remedial treatment much more difficult.Public awareness of the problem has increased greatly. Recentlyoffshore wells, especially those near much-used beaches, wildliferefuges and commerical seafood resources have been seriously in-volved. Two major examples have been prominent-one, the SantaBarbara Channel case in California has been extremely difficult tocontain. Still more recent is the case of the Chevron Oil Co. platformin the Gulf of Mexico near Louisiana and not many miles from shrimpand oyster beds valued at $100 million. Gas ignited and a blazeraged for about a month in February and March 1970 before thestructure was dynamited in an unsuccessful first attempt to extin-guish the blaze and cap the wells believed responsible for releasingunder pressure something like 1,000 barrels of oil per day. Severalwells provided oil for the fire and one was a major source of pollution.Secretary of the Interior Walter J. Hickel is reported to have said:"Compared to Santa Barbara, this is a disaster. There is more oilinvolved, more pollution, a wider area and it will take much longerand be much harder to clean up."
These major instances of production disaster and some lesser ones,plus major pollution of several coastal areas arising from ocean trans-portation of petroleum by tanker, notably the Torrey Canyon disasteroff southwest England in 1967, and the Arrow incident off ChedabuctoBay, Nova Scotia, in February 1970 and other recent spills or dumpingof oily bilge near the coast of Florida and that of Alaska have alarmedthe public and created a multitude of lawsuits.
Effects of oil operations on land.-On land, it may be said that theenvironment is no longer cluttered by forests of closely spaced oilwell derricks. Spacing orders now generally specify 40- and 80-acreunits. There are in most States specifications for completing new wellsand abandoning old ones, casing to prevent contamination of freshwater, proper disposal of produced water, whether salty or oily, torevent pollution, and, of course, precautions to minimize the like-
lihood of blowouts or other accidents. Though quantitative infor-mation is not at hand, it is known that pollution and other localenvironmental damage does result in some instances, perhaps moststrikingly in the case of some successful wildcat wells for which ade-quate preparation has not been made.
In most instances it would appear that environmental damage canbe and is rather quickly contained on land.
With onland problems of production and transportation ofpetroleum sufficiently well in hand so that substantial pollutionseldom occurs, the onland search for new petroleum reservoirsmight for this reason and other good reasons be encouraged. Withmuch of the contiguous United States not explored in depth and withsome opinion, as in figure 5, that large areas of the country are favor-able to the occurrence of oil and gas, the situation would appear todeserve serious consideration, not only to set policy but to design aprogram to stimulate the discovery of such resources fully adequateto our needs at least until the use of atomic energy is more fullydeveloped.
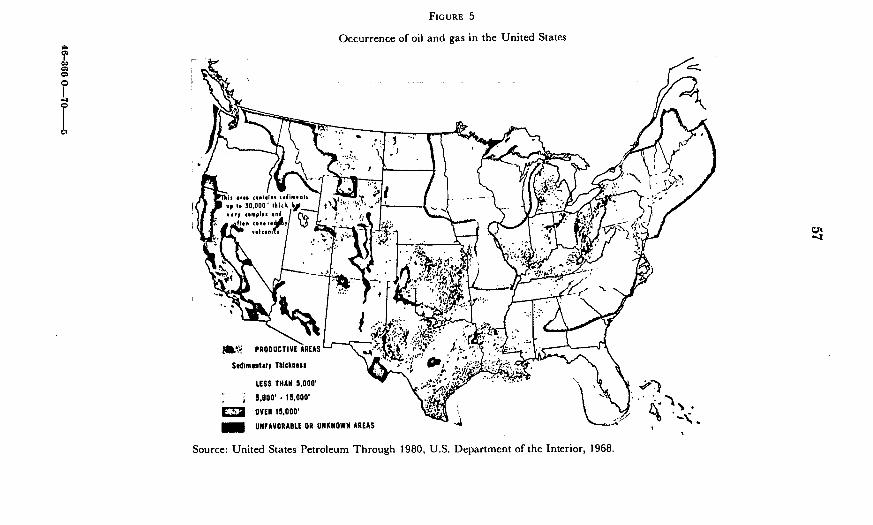
FIGURE 5
Occurrence of oil and gas in the United States
^,';:. PRODUCTIVE AREAS' 4
z ' . A.'.. :,..
Seimsntary ThIcknoss .' - 0.*. NLESS THAN 5.000' , .. -
5,000' 15,000'
OVER 15,C000
UNFAVORABLE OR UNKNOWN AREAS
Source: United States Petroleum Through 1980, U.S. Department of the Interior, 1968.
58
RegulationThe Water Quality Improvement Act of 1970 (Public Law 91-224)
prescribes authority for the Federal Government to regulate controlof pollution by oil from vessels and from onshore or offshore drillingfacilities. Operators may be liable for cleanup costs up to a ceilingof $14 million in case of an accidental spill. The Government has theauthority to immediately conduct cleanup operations and to bill theresponsible party later.
With certain aspects of complex Federal-State proprietary andadministrative relations not fully resolved, control of environmentpollution is still evolving. Efforts to fix oil-spill responsibility andpenalties for discharges of oil from ships, tankers and barges aswell as from coastal and river terminals is one thing. Truly workablerules under which offshore lease and development of potential oil andgas resources will proceed without serious danger of pollution isquite another matter. Some of the extreme difficulties, present andpotential, involved in maintaining an environment of acceptablequality in the case of offshore petroleum development are illustratedby the long continued Santa Barbara Channel problem widely notedin public information sources, and the more recent problem off theLouisiana coast.A go-slow policy for offshore drilling?
All of this would appear to raise a policy question of withholdingor delaying further offshore lease and development until fully adequatetechnology is more nearly in hand for producing and transportingsuch petroleum. The very high public and private costs incurred inoffshore development in the recent period, the possible irreparabledamage done to some resources and the fact that several aspects oftechnology, legislation and law are yet to be worked out or clarifiedwould seem to suggest a "go slower" policy.
NATURAL GAS
One-sixth of all the natural gas consumed in this country is usedfor electric power generation. The amount so generated accounts forabout one-quarter of all electrical energy generated by steam-electricplants. Natural gas is a desirable fuel for power generation becauseof its ease of handling, relatively low capital investment in gas-firedplant facilities, minimal waste disposal problems and ability to meetair quality standards in practically all regions of the country.
There is considerable doubt, however, that domestic natural gassupplies will be adequate to meet all foreseeable demands for thiscommodity in the next two decades, even allowing for success inAEC's Plowshare program. Energy economists believe that in theyears ahead synthetic gas from coal and liquified natural gas (LNG)imports will play an increasingly important role in our gas supplypicture. The announcement by the El Paso Natural Gas Co. thismonth of plans to import 1 billion cubic feet of gas per day in liquidform from Algeria, probably marks the beginning of substantialimports of natural gas form foreign sources. El Paso has estimateda price of 50 cents per thousand cubic feet (Mcf) at dockside on theeast coast, based on deliveries in 1973. Storage of the LNG andregasification would add approximately another 4 cents per thousandcubic feet (Mcf) to the price. At 54 cents per thousand cubic feet

59
(Mcf), LNG may be approaching competition with new gas, residualoil, or coal for electric power generation in the high fuel cost MiddleAtlantic and New England areas, particularly where stringent airpollution control regulations are in force. Imported LNG for baseloadelectric powerplant operation, however, does not appear to be com-petitive with nuclear power at the present time. Synthetic gas ofhigh British thermal unit content (pipeline quality) produced fromcoal in quantities that would be competitive in price with importedLNG, is at best probably 8 to 10 years away.'Supply and demandfor natural gas
Attention has already been called to the fact that the Paley Com-mission in 1952 greatly underestimated the contribution which gaswould make as an energy source in generating electricity in the yearsahead. Referring to tables 3 and 4, in 1950 some 777 billions of cubicfeet of gas had provided about 13.5 percent of the energy needed ingeneration; they estimated that in 1975, 1,600 billion cubic feet wouldbe consumed in generating electricity, to produce about 10.7 percentof the total generated. But in 1968 (table 5) about 3,100 billion cubicfeet of gas were used in generation, or about 23 percent of the totalenergy resource required for the purpose. The projection for year2000 (table 5) would indicate the use of 4,000 billion cubic feet ofgas for generation of electricity, but gas would supply only 4.8 per-cent of the total energy required for generation, as compared with 23percent in 1968.
It is emphasized in the preceding section on oil that natural gasresources are often intimately associated with petroleum, in explora-tion, in development and in production-that to a degree they sharea common domain and may be referred to as the petroleum group offossil fuels. Some tables and discussion deal separately with naturalgas liquids. For this reason and others, some joint aspects were coveredin the petroleum section. It may be noted here that coal, also previouslydiscussed, represents about 73 percent of the total resources of fossilfuel in the United States, whereas natural gas (dry) represents only4 percent of the total. Nevertheless, the petroleum group of fossilfuels (petroleum, natural gas liquids, and natural gas), which representonly 9 percent of the total fossil fuel supply, are now being used abouttwice as fast as coal which represents 73 percent of the fuel supply.
As previously noted, the experts present approximately as wide arange of estimates for natural gas as for petroleum, a not unexpectedsituation in view of the substantial degree of association in nature andexploitation. Even in 1967, about one-fourth of net gas production wasfrom oil wells. It is stated that during the last 20 years, the ratio ofnatural-gas discoveries in the United States to those of crude oil haveaveraged about 6,000 ft'/bbl.2
Again, as in the case of petroleum, there is a problem of definition, butin 1967 estimated recoverable proved reserves, including offshore re-serves for California, Louisiana, and Texas amounted to nearly 293trillion cubic feet of gas. Texas, Louisiana, Oklahoma, Kansas, andNew Mexico held much of the reserve. The same States in that yearprovided the great bulk of the marketed production (table 21) whichin total amounted to something more than 18 trillion cubic feet, ofwhich about one-sixth was used as fuel for the generation of electricity.
I Testimony of Federal Power Commission before the Joint Committee on Atomic Energy, November1969, cf. "Environmental effects of producing electric power," op. cit., p. 57.
' Hubbert, op. cit., p. 187.

60
TABLE 21.-NATURAL GAS-PRODUCTION, 1940 TO 1967, AND RESERVES, 1955 TO 1967, BY STATES
[In billions of cubic feetj
Marketed production I Reserves 2
State 1940 1950 1955 1960 1965 1967 1955 1960 1965 1967
Total 2,660 6,282 9,405 12,771 16,040 18,171 223,697 263,759 286,469 292,908
Arkansas - ----- 14 48 32 55 83 117 1,164 1, 460 2,269 2,811California -352 558 538 518 660 681 8,893 8,844 8,832 7,724Colorado -3 11 49 107 126 117 2,254 2,043 1,718 1,769Illinois -8 13 8 12 7 5 234 173 210 259Kansas -90 364 471 634 793 872 16,293 19,620 16,596 15,284Kentucky -53 73 73 75 79 89 1,262 1,144 1,092 954Louisiana -343 832 1,680 2,988 4,467 5,717 42,436 63,386 82,811 86,290Michigan -13 11 8 21 35 34 326 586 746 761Mississippi -6 114 163 172 167 139 2,608 2,542 1,973 1,597Montana -26 39 28 33 28 26 730 626 596 838Nebraska- () (4) 13 15 11 8 203 118 80 64New Mexico -64 213 541 799 937 1,068 18,585 15,604 15, 375 15, 092North Dakota -() 1 5 19 36 40 281 1,151 1,121 882Ohio -41 43 34 36 36 41 810 766 755 763Oklahoma -258 482 615 824 1,321 1,413 13,205 17,311 20,357 19,404Pennsylvania -91 91 99 114 84 90 754 1,192 1,257 1,392Texas -1,064 3,126 4,731 5,893 6,637 7,189 108,288 119,489 120,617 125, 415Utah- () 4 17 51 72 49 421 1, 526 1,439 1,227West Virginia -189 190 212 209 207 211 1,565 1,831 2,494 2,580Wyoming- 27 62 78 182 236 240 3,196 3,935 3,703 3,685Other States -19 5 9 12 18 25 201 411 2,428 4,117
' For 1940, amount used by ultimate consumer only; thereafter, comprises gas sold or consumed by producers, includinglosses in transmission, amounts added to storage, and increases in gas in pipelines. Beginning 1965, data on pressure baseof 14.73 pounds per square inch absolute; prior years, 14.65.
2 Esti nated recoverable proved reserves. Offshore reserves included for California, Louisiana, and Texas. Excludes gasoss du o to natural-gas liquids recovery. Source: American Gas Association.
3 Inclided with "Other States.'4 Less than 500,000,000 cubic feet.a Prior to 1960, excludes Alaska.Source: Statistical Abstract of the United States, 1969, op. cit., p. 672.
If even some lower figure in the range of estimates is accepted asbeing the more probable, there is still a lot of gas to be found anddeveloped. Cumulative production plus accepted estimates of provenreserves for coterminous United States gives approximately 600trillion cubic feet. To that, Hubbert, one of the more conservativeestimators, would add 222 trillion cubic feet for the fields alreadydiscovered, beyond the 286 trillion feet of proved reserves.' Then hewould add another 218 trillion cubic feet for future discoveries, ora total for the lower estimates of possible gas (Zapp, for example, ismuch higher) of about 1,044 trillion cubic feet, of which only aboutone-third has yet been produced.The possibility of shortage
But there can be little question that the ratio of proved reserves toproduction did decline in 1968 (table 22) and again in 1969, creatingmore than a little alarm in some quarters. Others argue that suchreserve data as published can be extremely misleading. 2 At the sametime it is evident from the exploration statistics found in table 23that emphasis on new discoveries has for one or several reasons beendeemphasized.
I Hubbert, op. cit., pp. 187-188.3 See for example the discussion by Bruce C. Netschert, In "Natural Gas Supply Study," hearings be-
fore the Subcommittee on Minerals Materials and Fuels of the Committee on Interior and Insular Affairs,U.S. Senate, 91st Cong., 1st sess., November 1969, Government Printing Office, Washington, 1970, at .pp.78-95-
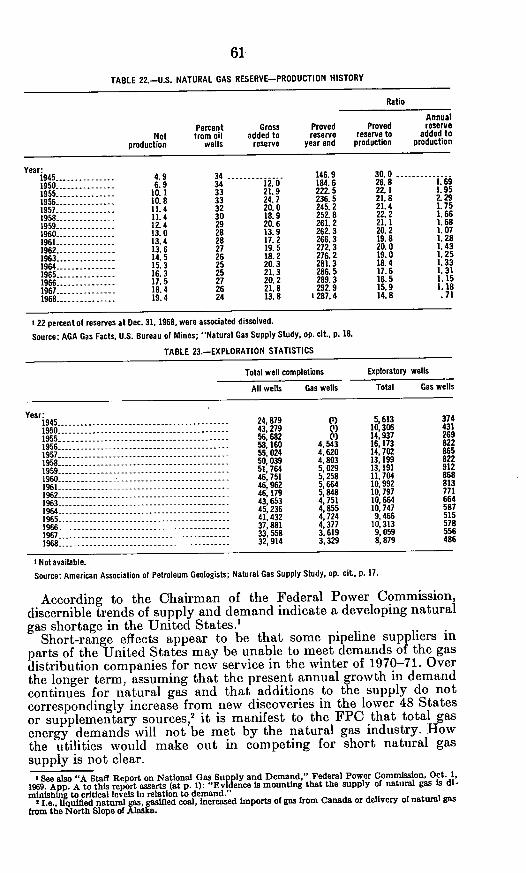
61
TABLE 22.-U.S. NATURAL GAS RESERVE-PRODUCTION HISTORY
Ratio
AnnualPercent Gross Proved Proved reserve
Net from oil added to reserve reserve to added toproduction wells reserve year end production production
Year:1945--------------- 4.9 34 --------- 146- 146.9 30.0 ...
1950--------- 6.9 34 12. 0 184. 6 26. 8 1.691955 -10. 1 33 21.9 222. 5 22. 1 1.95
1956 -10. 8 33 24.7 236.5 21.8 2.29
1957 -11.4 32 20.0 245.2 21.4 1.75
1958 - 11.4 30 18.9 252.8 22.2 1.66
1959--------- 12. 4 29 20.6 261. 2 21. 1 1.68
1960 -13. 0 28 13.9 262. 3 20. 2 1. 07
1961 -13. 4 28 17. 2 266.3 19.8 1. 28
1962 -13. 6 27 19. 5 272.3 20.0 1. 43
1963 -14. 5 26 18. 2 276. 2 19.0 1. 25
1964 -1------ 15. 3 25 20.3 281.3 18.4 1.33
1965--------- 16. 3 25 21. 3 286. 5 17.6 1. 31
1966 6------- 17. 5 27 20. 2 289. 3 16. 5 1. 15
1967--------- 18.4 26 21. 8 292.9 15.9 1. 18
1968 - ----- 19.4 24 13.8 ' 287.4 14.8 .71
' 22 percent of reserves at Dec. 31, 1968, were associated dissolved.
Source: AGA Gas Facts, U.S. Bureau of Mines; "Natural Gas Supply Study, op. cit., p. 18.
TABLE 23.-EXPLORATION STATISTICS
Total well completions Exploratory wells
All wells Gas wells Total Gas wells
Year:1945 -24,879 (1) 5,613 374
1950----------------------- 43, 279 (I 0,306 431
1955 - 56, 682 I) 14, 937 269
1956 ----------------- ---- 58, 160 4,543 16, 173 822
1957 -55, 024 4,620 14, 702 865
1958 -50, 039 4,803 13, 199 822
1959----------------------- 51,764 5,029 13191 912
1960----------------------- 46,751 6,258 11,704 868
1961 -- 46,962 5,664 10,992 813
1962 -46,179 5,848 10,797 771
1963 ----------------------------- 43,653 4,751 10, 664 664
1964 -- -- 45,236 4,855 10,747 587
1965 -41 432 4,724 9,466 515
1966----------------------- 37,881 4,377 10,313 578
1967 -33, 558 3,619 9 059 556
1968 -32,914 3,329 8,879 486
Not available.
Source: American Association of Petroleum Geologists; Natural Gas Supply Study, op. cit., p. 17.
According to the Chairman of the Federal Power Commission,
discernible trends of supply and demand indicate a developing natural
gas shortage in the United States.'Short-range effects appear to be that some pipeline suppliers in
parts of the United States may be unable to meet demands of the gas
distribution companies for new service in the winter of 1970-71. Over
the longer term, assuming that the present annual growth in demand
continues for natural gas and that additions to the supply do not
correspondingly increase from new discoveries in the lower 48 States
or supplementary sources,2 it is manifest to the FPC that total gas
energy demands will not be met by the natural gas industry. How
the utilities would make out in competing for short natural gas
supply is not clear.
' See also "A Staff Report on National Gas Supply and Demand," Federal Power Commission, Oct. 1,
1969. App. A to this report asserts (at p. 1): "Evidence is mounting that the supply of natural gas Is di-
minIshing to critical levels in relation to demand."'I.e., Ulquefied natural gas, gasified coal, increased imports of gas from Canada or delivery of natural gas
from the North Slope of Alaska.

The Chairman of the Federal Power Commission cautions thatthere is no immediate solution to the gas supply problem. No singlefactor is determinative in assuring new domestic gas supplies tomeet growing demands, including those of the electricity industry.The precise dimension or magnitude of this problem cannot beestablished, in his opinion, until probative evidence relevant to theproblem has been presented in rate proceedings before the Commission,or until a reliable gas survey has defined supply in relation to deliver-ability and demand.'
FPC Commissioner John A. Carver takes a stronger stand. Pointingout that one-sixth of all natural gas produced in the United Statesis used for power generation, he further observes:
At a time when we are seeking incentives for increased exploration and pro-duction, when increased imports from Canada and transport in liquid form arebeing planned and when research on conversion of coal to gas is being accelerated,it would seem foolhard in the extreme to count it heavily in our inventory ofpotential electric power sources.2
These views raise in the minds of some the question of whethernew additional commitments of gas for boiler fuel use should bepermitted. With greatly expanding use in homes etc., higher priorities,whether set by administration or by the market may exist.Environmental effects of producing natural gas
It may be noted that natural gas, in production and in use appearsto present fewer environmental pollution problems than coal, orpetroleum and probably fewer than nuclear fuel or dams for hydro-electric power.
NUCLEAR FUELS
The fuel for nuclear power to the 1990's will be mainly uranium(some plutonium). Nuclear powerplants to the mid 1980's probablywill use only the uranium-235 isotope, which amounts to 0.7 percentof the uranium atoms in uranium ores. Thorium is not yet in use asa nuclear fuel and will have to await perfection of the breeder typereactor. Current reactor technology uses about 0.6 to 1.2 percent ofthe potential energy in the uranium ores and with improvementsmight increase to 3 percent.3 More effective use (other uraniumisotopes) will have to wait for the successful demonstration of thebreeder reactor. This technique converts non fissionable atoms tofissionable isotopes at the same time that power is produced from theoriginal fuel change. In theory, a combination of breeder and con-ventional nuclear reactors could permit use of all the atoms of uraniumand thorium for fuel.
As a practical matter, breeding initially is likely to make use ofsomewhat more than half of the available atoms; 4 and later about70 percent.
At present the manufacturing processes that transform uranium con-centrates into fabricated nuclear fuel have few environmental effects.The operations are chemical and metallurgical processes that generatemuch the same kinds of wastes one would expect from similar opera-tions with nonradioactive materials. Pollution problems are likely to
I Statement of Hon. John N. Nassikas to the Senate Commerce Committee, Jan. 30,1970, p. 94.2 Remarks of Commissioner John A. Carver at the Annual Conference of the Atomic Industrial Forum,Inv., Dec. 1, 1969.3 Energy R. & D. and national progress, p. 105.4 Robert D. Nininger, "Importance of Increased Supplies of Nuclear Fuels To Meet Long-Term World
Energy Requirements," in "AEC Authorizing Legislation-Fiscal Year 1970." Hearings before the JointCommittee on Atomic Energy, 9ist Cong., lst sess., 1969, pt. 3 p. 2329.

63
appear through effects of acids and other chemical wastes, rather thanthe slight radioactivity of any uranium wastes.
For the future, the manufacture of fuel materials and fabrication ofnuclear fuel may become more hazardous as plutonium and uranium-233 come into use. There may then be the possibility of these materialsescaping to contaminate the surrounding area, as recently happened atthe AEC's wveapon's factory at Rocky Flats, Colo. How likely suchrelease may be will depend upon the regulations imposed by the AECupon the private factories.
The Atomic Energy Commission believes that breeders will extendenergy resources indefinitely, but acknowledges that until breeder re-actors can be put into general use, the Nation faces an immediateproblem of producing enough uranium to fuel present nuclear powerreactors to meet short-term electrical energy requirements.' Onemeasure of this problem is the controversy over the proposed saleto private interests of the AEC's gaseous diffusion plant at OakRidge, Tenn., which manufactures nuclear fuel materials enriched inthe U235 atoms.Domestic uranium resources
Table 24 summarizes the AEC's estimate of February 1967 thatthe uranium resources of the United States are the equivalent of875,000 tons of (U308), known as "black oxide," and 1,705,000 tonsfor the free world outside of the United States. Through 1980, U.S.uranium requirements for civilian nuclear power are estimated atabout 170,000 tons, based on nuclear capacity of 95 million kilowattsin 1980.2
TABLE 24.-NATURAL URANIUM RESOURCES I
[In thousands of tons UsOal
Free worldexcluding Total free
United States United States world
Less than $10/lb. U,08:Reasonably assured 2__ _------- _-_-_-_______-___-__-_-___- 200 485 685Estimated additional 3....... ................. -. 325 355 680
Total -525 840 1,365
Less than $15/lb. U3Os: 4Reasonably assured ------------------------ 350 1, 050 1, 400Estimated additional -525 655 1 180
Total -875 1,705 2,580
a AEC 1960 projections.'Demonstrated reserves.3 Based on geologic and exploration data.' Includes less than $10/lb. UMOs.
Source: Civilian nuclear power. The 1967 supplement to the 1962 report to the President February 1967, U.S. AtomicEnergy Commission, p. 15.
The AEC's estimate for yearend uranium reserves for December1968 recoverable at $8 per pound of U308 or less wvas 161,000 tons ofU308, representing a net increase of 13,000 tons over the year.3 Re-serves at a price of $10 per pound or less were estimated at 200,000tons.
I Loc. cit.2 "Civilian Nuclear Power," the 1967 supplement to the 1962 report to the President, Washington, D.C.,
U.S. Atomic Energy Commission, February 1967. p. I5.2"AEC Authorizing Legislation, Fiscal Year 1970," hearings before the Joint Committee on Atomic
Energy, 91st Cong., Ist sess., 1969, pt. 3, p. 309.
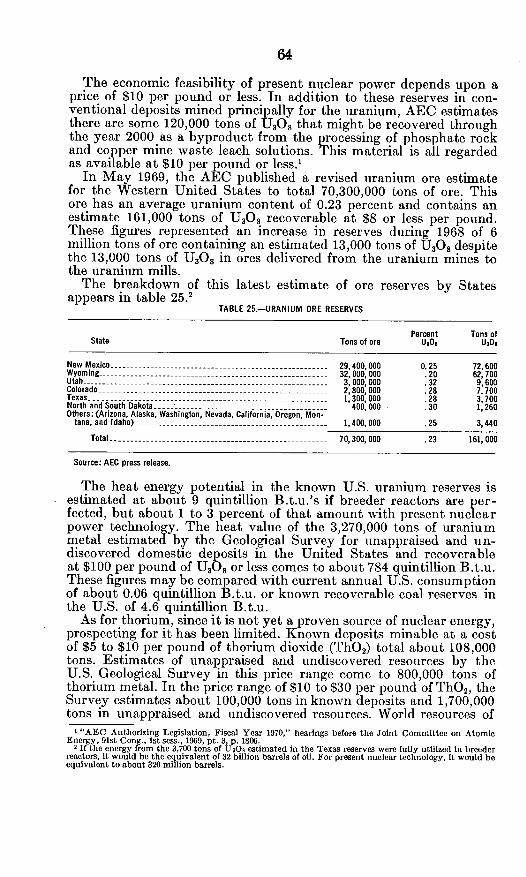
64
The economic feasibility of present nuclear power depends upon aprice of $10 per pound or less. In addition to these reserves in con-ventional deposits mined principally for the uranium, AEC estimatesthere are some 120,000 tons of U308 that might be recovered throughthe year 2000 as a byproduct from the processing of phosphate rockand copper mine waste leach solutions. This material is all regardedas available at $10 per pound or less.'
In May 1969, the AEC published a revised uranium ore estimatefor the Western United States to total 70,300,000 tons of ore. Thisore has an average uranium content of 0.23 percent and contains anestimate 161,000 tons of U308 recoverable at $8 or less per pound.These figures represented an increase in reserves during 1968 of 6million tons of ore containing an estimated 13,000 tons of U308 despitethe 13,000 tons of U308 in ores delivered from the uranium mines tothe uranium mills.
The breakdown of this latest estimate of ore reserves by Statesappears in table 25.2
TABLE 25.-URANIUM ORE RESERVES
Percent Tons ofState Tons of ore UaOe U308
New Mexico ---- 29 400,000 0.25 72,600Wyoming-c ----- 32,000,000 .20 62 700Utah -3, 000,000 .32 9,600Colorado- -- -------------------------------- 2,800,000 .28 7, 700Texas -1,300,000 .28 3,700North and South Dakota -400,000 .30 1,260Others: (Arizona, Alaska, Washington, Nevada, California, Oregon, Mon-
tana, and Idaho) -1,400,000 .25 3,440
Total -70,300,000 .23 161,000
Source: AEC press release.
The heat energy potential in the known U.S. uranium reserves isestimated at about 9 quintillion B.t.u.'s if breeder reactors are per-fected, but about 1 to 3 percent of that amount with present nuclearpower technology. The heat value of the 3,270,000 tons of uraniummetal estimated by the Geological Survey for unappraised and un-discovered domestic deposits in the United States and recoverableat $100 per pound of U3 08 or less comes to about 784 quintillion B.t.u.These figures may be compared with current annual U.S. consumptionof about 0.06 quintillion B.t.u. or known recoverable coal reserves inthe U.S. of 4.6 quintillion B.t.u.
As for thorium, since it is not yet a proven source of nuclear energy,prospecting for it has been limited. Known deposits minable at a costof $5 to $10 per pound of thorium dioxide (ThO2 ) total about 108,000tons. Estimates of unappraised and undiscovered resources by theU.S. Geological Survey in this price range come to 800,000 tons ofthorium metal. In the price range of $10 to $30 per pound of ThO2 , theSurvey estimates about 100,000 tons in known deposits and 1,700,000tons in unappraised and undiscovered resources. World resources of
I "AEC Authorizing Legislation, Fiscal Year 1970," hearings before the Joint Committee on AtomicEnergy, 91st Cong., lst sess., 1969, pt. 3, p. 1806.
If the energy from the 3,700 tons of U308 estimated in the Texas reserves were fully utilized in breederreactors, it would be the equivalent of 32 billion barrels of oil. For present nuclear technology, it would beequivalent to about 320 million barrels.

65
thorium in known deposits minable under present economic condi-tions total about 700,000 tons and undiscovered resources are expect-ed to range from 20 to 200 million tons.'
The energy value of known deposits of thorium in the United Statesis about 12 quintillion B.t.u.'s. The AEC estimates the energy vlaue ofunappraised and undiscovered thorium deposits in the United Statesas 128,500 quintillion B.t.u.'s.
Uranium requirementsIn 1967 the AEC estimated uranium requirements for domestic
nuclear power at 170,000 tons of U3 08 based upon an estimated nuclearpowerplant capacity of 95 million kilowatts in 1980.2
In April 1969 the estimate given was 237,000 tons of U308 for theyears 1969 through 1980, with an annual requirement of 38,000 tons ofU3 08 by 1980. Although the estimated requirements through 1980greatly exceed current reserves at $8, the AEC testified that theexploratory drilling and prospecting efforts and the results beingachieved therefrom " * * * provide encouragement that the resourcesneeded will be found." 3
In addition to the immediate estimated needs through 1980, theAEC has factored in a 8-year reserve as being necessary to provide aminimum production base for uranium mining and processing. Thusfor domestic nuclear power through 1980, production plus reserves isestimated at about 600,000 tons of U308 , which will require newdiscoveries exceeding 440,000 tons. In December 1969, presentlyknown reserves were stated at 160,000 tons for $8 per pound U308.4
AEC notes the discrepancy between the known reserves in 1969 andthe projected requirements through the year 2000. Even assuming thatfast breeder reactors are introduced in the late 1980's, the cumulativerequirement through the year 2000 is for 1 million tons of U3 08 .Reserves at $10 per pound or less were estimated in 1969 at 320,000tons of U308 , including the 120,000 tons of byproduct materialmentioned above. AEC estimates that current additional undiscoveredresources in the $10 per pound price could add another 350,000 tons ofU3 08 and that resources of materials in the $10 to $15 per poundcategory are estimated at 350,000 tons.'
Uranium miningUranium is mined mainly in 10 Western States, five of which
produce over 90 percent of the total domestic uranium ore (JCAE-W.Miners 1967 P102).
Three types of uranium deposits are worked:(1) Extensive deep deposits as in the lower Chinle formation
of the Big Indian Wash district of Utah, and in the sandstones ofthe Grants-Ambrosia Lake districts of New Mexico. Here the orebodies are large and highly mechanized handling and haulingequipment can be used.
(2) Extensive shallow deposits, as in the Gas Hills district ofWyoming. Here open pit methods are used.
I "Energy R. & D. and National Progress," op. cit., pp. 110-112."'Civilian Nuclear Power," the 1967 supplement to the 1962 report to the President, op. cit., p. 15.
3 "AEC Authorizing Legislation, fiscal year 1970," op. cit., p. 1807.4 The Nuclear Industry, 1969," U.S. Atomic Energy Commission, 1969, p. 35.a "AEC Authorizing Legislation, Fiscal Year 1970," op. cit., p. 1807.

66
(3) Irregular shallow deposits, such as the carnotite occurrencesin the Salt Wash Formation of the Uravan Mineral Belt ofColorado and the copper-uranium ores in the White Canyondistrict of Utah. Here various techniques are used.
The largest ore bodies mined by underground methods measure asmuch as half a mile in length, several hundred feet in width, and from5 to 100 feet in thickness, and are located several hundred feet or morebelow ground. In most cases the ore is worked from vertical or inclinedshafts. Open pit mining permits more complete ore recovery thanunderground mining and allows the grade of ore to be readily con-trolled by selective mining and blending.
In 1968, according to latest figures of the Bureau of Mines, approxi-mately 320 mining operations in eight States produced almost 6.5million tons of uranium ore, 22 percent more than was produced bysome 500 operations in 1967. New Mexico lead in production andaccounted for 51 percent of the total recoverable uranium, followed byWyoming with 25 percent, Colorado with 11 percent, and Utah with7 percent. Following were Texas, Arizona, South Dakota, and NorthDakota.'
Uranium processingUranium ores were processed at 16 mills during 1968 and ore concen-
trates containing 7,338 tons of U308 were shipped to the AEC from13 of these mills. This compared with 8,425 tons shipped from 16mills in 1967.
Substantial quantities of uranium were processed for private indus-try also during 1968 with slightly more than 5,000 tons of U3 08 soldcompared with an estimated 700 tons in 1967. Sales to private indus-try, which represented about 40 percent of mill production in 1968,are expected by the Bureau of Mines to increase both in volume andrelative percentage as uranium is required to fuel nuclear powerplants and as the AEC ends its own uranium buying.2
The AEC expects that an additional 8,000 to 9,000 tons could beadded by the mid-1970's. Fourteen uranium ore processing mills arecurrently in operation, with 90 percent of their production fromuranium mines that they own or control.3
Environmental effects of uranium miningThe environmental effects of uranium mines are similar to those of
other mining operations using pit and open mining techniques.Hazards of uranium mining.-Uranium miners are exposed to the
usual mining hazards such as accidents, and exposure to silica dust,diesel and explosive fumes, and intense noise. In addition, they alsomay be chronically exposed to dangerous concentrations of radioactivegas.
Uranium in nature is slightly radioactive. It gives off a radioactivegas, radon, which escapes into the air from exposed rock surfaceswithin a mine. Radon, being much heavier than air, collects in themines. The radon subsequently changes into solid radioactive particles
I U.S. Department of the Interior, Minerals Yearbook, vol. I-II, "Metals, minerals, and fuels." Wash-ington, D.C., U.S. Government Printing Office, 1969, p. 1iS.
3 ibid., p. 1118.Tbe PNuclear Industry 1969," op. cit., p. 37.

67
which are deposited and retained in the lungs of miners. The radonin the air breathed and the radioactive daughter products of the radonexpose the lungs of miners to radiation.
Studies by the U.S. Public Health Service in cooperation with theAtomic Energy Commission and State agencies disclose that under-ground uranium miners are subject to lung cancer to a degree sub-stantially greater than the general population, or that of miners inother kinds of underground mines. This excess incidence of lung cancerin uranium miners is believed to be induced by their exposure toradiation from the radioactive decay of the radon daughters in theirlungs.'
At present there is some disagreement whether it is possible oreconomically feasible to reduce radon exposure to the levels set bythe Department of Labor.
Wastes from uranium milling.-Uranium mills can be a source ofenvironmental contamination because the process wastes contain ra-dioactive materials, mainly radium, and toxic chemicals which may bereleased to the environment. For example, about 865 gallons of wasteliquids are produced per ton of ore treated. Initially, wastes wereallowed to fow or seep into the ground, where they might enter thewater table. Typically, a uranium mill must dispose of approximately10 curies of radium per day in one way or another.2 This is consideredto be a large amount of radioactive material.
Of 26 mills in operation in 1963, 10 discharged the liquid effluentfrom their tailings to streams. For example, in 1958 and 1959 it wasfound that consumers of untreated water along the Animas River insouthwestern Colorado below mills in Durango were receiving almost300 percent of the maximum permissible daily intake for radium rec-ommended by the International Committee on Radiation Protection,while the cities of Aztec and Farmington received 170 and 140 percentof the daily permissible intake respective. Of the given total daily in-takes, from food as well as water, about 61 percent of the radium camefrom plants which had taken up the radium from contaminatedirrigation water.3 Since then corrective measures have reduced the ex-posures to one-third of levels recommended by the U.S. Public HealthService.
Chemical wastes from mills also can have environmental effects. Forexample, organic raffinate, a waste from the ore extraction, wasoriginally discharged directly into the Animas River even though verylethal to fish. Until this discharge was stopped, some 50 miles of theriver below the mill was devoid of fish and the food that fish live on.4
Production of uranium concentrates has resulted in the accumulationof uranium mill tailings piles in sizes ranging.from several thousand toseveral million tons in the basin of the Colorado River. In all but onecase, there were in 1966 no measures to contain the tailings and thepiles were left exposed to erosion by wind and rain. The fines in the
I Radiation Exposures of Uranium Miners," hearings before the Joint Committee on Atomic Energy,90th Cong., ist seas., 1967, pt. 2, p. 1021.
' M. Elsenbud. "Environmental Radioactivity," New York, McGraw-Hill Book Co., 1963, p. 174.3 Eisenbud, op. cit., p. 176.4 "Radioactive Water Pollution in the Colorado River Basin," hearing before the Subcommittee on Air
and Water Pollution, Senate Committee on Public Works, 89th Cong., 2d seas., 1966, p. 3.
68
tailing were easily carried away by wind and rain. They also containedthe most radium per unit weight of waste. Some of the tailings pileswere immediately adjacent to population centers. Many of the pileswere at closed down and abandoned mills, with no one responsibilefor possible preventive measures.
The problem of radioactive water pollution in the Colorado RiverBasin from uranium mills was the subject of hearings held by SenatorMuskie and the Senate Subcommittee on Air and Water Pollutionin 1966.1
Regulation of uranium productionResponsibility for regulating various steps in the mining, refining,
processing and fabrication of uranium into nuclear fuel is dividedbetween the States and the Atomic Energy Commission. Briefly,regulation of mining, milling of uranium ores, extraction of the uraniumand subsequent chemical processing of it would be the responsibilityof the States. At present only the AEC performs the enriching ofuranium fuel materials in the U235 isotope, so control of any environ-mental effects of this operation is directly an AEC operational matter.Subsequent fabrication of enriched fuel materials into fuel is doneunder AEC licenses to possess this material, so that control of theU2 5 for reasons of security and environmental protection is with theAEC.
HYDROPOWER
Generation of electricity by hydropower has declined in terms ofthe total to less than 17 percent in 1968; some estimates reduce it toonly 7 percent of the larger total in year 2000.
Information in table 26 indicates that substantial development ofwater power resources has taken place since World War II, with in-stalled capacity somewhat more than doubled. Even so, about two-thirds of the estimated ultimate potential remains for possibledevelopment. Significantly, about three-fourths of the estimatedundeveloped potential is in the Pacific border States, especiallyAlaska, and in the Mountain States, some of which have very sub-stantial resources of coal and petroleum.Environmental effects
The building of dams to develop hydropower presents at least onemajor environmental problem in as much as flooding of importantvalley land removes it permanently from major food production. Insome areas population centers, generally smaller ones, are also floodedand the local economy disorganized. In areas of considerable soilerosion, siltation of the lake created behind the dam must be antici-pated. An offsetting feature is the increased recreational resourcesand reserve water supplies which are created.
I "Radioactive Water Pollution in the Colorado River Basin," hearing before the Subcommittee on Airand Water Pollution, Senate Committee on Public Works, 89th Cong., 2d sess., 1966.

69
TABLE 26.-WATER POWER-DEVELOPED, 1950, 1960, AND 1967, AND ESTIMATED UNDEVELOPED, 1967,STATES
[in thousands of kilowatts, as of December 311
EstimatedDeveloped water power I undevel-
(capacity of actual opedinstallations only) water1950 1960 1967- power,1950 1960 1967 1967
EstimatedDeveloped water power I undevel-
5capacity of actual apedInsallations only) water
power.1950 1960 1967 1967
State State
UnitedStates -- 2 18,675 33,180 45, 826 130, 444
NE -1,239 1,520 1,491 3,304Maine -391 495 510 1,714N.H -312 445 429 802Vt -192 199 200 338Mass 223 227 219 267R.l -11 3 3 0Conn 107 151 131 183
M.A -1 678 2 472 4,247 4,514N.Y- 1 225 2 028 3,809 1,292N.J------- 9 8 8 241Pa -444 436 430 2 981
E.N.C -901 929 969 1,256Ohio -16 9 2 249Ind -37 31 110 315III - 54 42 43 206Mich -399 419 395 272Wis------- 396 427 419 213
W.N.C -629 1,594 2,734 4,363Minn -181 186 170 157Iowa -137 136 136 345MO -151 293 393 2,025N. Oak 0 400 400 195S. Dak 11 333 1,392 303Nebr - 142 240 238 1,036Kans -6 6 5 303
S.A -2,767 3,773 5,349 9,468Del -1----- 1I 0Md -272 272 494 160D.C -3 3 3 3
S.A.-ContinuedVa -207 416 726W. Va -208 208 208N.C -962 1,220 1,766S.C------- 679 958 1,034Ga - 425 653 1 069Fla -13 42 39
E.S.C -2,729 3,750 4,832Ky ------- 271 541 671Tenn - 1 238 1 910 1,894Ala- 1220 1,299 2,267miss ------ 0 0 0
W.S.C-466 944 1,698Ark -148 388 900La-0 0 0Okla -74 165 363Tex------- 245 391 434
Mt -2,286 4,621 6,083Mont -427 1, 235 1, 512Idaho -441 1,251 1,251Wyo 79 189 212Colo -92 253 314N.Me- 25 25 24Ariz ------ 541 980 1,879Utah -94 100 208Nov------- 587 587 682
Pac a 5,979 13,578 18,425Wash - 2,591 7,002 9,549Dreg -783 2,434 3,449Calif - 2,606 4,054 5,324Alaska -) 67 84Hawaii- (a) 21 19
1 2761,994
9191,3153, 197
843, 9431,485
6881,630
1403,065
91576
9141, 160
26,8916,269
12 3921 2861, 875
1543, 6761,320
973, 64023,4995,656
11,90932,511
35--------- 1-
X Electric utilities and industrial plants, excluding pumped storage capacity.a Excludes Alaska and Hawaii.3 Not available.
Source: Federal Power Commission; annual summaries and related monthly reports; Statistical Abstract of the UnitedStates 1969, op. cit., p. 518.
IMPORTED ELECTRICITY
Another alternative is to import electricity. Canada has large,undeveloped resources for hydropower. From time to time there havebeen proposals to import a large block of electricity into the north-eastern part of the United States.
Recently there was talk again of such arrangements. At one timeConsolidated Edison of New York was reported to be negotiating topurchase 5,225 megawatts from a hydroelectric station at ChurchillFalls in Labrador. Subsequently Quebec Hydro contracted for allavailable power from this project. Recently, however, work hasbegun on a 2,200-megawatt project downstream from Churchill Falls,and this project is expected to provide extremely attractive electricityto utilities in New England.
THE ELECTRICITY INDUSTRY
The most recent major analysis of the industry appeared in thenational power survey of the Federal Power Commission, publishedin 1964. That survey is now being updated and a revised version isexpected in the summer of 1970. Meanwhile the Federal Power Com-mission has been drawing upon the revised estimates for statementsbefore committees of Congress.
THE ELECTRICITY INDUSTRY IN 1964
In terms of capital investment and assets, the U.S. electric powerindustry has grown from its conception in the 1880's to a giant rankedthe largest in the Nation. It has expanded at a pace nearly twice thatof the overall economy, doubling its output every 10 years and in-creasing at an annual compound rate of almost 7 percent. Electricitysupplied 20 percent of the energy used in the United States in 1964and is expected to supply 30 percent by 1980. The industry's annualrate of productivity improvement has averaged about 5.5 percentsince 1900. From the early 1900's through 1940 the price for residentialelectricity dropped steadily, and has held almost steady until recentlywhen the number of requests to raise rates increased.
Electric power ranks among the largest industries in the economy.Requiring heavy use of capital, its annual capital outlays in 1964represented over 10 percent of the total of such spending by all Ameri-can industries. Its spending on plant and equipment in 1962 aloneamounted to $4.3 billion. Its capital assets of $69 billion in 1962 weremore than 60 percent greater than its nearest rival, petroleum refiningwith $40.6 billion.
ORGANIZATION OF THE ELECTRICITY INDUSTRY
The electric power industry in 1962 consisted of 3,600 systems whichvaried greatly in size, type of ownership and power supply functionsperformed. The pluralistic U.S. electric power industry consists offour distinct ownership segments, those owned by investors, State andlocal public agencies, cooperatives, and Federal agencies. Details ofthe size and composition of each segment appears in tables 27 and 28.
The largest segment consisted of 480 private or investor-owned sys-tems which owned 76 percent of the generating capacity and served79 percent of the retail customers.
(70)

7.1
TABLE 27.-NUMBER OF SYSTEMS, GENERATING CAPACITY, AND CUSTOMERS SERVED BY U.S. ELECTRIC POWERINDUSTRY, I BY OWNERSHIP SEGMENT, 1962
Number of systems GeneratingEngaged in Enenratin
Engaged in Engaged in capacity, Retail customers servedgeneratingand distiution pecn of
Ownership Total transmission only total Number Percent
Investor-owned2 -480 318 162 76 47,500,000 79.5Public (non-Federal) -2,124 864 1,260 10 8,118,000 13. 5Cooperatives -969 76 3 893 1 5,095,000 7.5Federal - ------ 44 42 2 13-
Total -3,617 1,300 2,317 100 60,713,000 100.0
I Excludes Alaska and Hawaii.2 Includes 34 industrial concerns that supply energy to other customers.a Many of the distribution cooperatives are also members of generating and transmission cooperatives (the so-called
G. & To's) and hence participate indirectly in the generation and transmission function.
TABLE 28.-COMPOSITION OF THE U.S. POWER INDUSTRY' BY SIZE AND OWNERSHIP, 1962
[Number of systems under separate management or controll
Annual energy requirements, billions of kilowatt-hours
Ownership Over 10 I to 10 0.1 to I Under 0.1 Total
Investor-owned - ------ ------- 18 88 85 289 480Public (non-Federal) -0 20 136 1,968 2,124Cooperatives -0 1 64 904 969Federal Government -2 7 6 29 44
Total number of systems 20 116 291 3,190 3,617
I Excludes Alaska and Hawaii.
Source: National Power Survey, pt. 1, p. 17.
Second in number of retail customers was the publicly owned seg-ment-including municipalities, public utility districts, and State andcounty entities. They accounted for 10 percent of the generatingcapacity and 13.5 percent of the retail customers.
Cooperatives, the next largest segment, were a major factor in ruralareas. Largely engaged in distribution, they owned less than 1 percentof the generating capacity but brought electricity to 7.5 percent ofthe retail customers.
The Federal segment in 1962 had 13 percent of the generatingcapacity. It does not sell to retail customers. Federal electricity goes topublicly owned systems and cooperatives as preference customers.It also is sold to investor-owned utilities and to industries, such asaluminum producers, which are large power users.
The 100 largest systems in 1962 accounted for about 89 percentof the total electric utility generation.
COMPONENTS OF ELECTRIC POWER SUPPLY
The interdependent parts of a power supply system can be dividedinto the three functions of generation, transmission, and distribution.The relative cost of each function, based on a composite nationalaverage in 1962, is shown in table 29. As with any average, there maybe substantial deviations for individual systems. Thus, transmissioncosts in New York City were less than 4 percent, but almost 20 percentin low population areas of northern Minnesota.

72
TABLE 29.-TOTAL DELIVERED COST OF POWER-1962[Composition in percentl
Fixed Operatingcharges expenses Total cost
Generation .- ---------------------------------------------- 28.2 22.8 51. 0Transm ission ----------------------------------------------- - 7.9 2.0 9. 9Distribution -22.8 16.3 39.1Total . 58.9 41.1 100. 0
Source: National Power Survey, pt. 1, p. 26
THE ELECTRICITY INDUSTRY TODAY
Chairman Nassikas of the FPC has recently used the indicatorsshown in table 30 to describe the present electricity industry in theUnited States. While some of his data do not precisely coincide intime, they are probably the best figures available until the revisedpower survey is completed. He shows 3,550 systems with a gross plantinvestment of $102 billion, a generating capacity of 293 thousandmegawatts, and an output of 1.3 trillion kilowatt hours. Among thesesystems, investor-owned companies were 13 percent of the number andaccounted for approximately three-fourths of the plant investment,installed capacity, electricity generated, and sales to ultimate customers.
TABLE 30.-SELECTED INDICATORS FOR THE PLURALISTIC ELECTRIC UTILITY INDUSTRY
Investor Cooperatively Publiclyowned owned owned Totals
Number of systems -437.0 971. 0 2,142. 0 3,550. 0Percent of total. - .12.3 27. 4 60. 3 100Gross plant investment (millions)------------ $76,025.0 $6,167.0 $20, 200. 0 $102,392.0Percentof total 74.3 6. 0 19.7 100Kilowatt-hours generated (billions) 1,021.8 14.5 296. 0 1,332 3Percent of total.------------------ 76. 7 1. 1 22 .2 100
Kilowatt-hours sales to ultimate customers 931.6 54.5 223.0 1,209. 1Percent of total.------------------ 77.1 - 4. 5 18.4 100Installed capacity (megawatts) 223,220. 0 3,396. 0 66,858. 0 293,474. 0Percent of total . 76.1 1.1 22.8 100
Note: Data on number of systems is for the year 1965. Gross plant investment and installed capacity are as of Dec. 31,1968. Kilowatt-hours generated and kilowatt-hours sales to ultimate customers and for the calendar year 1968.Source: RemarksbyChairmanJohn N. Nassikasof theFederal PowerCommission beforethe28th annual meetingoftheNational Rural Electric Cooperative Association, Feb. 11, 1970.
Users of electricityThe 1.3 trillion kilowatt-hours of electricity generated by the
electricity industry in 1968 brought an income of $18.5 billion fromthe ratepayers. Sales to ultimate customers of 1,202 billion kwhdivided as follows:
Billionkilowatt-hours Percent
Residential or domestic 368 31Commercial and industrial 784 65All other 50 4
Total 1,202 100
Source: Statistical Abstract of the United States, 1969, p 516.

73
The number of customers totaled 68.7 million, of which 61.4million were residential or domestic and 8 million were commercial orindustrial.Electric utility sales
An insight into the industry's expectations for future sales may behad from the 20th annual electricity industry forecast by the tradejournal Electrical World, published in its issue of September 15,1969.1
It shows a doubling of sales from 681 billion kilowatt hours in 1960to 1,395 billion for 1970, and projections of 2,012 billion for 1975 and4,030 for 1980. Of the four categories of users-residential, commer-cial, industrial, and other-residential uses are increasing the mostrapidly. Table 31 summarizes the uses for 1960 to 1985.
TABLE 31.-ELECTRIC UTILITY SALES
[Billion kilowatt-hours]
Residential Industrial Commercial Other Total
1960-------------------------------- 195.6 344.1 114.4 27.1 681. 21961 -------------------------------- 208.2 346.6 134.4 29.4 718. 61962 ------------------------------- 225. 5 373. 0 143. 6 31. 6 773. 71963 ----------------------------- 240.7 387.4 165.9 34.1 828. 21964 ----------------------------- 261.0 408.3 182.9 35.4 887. 51965 ---------------------------- 279.8 432.2 201.4 36.8 950. 41966 -------------- -------------- 305.4 463.8 225.1 41. 4 1,035. 61967 ------------------------------- 330.2 484.7 241.7 46.9 1, 103. 51968 ---------------------------- 366. 2 517. 3 264. 2 50. 6 1, 198. 41969 -402. 0 557. 3 290.0 54.5 1, 303. 81970--------------------------- - 440.0 585.2 311. 0 58.8 1, 395. 01971------------------------------ 481. 0 621. 0 337. 0 67.7 1, 506. 71972------------------------------ 524. 0 662. 0 363. 0 70. 7 1,619. 71973----------------------------- 569.0 705. 0 390. 0 77.2 1,741. 21974-------------------------- - 615. 0 750. 0 420. 0 86.8 1,871. 81975 -------------------------------- 660. 0 800. 0 450. 0 102. 2 2, 012. 21980 ----------------------------- 970. 0 1, 160. 0 620. 0 130. 0 2,880. 01985 ----------------------------- 1,400. 0 1, 580. 0 860. 0 190. 0 4, 030. 0
Source: Electrical World, Sept 15,1969.
These forecasts do not attempt to anticipate effects of new demandsfor electric vehicles, automation, and further mechanization of manu-factures and electrification of major trunklines and commuter lines ofrailroads.
Residential salesBecause residential sales of electricity are increasing so rapidly and
so immediately, and directly affect the standard of living, they warrantspecial attention.
Residential sales of electricity by the utilities continue to be thefastest growing market. Sales for heating and air conditioning are in-creasing rapidly. At the end of 1968 there were 3.4 million electricallyheated homes in the United States. By 1990, the Federal Power Com-mission expects this number to be 25 million. Some utilities foundduring the summer of 1969 that as much as 25 to 35 percent of theirpeak loads were attributable to air conditioning or other weatherrelated needs.
I Walter D. Brown, "20th Annual Electrical Industry Forecast," Electrical World, vol. 172, Sept. 15,1969, pp. 8-08.
46-366 0-70-6

74.
The "Electrical World" forecast shows residential sales to have beenabout 30 percent of total electricity sales during the 1960's. "ElectricalWorld" expects them to increase to one-third of the total by 1975.Electrical heating is the fastest growing component of residentialsales. The industry's goal for 3.6 million all-electric homes is expectedto double to 7.2 million by 1975 and to double again to 14.4 million inthe following 5 years. If these goals are attained, electric heating wouldincrease from 22 percent of residential sales in 1969 to 27 percent in1975 and to 40 percent by 1980.1
In 1969 the utilities expected to have 61.6 million residential cus-tomers, an increase of 20 percent in 9 years. New customers in the1970's are expected to bring the total to 68.4 million by 1975 and to75 million by 1980.
From 1960 to 1969 average annual use by residential customersincreased from 3,851 to 6,550 kilowatt-hours, up 70 percent. This com-bination of higher usage and new customers more than doubled resi-dential sales in the 1960's. By 1975 the average residential usage isexpected to reach 10,000 kilowatt-hours.
The average annual residential bill in 1969 was $137. It is expectedto approach $200 by 1975. The residential market should producerevenues of more than $8 billion for 1969 and over $13 billion for 1975as residential sales approach a forecast 660 billion kilowatt-hours inthat year.
Table 32 gives historical and projected figures on residential use forthe years 1960 to 1985.
TABLE 32.-AVERAGE RESIDENTIAL USE AND RESIDENTIAL SALES
Use per ResidentialYear-end customer sales (billion Residential
customers (kilowatt- Average kilowatt- revenueYear (millions) hours) annual bill hours) (millions)
1960 -51. 3 3,851 $95.12 195. 6 $4,8311961 -52.4 4, 016 98.39 208. 2 5,0901962 -53.5 4,257 102.59 225.5 5,4291963 - 54.9 4,440 105.23 240.7 5,6931964 -56. 1 4,703 108.12 261.0 6,0101965 -57. 4 4,933 110.93 279.8 6,2951966 -58.6 5, 263 115.26 305. 4 6,6981967 -59.8 5,575 120.42 330.2 7,1451968 -61.2 6,056 128.39 366.2 7,6971969 -61.6 6,550 137.55 402.0 8, 4421970 -63.0 7,060 148.26 440.0 9,2401971- 64.0 7.580 158.42 481. 0 10, 0521972 -65.2 8,110 168.69 524.0 10,8991973 -66.4 8,640 178 :85 569.0 11,7781974 -67.6 9.180 188.20 615.0 12,6071975 -68.4 9,730 197.52 660.0 13,3981980 -75.2 12, 990 250.70 970.0 18,7211985 -81.8 17, 240 315.50 1, 400. 0 25, 620
Source: Electrical World, Sept. 15, 1969, p. 90.
PATTERNS FOR 1980-THE FPC FORECAST OF 1964
In its 1964 survey, the FPC described what it thought the patternfor generation and transmission of electricity would be by the year1980. What follows is summary of the FPC's expectations.2
I Walter D. Brown, op. cit., p. 89.2 Cf. "National Power Survey," pt. 1, pp. 214-265.

75
Projected capacityTable 33 shows the projected makeup of the generating capacity
required in 1980 by sectors and in summary for the U.S. fossil-fueled,steam-electric plants that then are expected to provide about 67percent of the needed capacity, of which about 17 percent is shown tobe at mine-mouth. Nuclear power was estimated to form about 13percent of total capacity with the larger amounts in the Northeast andWest sectors. Conventional hydro would contribute nearly 15 percentof the 1980 requirements and pumped storage hydro and other peakingsources would provide the remainder. Regionally, the Northeast andthe South sectors accounted for about 35 and 32 percent of the U.S.total, the North Central sector 15 percent, the West sector 18 percent.
TABLE 33.-ESTIMATED U.S.1 GENERATING CAPACITY, 1980
[In gigawatts 'I
North-Northeast South central West
Generating capacity sector sector sector sector Total Percent
Hydroelectric:In 1966-Added 1967-80 2
Total-
6.73. 5
10.2
6. 8 .2
17.0 4.1
21.8 42.622.7 33.2
44.5 75.8
8.26.3
14.5
Fossil fueled steam:At load center:
In 1966-Added 1967-80-
Total
At mine mouth:In 1966-Added 1967-802 .
Total-
Nuclear fueled steam:In 1966-Added 1967-802-
Total-
Pumped storage:In 1966 -------------------Added 1967-80 - ---- -
Total-
Other peaking:In 1966 -Added 1967-80- .
Total -- --
In 1966- -Added 1967-80-
Total --
53.0 57.4 21.9 18.9 Ib.2 28.940.8 51.2 14.8 7.0 113.8 21.8
93.8 108.6 .36.7 25.9 265.0 50.7
13.922.8
4. 518.9
2.019. 0
.55. 0
20.9 4. 065.7 12.6
86.6 16.636. 7 23.4 21.0 5. 5
.8 .0 .3 1.5 2.6 0. 5
.8 .025.3 13.4
26.1 13.4
.3 1.5 2.610.0 18.4 67.1
10.3 19.9 69.7
0. 512.8
13. 3
.6 .1 .4 0 ,1.1 .210.9 4.0 2.0 1.0 17.9 3.4
11.5 4.1 2.4 1.0 19.0 3.6
=
I
1. 2 I.S5 1. 41.4 .7 .5
2.6 2.2 1.9
76.2 73.7 29.904.7 95.0 46.5
80.9 4168.7 476.4
.2
42.954.1
4 97. 0
2.6
6.9
222. 7300. 3
4 523. 0
.8.5
1.3
42.657. 4
100.0
I Excludes Alaska and Hawaii; also excludes imports from Canada.' Additions less retirements.t Millions of kilowatts.4 The capacity provided for each sector takes into account diversity savings, potential imports from Canada, and the rel-
atve difference in reserve requirements for hydroelectric and thermal capacity.
Source: National Power Survey, pt 1, p. 215.

76
The FPC studies revealed several trends for 1980, the concentrationof hydroelectric resources in the western and southern sectors, theconcentration of added nuclear projects in the coastal areas, thecontinued major dependence on fossil fuel steam-electric generation inthe central areas of the Nation, and the moderate demands for peakingresources in the form of pumped storage and other special peakingfacilities. In terms of generating capacity to be added from 1967 to1980, hydroelectric plants were expected by the survey to provide 11percent of the total, fossil-fuel plants 60 percent, and nuclear plants22 ercent.
FIrom the data presented in table 33, FPC concluded that nearly 50percent of the total capacity installed in 1980 would'be in thermalplants to be placed in service after 1966. Most of this capacity wasjudged to be supplied from units of 800 megawatts and larger. Theprojection includes some 135 units of 1,000 megawatts and larger (upto 1,500 mw.) with a total capacity for the Nation of 154,000 mega-watts. About 40 of these are nuclear-power units. Most of the smallerunits ranged below 400 megawatts and were accounted for by existingunits which will remain in service through 1980 and by some units inthe smaller sizes currently on order.
The selection of this high proportion of very large units is consistent,FPC believed, with the goal of the lowest possible cost of power. Akey element in accommodating these large units in the Nation'smedium-and small-size systems will be the existence of strong inter-connections that were expected to be achieved by 1980.
For new generating capacity utilizing fossil fuels, it was expectedthat coal, oil, and natural gas would share in the supply approximatelyin the proportion of 75 percent, 5 percent, and 20 percent, respectively.The geographic distribution would be much the same as in 1964, withoil generally limited to the coastal areas where other fuel costs arehigher, with coal predominating in the heavy-load areas surroundingthe-extensive coal fields in a broad east-to-west belt from Pennsylvaniato Arkansas and in certain areas in the West, and with natural gas asthe leading fuel in the load areas bordering the large gas fields in theSouthwest.Cost of generating electricity
The anticipated cost of generating and transmitting bulk baseloadpower to load centers using the facilities expected to be availablebetween 1975 and 1980 is summarized in table 34. The costs for threealternative power sources as estimated by the FPC survey are indi-cated where appropriate; namely, power from fossil fuel and nuclearplants near the load centers and power transmitted to load centersfrom mine-mouth plants.
A significant factor is that bulk power was expected to be availableat load centers throughout the country at a maximum of 5 mills perkilowatt-hour with private financing.Mine-mouth generation
The general locations of new mine-mouth plants which may becomea part of the power generation program by 1980 is suggested intable 33. As observed in table 34, the cost of mine-mouth generationplus transmission is in many instances closely competitive with gener-ation at load centers. Hence the amount of mine-mouth capacity

77
projected by 1980 was regarded only as illustrative, reflecting thencurrent FPC judgment as to the future status of a competitive situa-tion in which the balance is constantly subject to change. The surveyprojected that about 25 percent of new generating capacity neededby 1980 xvould be mine-mouth plants. The influence of mine-mouthgeneration on the economy of future power programs extends beyondits contribution as a generation source per se. Its competitive mflu-ence will be a factor in almost all decisions on new capacity and hasdone much to advance the development of EHV transmission tech-nology and competing forms of energy transport such as the unittrain movements of coal and the coal slurry pipeline.
TABLE 34.-ESTIMATED 1975-80 COST OF BULK POWER GENERATED AT LARGE BASELOADTHERMAL STATIONS DELIVERED TO LOAD CENTERS I
Conventional steam plant Nuclear plant
Mine mouth Load center Load center
Enersy Enoery Energymi iI s/ millut mIs
Load center-No. and Name Unit size mw kwh Unit size mw kwh Unit size mw kwh
1. Boston1 . -,-500 5.7 1,500 5.3 1,000 4.62. New York -1 500 4.9 1,500 4.9 1 000 4.63. Buffalo- 1, 500 4.7 1 000 4. 0 1 000 4. 54. Philadelphia -1,500 4. 7 1,600 4. 5 1,000 4. 55. Washington-Baltimore -1,500 4.5 1,500 4.5 1,000 4.56. Cleveland -1,500 4.9 1,000 4. 5 1.000 3.87. Detroit -1,500 4.9 1,500 4.5 1,000 3.88. Saginaw-Bay Ci ------------Cit ---- ------ -- 500 4.5 ,000 3.89. OhioRiver -1,500 3.8 1,500 3.8 1,000 3.8
10. Winston-Salem - - - ,200 5.0 1,000 4.111. Memphis -1,500 3.0 1,000 3.4 1,000 3.212. Knoxville -1,500 2.8 1,000 3. 0 1,000 3. 213. Atlanta -1, 000 4.7 1,000 4.6 1,000 4. 114. Miami-1,000 1,500 4.8 1,000 3.915. Pensacola-Mobile -1000 5.1 ' 1,000 4.8 1,000 3.916. Chicago ------------------ I,500 4.4 1,500 4 2 1 000 4.317. Minneapolis --- -1000 4.4 1 000 4.318. St Louis -1, 500 3.6 1,500 3.6 1,000 4.319. Fort Worth-Dallas -,000 4.4 1,200 3.7 600 5.020. Houston-Galveston ,-- -500 3.5 600 4. 721. Tulsa -1,000 4.4 1,000 3.8 600 5. 022. New Orleans 1-- -1000 3.7 600 4.723. Denver -1,000 4.1 '1 000 4.1 600 4.924. Albuquerque -1,000 4;3 '600 4.4 600 4.925. SeattleTacoma -800 5.0 1,000 5.3 800 4.726. San Francisco -, 500 6.2 1,500 4.9 1,000 4.427. Los Angeles - 000 5.5 1,500 5.0 1,000 4.428. Phoenix- 1,000 4.9 31,200 4.6 600 5.0
t Includes production expenses, fuel, transmission expenses and the fixed charges generally applicable to the region inwhich the particular plant is located, on production and transmission facilities Estimates based on large-unit, seasonedplants of I to 4 units Estimates assume no price escalation Assumed plant factors are 70 percent for conventional steamplants and 80 percent for nuclear plants.
' Single unit plant.
Source: National Power Survey, pt 1, p. 219.
Size of generating unitsFor purposes of the survey, the additional generating units estimated
to be required for 1980 were selected from among the larger and moreefficient sizes expected to be availble.
FINANCING GROWTH OF THE ELECTRIC INDUSTRY
Presently the electric industry is the Nation's largest single domesticindustry in terms of captial investment which now exceeds $100billion.
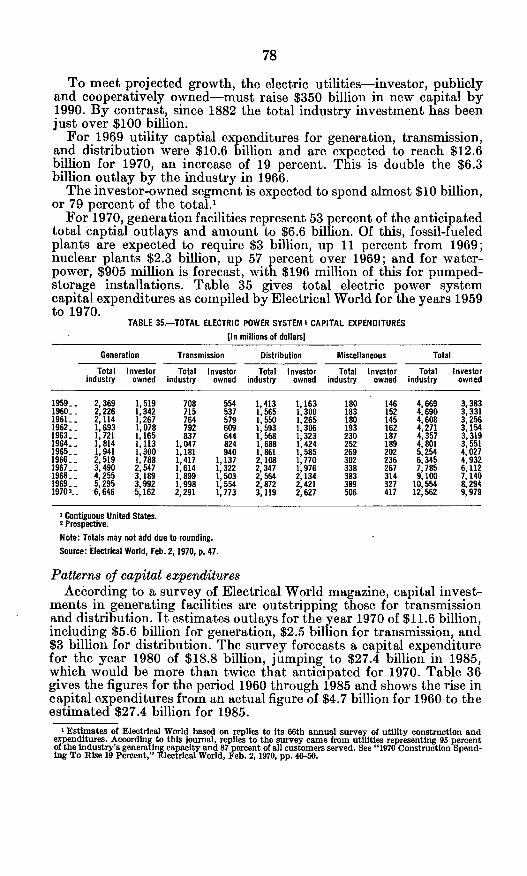
78
To meet projected growth, the electric utilities-investor, publiclyand cooperatively owned-must raise $350 billion in new capital by1990. By contrast, since 1882 the total industry investment has beenjust over $100 billion.
For 1969 utility captial expenditures for generation, transmission,and distribution were $10.6 billion and are expected to reach $12.6billion for 1970, an increase of 19 percent. This is double the $6.3billion outlay by the industry in 1966.
The investor-owned segment is expected to spend almost $10 billion,or 79 percent of the total.'
For 1970, generation facilities represent 53 percent of the anticipatedtotal captial outlays and amount to $6.6 billion. Of this, fossil-fueledplants are expected to require $3 billion, up 11 percent from 1969;nuclear plants $2.3 billion, up 57 percent over 1969; and for water-power, $905 million is forecast, with $196 million of this for pumped-storage installations. Table 35 gives total electric power systemcapital expenditures as compiled by Electrical World for the years 1959to 1970.
TABLE 35.-TOTAL ELECTRIC POWER SYSTEM I CAPITAL EXPENDITURES
[in millions of dollarsl
Generation Transmission Distribution Miscellaneous Total
Total Investor Total Investor Total Investor Total Investor Total Investorindustry owned industry owned industry owned industry owned industry owned
1959- 2,369 1,519 708 554 1,413 1,163 180 146 4,669 3,3831960. 2,226 1,342 715 537 1,565 1,300 183 152 4,690 3,3311961- 2,114 1,267 764 579 1'550 1,265 180 145 4,608 3, 2561962- 1,693 1,078 792 609 1,593 1,306 193 162 4,271 3,1541963. 1,721 1,165 837 644 1,568 1,323 230 187 4,357 3,3191964. 1,814 1, 113 1,047 824 1,688 1,424 252 189 4,801 3,5511965. 1,941 1,300 1,181 940 1,861 1,585 269 202 5,254 4,0271966. 2,519 1,788 1,417 1,137 2,108 1,770 302 236 6,345 4,9321967- 3,490 2,547 1,614 1,322 2,347 1,976 338 267 7,785 6,1121968. 4,255 3,189 1,899 1,503 2,564 2,134 383 314 9,100 7,1401969- 5,295 3,992 1,998 1,554 2,872 2 421 389 327 10,554 8,29419702.. 6,646 5,162 2,291 1,773 3,119 2,627 506 417 12,562 9,979
' Contiguous United States.2Prospective.
Note: Totals may not add due to rounding.
Source: Electrical World, Feb. 2, 1970, p. 47.
Patterns of capital expendituresAccording to a survey of Electrical World magazine, capital invest-
ments in generating facilities are outstripping those for transmissionand distribution. It estimates outlays for the year 1970 of $11.6 billion,including $5.6 billion for generation, $2.5 billion for transmission, and$3 billion for distribution. The survey forecasts a capital expenditurefor the year 1980 of $18.8 billion, jumping to $27.4 billion in 1985,which would be more than twice that anticipated for 1970. Table 36gives the figures for the period 1960 through 1985 and shows the rise incapital expenditures from an actual figure of $4.7 billion for 1960 to theestimated $27.4 billion for 1985.
' Estimates of Electrical World based on replies to its 66th annual survey of utility construction andexpenditures. According to this journal, replies to the survey came from utilities representing 95 percentof the industry's generating capacity and 87 percent of all customers served. See "1970 Construction Spend-ing To Rise 19 Percent," Electrical World, Feb. 2,1970, pp. 46-50.

79
TABLE 36-CAPITAL EXPENDITURES IN THE ELECTRICITY INDUSTRY, 196045
[In millions of dollarsl
Year Generation Transmission Distribution Miscellaneous Total
1960 2,226 715 1,565 183 4,6901961- 2,114 764 1,550 180 4,6081962 -1,693 792 1,593 193 4,2711963 -1,721 837 1,568 230 4, 3571964 -1,814 1,047 1,688 252 4,8011965 -- -- - 1,941 1,181 1,861 269 5,2541966 -2, 519 1,417 2,108 302 6,3451967 - 3,490 1,614 2, 347 380 7,8301968- 4,255 1,899 2,564 383 9,1011969 -5,200 2,200 2, 880 472 10,7521970 -5, 590 2, 500 3,080 500 11,6701971 -6,380 2, 500 3,300 540 12,7201972 -6,030 2, 400 3,530 580 12,5401973- 5,820 2,400 3 750 620 12, 5301974- 6,090 2,700 3,980 660 13,4301975 -6,650 3,000 4,200 700 14,5501980 -9,020 3,900 5,000 900 18,8201985 -14,590 4,700 7,000 1,100 27,390
Source: Electrical World, Sept 15, 1969, p. 93.
Sources of capitalUntil the early 1960's, the investor-owned utilities obtained most
of their funds for construction from the sale of new security issues.Since the early 1950's, however, internally generated funds havesupplied an increasing share, drawing upon retained earning, depre-ciation and amortization, and deferred taxes. By 1962, nearly 60 per-cent of the investor-owned utilities construction funds were internallygenerated. Amortization and depreciation in 1962 supplied 40 percentof the funds, replacing new debt issues as the most important singlesource of funds. Table 37 shows the shifts which have taken place inmajor sources of construction funds since 1950. The overall capitalstructure of investor-owned systems in 1964 consisted of approxi-mately 53-percent debt, 10-percent preferred stock, and 37-percentcommon stock and retained earnings.'
TABLE 37.-SOURCES OF CONSTRUCTION FUNDS, INVESTOR-OWNED ELECTRIC UTILITIES, 1950-62
fin percent]
Source 1950 1954 1958 1962
SECURITY ISSUESCommon stock- 24.6 17.5 14.5 13.8Preferred stock -9. 5 6.7 6.6 4.4Debt -33.---------------------0 41.6 38.2 22.7
Total securities -67.1 65.8 59.3 40.9
INTERNAL FUNDSRetained earnings -7.8 6.2 8.6 14.0Deferred taxes -4.5 5.9 3.9Depreciation and amortization -25.1 23. 5 26.2 41. 2
Total internal funds- 32. 9 34.2 40.7 59.1
Total -100. 0 180. 0 100.0 100. 0
Total construction funds (in millions of dollars).. 1,920 2,950 3,794 3,360
Source: National Power Survey, pt. 1, p. 22.
1 Nattonal Power Survey, pt. 1, p. 19.

80
Publicly owned systems generally obtain their capital investmentfunds from power revenues and by selling debt securities in the publicmarket. In the past, such securities were often general credit obliga-tions of the body of government. More recently, according to theFederal Power Commission, the emphasis has been on revenue bondsissued by the utility system itself, payable from revenues alone, andnot backed by the general credit of the Government or by a lien onphysical properties.' Interest on the debt securities of such localagencies are exempt from Federal income tax and in most jurisdictionsfrom State income tax, which gives them a tax advantage over debtsecurities issued by investor-owned systems.
Only a small portion of the capital requirements for the coopera-tively owned systems is obtained from their membership. The re-mainder is provided largely by long-term mortgage loans from theRural Electrification Administration. Interest on such loans is author-ized by law at 2 percent annually. Under present law, courts haveheld that the cooperatives are not liable for Federal and State incometaxes. Most cooperatives, however, do pay varying State and localtaxes.2
External financingAlthough much of the financing for future construction is expected
to come from internal sources, the funds to be raised from externalsources will be appreciable. Thus the investor-owned part of the indus-try will have to go to the financial market to raise some $6.5 billionin 1970. These funds must be raised in a market where interest ratesnow are between 8%i and 9 percent, the highest level in the past 100years.
Besides borrowing at such rates for new plants and equipment theinvestor-owned utilities soon will face the refunding of bonds thatwere sold in the 1940's at low interest rates. Such refunding at today'smuch higher rates will increase the cost of generating electricity.3
FINANCING THE ENERGY INDUSTRIES
The oil, coal, natural gas and uranium industries also require capitalto expand their production of fuel materials to meet the needs of theelectricity industry. While this report has not explored the capitalrequirements of the fuel industries, it seems evident that companiesin this part of the energy business will have to compete with theelectricity industry for probably scarce capital funds in the 1970's.
X Ibid., p. 24.2 Ibid., p. 26.3 "1970 Construction Spending To Rise 19 Percent," Electrical World, Feb. 2, 1970, p. 46.
TRENDS IN THE ELECTRICITY INDUSTRY
Both the availability of electricity and its environmental effectsare intertwined with prospects for its future growth. At present mostexperts are predicting a continuation of the historical rate of growthof the industry during the last 30 years of this century. How emergingeconomic, technical and environmental developments will affect thevalidity of these projections is far from clear.
PROSPECTS FOR GROWTH-1964
The National Power Survey's projection in 1964 visualized an in-creasing dependence upon electricity as a source of energy in Americanlife. It also endorsed the philsophy of maximum growth for the elec-tricity industry, to be encouraged by reductions in rates and improve-ments in service:
One of the most encouraging aspects of the National Power Survey is the evi-dence it provides of a commitment by a growing number of power systems inthe industry, to a farsighted philosophy of maximum growth encouraged byreductions in rates and steady improvement in service.'
The survey projected generation of an estimated 2.8 trillion kilo-watt-hours of electricity by 1980, or slightly more than three timesthat for 1960. The projected increase from 1964 to 1980 was put at200 percent, in comparison with the estimated rise of about 40 percentin the Nation's population during these 16 years and an increase ofperhaps 95 percent in our gross national product.
Implicit in this growth projection is a rise in the per capita use ofelectricity from about 5,400 kilowatt-hours in 1963 to 10,600 kilowatt-hours in 1980. In comparison with GNP, the increase would be 1.7kilowatt-hours of electricity per dollar of GNP in 1964 to 2.6 kilowatt-hours in 1980. This projected increase implies more rapid growth thanwould result solely from population or income growth. The projectionassumes a continuation of the marked intensification in the Nation'suse of electricity.
CURRENT PROJECTIONS OF ELECTRIC POWER REQUIREMENTS
The Federal Power Commission clearly expects the historical annualgrowth rate of 7 percent for electric power consumption-with itsdoubling time of 10 years-to continue through the 1990's. On thisbasis, electric energy requirements are expected to increase almostfourfold within the next 20 years from 1.52 trillion kilowatt-hours in1970 to 5.83 trillion in 1990, an increase of 284 percent.2 During thisperiod, the total peak demand is expected to increase from 277million kilowatts in 1970 to 1,051 million kilowatts in 1990, an in-crease of 279 percent. By the year 2,000, it is roughly estimated thatthe Nation's electric energy requirements will reach 10 trillion kilo-watt-hours.
lNational Power Survey, p. 35.'For the 25-year period 1965-D, the Increase would be from approximately 1 trillion to 5.8 trillion, an
Increase of 450 percent In a quarter of a century.
(81)

82
These projections are based on historic growth rates and growthprojections made by electric utility systems and by the staff of theFederal Power Commission. According to the FPC, loads are pro-jected for each of the 48 power supply areas of the contiguous UnitedStates taking into consideration such factors as area populationgrowth, anticipated area economic development, trends in familyformations, average energy consumption per customer, disposablefamily income, and innovations in domestic and commercial uses ofelectricity.
While much of the basic growth in electric loads will be associatedwith increases in population I and general economic expansion, FPCexpects such trends will be accentuated by the continual upgrading ofelectric use by individual customers and by the redevelopment oflarge segments of metropolitan centers. Modern construction inherentlyuses more electricity. It is difficult to project how new applicationsmay affect future loads, but future innovations and improvementsmay include such possibilities as large increases in night lighting ofstreets, highways, and outdoor recreational facilities, electrification ofrailways, expansion at urban rapid transit systems, and use of electricindustrial vehicles, fleet vans and incity passenger vehicles.
Factors that could accelerate the requirements for electricity suchas a large-scale use of electric vehicles, or that might decelerate thegrowth, such as increased costs of generation, shortages of fuel orplant, and public reaction to adverse environmental effects apparentlyare not taken into account.
CURRENT FORECASTS OF GENERATING CAPACITY
In order to meet the estimated 1,050 million kilowatts of powerdemand in 1990, the electric utility industry will need to install nearly1 million megawatts of new capacity between 1970 and 1990. Tenta-tive projections of the staff indicate that about 40 percent of all powerinstalled in 1990 will be nuclear power, about 45 percent will be fromsteam generating plants fired with fossil fuel, 7 percent will come fromconventional hydroelectric installations and about 5 percent frompumped storage hydroelectric projects. The remaining 3 percent willbe supplied by gas turbines and internal combustion engines, prin-cipally the former.
By comparison, for the year 1970, 76 percent of the electricity willcome from fossil-fuel, 15 percent from water, 5 percent from gasturbines and internal combustion engines, 3 percent from nuclearand 1 percent from pumped storage.
For the near future, scheduled new additions of electrical generatingcapacity through 1973, based on scheduled dates of commercialoperation as of July 1, 1968, totaled 136.4 million kilowatts, an in-crease of 50 percent in 5%2 years. This increase includes 123.8 millionkilowatts in steam-electric plants with 45.7 million of this in nuclearpowerplants. By 1972, the annual scheduled additions of nuclearcapacity is expected to exceed additions of fossil-fueled capacity. 2
I Increased population, however, would account for only 20 percent of the increased power consumption,Science, JSan. 9,1970, p. 169.
' Testimony of Carl E. Bagge, Federal Power Commission in "Environmental Effects of ProducingElectric Power," hearings before the Joint Committee on Atomic Energy, 91st Cong., 1st sems., 1969, pp.458--459.

83
The projected growth of the electric utility industry during thesenext two decades may entail the construction of about 40 new hydro-electric installations of 100 megawatts or more, approximately 50 newpumped storage hydroelectric installations of 300 megawatts or moreand about 90 fossil and 165 nuclear steam-electric plants.
To illustrate what these projections mean for one part of the country,the Northeast Regional Advisory Committee to the FPC estimated thegenerating capacity needs for 11 Northeastern States.'
Between now and 1990, the power industry in these States mustbuild about four times as much electrical generating capacity as theindustry has provided thus far in its 80-year history. ased on currentpractice, this undertaking will require an investment of about $50billion for generation, transmission and distribution facilities.2
Table 38 summarizes the projected electric power requirements andprojected forms of power development for the period 1970 to 1990 andincludes, for reference, the load-supply situation that existed in 1965.
TABLE 38.-ELECTRIC UTILITY REQUIREMENTS AND SUPPLY,I 1965-90
[in millions of kilowatts]
1965 1968 1970 1980 1990
Energy requirement (trillion kilowatts) -1. 06 -1. 52 3.07 5. 83Peak demand -188 - - 277 b54 1, 051Total installed capacity 2 236.1 277.4 344.0 668 1,261Hydroelectric capacity -41. 7- 51.4 68 83Pumped storage capacity -1.3 -3.6 24 65Internal combustion and gas turbine capacity 4.9 -16. 2 27 42Fossil steam capaicty -187.5 -261.2 .399 562Nuclear capacity -. 7 -11.6 3150 - 509Capacity dependent on cooling water -188.2 -272.8 549 1,071
I Excludes Alaska and Hawaii.X Does not add up due to rounding.a The Atomic Energy Commission projection ranges from 120 to 170,000,000 kilowatts.
PRICE AND COST OF ELECTRICITY
A principal cause of the extraordinary growth in use of electricalenergy has been a long term downward trend in price. Whether thisprice trend will continue, however, seems doubtful.
The Federal Power Commission in 1964 proposed a price target ofapproximately 1.2 cents, or 12 mills, per kilowatt-hour by the year 1980as the combined average retail price for all residential, commercial, andindustrial sales of electricity. Comparable figures were 1.5 cents perkilowatt hour in 1968, 1.7 cents in 1962, and 2.2 cents in 1940.3 If sucha target is reached, the FPC estimated the annual savings to rate-payers at $11 billion per year in 1980. The total electric bill in 1962 was$14 billion; FPF estimated it at $30 billion for 1980, taking intoaccount the $11 billion savings mentioned above. The total annualrevenue of the electricity industry exceeded $20 billion in 1969 and isexpected to do so again in 1970.
Most of the saving would be achieved through a continuing cycle oflower unit costs of producing and transmitting electricity broughtabout by larger, more efficient facilities whose low cost electricitywould encourage still greater use, thereby creating a cycle of con-tinuously interacting cause and effect.I Vermont, New Hampshire, Connecticut, Rhode Island, Massachusetts, Delaware, New Jersey, New
York, Pennsylvania, Maine, and Maryland.'Testimony of John N. Nassikas in "Environmental Effects of Producing Electric Power," op. CIt., p.35.5 National Power Survey, pt. 1, p. 6.

84
Regional variations in the price of electricity for 1962 and projectedto 1980 appear in table 39. They range from 8.7 mills per kilowatt-hourfor the Northwest to 21.8 mills for the North Central Region in 1962.
Against this background of a historical downward trend in the costsand prices for electricity, the FPC emphasizes that the phenomenalgrowth in the use of this energy form in the United States is due largelyto technological progress that has made electricity one of the bestbargains available. The long-term trend of electric rates has beendownward even in the face of inflation. To achieve this price goal of12 mills per kilowatt-hour in 1980, the FPC urged more planningtogether by the power systems for cost reduction. In particular jointventures are needed to benefit from the economies of scale of verylarge powerplants.
* * * The economies of scale in large generating units coupled with low costenergy transportation suggests that individual power systems should join togetherin constructing new capacity either through joint projects or by staggering theirconstruction programs.'
TABLE 39.-PRICE OF ELECTRICITY BY REGION,
[Cents per kilowatt-hourl
PercentageRegion 1962 actual 1980 projected reduction
1. Northeast -2.16 1.51 3011. EastCentral -------------------------- 1.42 1.19 16
111. Southeast -1.33 1.00 25IV. North Central- 2.18 1.27 42V. South Central- 1.84 1.16 37
VI: West Central ------ 2.15 1.48 31VIl. Northwest3 - -- ------------------------------------ .87 .86 1
VIII. Southwest -- ---------------------------- 1.73 1.44 17
U.S. average - 1.68 1.23 27
' Average price per kilowatt-hour sold to ultimate consumers.2Excludes Alaska and Hawaii.Source: National Power Survey, pt. 1, p. 283.
THE IMPORTANCE OF LOW COST ELECTRICITY
From 1926 to 1968 as the price of electricity declined from an aver-age of 2.71 cents per kilowatt-hour to 1.55 cents, the Consumer PriceIndex doubled. In terms of constant dollars, the price of electricity in1968 was less than one-third that of 1926. During this period, theper capital consumption of electricity in the United States increasedabout eight times, and the total revenue of the electric power industryabout ninefold.
The abundance of electricity and its increasingly lower price havebecome important to American economic well-being. Customer usagehas increased more rapidly than declines in unit cost. Accordingly, theelectric bill has become an increasing element of the family budget,especially in low income urban areas. The cost of electricity is often akey factor in the planning of industries which are large consumers of
'Ibid., p.3.

85
electric energy. The use of electricity in metallurgical and chemicalprocessing has continually expanded. Overall, the economic welfareof the Nation is becoming more sensitive to changes in the cost ofelectricity than would have been true 20 or 30 years ago. Some ob-servers think it is doubtful that any marked increases in the cost ofelectricity could occur without seriously affecting the growth inelectric energy use and, secondarily, adversely affecting the nationaleconomy.
COMPONENT COSTS OF ELECTRICITY
The price paid for electricity ultimately must depend upon the costof generating, transmitting, and distributing this energy commodity.The relative cost of generation, transmission, and distribution basedon a composite national average in 1962 for all segments of the industryis shown in table 40. These must not be considered as typical of mostutilities for there are likely to be substantial deviations because of theindividual differences among systems. For example, transmission costsare less than 4 percent of the total in New York City, but almost 20percent in the low population areas of northern Minnesota.
Table 41 gives the actual components of power costs for the year1962 and projections for 1980 and shows the reductions that FPC ex-pected in 1964 would bring the 1980 rate down to 12 mills per kilowatt-hour. The dominant factor in these reductions, it should be em-phasized, is the assumed continuing increase in per capita use ofelectricity with an accompanying increase in efficiency in generation,transmission and distribution. Table 42 presents in more detail thesupporting elements which were summarized in table 40. Note thatalthough total 1980 productions costs were expected by the FPC tobe 2.3 times those of 1962, the sales are expected to increase 3.1times-from 780 billion kilowatt-hours in 1962 to 2,433 billion in1980. Consequently, average production cost per kilowatt-hour woulddecline from 8.5 to 6.3 mills per kilowatt-hour. Half of this savingwould be in fixed charges on investment in generating equipment; 32percent for lower fuel prices and the remaining 18 percent in operationand maintenance. These savings, the FPC expects, will result fromcoordinated planning, reduction in unused reserve capacity, use oflarger and more efficient generating units, lower fuel prices, lowercosts for large bulk movements of- fuel and the introduction of nuclearpower.
TABLE 40.-TOTAL DELIVERED COST OF POWER-1962
[Composition in percent]
Fixed Operatingcharges expenses Total cost
Generation - 28.2 22.8 51.0Transmission -7.9 2.0 9. 9Distribution -22.8 16.3 39.1
Total -58.9 41.1 100. 0
Source: National PowerSurvey, pt. 1, p. 26.
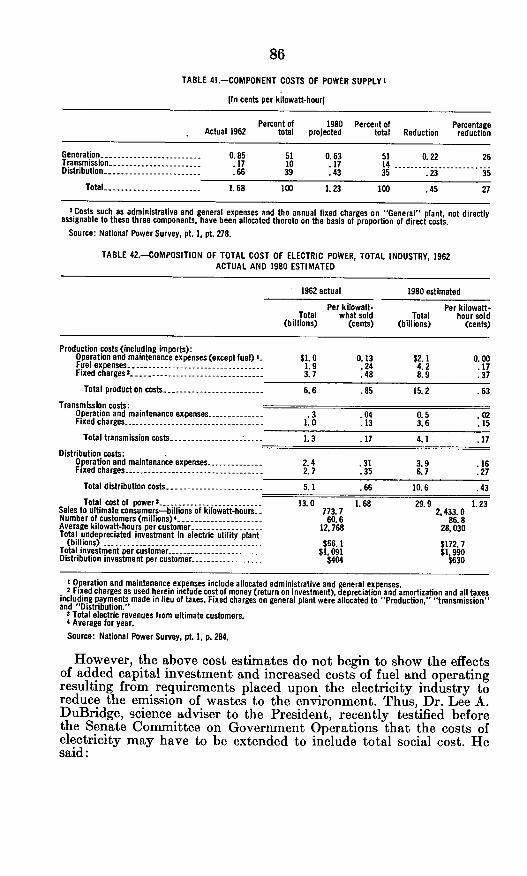
86
TABLE 41.-COMPONENT COSTS OF POWER SUPPLY'
[In cents per kilowatt-hourl
Percent of 1980 Percent of PercentageActual 1962 total projected total Reduction reduction
Generation-0.85 51 0.63 51 0. 22 26Transmission----- ----- .17 10 .17 140- - ----- ------Distribution -. 66 39 . 43 35 . 23 35
Total- 1. 68 100 1. 23 100 .45 27
X Costs such as administrative and general expenses and the annual fixed charges on "General" plant, not directlyassignable to these three components, have been allocated thereto on the basis of proportion of direct costs.
Source: National Power Survey, pt. 1, pt 278.
TABLE 42.-COMPOSITION OF TOTAL COST OF ELECTRIC POWER, TOTAL INDUSTRY, 1962ACTUAL AND 1980 ESTIMATED
1962 actual 1980 estimated
Per kilowatt- Per kilowatt-Total what sold Total hour sold
(billions) (cents) (billions) (cents)
Production costs (including imports):Operation and maintenance expenses (except fuel) X $1. 0 0.13 52.1 0. 00Fuel expenses 1.9 .24 4.2 .17Fixed charges 2 -
------------- -3,-7 .-48 8.9 .-37
Total product on costs -6.6 .85 15.2 .63
Transmission costs:Operation and maintenance expenses - 3 .04 0.5 . 02Fixed charges -1. 0 .13 3.6 .15
Total transmission costs -1.3 .17 4.1 .17
Distribution costs:Operation and maintenance expenses -2.4 .31 3.9 .16Fixed charges -2.7 .35 6.7 .27
Total distribution costs -5.1 .66 10.6 .43
Total cost of power 3-. 13.0 1.68 29.9 1.23
Sales to ultimate consumers-billions of kilowatt-hours. 773.7 2,433. 0Number of customers (millions)' -60.6 86.8Average kilowatt-hours per customer -12, 768 28, 030Total undepreciated investment in electric utility plant
(billions)-566.1 5172.7Totalinvestment per customer - ----- ------- $1 091 $1,990Distribution investment per customer -404 5630
l Operation and maintenance expenses include allocated administrative and general expenses.2 Fixed charges as used herein include cost of money (return on investment), depreciation and amortization and all taxes
including payments made in lieu of taxes. Fixed charges on general plant were allocated to "Production," "transmission"and "Distribution."
3 Total electric revenues from ultimate customers.4 Average for year.Source: National Power Survey, pt. 1, p. 284.
However, the above cost estimates do not begin to show the effectsof added capital investment and increased costs of fuel and operatingresulting from requirements placed upon the electricity industry toreduce the emission of wastes to the environment. Thus, Dr. Lee A.DuBridge, science adviser to the President, recently testified beforethe Senate Committee on Government Operations that the costs ofelectricity may have to be extended to include total social cost. Hesaid:

87
It may be that energy consumption is growing so fast in part because the pricedoes not include the full cost to society of producing and delivering it. I believethat efficient power production is just as important as ever to our economic growth,but we delude ourselves and perhaps short-change future generations when theprice of electricity does not include the cost of the damaging impact its productionimposes on the air, water, and land. If the total social cost of electricity or otherproducts are included in its price, consumers will have the inherent ability toconsider the effect of their decisions on the environment.'
A PESSIMISTIC RECENT ESTIMATE
There is some pessimism, too, that costs and prices for electricityhave reached their low point and will begin to climb. Recently thepower engineer Philip Sporn estimated the costs of generation-whichare an appreciable part of the total cost of electricity-for approxi-mately comparable nuclear and coal steam-electric plants scheduledfor completion in the mid-1970's. These computations are the basisfor his pessimistic forecast that nuclear power is retrogressing in itscompetitiveness with fossil fuels, and that for the immediate futurenuclear power can only compete with coal that costs 28 cents permillion l.t.u. or more. Table 43 gives the details and shows nuclearpower ranging from 6.17 mills to 7.06 mills per kilowatt-hour.
In Sporn's opinion, for many uses in our society, 7-mill electricenergy will be too expensive:
Seven-mill nuclear power at the switchboard at 75 percent capacity factor issimply not good enough to heat water, to reduce alumina to aluminum, to smeltferroalloys, to desalt sea water, and to convert to electricity the many otherenergy operations our society needs to have done so as to eliminate environmentalpollution.
Inevitably, these higher costs bring about the unavoidable reaction in theform of higher rates. Higher rates are antidynamic and growth hindering; theyretard the conversion of our energy uses into the electric form.
TABLE 43.-COST OF ELECTRICITY FOR NUCLEAR PLANTS IN 1976 VERSUS COAL PLANTS IN 1975
Nuclear' Coal I Nuclear3 Coal2
Fixed charges per year -$28. 50 $23.88 $32. 56 $27. 30Fixed charges, mills per kilowatt hour -4.07 3.41 4.95 4.16Fuel charges, mills per kilowatt hour- 1.70 3 2.19 1.70 3 2.19Operating and maintenance mills per kilowatt hour .30 .30 .30 .30Insurance, mills per kilowatt hour -. 10 -. 11-
Total switchboard cost, mills per kilowatt hour 6.17 5.90 7.06 6.65Nuclear competitive with fuel cost of 4 -5 28.1 -a 29.7
I At 14 percent, 7,000 hours per year.2 At 16 percent, 6,570 hours per year.'At 25 cents per million B.t.u.4 At 8,750 hours per year.'Cents per million B.tu.
Note: Capital cost, 1,100 MW Nuclear, $203.5 per kW.; 800 MW Coal, 170.6 per kW.
TECHNOLOGICAL TRENDS IN THE ELECTRICITY INDUSTRY
Several technological trends in the electricity industry may wellaffect its future organization and operations and also its economic andenvironmental impacts. Three such trends are the increase in size ofelectric powerplants and generating units, the expectation that nuclearpowerplants will supply much of the electricity by the year 1990, and
' Testimony before the Subcommittee on Intergovernmental Relations, Senate Committee on Govern-ment Operations, Feb. 3,1970, p. 10.
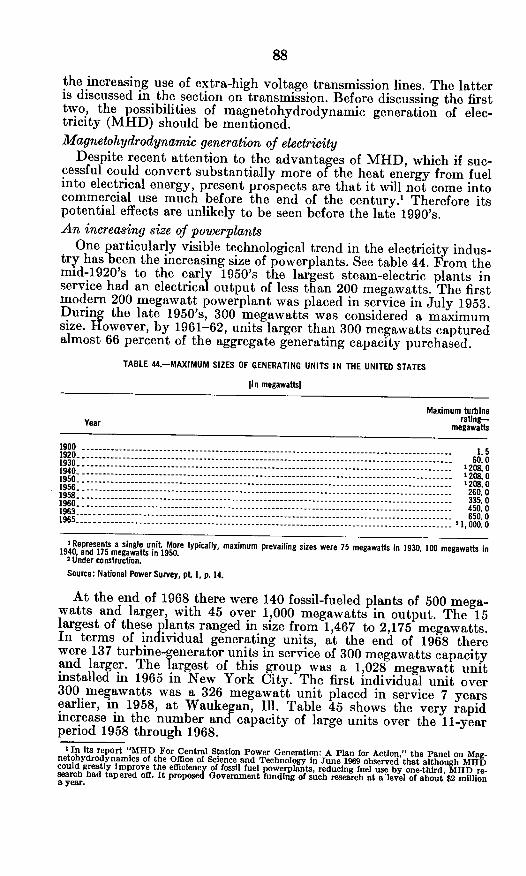
88
the increasing use of extra-high voltage transmission lines. The latteris discussed in the section on transmission. Before discussing the firsttwo, the possibilities of magnetohydrodynamic generation of elec-tricity (MHD) should be mentioned.Magnetohydrodynamic generation of electricity
Despite recent attention to the advantages of MHD, which if suc-cessful could convert substantially more of the heat energy from fuelinto electrical energy, present prospects are that it will not come intocommercial use much before the end of the century.1 Therefore itspotential effects are unlikely to be seen before the late 1990's.An increasing size of powerplants
One particularly visible technological trend in the electricity indus-try has been the increasing size of powerplants. See table 44. From themid-1920's to the early 1950's the largest steam-electric plants inservice had an electrical output of less than 200 megawatts. The firstmodern 200 megawatt powerplant was placed in service in July 1953.During the late 1950's, 300 megawatts was considered a maximumsize. However, by 1961-62, units larger than 300 megawatts capturedalmost 66 percent of the aggregate generating capacity purchased.
TABLE 44.-MAXIMUM SIZES OF GENERATING UNITS IN THE UNITED STATES
Iln megawattsl
Maximum turbinerating-Year megawatts
1900 0--------------- 1.51920 -- 60. 01940-' . 208.01950 -'----------------------------------------------208.01950-------------0---- --------- 8------------------------------------- ------------ ----- 8- 1208.01958 ---------- --------- -------- --------- ---------------------------------------------------- 260. 01960 ------------------------ 335. 01963 ------------------------- 450. 0
X Represents a single unit More typically, maximum prevailing sizes were 75 megawatts in 1930, 100 megawatts in1940, and 175 megawatts in 1950.2 Under construction.Source: National Power Survey, pt 1, p. 14.
At the end of 1968 there were 140 fossil-fueled plants of 500 mega-watts and larger, with 45 over 1,000 megawatts in output. The 15largest of these plants ranged in size from 1,467 to 2,175 megawatts.In terms of individual generating units, at the end of 1968 therewere 137 turbine-generator units in service of 300 megawatts capacityand larger. The largest of this group was a 1,028 megawatt unitinstalled in 1965 in New York City. The first individual unit over300 megawatts was a 326 megawatt unit placed in service 7 yearsearlier, in 1958, at Waukegan, Ill. Table 45 shows the very rapidincrease in the number and capacity of large units over the 11-yearperiod 1958 through 1968.
X In its report "MHD For Central Station Power Generation: A Plan for Action," the Panel on Mag-netohydrodynamics of the Office of Science and Technology in June 1969 observed that although MHDcould greatly Improve the efficiency of fossil fuel powerplants, reducing fuel use by one-third, MHD re-search had tapered off. It proposed Government funding of such research at a level of about $2 milliona year.

89
TABLE 45.-NUMBER AND SIZE OF LARGE POWERPLANTS PUT INTO OPERATION, 1958-68
300 megawatts and larger
Number units Average unitplaced in Total size-
Year service megawatts megawatts
1958 -- ----- 3 1, 060 3531959 -------------------------------------------- ----- 5 1,800 3601960 -.------..---- .....---- 8 2, 525 3171961 - 9 3,180 3531962 -.----.--.------------..----.. 7 2, 525 3611963 -..--------....--.----.-- 10 4, 500 4501964 -.--.------....-- 10 3, 625 3621965 - .--.------- .---- 17 7,740 4551966 -'-----------------------------------20 8,424 4211967- - ...---- ...........-------------.. 26 13,245 5091968 -.--.--------------------- -22 12,274 558
Total - 137 60,898 445
l 7 of these units were actually installed in prior years and were rerated in 1966.Source: "Steam-Electric Plant Construction Cost and Annual Production Expenses, 21st annual supplement, 1968."
Federal Power Commission report FPC S-199, 1969, p. x.
flow large powerplants will become is an open question. Six yearsago, in 1964, the National Power Survey forecast that the unit sizefor average use in large powerplants pooled systems would be asfollows:
TABLE 46.-FORECAST OF POWERPLANT SIZES
Typical unit size Maximum unitDate megawatts size megawatts
1970 -...------------..--------. 500 to 600 ---------- 1, 0001975 -.--.------.--...--.--.--......--. 600 to 750 -1 2501980 - 750 to 1,000 . 1,500
From the standpoint of 1964, the survey saw little economic incen-tives for individual units above 600 megawatts in size. It identifiedthree factors not previously dominant, that could slow the increase inunit size, and factors that may limit the size to multiunit powerplants.As to unit sizes, these factors are:
(1) Decreasing thermal attractiveness of larger units.(2) Somewhat decreased economic attractiveness of larger units(3) The presently indicated lower availability of larger units
existing in 1964.This last factor, according to the FPC, points to the need for im-
proved design in very large plants.As for factors limiting plant size, the principal limitations appeared
to the FPC to be:(1) The diffusion of stack gases into the atmosphere, and(2) Limitations on permissible rise in the temperature of rivers
and other bodies of water that receive waste heat from power-plants.'
The technological trend toward fewer but larger units has implica-tion for the future organization of the electricity industry and the con-centration of economic power and influence within it. Because thesehuge powerplants produce more electricity than most individualpower systems can accommodate and because of the large capital in-
l National Power Survey, pt. 11, p. 57.
46-366 O-70-7

90
vestment required to build them, joint ventures of various kinds arebeing organized. This is particularly the case for nuclear power whereseparate corporations jointly owned by participating utilities are usedto limit the liability of the parent companies should an accident occurwith the nuclear plant causing liabilities for damage and injuriesexceeding the coverage of commercial liability insurance and Govern-ment indemnification under the Price-Anderson modification to theAtomic Energy Act.
As the size of individual generating units has increased, so has thetendency to place several units at one site. Thus the Office of Scienceand Technology expects that most of the new generating capacity inthe next 20 years will come from some 250 huge powerplants of 2,000to 3,000 megawatts output each. In comparison, there are some 3,000powerplants in existence today. A powerplant of 3,000 megawatts willproduce enough electricity for a city of 1 million people. In principlethese mammoth powerplants not only will produce lower cost powerthan their smaller and less efficient predecessors, but they will alsoproduce less pollution per kilowatt-hour. However, because so muchpower is generated at one place, the total volume of wastes dischargedat one point will be quite large and if uncontrolled could overwhelmthe surrounding environment.The trend toward nuclear power
The forecasts of the Federal Power Commission that nuclear power willprovide 40 percent of all utility generated electricity by the year 1990and as much as 60 percent by the year 2000 depends upon commercialdemonstration, acceptance and application of the breeding reactor.Nuclear powerplants being built now and those into the 1980's willnot possess the technical ability to convert certain kinds of uraniumand thorium into useful nuclear fuel as a byproduct of power genera-tion, and thus at best can use only a few percent of the energy availablein uranium and thorium ore deposits.
If the breeding reactors are to come into use during the later 1980's,utilities will have to order them at least 6 years earlier, in the early1980's. It seems reasonable to expect the utilities to want severalyears actual experience with prototype breeder nuclear power reactorsbefore deciding to buy breeder reactors, which means any prototypeswould have to come into service in the late 1970's. Assuming onceagain a 6-year period to design, build and bring a prototype breederinto operation, the commitments to do so must be made in the early1970's. Whether the utilities are or will be ready to make such atechnical financial commitment within the next few years remains tobe seen.
As for the current state of commercial nuclear power, the year 1968marked the beginning of the second decade in the operation of nuclearreactor steam-electric generating units. It also marked the first fullyear of operating experience of two of the larger, commercial type,light-water reactor installations, the 600-megawatt ConnecticutYankee plant and the 450-megawatt San Onofre plant in southernCalifornia. Both plants began commercial operation on January 1,1968. They were designed and built under the so-called modifiedthird round of the Atomic Energy Commission's power demonstra-tion program. Both installations were subsidized by the AEC on the

91
research and development phases prior to construction. Likewise,both plants have a 5-year waiver from AEC on their fuel use charges.
The FPC lists 80 nuclear-powered units in 58 plants totaling ap-proximately 66,000 megawatts that are either (1) in preliminary ortest operation, (2) under actual construction, or (3) on order for com-mercial operation during the 9-year period, 1969 through 1977. These80 units, varying in size from 450 to 1,175 megawatts, constitute theso-called second and third generations of power reactors. Three ofthese units were ordered during the first 8 months of 1969 and 17 in1968. The other 60 units were ordered during the period 1963 through1967. Test operation of the Oyster Creek plant, the first of the 500-megawatt class to be completed, was begun in the summer of 1969after many delays. This plant at Jersey Central Power & Light Co.and several others are expected to begin commercial operation during1970.'
' "Steam-Electric Plant Construction Cost and Annual Production Expenses," op. cit., p. rlil.

ENVIRONMENTAL EFFECTS OF GENERATING ELECTRICITY AND THEIRECONOMIC IMPLICATIONS
The generation of electric power inevitably must affect the environ-ment. Wastes are generated and they must go to some place. Whetherthe effects of the wastes are beneficial, tolerable, undesirable ordangerous are value judgments determined by society.
In achieving a balance of interest between the users of electricityon the one hand and the users of the environment on the other, thereis reason to avoid the two extreme positions that hold:
The environment should not be available to wastes from gen-eration electricity, or
Powerplants may be constructed and operated without regardto their environmental effects.
In this section, the principal wastes of the electricity industry areidentified, their effects briefly described, current regulation of suchwastes summarized, and present technology for control is described.Cost information is also mentioned.
This section draws heavily upon the report of the Energy StudyGroup of the Office of Science and Technology on the siting of steam-electric powerplants and upon recent hearings of the Joint Committeeon Atomic Energy and the Senate Committee on GovernmentOperations.
CONVERSION OF HEAT ENERGY INTO ELECTRICITY
In a steam-electric powerplant, the heat energy released by burningfuel or fissioning nuclear materials heats water which turns to steam.The steam expands through a turbine, then flows to a condenser whereit is condensed back into water which is returned to the boiler or thereactor to start the cycle again. The turbine turns a generator whichproduces the electricity. Ideally for every 3,413 British thermal unitsof heat energy released from the fuel, 1 kilowatt hour of electricityshould be sent out from the plant.' However, present energy con-version technology is far from ideal. Depending upon its age, a steam-plant may require from 19,000 to somewhat less than 9,000 B.t.u.'sof heat energy to generate 1 kilowatt-hour of electricity. The bestheat rates 2 for 1968 ranged from 8,654 to 8,876 B.t.u.'s kilowatt-hourfor the most efficient units in the country.3 New thermal efficiency ofpowerplants, or efficiency, as we will call it, is the quotient of the plantelectrical output, expressed in B.t.u., divided by the heat input inB.t.u. For technical reasons the best efficiency attainable with presentsteam powerplant technology is 40 percent. At this efficiency, 8,533B.t.u.'s heat energy must be supplied for each kilowatt hour of elec-tricity sent out. Present nuclear powerplants are less efficient. Thosebeing built today are unlikely to have an efficiency better than 33percent, meaning that 10,342 B.t.u.'s must be supplied for every
I I B.t.u. of heat energy will raise the temperature of 1 pound of water 1° Fahrenheit.2 The heat rate is the number of B.t.u. needed per kilowatt hour.3 Electrical World, Nov. 10, 1969, p. 26.
(92)
93
kilowatt-hour. The heat rates for the Vermont Yankee nuclearpowerplant in New England, for example, is 10,560 B.t.u.'s perkilowatt-hour.
The amount of heat required by a steam-electric plant to generate akilowatt-hour of electricity depends very much upon the temperature,pressure, and moisture content of the steam, which in turn dependsupon the ability of materials to retain their strength in fireboxes andboilers when exposed to very high temperatures and to corrosive hotcombustion gases. The higher the temperature and pressure of thesteam and the less its moisture, the more heat energy is carried to theturbine by each pound of steam and the greater is the plant efficiency.The relative thermal inefficiency of nuclear powerplants derives fromthe lower temperature, pressure, and higher moisture of their steam.The technical reasons for these conditions are unlikely to be resolvedwith the type of nuclear powerplants now being sold to the utilities.More efficient nuclear plants are expected, but they are unlikely tocome into operation until the mid or later 1980's.
The prospects of marked further improvements in powerplant thermalefficiency will have to await the outcome of current technical effortsto develop new energy conversion processes such as magnetohydro-dynamics, electrogasdynamics and thermionic processes.
WASTES FROM STEAM-ELECTRIC GENERATING PLANTS
Electric powerplants that use the fossil fuels-coal, oil or gas, ornuclear fuels, all produce excess heat energy. Presently this heat isregarded as a waste to be disposed of to the environment. Fossil-fuelplants also produce solid and gaseous wastes that in certain quantitiesand concentrations are regarded as air pollutants. Nuclear plants donot omit wastes from combustion, but do produce some radioactivewastes that are routinely discharged into the air or water and maybe regarded as pollutants if the releases exceed regulatory limits. Thevalidity of limits set for emission of waste heat, some combustionwastes and radioactive wastes is being questioned by some scientistsat this time.
WASTE HEAT
The heat energy released by burning fuel or fissioning atoms thatdoes not leave a generating station as electricity must be dischargedto the environment. It cannot be stored or kept within the power-plant. The air and water, in essence, are used as a sink for the wasteheat. For a steam-electric powerplant operating \at an efficiency of40 percent, for each 100 B.t.u. released from the fuel, 60 B.t.u. mustbe thrown away; with an efficiency of 33 percent, for every 100 B.t.u.released, 67 must be disposed of. Thus from 60 to 67 percent of allthe fuel consumed in a central powerplant ultimately serves only toheat up the air and water in the vicinity of a powerplant. It brings noincome to the utility and may require capital investment and operat-ing costs to disperse it in ways acceptable to the Government.Removal of waste heat from a powerplant
For all steam-electric powerplants now built or contemplated,most or all of the excess heat which may either flow back into a riveror other parent body of water or circulate through equipment thattransfers the heat to the air is carried from the plant by water. For a

94
conventional fossil-fueled plant, about 85 percent of the waste heatgoes out in the cooling water with 15 percent going up the stack as hotflue gas. For a nuclear plant, virtually all of the waste heat, except forabout 5 percent emitted to the air from hot surfaces, is in the coolingwater. A modern fossil-fueled powerplant that requires 9,000 B.t.u. perkilowatt hour of electricity sent out would discharge 4,237 B.t.u. ofwaste heat for each kilowatt hour. A less efficient nuclear powerplantwith a heat rate of 10,342 B.t.u. per kilowatt hour would discharge6,400 B.t.u. of waste heat, almost half again as great, than for thefossil-fuel. This is the basis for the statement that a nuclear power-plant will discharge 50 percent more heat into the water than a con-ventional plant.
Many steam-electric plants use the once-through cooling system todissipate the waste heat. In such a system the cooling water is takenfrom a river, lake, reservoir, or the sea, and passed through thepowerplant whence it returns with an increased heat load and highertemperature. Once-through cooling is preferred at sites where there isan adequate supply of water and its use for cooling does not violateFederal or State water quality standards. This system has the ad-vantage of low cost, minimum consumption of water and minimumintrusion upon the environment. If water is scarce or if compliancewith water quality standards so requires, the waste heat from thecooling water can be transferred to the air by one or more processes.
The amount of cooling water required depends upon the heat rateof the plant and the permissible rise in water temperature. For anaverage fossil fueled plant with a heat rate of about 10,000 Btu perkilowatt-hour, and a temperature rise of 15 degrees Farenheit, therequired flow is approximately 1.5 cubic feet per second for eachmegawatt of electrical capacity. At full load, this is equivalent toabout 40 gallons per kilowatt-hour. A modern, more efficient plantwould require a flow of about 1.5 cubic feet per second per megawattfor a 15-degree rise, equivalent at full load to about 30 gallons perkilowatt-hour. For a nuclear plant, the flow would be about 2.0cubic feet per second per megawatt for a 15-degree rise. At full loadthis would come to about 55 gallons per kilowatt-hour.
In designing a power plant, the engineer seeks the most favorableeconomic balance between temperature rise in the cooling water,flow of the water, and size and cost of the equipment. With presenttechnology he can choose a temperature rise between 12 to 27 degreesFarenheit. Temperature rises of less than 12 or greater than 27 degreesare considered impracticable from an engineering standpoint. If, fortechnical or regulatory reasons, it is desirable to keep the temperatureof the cooling water below certain limits as it returns to its parentsupply, unheated water can be mixed in to dilute the heat and lowerthe temperature.
HEAT AND WATER QUALITY
Discharging waste heat from steam electric plants into the water-ways does not directly affect the public health. There is no danger ofinjury to persons. On the other hand, the waste heat can markedlychange the quality of the water for further use and can drasticallyaffect the marine life in the water.
What the specific effects from waste heat are remains a controversialmatter. Some observers see only undesirable effects upon the quality

95
of the water and the plant and animal life it sustains. Others see bene-ficial effects from waste heat. Depending upon the part of the countryand the kinds of water life involved, effects of waste heat can rangefrom fish-kills on one hand to speeding lobster growth on the other.
What follows is intended to briefly summarize the less than desirableeffects of too much waste heat in a given body of water. It drawsheavily upon the report of the Energy Policy Staff of the Office ofScience and Technology.Effects upon water life
The most pronounced effects of waste heat in the waters appear tobe upon water life.
As a rule of thumb, the biochemical processes of aquatic life, in-cluding the critical rate of oxygen utilization, double for each 18degree Fahrenheit rise in temperatures up to 860 to 95°. However,as water temperatures rise, the water can hold less oxygen in solution.Thus the potential supply of oxygen in the water diminishes with highertemp)eratures as the need for oxygen increases.
UIp to a certain point, an increase in water temperature can causemore rapid development of eggs, faster growth of spat, fingerlings orjuvenile fish and larger fish. Beyond that point, the hatch will bereduced and mortalities in the development stages will be higher. Thetemperatures at which maximum development occurs at each stageof the life cycle varies with the species. Over a period of severalgenerations the composition of species in water bodies affected bywaste heat can be expected to change if the temperature is changed,even though the change be small.
Even where a temperature change is not directly damaging to thedevelopment of desirable species, an increase is usually found tostimulate the more rapid development of less desirable or undesirablespecies.
While fish are generally available in the discharge areas for wasteheat, sometimes in greater numbers than elsewhere, it is often foundthat an increase in temperature results in a loss of the more desirablespecies since they are unable to compete successfully for food, breedingareas or their lives. A warmer temperature is also considered to increasethe occurence of disease in fish populations.
A particular problem exists for migratory fish since changes inwater temperature are apparently important to some species as thestimulator of migratory activity. Changes in the normal times formigration triggered by heated water may put the fish at an environ-mental disadvantage later in their migratory cycle and adverselyaffect reproduction. Since the ability of cach species to acclimate tochanges in water temperature is different, each situation should beconsidered individually by fishery biologists.
On the other hand, techniques for forecasting ecological effects ofheated waters are not as well advanced as the ability to forecast thepatterns of heat dissipation in the receiving waters. We apparentlyknow more about how and where the heated effluents from a power-plant wvil flow than we do about their specific effects in a particularsituation.
96
Physical effectsAny increase in temperature of water because of waste heat will
result in increased evaporation and a consequent reduction of avail-able supply and an increase in the concentration of the mineralsalready present in the water, which do not leave with the evaporatingvapors. While not ordinarily a problem, if a stream of water flowsthrough a number of cooling cycles each with a loss from evaporation,a measurable increase in solids may result.
In northern climates, the discharge of heated water will tend to re-duce ice cover, at least locally, and thus improve water quality byseeping the surface open to absorb oxygen from the air. The addedTleat may also result in local fogging on the water and adjacent landtreas.
An increase in temperature may also make the waters more desirableior swimming and water sports if the normal temperatures are so coldas to limit use. If the water is already warm, however, further increasein temperature can reduce its recreational value.
The addition of waste heat to bodies of water may also reduce thevalue of the water for industrial cooling in those places where the localtemperature has been increased substantially.
REGULATION OF WASTE HEAT IN WATER
Although water quality standards had previously been adopted bysome States and interstate bodies, a major impetus to setting suchstandards was the Water Quality Act of 1965. That act encouraged theStates to establish water quality standards for interstate streams andcoastal waters by June 30, 1967. If the States failed to do so, the Sec-retary of the Interior was authorized to establish such standards. All50 States have developed water quality standards and have submittedthem to the Department of Interior for approval.Provisions of the Water Quality Act
The act requires that the standards be such as to protect the publichealth or welfare and to enhance the quality of water. In establishingthe standards, consideration is to be given to the use and value forpublic 'water supplies, propagation of fish and wildlife, recreation,agriculture, industry and other legitimate uses.
As interpreted by the Federal Water Pollution Control Adminis-tration of the Department of the Interior, the standards to be estab-lished include water use classifications, criteria to support these uses,and a plan to implement and enforce the criteria. The criteria includethe quality characteristics of a physical, chemical or biological naturedemanded by aquatic life, industrial process, or other intended uses.For streams expected to have more than one use, the criteria of themost sensitive use would govern in establishing standards. Thus, inmost cases, the criteria applicable to fish and other aquatic life wouldbe controlling.State thermal criteria for waste heat
Pursuant to the act, all States have submitted water quality stand-ards. The standards for all States and other jurisdictions have beenapproved by the Secretary of the Interior, although some approvalshave been with reservations. Many of the reservations relate totemperature criteria.
97
The temperature criteria is water quality standards are establishedon the basis of the proposed uses of the water. Generally, maximumpermissible temperature and maximum changes in temperature con-stitute the criteria. Some States have specified maximum rates ofchange in temperature. Several State standards provide for variedcriteria depending on the time of year. Some wa ters are so designatedas to allow no change from the natural conditions. In such cases, thelimitations are usually determined by the requirements of fisheries.
Most States have established 68 degrees Farenheit as the maximumallowable temperature and from 0 to 5 degrees as the maximumallowable change in temperature for streams with cold water fisheries.For warm water fisheries, the maximum allowable temperatures aregenerally in the range of 83 to 93 degrees and the maximum allowablerise in the range of 4 to 5 degrees.Turkey Point, a departure in Federal regulation
In Florida south of Miami, the Florida Power and Light Companyhas two large conventional steam-electric power plants and is buildingtwo large new nuclear power plants. The cooling waters from the newnuclear plants is to flow through a canal 6 miles long to mix with thewaters of Card Sound, an adjunct to BiscayneBay.The heated waterfromthe canal presumably will meet a Dade County temperature limit of95 degrees Ferenheit.
In February 1970, the Department of the Interior requested theJustice Department to take legal action to block construction of thecanal. It asserted that the canal system with the proposed 150 percentdilution of the cooling wvater would not meet the temperature limitsagreed upon by the State and Federal conferees at a meeting calledat the request of Governor Kirk of Florida. Out of this meeting camea recommendation of 90 degrees as maximum temperature for waterdischarged from the canal.
The utility has argued that waste heat must be discharged to theBay for other means of dissipating the heat are not feasible.
On March 13, 1970, the Justice Department filed suit in the U.S.District Court for the southern district of Florida to stop present andfuture thermal pollution of Biscayne Bay. Attorney General John N.Mitchell said the suit alleges that the heated water now being dis-charged from the present two powerplants is rapidly ruining marinelife in the Bay, including an area encompassed by the BiscayneNational Monument, and that the damage will be even greater whentwo planned nuclear powerplants are installed at the site.
The Government also filed a motion for a preliminary injunction.It asked that the powerplants be permitted to operate but to modifyits operations which result in thermal pollution. It also asks forsubmission to the court within 45 days of a plan to eliminate thedestruction of the natural environment by the powerplant operation;and a halt to construction to the canal.
BYPRODUCT USE OF WASTE HEAT
Ideally the excess heat energy from a steam electric powerplantshould be put to productive use in industry, agriculture, dwellings orother places where large amounts of low-grade heat may be useful. Todo so would reduce the waste heat discharged directly to the environ-
98
ment and save the additional fuel that otherwise would be consumedto supply such heat. Sale of byproduct waste heat might even becomea souce of income for the utilities. The chemical and petroleum indus-tries, for example, require large amounts of heat as does the desaltingof water. Proposals have been made to use heated waters from power-plants in agriculture and aquaculture. However the benefits, of suchapplications, their technical and economic feasibility remain to bedemonstrated.
The tendency towards building large powerplants outside of thecities and the impracticability of transporting low-grade heat for longdistances will require new innovations in business and industry tomake the use of waste heat as a byproduct an attractive alternativeto discharging it to the environment.
DISSIPATION OF WASTE HEAT TO THE ENVIRONMENT
As noted earlier, the simplest and least expensive, and the tradi-tional method for disposing of excess heat from a steam electricpowerplant is to pump water from a river or some other body of waterthrough the powerplant to pick up and carry away the waste heat.The heated waste water mixes with its parent and its burden of heatenergy ultimately is transferred to the air by evaporation, conduction,and radiation. Depending upon the amount of waste heat and thecharacteristics of the receiving waters, the water temperatures insome places may exceed limits set in water quality standards. In suchinstances, some or all of the waste heat from a powerplant may haveto be transferred directly to the air. For these, the cooling waterfrom the powerplant is circulated through a man-made cooling pondor lake, or thorugh cooling towers.Cooling ponds and lakes
The electricity industry makes wide use of cooling ponds in theSouthwest and Southern States where available water supplies maynot be wholly adequate to dissipate the waste heat. The extensiveland areas necessary for the ponds and their drainage areas are avail-able in these parts of the country at relatively low cost, and the lowhumidity in the Southwest promotes more effective transfer of wasteheat from-the pond to the air.
In many instances, cooling ponds and lakes may be quite large.Approximately-l acre of pond plus 10 acres of drainage area to supplywater for the pond is needed for each megawatt of generating capacity.Such ponds may be used for public benefits including water supply,flood control, recreation, and enhancement of fish and wildlife values.
Cooling ponds require a flow of water to replace that lost throughevaporation. The loss is equivalent to about 1.5 percent of the flowof cooling water from the powerplant.
Where land is available at low costs, cooling ponds may be theleast expensive alternative to direct discharge cooling. Capital costestimates for cooling ponds and associated dams and structuresrange from $2.50 to $5 per kilowatt of generating capacity, and insome conditions $6 to $10 per kilowatt.
99
Cooling towersWaste heat can be transferred to the air through two types of cooling
towers. In the evaporative type, the water to be cooled falls overexposed surfaces within the tower and gives up its heat by evaporation.In the dry type, the water is pumped through the giant equivalent ofan automobile radiator and gives up its heat by air convection.
Evaporative cooling towersThe performance of a cooling tower depends upon the movement
of air through the structure to carry away the evaporated water.In some cooling towers, mechanical fans draw air through the struc-ture, in others the flow of air depends upon natural air movements,or convection.
Environmental effects of evaporative cooling towers.-The mechanicalcooling towers discharge large amounts of water vapor near theground. Also droplets of water, or "windage" may be carried fromthe tower by air currents. Windage is troublesome because it maycontain chemicals that are added to prevent biological fouling of thecooling system, chemicals resulting from corrosion or structuraldeterioration, and minerals that have become concentrated within thesystem. In some weather conditions, mist, fog or ice may result fromthese cooling towers.
As an alternative to the mechanical cooling tower, the natural drafttower discharges its moisture considerably higher off the ground. Sucha tower for a large powerplant may rise as high as a 30-story buildingand measure more than a block in diameter. They are certainly adominant feature of a power station and may be visible for miles.Some people consider them esthetically undesirable in certain locations.'
The windage effects of cooling towers would be aggravated were seawater to be used as the cooling water. With solids present in theamount of 35,000 parts per million, the salt in the windage couldcause corrosion damage to adjacent structures and equipment and tonearby land.
Water requirements.-The water lost by evaporation within a coolingtower amounts to about 20 gallons per-kilowatt of generating capacityper day for an average steam electric plant, and about 13 gallonsfor one of high efficiency. A 1,000 megawatt nuclear powerplant,with its lower efficiency, would require about 20 million gallons ofmakeup water a day, in comparison with 14 million for a comparablefossil plant.2
Water pollution from cooling towers.-The evaporation of water ina cooling tower serves to build up a concentration of minerals presentin the source of cooling water, and also to concentrate chemicals andsolids from other sources. For technical reasons, the concentrationcannot be permitted to increase without limit. Therefore part of thecooling water is routinely drained off and replaced. This is known as"blow-down." The concentration of minerals and chemicals in theblow-down water may exceed water quality standards. This wastewater must either be processed to remove enough of the mineral andchemical contents to bring the effluent into compliance, or be dilutedenough for this purpose.
I Cooling tower applications and technology are reviewed In detail in the Federal Power Commissionreport "Problems in Disposal of Waste Heat From Steam-Electric Plants," published in 1969.
"'Cut pollution at what price?" Electrical World, Jan. 19, 1970, p. 32.
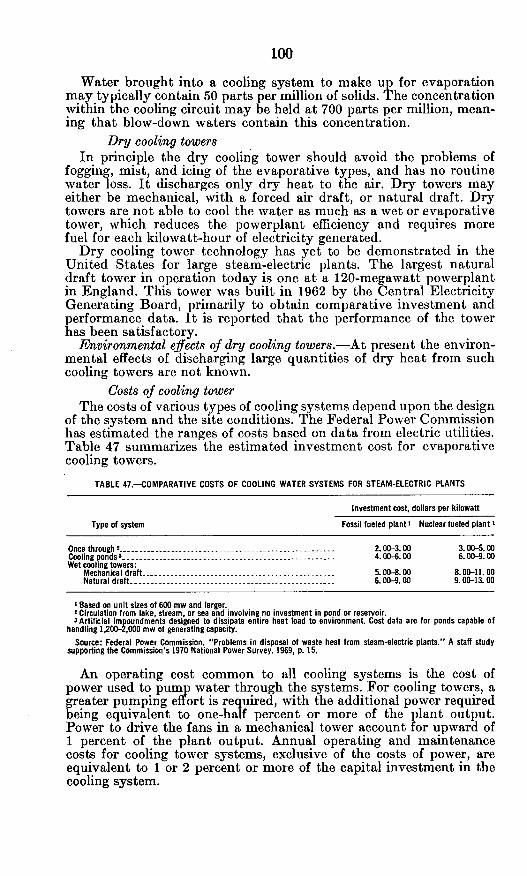
100
Water brought into a cooling system to make up for evaporationmay typically contain 50 parts per million of solids. The concentrationwithin the cooling circuit may be held at 700 parts per million, mean-ing that blow-down waters contain this concentration.
Dry cooling towersIn principle the dry cooling tower should avoid the problems of
fogging, mist, and icing of the evaporative types, and has no routinewater loss. It discharges only dry heat to the air. Dry towers mayeither be mechanical, with a forced air draft, or natural draft. Drytowers are not able to cool the water as much as a wet or evaporativetower, which reduces the powerplant efficiency and requires morefuel for each kilowatt-hour of electricity generated.
Dry cooling tower technology has yet to be demonstrated in theUnited States for large steam-electric plants. The largest naturaldraft tower in operation today is one at a 120-megawatt powerplantin England. This tower was built in 1962 by the Central ElectricityGenerating Board, primarily to obtain comparative investment andperformance data. It is reported that the performance of the towerhas been satisfactory.
Environmental effects of dry cooling towers.-At present the environ-mental effects of discharging large quantities of dry heat from suchcooling towers are not known.
Costs of cooling towerThe costs of various types of cooling systems depend upon the design
of the system and the site conditions. The Federal Power Commissionhas estimated the ranges of costs based on data from electric utilities.Table 47 summarizes the estimated investment cost for evaporativecooling towers.
TABLE 47.-COMPARATIVE COSTS OF COOLING WATER SYSTEMS FOR STEAM-ELECTRIC PLANTS
Investment cost, dollars per kilowatt
Type of system Fossil fueled plant I Nuclear fueled plant I
Once through 2 -2.00-3.00 3.00-5.00Cooling pondS -4.00-6.00 6.00-9.00Wet cooling towers:
Mechanical draft ----------------------- 5.00-8.00 8.00-11. 00Natural draft -6.00-9. 00 9. 00-13. 00
I Based on unit sizes of 600 mw and larger.2Circulation from lake, stream, or sea and involving no investment in pond or reservoir.Artificial impoundments designed to dissipate entire heat load to environment. Cost data are for ponds capable of
handling 1,200-2,000 mw of generating capacity.Source: Federal Power Commission. "Problems in disposal of waste heat from steam-electric plants." A staff study
supporting the Commission's 1970 National Power Survey. 1969, p. 15.
An operating cost common to all cooling systems is the cost ofpower used to pump water through the systems. For cooling towers, agreater pumping effort is required, with the additional power requiredbeing equivalent to one-half percent or more of the plant output.Power to drive the fans in a mechanical tower account for upward of1 percent of the plant output. Annual operating and maintenancecosts for cooling tower systems, exclusive of the costs of power, areequivalent to 1 or 2 percent or more of the capital investment in thecooling system.

101
According to Federal Power Commission estimates, the use ofevaporative cooling towers rather than the once-through coolingcould increase the cost of generating power as much as 5 percent.Also cooling towers ordinarily reduce turbine efficiency so that mostestimates indicate a 1-percent capacity penalty chargeable againstplants using wet cooling towers.
For a specific example, the cooling towers for the Monticellonuclear powerplant in Minnesota were recently reported to add $5million to the capital costs and $1.9 million annually to the operatingcost. At an 80-percent operating factor, the cooling towers thuswould add about one-tenth of a mill per kilowatt-hour to the estimatedgenerating cost of 7 mills per kilowatt-hour for the plant.'
Investment costs for dry-type cooling towers are largely conjecturalbecause of limited experience with them. The FPC thinks a pricerange of $25 to $28 per kilowatt for mechanical draft and $27 to $30per kilowatt for the natual draft appear to be reasonable. With thesecosts, dry-type cooling does not compare favorably with other typesof cooling at places where adequate water supplies are available.Also, the plant electrical output may be from 6 to 8 percent less thanit would be with on-through water cooling, which would increasethe cost of power.
In one recent estimate, cooling ponds would be expected to increasegenerating costs by perhaps 15 percent, and dry towers perhaps 30percent, with evaporate towers in between. In terms of billings to thepublic, installation of those heat dissipation methods could increasethe retail 2 rate from 5 to 10 percent.
While such an increase probably would be accepted by the public,industries that use large amounts of electricity at low rates wouldbe more seriously affected should the addition of such measures add1 to 2 mills per kilowatt-hour to a price of 5 to 10 mills. Such an in-crease could have a significant effect on the prices of products thatrequire large amounts of electricity to manufacture.Cooling water reguirements
A very practical question is how much water may be affected bywaste heat from large steam-electric plants?
The Federal Power Commission expects that 59 new fossil-fueledplants or additions to existing plants of 500 megawatts or more, com-prising 81 units and totaling 52,000 megawatts, will go into serviceduring the years 1967 to 1973. An additional 41 nuclear plants oradditions to existing plants comprising 57 units, totaling 42,000megawatts, also are scheduled to go into service in that period.
The combined cooling water discharges from these 138 units withalmost 100,000 megawatts of capacity will be a substantial additionto the waste heat discharged to the Nation's waters.
Looking ahead to 1990, the FPC estimates a total of 492 plantsiteswill be in use for large steam-electric installations. Of these, 255 will benew sites. Some 292 of the total number of sites would be for fossil-fueled plants and the remaining 200 for nuclear power. Most of thenew plants are expected to be in the 1,000- to 4,000-megawatt sizerange, with the largest site approaching 10,000 megawatts, The totalcapacity at the 492 sites by 1990 would be about 1 million megawatts.
I Nucleonics Week, Mar. 5,1970, pp. 4, 5.2"Cut Pollution at What Price? op. cit., p. 33.
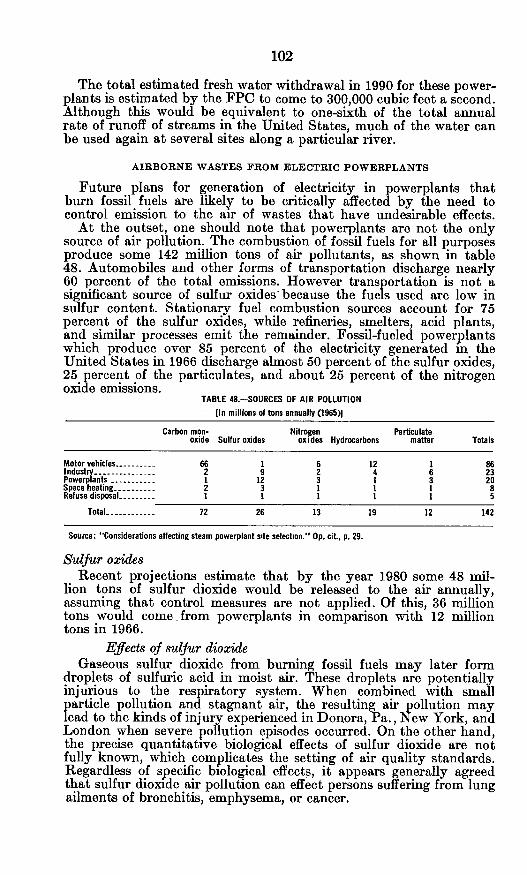
102
The total estimated fresh water withdrawal in 1990 for these power-plants is estimated by the FPC to come to 300,000 cubic feet a second.Although this would be equivalent to one-sixth of the total annualrate of runoff of streams in the United States, much of the water canbe used again at several sites along a particular river.
AIRBORNE WASTES FROM ELECTRIC POWERPLANTS
Future plans for generation of electricity in powerplants thatburn fossil fuels are likely to be critically affected by the need tocontrol emission to the air of wastes that have undesirable effects.
At the outset, one should note that powerplants are not the onlysource of air pollution. The combustion of fossil fuels for all purposesproduce some 142 million tons of air pollutants, as shown in table48. Automobiles and other forms of transportation discharge nearly60 percent of the total emissions. However transportation is not asignificant source of sulfur oxides because the fuels used are low insulfur content. Stationary fuel combustion sources account for 75percent of the sulfur oxides, while refineries, smelters, acid plants,and similar processes emit the remainder. Fossil-fueled powerplantswhich produce over 85 percent of the electricity generated in theUnited States in 1966 discharge almost 50 percent of the sulfur oxides,25 percent of the particulates, and about 25 percent of the nitrogenoxide emissions.
TABLE 48.-SOURCES OF AIR POLLUTION
[In millions of tons annually (1965)1
Carbon mon- Nitrogen Particulateoxide Sulfur oxides oxides Hydrocarbons matter Totals
Motor vehicles 66 1 6 12 1 86I ndustry -2 9 2 4 6 23Powerplants 1 12 3 1 3 20Space heating ------ 2 3 1 1 1 8Refuse disposal 1 1 1 1 1 5
Total 72 26 13 19 12 142
Source: "Considerations affecting steam powerplant site selection." Op. cit., p. 29.
Sulfur oxidesRecent projections estimate that by the year 1980 some 48 mil-
lion tons of sulfur dioxide would be released to the air annually,assuming that control measures are not applied. Of this, 36 milliontons would come .from powerplants in comparison with 12 milliontons in 1966.
Effects of sulfur dioxideGaseous sulfur dioxide from burning fossil fuels may later form
droplets of sulfuric acid in moist air. These droplets are potentiallyinjurious to the respiratory system. When combined with smallparticle pollution and stagnant air, the resulting air pollution maylead to the kinds of injury experienced in Donora, Pa., New York, andLondon when severe pollution episodes occurred. On the other hand,the precise quantitative biological effects of sulfur dioxide are notfully known, which complicates the setting of air quality standards.Regardless of specific biological effects, it appears generally agreedthat sulfur dioxide air pollution can effect persons suffering from lungailments of bronchitis, emphysema, or cancer.

103
The acid mists also may damage property and vegetation. In com-bination with other pollutants, for examples particulates, sulfuroxides have been shown to exhibit synergistic effects and produceresults several times more severe than from comparable exposure toeither pollutant alone.
Regardless of the completeness of present scientific informationabout the biological efforts of sulfur dioxide, the public regards it as apollutant to be controlled.
Regulation of sulfur oxidesThe regulation of sulfur dioxide and other air pollutants is primarily
the responsibility of State, local, and regional agencies, backed up bythe Department of Health, Education, and Welfare.
Federal legislation.-Pursuant to the Clean Air Act (Public Law 90-148), DHEW administers Federal aid grants to establish and maintainregional, State and local air pollution control programs. DHEW alsois establishing air quality control regions, with a completion targetdate of September 1970. It has released air quality criteria for carbonmonoxide, photochemical oxidants, and hydrocarbons, and also controltechniques for stationary sources of emissions of carbon monoxide,nitrogen oxides, hydrocarbons and organic solvents. The Departmenthas reported to Congress that national emission standards for station-ary sources, which would include steam-electric powerplants, is not inthe best interest of pollution abatement. Rather, DHEW favorsnational air quality standards with local, State, or regional agenciesresponsible for implementing them, and with national emission stand-ards limited to application to new installations.
The act authorizes DHEW to recommend and establish standardsif sufficient local standards are not adopted and in an emergency toenjoin the emission of contaminants.
State legislation.-State air pollution control laws empower Stateand local air pollution control agencies to promulgate standards forregulating sulfur compounds in the air. Typically, States enacting oramending air pollution control laws authorize the creation of a Stateair pollution control agency, wbich is instructed to issue rules andregulations pertaining to air quality and, in some instances, to issuesulfur emission standards and limits for sulfur content of fuels.
State regulation.-Rules and regulations of State air pollution con-trol agencies have become increasingly specific for sulfur control.State regulations generally contain a sulfur dioxide emission limit forindividual sources, using a figure of 2,000 parts per million by volumeof sulfur dioxide as a limit for existing sources. This standard appearsdirected more toward regulation of sources such as sulfuric acid plantsthat may emit sulfur dioxide as a byproduct of manufacturing ratherthan from the combustion of fuel. Recent legislation in South Carolina,New York, Missouri, and other States, has set variable emissionrequirements for combustion sources. Consequently an electric powerstation may have quite a different sulfur dioxide emission limit inmany jurisdictions than an industrial processing plant, and for electricpowerplants there may be a wide variation in the emission limitsprescribed.
Sulfur dioxide emission standards are being supplemented, and insome places preempted, by regulations limiting the sulfur content offuels. This approach is more certain and less expensive to administer.

104
Current enactments set different fuel limits according to use. Fuelfor steam and electric stations, heating and industrial may havedifferent limits. Limits are usually expressed in terms of a maximumpercentage of sulfur by weight, and there is little uniformity amongstthem. Some authorities have set the maximum as low as 1 percentand by 1970 it may be as low as 0.37 percent. According to the NationalCoal Policy Conference, in every instance the sulfur limit set issignificantly lower than. the sulfur contained in the coal previouslyburned within the jurisdiction.
Action in California.-Perhaps the most severe limitation uponsulfur dioxide is to be found in California. There the State's environ-mental quality study council has recommended a moratorium onfossil-fueled powerplants. The Orange County Board of Supervisorssubsequently voted against two 790-megawatt units at HuntingtonBeach. The Los Angeles Air Pollution Control Board has indicated itwill not approve further applications for fossil-fueled powerplants.'
Technological alternatives to reduce sulfur dioxide emissionsFive technological approaches may be used, singly or in combina-
tion, to keep the sulfur dioxide emission from a steam electric power-plant within limits of air quality standards. These are to:
(1). Use fuels of low natural sulfur content.(2) Remove or reduce the sulfur in fuels.(3) Remove the sulfur dioxide from stack gases.(4) Improve the combustion process.(5) Disperse the stack gases sufficiently that the sulfur dioxide
at ground levels stays within air quality limits.Use of low sulfur fuels.-The ideal fuel of low sulfur content is
natural gas, which explains why some air pollution control authoritiesspecify the use of natural gas by steam electric plants. Some residualfuel oils also may have a naturally low sulfur content, dependingupon their origin. The residual oils from Africa are the lowest in sulfur.Some coal deposits also are low in sulfur, but limited supply andstrong competition for nonfuel uses greatly limits their use.
While the use of low sulfur fuels may provide some temporaryrelief from air pollution, in the long run ways must be found to reducethe sulfur content of fuels before they are burned and to removeenough sulfur dioxide from powerplant emissions to stay within airquality limits.
One noticeable result of the specification of sulfur emission standardshas been to accelerate a trend away from coal into gas and residualfuel oils. According to the Office of Oil and Gas of the Department ofthe Interior, the use of gas in the utilities market of the east coast,for example, for the first 6 months -of 1969 was 45 percent more thanin 1968 and residual fuel oil was up 28 percent, while use of coal didnot increase at all.
Low sulfur coal: Before addressing the availability of low sulfurcoal, it should be noted that in some powerplants this kind of coalcannot be burned in existing furnaces without operational difficultiesor incurring high capital costs for furnace modifications.
Sulfur, unfortunately, is universally present in coal not in elementalform but combined with the organic coal substances or in the form of
I Electrical World, Nov. 10, 1969, p. 25.

105
pyrite. In most U.S. coals, the total sulfur content varies from 0.5 to6 percent. Much of the coal now burned by powerplants is high sulfurcoal, that is, with a content of 1 percent or more.
In terms of national coal reserves of all classes, approximately 50percent are located east of the Mississippi River and 50 percent on thewestern side. However, of the total reserves of low sulfur coal with lessthan 1 percent sulfur, almost 90 percent, including lignite, is locatedwest of the Mississippi. The Office of Science and Technology assertsthat the supply of low sulfur coal is costly and limited. The NationalCoal Policy Conference asserts the supply for power generation iswholly inadequate and is in extremely short supply.
Most of the low-sulfur coal in the East is of metallurgical gradecoking quality and is largely dedicated to the steel industries, bothdomestic and foreign. These fine grade coals are produced in WestVirginia and adjoining States and are in demand throughout the freeworld. They constitute a large source of export tonnage and incomewhich makes an important contribution to the national balance ofpayments.
Even with a premium of $2 to $3 per ton, which would be requiredin the East, producers of low sulfur coal may not be able to supply therapidly growing demand for this commodity. Even if supplies wereavailable, the premium price would result in substantially higher costsof generation.
According to the Department of the Interior, about two-thirds ofthe coal produced east of the Mississippi River cannot meet presentlimits for sulfur content and virtually none of it will be able to meetthe more restrictive standard of 0.37 percent that some States havescheduled by the end of the year 1971.
Low sulfur oil: Some residual oils from abroad are low enough insulfur content to be used in steam electric powerplants. A decisionannounced by the Secretary of the Interior in July 1967, revisedGovernment oil import controls to combat air pollution. The changeallowed fuel users a greater supply of low-sulfur fuel oil by reclassifyingNo. 4 and other low-sulfur oil, previously subject to import quotas,to the category of "residual" fuel oil. This reclassification permittedthe east coast to import low-sulfur oil with few import restrictions.And the Interior Department established a system to permit importsof low-sulfur fuel on the west coast and allowed U.S. refiners a specialallocation for low-sulfur fuel they manufacture from imported oil.
The importing of residual fuel oil has recently become a matter ofcontroversy before Congress, for the utilities are seeking to importlarger quantities. For example, recently the Commonwealth EdisonCo. asked for a special quota to import 6 million barrels of residualfrom Venezuela into the interior of the Nation via the MississippiRiver. The company chose to do this, paying an estimated additional$5 million per year rather than attempt to remove sulfur dioxide fromthe furnace gases. The cost of heat energy from this imported residualis estimated at 44 to 52 cents per million B.t.u. in comparison withcoal at 24 cents per million B.t.u.
Gas: Natural gas already appears to be in short supply and pipe-line and distributing companies are experiencing difficulties, accordingto the National Coal Policy Conference, in meeting increased con-sumption of present customers. Some technical prospects exist for
46-366 0-7 o--8

106
producing gas from coal. The Bureau of Mines and the Departmentof the Interior are sponsoring pilot plant studies on gasification.According to the Bureau, if a decision were made to press ahead, acommercial coal gasification plant could be operating by 1977. How-ever whether the demonstration and subsequent adoption of gasifica-tion technology could be carried out fast enough to help substantiallywith the anticipated gas shortage seems doubtful.
Removal of sulfur from fuels.-At present it seems unlikely thatcommercial processes to remove sulfur from coal will be availableduring the next few years, when many critical decisions will have tobe made about fuel for large new powerplants. According to theOffice of Science and Technology, research projects do show promiseof removing as much as 70 percent of the sulfur, although the finalproduct might still contain enough sulfur to be classified as a highsulfur fuel. What the technological and economic feasibility of suchremoval processes may be remains to be seen.
The sulfur content of fuel oil, on the other hand, can be broughtwithin acceptable amounts either by removing some of the sulfur,or by diluting a high sulfur oil with low sulfur oil, or both.
Present technology indicates that the most economical means ofremoving sulfur from residual oil for use in electric powerplants maybe at the refinery. The OST estimates that oil can be desulfurizedfor a cost of about 25 to 50 cents a barrel depending upon the originalmaterial, the amount of sulfur to be remove and processing methods.The capital investment to build a desulfurizing plant is estimatedat about $260 per barrel of daily capacity.
The petroleum industry is investing heavily in ways to reducesulfur content of fuel oil. Esso, for example, is installing such aplant in Venezuela to produce 100,000 barrels a day primarily foreast coast powerplants. Prof. Thomas K. Sherwood of MassachusettsInstitute of Technology estimates that the refining to reduce sulfurcontent from 2.6 to 0.5 percent will increase the price of residualfuel oil to the power station by 50 to 80 cents per barrel, an increaseof 20 to 35 percent. For comparison, an increase of 50 cents per barrelwould be expected to increase the cost of generation by about 0.7mills per kilowatt-hour in a modern steamplant.'
While domestic crude oil is generally lower in sulfur than theimported oils, it is priced too high for fuel use in generating electricity.Only about one-third of the residual oil marketed in the UnitedStates is derived from domestic sources.
Removal of sulfur during combustion.-Five technical processesare in various stages of research, development, and demonstrationfor removal of sulfur dioxide from the furnace gases of a steam-electric powerplant. The remaining technological problems for thisalternative appear much closer to solution than for reducing thesulfur content of coal. However, the search for an economic methodof removing sulfur compounds from the gases has been going on for30 years with no commercially available devices yet available formodern powerplants. The coal industry in particular would encourageFederal support of research into sulfur compound removal so as toinsure the future use for coal in generating electricity.
I Thomas K. Sherwood, "Must We Breathe Sulfur Oxides?" Technology Review, January 1970, p. 27.
107
The Office of Science and Technology identifies the three post-combustion removal processes which show the most promise ofeventual commercial success as the alkalized alumina process, thecatalytic oxidation process, and the limestone/dolomite processes.Each is relatively expensive. The first requires large and complexequipment so that its application is limited to new, large powerplants.The third is less expensive, requires less equipment, and can be adaptedto existing poverplants. All are in various stages of development.
It seems evident that regardless of the system chosen for removalof various offensive gases, additional space will be needed at a power-plant to erect the equipment and to provide storage for the extractedwastes. For instance, the waste produced by the limestone/dolomiteprocess for a 1,250 megawatt powerplant is about 2,000 tons per day.
The Consolidated Coal Co. in February 1970 announced that it haddeveloped a process for removing sulfur oxide from stack gas. Accord-ing to the company, this process, which differs from others beingdeveloped, can be used in existing or new powerplants. It wouldproduce elemental sulfur as a product, which can easily be stored, andshould find a ready market. Whether it will be used remains to be seen.
In January 1970, an experimental installation of the limestone/dolomite process began an 18-month test at TVA's Shawnee steamplantnear Paducah, Ky.
As for costs, these remain conjectural. One estimate for the lime-stone/dolomite process puts the initial capital cost at $10 per kilowatt.Figuring in operating and fixed charges, the costs come to theequivalent of 25 cents per barrel of oil burned for 1 percent sulfur oiland 30 cents per barrel for 3 percent fuel. If the price of 1 percent oil is$2 per barrel, this system would increase the equivalent fuel cost by12% percent, and the cost of generation by 0.4 mill per kilowatt-hour.
The National Coal Association estimates that the first generation ofsulfur dioxide removal plants will operate at a cost range of 75 cents to$1 per ton of coal burned and that, as the technology improves, futurecosts should drop to about 20 to 25 cents per ton of coal burned.
Improving thecombustion of coal.-Another strategy is to reducesulfuremissions from coal-fired powerplants by radically changing the methodof burning coal. Instead of burning pulverized coal, a so-called fluidizedbed technique could be used. The Office of Coal Research is optimisticon this approach because it believes it can reduce air pollution, lowercapital and operating costs of coal-fired plants. However, because oftight funds, the Office of Coal Research has terminated its support forthis development. The Nationl Air Pollution Control Administrationhas indicated it believes the air pollution aspect of the fluidized bedprocess warrants further investigation and plans to provide some sup-port. However, unless the development and demonstration of thistechnique is expedited, the chances that it can be used in large newpowerplants ordered during the 1970's are slim.
Dispersing and diluting sulfur emissions in the air.-Since the effectsof sulfur dioxide depend upon its concentration in the air, one way toreduce its effects is to dilute the emission from a large powerplant bydischarging the furnace gases from very tall stacks. Such stacks maybe effective in reducing the ground-level concentration of pollutants,but they do not reduce the amount of pollutants released into the air.Also, under some local weather they may not cause dispersion andhigh concentrations of sulfur dioxide may occur at the ground.

108
The 1,200 foot stack of a power plant in West Virginia is the highestpower plant stack to date. The cost of tall stacks is considered to beabout 10 to 20 percent of the estimated cost of some of the sulfurremoval processes discussed above. The OST thinks it doubtful thatthe stacks will be able to afford the dilution necessary to meet stringentsulfur dioxide standards particularly for a large plant that burns highsulfur fuel.
Nitrogen oxidesThe nitrogen compounds contained in fossil fuels are released to the
air during combustion, usually in the form of oxides of nitrogen.Among the fossil fuels, pulverized coal is the greatest producer of
mtrogen oxides, with oil next and gas last. The Federal Power Com-mission estimates that the following amounts of nitrogen oxides canbe expected from the combustion of coal, oil, and gas in generating1000 kilowatt-hours of electric power: Coal, 8.6 pounds; oil, 7.6 pounds;and gas, 4.1 pounds.
Effects of nitrogen oxidesUntil the 1950's, when these chemicals were implicated in the forma-
tion of eye-irritating smog in the Los Angeles area, nitrogen oxideswere ignored as a pollutant from steam electric powerplants. Sincethen some research has been done on the formation of these oxidesand general methods of reducing emission of nitrogen oxides have beensuggested. However in comparison to the effort to control emission ofsulfur oxides, the research on nitrogen oxides is practically nonexistent.
Since nitrogen oxides are produced by stationary and vehicularcombustion sources, both of these sources contribute to smog. Theexact role of each has not been clearly defined.
Regulation of nitrogen oxidesAt present regulation of nitrogen oxide as a gaseous pollutant from
powerplants has received only secondary attention. The National AirPollution Control Administration will not issue criteria for theiremissions until 1971.
Actual regulation now is carried out by State and local air pollutioncontrol agencies, as with sulfur oxides.
Control systemsNo tested systems to control the emission of nitrogen oxides are
commercially available for powerplants. In comparison to the mas-sive effort now underway to control the oxides of sulfur, research onnitrogen oxide control is practically nonexistent.
Use of alternative fuels is not a real option because, as seen above,the combustion of fossil fuels all yield roughly comparable quantities.
Cost of controlAt present any cost estimate for control of nitrogen oxide emissions
would be purely speculative.Solid wastes from powerplants
Fly ash and furnace ash are wastes from combustion of oil and coalin powerplants. Emissions are dependent upon fuel quality, type ofequipment, size and method of firing, and maintenance and operation.Ash emission from burning of natural gas is insignificant in comparisonwith other fossil fuels.

109
Effects of fly ashThe principal environmental effect of fly ash which is discharged to
the air is the dirt it deposits on surrounding homes and factories.The 297 million tons of coal burned for electric power in 1968 pro-
duced approximately 29.6 million tons of this waste material. Untilabout 10 years ago, nearly all of this was stored in piles near the utilityplant, resulting in destruction of the vegetation near the plant, creatingan adverse esthetic effect, contributing to air pollution as the dried ashblew about, and damaging streams, crops and vegetation by theleaching of chemicals from the ash piles by rain water. It is estimatedthat 200 million tons have been stored on the surface in the past 10years. If the storage piles averaged 40 feet in height, approximately2000 acres would be covered with this material. One estimate of theash to be generated by coal combustion from 1968 to the year 2000 isfor 1.9 billion tons, which would occupy 20,000 acres if not otherwisedisposed of.
Regulation of particulate emissionRegulation of the amount and characteristics of particulate emis-
sions permitted from powerplants and other users of fossil fuels is thefunction of local air pollution control agencies.
Control of particulate emissionsControl of emissions from powerplants has, in the past, emphasized
"smoke" and particulate control. Four fundamental types of controlequipment have been developed: mechanical separators, electrostaticprecipitators, bag houses, and scrubbers. There latter two are foundmost frequently in conventional manufacturing industries and areoften included to recover otherwise valuable lost materials.
The technology to collect fly ash has shown a continuing improve-ment. The average efficiency of collectors being specified for modernpowerplants ranges from 98 to 99 percent. The Office of Science andTechnology expects this trend will continue.
Research in electrostatic precipitation is now focused mainly in thecollection efficiency region above 99 percent. Despite an anticipateddecrease in particulate emissions, some increases are anticipated inthe emissions of very small particles. OST notes that these very smallparticulates may be found to be of particular significance in regard tohealth effects and possible long-term effects upon the climate.
The disposal of fly ash, as indicated above, presents some problems,particularly if the solid wastes from certain air cleaning processes areadded. One approach to disposal of fly ash has been research toconvert it into a useful byproduct. At a recent conference on fly ashdisposal' it was forecast that in 1975 the electric utilities of theUnited States will be producing fly ash at a rate of approximately29 million tons per year, together with approximately 13.5 milliontons of ash and slag from the furnaces for a total ash production of42.5 million tons. To dispose of this waste commercially will requireimproved technologies of use and marketing techniques.Radioactive wastes from nuclear power
The fissioning of uranium or plutonium atoms in a nuclear powerreactor produces large quantities of intensely radioactive materials.In fact, the weight of the radioactive waste products virtually equals
I "New Uses For Fly, Other Ash Told to 300 at Pittsburgh," Electrical World, Mar. 30, 1970, pp. 22-23.
110
the weight of the nuclear fuel atoms that fission: In addition, structuraland other materials within a power reactor may become radioactivebecause of exposure to the neutrons emitted during fission.
Most of these wastes are enclosed within the fuel elements withinthe reactor, although some of them may escape from the fuel elementsthrough small imperfections in their cladding. These escaped wastesremain within the reactor, which is a closed system.
For routine operations, radioactive wastes from a nuclear power-plant reach the environment in one of two ways. Radioactive gases arecollected and routinely vented to the outside air, usually from a tallstack or from a blower atop the powerplant. These gases includeradioactive krypton and xenon. Some vapors of iodine may also appeardepending upon the amount of leakage from the fuel. Other radio-active wastes are routinely collected during powerplant operations.A small.part of these may remain in plant waste waters after thesehave been filtered and in other ways treated to remove the greatestpart of them. The waste water is mixed in with cooling water leaving theplant.
Effects of radioactive wastesRadiation from radioactive wastes depending upon the amount and
nature of the waste and the conditions of exposure to it, may producenoticeable biological effects. Large exposures to such radiation fromwastes in the environment or that find their way into an organism,can cause injury or death. The exposures that produce these effectsare well known and the nature of the effects are established. Thiskind of exposure is unlikely to result from the routine operation of anuclear powerplant, except for an accident which might rupture thereactor and disperse its radioactive contents to the surroundings. Theexposure which has prompted most recent concern is prolonged ex-posure to very small quantities of radioactive wastes which produceradiation less than much of the radiation which exists in nature fromnaturally radioactive minerals.
Although the radioactive wastes routinely discharged from anuclear powerplant are within limits specified by the Atomic EnergyCommission, some scientists have expressed concern that these smallamounts if continuously emitted for long periods of time may findtheir way into the food chains and water supply. Some waterplantsand animals tend selectively to remove and concentrate certainradioactive wastes. For example, radioactive species of cobalt, cesium,and manganese are concentrated in the edible tissues of shellfish,while in dairy country radioactive iodine vapors that condense ongrass may appear in the milk of the cows that eat the grass.
The aspect of radiation which arouses the most concern and con-troversy is its postulated effects upon the genetic mechanism. It iswell known that large exposures to radiation can cause mutationsin animals such as fruit flies. What is not as well known is the effectof small amounts of radiation upon the inherited characteristics ofhuman beings and other living things. The Federal Radiation Councilin its first report had this to say about the genetic effects of radiation:
Although ionizing radiation can induce genetic and somatic effects(effects on the individual during his lifetime other than geneticeffects), the evidence at the present time is insufficient to justify

ill
precise conclusions on the nature of the dose-effect relationshipespecially at low doses and dose rates. Moreover, the evidence isinsufficient to prove either the hypothesis of a "damage threshold"(a point below which no damage occurs) or the hypothesis of "nothreshold" in man at low doses.' Because of limitations of knowledgeand the complexities of assessing the effects or radiation exposure,the FRC endorses the philosophy that all exposures should be keptas far below any arbitrarily selected levels as practicable. "Thereshould not be any man-made radiation exposure without the ex-pectation of benefits resulting from such exposure." 2
Regulation of radioactive wastesUntil recently it was commonly assumed that Congress in the
Atomic Energy Acts of 1946 and 1954 had preempted to the AtomicEnergy Commission the authority to regulate emission of radioactivewastes from nuclear powerplants. The AEC's regulatory system takesa twofold approach. First, the nuclear powerplants each must obtainfirst a construction permit to build the plant and then an operatingpermit to put it into operation. The AEC review of the plant designand construction prior to issuing such permits looks into measures tocontrol the discharge of radioactive wastes. Second, the AEC's regu-lations in part 20 to title 10 of the Code of Federal Regulationsestablishes specific limits for the emission of radioactive materialsfrom nuclear powerplants. These latter regulations, however, do notextend to control of natural materials or those that are made arti-ficially radioactive with machines other than nuclear reactors. Controlof these substances remains with the States. The AEC on March 28,1970 announced a proposed amendment to 10 CFR 20 which wouldrequire licensees of power reactors to make "* * * every reasonableeffort to maintain radiation exposures and releases of radioactivematerials in effluents to unrestricted areas as far below the limitsspecified * * * as practicable." Recently the Minnesota PollutionControl Agency in issuing a permit for the operation of a large nuclearpowerplant, included a limitation upon discharge of radioactivewastes which is more restrictive than those of the AEC. The issue ofwhether this State agency can apply stricter controls than those ofthe AEC was still in Federal court for decision in April 1970.
The AEC regulations on emission of radioactive wastes are inter-pretations of guides laid down by the Federal Radiation Council.These guides, in turn, are largely derived from the judgement ofscientists who are members of the semiofficial National Council onRadiation Protection and Measurements [which has a Federal charterbut receives no Federal funds] and the unofficial but prestigiousInternational Committee on Radiation Protection.
The scientific validity of present AEC regulations in 10 CFR 20recently has been challenged before the Joint Committee on AtomicEnergy and the Subcommittee on Air and Water Pollution of theSenate Committee on Public Works. The Secretary of Health, Educa-tion and Welfare also reportedly has called for a general review of thebasis for the radiation standards.
"Background Material For the Development of Radiation Protection Standards," Staf Report No. 1of the Federal Radiation Council, May 13, 1960, p. 36.
' Ibid., p. 37.

112
The principal recent challenge has come from two scientists of theAEC's Lawrence Radiation Laboratory. Drs. John W. Gofman andArthur R. Tamplin state that in their opinion the most crucial prob-lem facing everyone concerned with atomic energy is to " *** securethe earliest possible revision downward, by at least a factor of tenfold,of the allowable radiation dosage to the population from peacefulatomic energy activities." 1
Consequences of a major nuclear accidentWhile the AEC asserts that the likelihood that a major accident
with a nuclear reactor might release much of its contained radioactivewastes is very small, it did in 1957 publish a report on the theoreticalpossibilities and consequences of such an accident. The purpose ofquoting the following excerpts is not to suggest that such an accidentis probable, but to indicate what might be the range of results shouldthe improbable accident occur.
According to this AEC report, and depending upon the type ofaccident and the amount of the radioactive wastes released, theeffects might be as follows:
* * * the theoretical estimates indicate that personal damage might range froma lower limit of none injured or killed to an upper limit, in the worst case, of about3,400 killed and about 45,000 injured.
Theoretical property damages ranged from a lower limit of about one-halfmillion dollars to an upper limit in the worst case of about $7 billion. This latterfigure is largely due to assumed contamination of land with fission products.
Under adverse combinations of conditions considered, it was estimated thatpeople could be killed at distances up to 15 miles and injured at distances of about45 miles. Land contamination could extend for greater distances.
In the large majority of theoretical reactor accidents considered, the totalassumed losses would not exceed a few hundred million dollars.
The AEC has since declined to revise or update this study.Disposal of high level radioactive wastes
The most likely places for large amounts of radioactive materialsto escape to the environment during the routine generation of nuclearpower appears to be not at a powerplant, but in the transportationof used fuel from a powerplant to a fuel reprocessing plant, duringsubsequent reprocessing, there, and in the long term disposal of theradioactive wastes.
After nuclear fuel has been in a power reactor for perhaps a yearor more, or if it becomes too damaged for safe use, it is removed.After interim storage at the powerplant, to permit some of its radio-activity to diminish, the used fuel is carried by truck or rail in specialcontainers to a fuel reprocessing plant. There the still usable uraniumor plutonium is recovered from the used fuel for subsequent reusein new fuel.
At present there is one operating commercial nuclear fuel reproc-essing plant in the United States, near Buffalo, N.Y. Another isnearing completion near Chicago, Ill., and a third is supposed to startconstruction in South Carolina during 1970.
At the reprocessing plant, the used nuclear fuel is chopped up anddissolved. The radioactive gases released from the fuel generally wouldbe emitted to the air in concentrations permissible under AEC regu-lations. Most of the intensely radioactive fission products remain in
I Testimony of Drs. Gofman and Tamplin before the Subcommittee on Air and Water Pollution. Senatecommittee on Public Works, Nov. 18,1969.
113
the waste liquors of the process. The weight of these radioactivewastes is virtually equal to the weight of the uranium that fissionedwhile the fuel was in the reactor. It is during the reprocessing thatthe intensely radioactive wastes are in forms which could most easilyreach the environment in an accident.
What to do with the wastes is somewhat of an open question. TheAEC expects they will be put into solid form and stored in worked-out salt mines. At the moment there is no commercial service for highlevel radioactive waste disposal. The word "disposal" itself is notaccurate, for these wastes cannot be released to the environment.Thus they must be stored indefinitely.
In May 1966, a committee of the National Academy of Sciences inadvising the Atomic Energy Commission on geologic aspects of radio-active waste disposal, reiterated the basic rule that "* * * concentra-tions of radionuclides in waste materials should not be allowed toappear in the earth's biosphere before they have decayed to innocuouslevels." ' This concept requires assurance that during any storage ordisposal operations, hazardous amounts of radioactive wastes areisolated from the environment, and that upon completion of the reproc-essing, the wastes will remain isolated as long as they might constitutea hazard. For some species of radioactive wastes, this means isolationfor periods of six to ten centuries, periods so long, notes the committee,that neither perpetual care nor permanence of records can be reliedupon. The committee did not object to radioactive materials reachingthe environment in concentrations less than those specified in AECregulations. Within those limits the committee said it had no concern.Rather it was the possibility of cumulative buildups of long-livedradioactive wastes that may exceed these limits after continued useof doubtful practices and the prospect of unforeseen concentrationsin excessive amounts resulting from unexpected and uncontrollablealterations in the future environment that the committee wished toguard against. As for the economics of long term waste disposal, thecommittee observed that while these are of concern, "* * * they arerelegated to second-rank consideration, safety being the matter offirst concern alvays." 2
The Atomic Energy Commission estimates that over the past 10years, improvements in chemical processing have reduced the wastevolumes from about 1,500 gallons per ton of used uranium processedto about 100 gallons per ton. Assuming an installed nuclear generatingcapacity of 123,000 megawatts by the year 1980, the AEC estimatesthe accumulated high level wastes in solution from nuclear powerwould be 3.5 million gallons, which could be reduced to solids with avolume of about 35,000 cubic feet, the equivalent of a cube of 32 feetto a side. Looking ahead to an installed nuclear capacity of 675,000megawvatts by the end of the century, the accumulated high levelliquid wastes, if not previously solidified, would total 55 milliongallons, and with a solid volume of 550,000 cubic feet. The AECcategorically states that disposal of high level wastes will pose nosignificant problem technically or economically. 3
I "Report to the Division of Reactor Development and Technology. U.S. Atomic Energy Commission,"National Academy of Sciences-National Research Council, Division of Earth Sciences, Committee onGeologic Aspects of Radioactive Waste Disposal. AMay 1966, p. 18.' Ibid., p. 19.' Testimony of Milton Shaw as excerpted in "Selected materials on environmental effects of producing
electric powrer." Joint Commnittee on Atomic Energy, 91st Cong., 1st sess., 1969, p. 46.

114
The ultimate risk to the environment from reprocessing of nuclearfuels and storage of their wastes in the long run seems likely to dependupon how well the reprocessors comply with AEC regulations. Thecommercial fuel reprocessor, as is any other service industry, will beunder financial pressure to reduce costs which might lead to an attitudeof bare compliance, or even neglect of AEC regulations rather than adetermined attitude to reduce emissions of radioactive wastes to thelowest level permitted by the fuel reprocessing technology.
Another open item is the question who will own and operate thesalt mines or other places for the long term storage of the radioactivewastes.
ENVIRONMENTAL ASPECTS OF TRANSMITTING ELECTRICITY AND THEIRECONOMIC ASPECTS
The trend toward very large steam-electric powerplants, the growingpublic insistence upon reliable supply of electricity, and a trendtoward citing large powerplants outside of urban areas all combine toincrease the demand for more transmission lines. Yet the scarcity ofland in the areas of high population, which also are the large users ofelectricity, and increasing public resistance to transmission linesbecause of their environmental effects, are two factors that are likelyto reduce the ability of the electricity industry to deliver electricitywhen and where needed during the coming decades.Primary unctions of a transmission system
The primary function of a transmission system is, of course, to carryelectricity from generating stations to the areas where it is distributedto local customers. In addition, from the standpoint of bulk powersupply-which is becoming more important because of the trendtoward large plants-there are three more objectives for adequatetransmission capacity. These are to-
(1) Provide additional support for any load areas as may berequired in emergencies. The network must be able to handle theautomatic flow of power within the system and through itsassociated interconnections.
(2) Transfer, without serious restrictions, capacity and energywithin regions and when available between regions to meet powershortages.
(3) Exchange power and energy on a regional and interregionalscale, and to achieve economies in capital and operating costs.
Some effects of transmission systemsIn the early days of electric power systems, generating plants were
located next to their customers and there was little long-distancemovement of any large amounts of electricity. Then as distantcustomers began to use electricity and as transmission from remotehydroelectric plants became a reality, a trend set in toward highervoltage transmission systems.' As the practical transmission distancesincreased, it became feasible to consider placing new generating plantsat places relatively remote from the load centers, which opened upan entirely new outlook upon the siting of powerplants. This wasparticularly true for the hydroelectric plants and there followed an
I As a general rule, doubling the voltage of a transmission system quadruples the electrical energy Itcan carry.

115
era of dam building and hydroelectric development. Later, the ideaof placing a steam-electric powerplant at the mouth of a coal minewas made feasible by improvements in transmission technology.
The same increases in electric power transmission capability andreduction of unit costs for carrying electricity made it feasible tomove large amounts of power between neighboring power systemsunder exchange or interchange arrangements. The recent trendtoward joint-owned generating plants to permit use of larger instal-lations than could be afforded or used by one system alone has beenmade possible by improved transmission. At the same time, however,joint ownership places greater emphasis on the transmission linecosts and right-of-way problems which can be controlling in theselection of a site for such an installation.
The independence of nuclear powerplants from location of primaryenergy sources suggests the possibility of selecting sites in the vicinityof load centers which may somewhat reduce requirements for trans-mission. However, strong interconnections would still be needed toassure adequate reliability of interconnected systems.Technological trends in transmission lines
From the introduction of 110 kilovolt alternating current trans-mission in the United States in 1908 to about 1950, there was asteady increase in the voltage of transmission lines. See table 49.Then during the 1950's the development of still higher voltage (inexcess of 200 kilowatts), or extra-high voltage (EHV) transmissionbegan. The first signification application of direct current EHV inthe United States was expected to go into service late in 1969. It isan 800-mile line at 400 kilovolts between the Pacific Northwest andthe Pacific Southwest which will be capable of transmitting about1,330 megawatts.
TABLE 49.-MAXIMUM TRANSMISSION VOLTAGES IN THE UNITED STATES
Year Kilovolts
1892-1 0
1908--------------------------------------------------1101923 -2201934 -2871 954-341964- 500
Source: National Power Survey, pt 1. p. 14.
Forecastsfor transmission linesThe FPC report of 1967
In its 1967 report on the prevention of power failures, the FederalPower Commission projected a possible pattern of needed powertransmission capability for 1975 and estimated the approximate cost.
About half of the added lines were already programed or then underconsideration by utilities or pools for completion in the later 1960's orearly 1970's. A major part were in the east-central, north-central, andfar west regions of the United States. Additions in EHV lines beyondthose scheduled for service in 1967 included 16,000 miles of 345 kilo-volt line, 21,400 miles of 500 kilovolt line, 5,750 miles of 765 kilovoltlines and 1,665 miles of 400 kilovolt direct current transmission.

116
As for the comparative capacity of these lines for carriage of elec-tricity, if 230 kilovolt transmission is taken as unity, a 345 kilovoltline can carry 2.75 times as much electricity; a 500 kilovolt line 6times as much, and a 765 kilovolt line 16 times as much.
As estimate of the approximate cost of the transmission systemadditions from 1967 through 1975 was $8 billion.
The current forecastThe Federal Power Commission last year reported the projected
general plans for transmission of its six regional advisory committeesas shown in table 50. The FPC staff, which is independently examiningprojected requirements, considers these estimates as an appropriateguide for the general size of transmission needs.Environmental effects of transmission lines
The most obvious environmental effect of electric transmission isthe sight of the towers and their cables, and the accompanying with-drawal of land from other use. Lesser effects include interference withreception of radio and television signals under certain conditions and,in the case of direct current lines, the possibility of corrosion of under-ground metallic structures, such as sewer or water pipes, because ofelectrical currents within the earth.
The 300,000 miles of electric power transmission lines in servicetoday occupy about 4 million acres of land, or the equivalent of morethan 10,000 average sized farms. By 1990 the forecast 497,000 miles oftransmission lines will require roughly 7,100,000 acres, or more than11,000 square miles. In comparison, the area of the State of Connecticutis 5,000 square miles. The rights-of-way widths will probably averagemore than 142 feet for a single circuit line. The higher voltage trans-mission lines will require widths of 200 feet or more, and multiple linerights-of-way will be still wider.
TABLE 50.-PRO:ECTED TOTAL INSTALLATION OF MAJOR TRANSM'SS!ON LINES IN CIRCUIT MILES
Voltage class (kilovolts) 1970 1980 1990
69 to 200 -235,000 290,000 335,000230 -40,500 59,300 67,000345 -16,600 34,500 50,500500 -7,500 21,300 34,700765 -------------------------------------------------------- 560 3,500 10,200Total -300,160 408, 600 497,400
Source: "Environmental effects of producing electric power." op. cit., p. 58.
The greater use of EHV transmission will minimize the totalnumber of miles of overhead transmission, but the wider rights-of-way, the more massive and higher towers, and the larger conductorscould, in view of the FPC, compound the problems in seeking topreserve environmental values.'
Through the 1990's it is expected that overhead transmission willdominate, for the technology for high voltage underground transmis-sion is not expected to be available. A large, 2,400 megawatt power-plant typically would be the juncture of three rights-of-way, each200 feet wide.
I Ibid., p. 59.

117
It is apparent, according to the FPC, that the more densely popu-lated regions are generally expected to have the greatest increase intransmission requirements. Thus it should be anticipated that utilitiesserving these population centers will encounter increasing difficultiesin acquiring new rights-of-way in these areas.'Regulation of transmission lines
Governmental review of proposed transmission line construction islimited for both the Federal and State levels of government. FPCregulatory authority is largely limited to lines associated with Govern-ment licensed hydroelectric plants, or land of such projects crossedby transmission lines. As for the States, with few exceptions, Stateregulatory commissions are vested with little or no authority overthe location of transmission lines. Less than a dozen States reportthey have significant jurisdiction over new transmission lines. Theremainder either have no jurisdiction, or have jurisdiction in specialcases only. Of the 51 State regulatory commissions, 25 have nojurisdiction of any kind over the routing of transmission lines. Of the51 regulatory commissions, 16 indicated that esthetics and environ-mental matters were, or could be, among the factors taken intoconsideration. Others indicated their review was limited by law tomatters such as safety, property of investment, and necessity for theline. In many States, transmission line construction is regulatedpiecemeal by local agencies. 2
Corrective measuresTwo different approaches to mitigating the effects of transmission
lines are visible. One is to put the lines underground. The other is toencourage multiple use of the land required for their rights of way.
Underground transmission of electricityIdeally there should be more underground transmission in urban
areas, in locations of exceptional beauty, along scenic highways andrivers and through historic sites. However despite the mounting publicdesire for more underground transmission, the technology to do so isdeveloping slowly. Even if EHV underground transmission technologyis developed, it seems likely that the anticipated high costs for itsuse in the foreseeable future will preclude any significant shift fromoverhead transmission.
Multiple land useOne way to reduce the impacts of rights-of-way is to permit multiple
use. For example, electricity, gas, oil, and rail traffic might move in thesame corridors. Or, the rights-of-way might be used for recreation, oragriculture. However, as Vice Chairman Carl E. Bagge of the FederalPower Commission points out, the historical relations among utilitiesis one of independence and outright opposition to the idea of jointuse. In his opinion, the Nation must evolve transportation and com-munication and energy corridors as an urgent matter of nationalpolicy. Yet there is still no effective communication between the rail,gas,3 and electric interests to this end.
I This theme was explored In more detail by FPC Vice Chairman Carl E. Bagge before the Joint Com-mittee on Atomic Energy in 1969. Cf. "Environmental Effects of Producing Electric Power," op. cit.,pp. 449-451.
'Testimony of Chairman John N. Nassikas of the Federal Power Commission before the Joint Commit-tee on Atomic Energy. Cf. "Environmental Effects of Producing Electric Power," op. cit., p. 66.
I Testimony of Vice Chairman Carl E. Bagge, Federal Power Commission, before the Joint Committeeon Atomic Energy. Cf. "Environmental Effects of Producing Power," op. cit., pp. 472-473.

118
The Electric Power Council on EnvironmentOne response of the electricity industry to the growing problems
caused by the adverse effects of some powerplant operations was theformation of an Electric Power Council on Environment. Formed onSeptember 25, 1969, the council's membership includes representativesof the privately, publicly and cooperatively owned power systems andthe Federal operations of the Department of the Interior and theTennessee Valley Authority. The council's objectives are:
Coordination of industry environmental programs;Encouragement of cooperation between Government and
industry; andStimulation of environmental research.
Four committees of the council will cover air pollution, waterpollution, land use and esthetics. The representatives of the privatelyowned utilities are also members of the Edison Electric Institute'sCommittee on the Environment.
APPENDIX I
ELECTRIC POWER, FUELS DEVELOPMENT, AND PROTECTION OF THE
ENVIRONMENT: LEGISLATION INTRODUCED IN THE 91ST CONGRESS
Wallace D. Bowman, Assistant Chief, Environmental Policy Division, Legis-lative Reference Service
INTRODUCTION
Significant issues that have influenced national energy policy over the pastdecade include: (i) a steadily rising public demand for more power and also acleaner environment; (ii) the recent incidence and continued expectation of power"blackouts"; (iii) a host of unsettled questions regarding public acceptance ofnuclear power development, and; (iv) the growing U.S. dependence on offshore andforeign oil resources. Widespread concern has been expressed over oil spillagesfrom wells and tankers, conflicts between the siting of new powerplants and thepreservation of scenic resources, radioactivity risks and thermal pollution problemsof nuclear powerplants, and the destruction of land resources from coal miningand processing. The urgency of the task of satisfying both the expanded demandfor electric power and considerations of environmental quality is underscored bythe exceptionally large volume of energy-related legislation introduced in the 91stCongress.
Selected bills introduced in the 1st and 2d sessions (through April 15, 1970) arelisted below under three headings: "Power Production," "Fuels Development,"and "Environmental Protection."
(119)

POWER PRODUCTION
Bill and sponsor Subject Committee
S. 1071, Mr. Kennedy et al.; H.R. 7186, Mr. MacDonald Amends the Federal Power Act to further promote the reliability, abundance ,ecanomy and efficiency Commerce,et al. of bulk electric power supplies through regional and interregional coordination. Provides for the merce.
establishment of regional councils made up of electric systems in an area to encourage coordina-tion. Provides for the establishment of a National Council on Environment with 5 members ap-pointed by the President. Empowers the Federal Power Commission upon recommendation of aregional council or upon its own motion to promulgate reliability standards for the planning andoperation of bulk powers facilities. Authorizes the Commission to order any electric system to es-tablish physical connection of its transmission facilities with the facilities of one or more otherelectric systems. Directs the Commission to conduct research on high voltage heavy currentelectricity.
H.R. 12585, Mr. MacDonald - -Encourages long range planning by regional councils. Directs the Federal Power Commission to Interstate airecognize existing regional councils or secure the establishment of appropriate regional coordina-tion organizations. Provides for the establishment of standards to guide each electric utility oper-ating bulk power facilities in a region. Requires an electric utility to obtain the prior approval ofthe Commission before constructing extra-high voltage transmission facilities or thermal plants.Grants to electric utilities who have complied with the provisions of this act in the desire to con-struct and maintain EHV facilities (1) the power of eminent domain; and (2) rights-of-way onFederal lands.
S. 1916, Mr. Magnuson by request -States that the purpose of this act is to promote the reliability, abundance, and efficiency of bulk Commerce.power supply in the United States and to assure that actions pursuant to all parts of the FederalPower Act shall have due regard for the enhancement and preservation of the environment, theconservation of natural resources and the strengthening of long-range land use and planning.Encourages the strengthening of existing mechanisms for coordination of electric utility systems.Encourages the installation and use of the products of advancing technology with due regard forthe preservation and enhancement of the environment and natural resources.
S. 2752, Mr. Muskie …Specifies procedures for the establishment of regional districts for the purpose of coordinating Governmentpower development and protecting the environment. Directs the electric utilities within eachregional district to propose reliability and adequacy standards. Directs the agency administeringthis act to review and act on approval of the proposed standards. Authorizes the agency topromulgate and distribute criteria for the development of procedures for the siting and construc-tion of bulk power facilities. Provides that no person shall undertake the construction or modifica-tion of any bulk power facility after 6 months after the administering agency has approvedstandards of procedures for regional districts without notice by the regional board of compliancewith the standards and procedures approved for the regions.
H.R. 2506, Mr. Saylor; related bills: H.R. 15727, H.R. Directs the Federal Power Commission to conduct a nuational study and prepare a comprehensive na- Interstate a15955. tional study siting plan of the optimum locations for large electric power generating facilities of
all types to: (1t insure availability of an abundant, low-cost, and reliable supply of electricityfrom such facilities, and (2) protect environmental assets of the country. Sets out additional re-lated duties for the Federal Power Commission to perform while carrying out the above duties.Requires the Federal Power Commission to start the study within 90 days after enactment ofthis act and to submit its national powerplant siting plan to Congress within 2 years after thatdate. Sets limitations on the Atomic Energy Commission's issuance of licenses for the utilizationof nuclear energy for the production of electric power.
S. 607, Mr. Metcalf et al.; H.R. 4866, Mr. Tiernan et al---- Establishes as an independent agency in the Executive branch, the U.S. Office of Utility Consumers' GovernmeniCounsel, headed by Counsel appointed by the President for a 5-year term. Authorizes the Counsel Foreign Cto represent the interests of the Federal Government and the consumers of the Nation beforeFederal and State regulatory agencies with respect to matters pertaining to electric, gas, telephone,and telegraph utilities. Authorizes the Counsel to compile and disseminate to the public informationand reports on utilities affecting the consumers' economic interest, to give technical assistance toState and local governments and to make use of model laws.
Interstate and Foreign Coin-
id Foreign Commerce.
b-0
Operations.
nd Foreign Commerce.
t Operations, Interstate andCommerce.
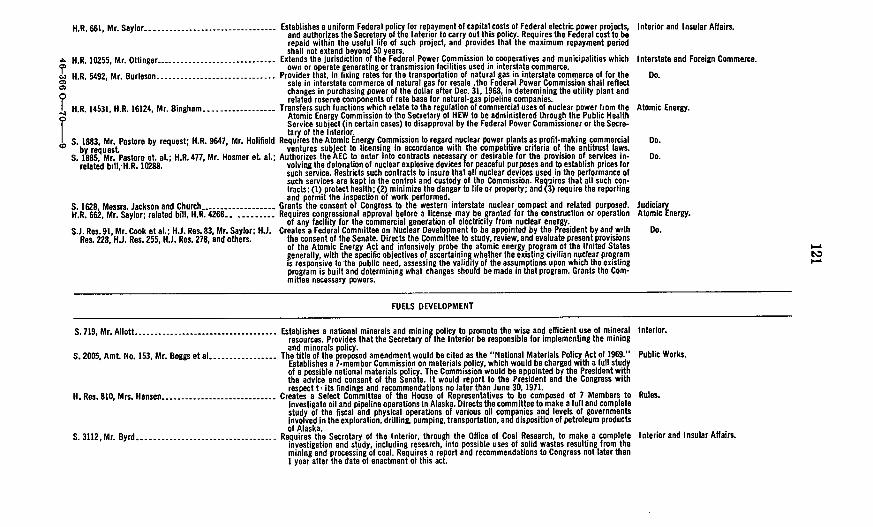
H.R. 661, Mr. Saylor - -Establishes a uniform Federal policy for repayment of capital costs of Federal electric power projects, Interior and Insular Affairs.and authorizes the Secretary of the Interior to carry out this policy. Requires the Federal cost to berepaid within the useful life of such project, and provides that the maximum repayment periodshall not extend beyond 50 years.
H.R. 10255, Mr. Ottinger - - Extends the jurisdiction of the Federal Power Commission to cooperatives and municipalities which Interstate and Foreign Commerce.own or operate generating or transmission facilities used in interstate commerce.
H.R. 5492, Mr. Burleson -Provides that, in fixing rates for the transportation of natural gas in interstate commerce of for the Do.sale in interstate commerce of natural gas for resale the Federal Power Commission shall reflectchanges in purchasing power of the dollar after Dec. 31, 1968. in determining the utility plant andrelated reserve components of rate base for natural-gas pipeline companies.
H.R. 14531, H.R. 16124, Mr. Bingham - - Transfers such functions which relate to the regulation of commercial uses of nuclear power from the Atomic Energy.Atomic Energy Commission to the Secretary of HEW to be administered through the Public HealthService subject (in certain cases) to disapproval by the Federal Power Commissioner or the Secre-tary of the Interior.
S. 18833 Mr. Pastore by request; H.R. 9647, Mr. Holifield Requires the Atomic Energy Commission to regard nuclear power plants as profit-making commercial Do.by request ventures subject to licensing in accordance with the competitve criteria of the antitrust laws.
S. 1885. Mr. Pastore et. al.; H.R. 477, Mr. Hosmer et. al.; Authorizes the AEC to enter into contracts necessary or desirable for the provision of services in- Do.related bill, H.R. 10288. volvirtg the detonation of nuclear explosive devices for peaceful purposes and to establish prices for
such service. Restricts such contracts to insure that all nuclear devices used in the performance ofsuch services are kept in the control and custody of the Commission. Requires that all such con-tracts: (1) protect health; (2) minimize the danger to life or property: and (3) require the reportingand permit the inspection of work performed.
S. 1628, Messrs. Jackson and Church -Grants the consent of Congress to the western interstate nuclear compact and related purposed. JudiciaryH.R. 662. Mr. Saylor; related bill, H.R. 4266 - - Requires congressional approval before a license may be granted for the construction or operation Atomic Energy.
of any facility for the commercial generation of electricity from nuclear energy.S.J. Res. 91, Mr. Cook et al.; H.J. Res. 83, Mr. Saylor; HJ. Creates a Federal Committee on Nuclear Development to be appointed by the President by and with Do.
Res. 228, H.J. Res. 255, H.J. Res. 278, and others. the consent of the Senate. Directs the Committee to study, review, and evaluate present provisionsof the Atomic Energy Act and intensively probe the atomic energy program of the United Statesgenerally, with the specific objectives of ascertaining whether the existing civilian nuclear programis responsive to the public need, assessing the validity of the assumptions upon which the existingprogram is built and determining what changes should be made in that program. Grants the Com-mittee necessary powers.
FUELS DEVELOPMENT
S. 719, Mr. Allott -- - Establishes a national minerals and mining policy to promote the wise and efficient use of mineral Interior.resources. Provides that the Secretary of the Interior be responsible for implementing the miningand minerals policy.
S. 2005, Amt No. 153, Mr. Boggs et al - - The title of the proposed amendment would be cited as the "National Materials Policy Act of 1969." Public Works.Establishes a 7-member Commission on materials policy, which would be charged with a full studyof a possible national materials policy. The Commission would be appointed by the President withthe advice and consent of the Senate. It would report to the President and the Congress withrespect t its findings and recommendations no later than June 30. 1971.
H. Res. 810, Mrs. Hansen - - Creates a Select Committee of the House of Representatives to be composed of 7 Members to Rules.Investigate oil and pipeline operations in Alaska. Directs the committee to make a full and completestudy of the fiscal and physical operations of various oil companies and levels of governmentsInvolved in the exploration, drilling, pumping, transportation, and disposition of petroleum productsof Alaska
S. 3112, Mr. Byrd - -Requires the Secretary of the Interior, through the Office of Coal Research, to make a complete Interior and Insular Affairs.investigation and study, including research, into possible uses of solid wastes resulting from themining and processing of coal. Requires a report and recommendations to Congress not later thanI year alter the date of enactment o1 this act.
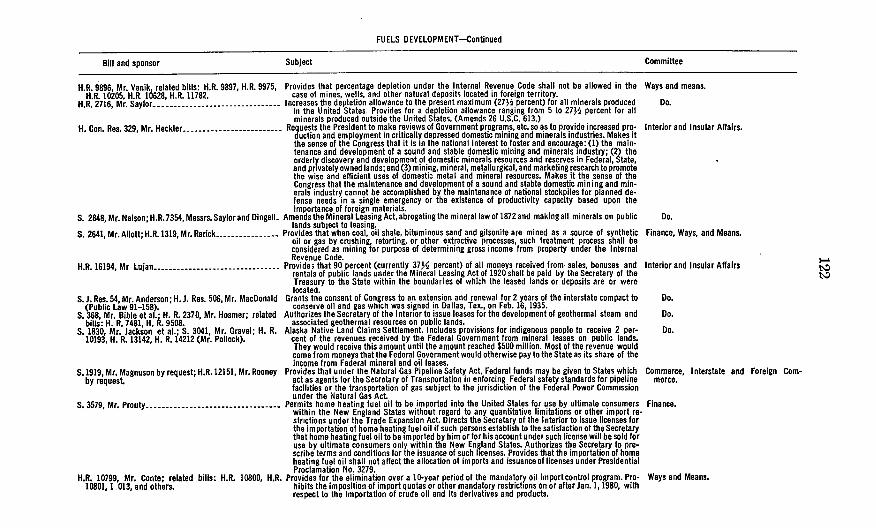
FUELS DEVELOPMENT-Continued
Bili and sponsor Subject Committee
H.R. 9896, Mr. Vanik, related bills: H.R. 9897, H.R. 9975, Provides that percentage depletion under the Internal Revenue Code shall not be allowed in the Ways and means.HR. 10205, H.R. 10628, H.R. 11782. case of mines, wells, and other natural deposits located in foreign territory.
H.R. 2716, Mr. Saylor -Increases the depletion allowance to the present maximum (27Hi percent) for all minerals produced Do.in the United States. Provides for a depletion allowance ranging from 5 to 27Ji percent for allminerals produced outside the United States. (Amends 26 U.S.C. 613.)
H. Con. Res. 329, Mr. Heckler -Requests the Presidentto make reviews of Government programs, etc.so as to provide increased pro- Interior and Insulsduction and employment in critically depressed domestic mining and minerals industries. Makes itthe sense of the Congress that it is in the national interest to foster and encourage: (1) the main-tenance and development of a sound and stable domestic mining and minerals industry; (2) theorderly discovery and development of domestic minerals resources and reserves in Federal, State,and privately owned lands; and(3) mining, mineral, metallurgical, and marketing research to promotethe wise and efficient uses of domestic metal and mineral resources. Makes it the sense of theCongress that the maintenance and development of a sound and stable domestic min i ng and min-erals industry cannot be accomplished by the maintenance of national stockpiles for planned de-fense needs in a single emergency or the existence of productivity capacity based upon theimportance of foreign materials.
S. 2848, Mr. Nelson; H.R.7354, Messrs. Saylorand Dingell Amends the Mineral Leasing Act, abrogating the mineral law of 1872 and making all minerals on public Do.lands subject to leasing.
S. 2641, Mr. Allott; H.R. 1319, Mr. Rarick -Provides that when coal, oil shale, bituminous sand and gilsonite are mined as a source of synthetic Finance, Ways, anoil or gas by crushing, retorting, or other extractive processes, such treatment process shall beconsidered as mining for purpose of determining gross income from property under the InternalRevenue Code.
H.R. 16194, Mr Lulan -Provides that 90 percent (currently 37% percent) of all moneys received from sales, bonuses and Interior and Insularentals of public lands under the Mineral Leasing Act of 1920 shall be paid by the Secretary of theTreasury to the State within the boundaries of which the leased lands or deposits are or werelocated.
S.. Res. 54, Mr. Anderson; H. J. Res. 506, Mr. MacDonald Grants the consent of Congress to an extension and renewal for 2 years of the interstate compact to Do.(Public Law 91-158). conserve oil and gas which was signed in Dallas, Tex., on Feb. 16, 1935.
S. 368, Mr. Bible et al.- H. R. 2370, Mr. Hosmer; related Authorizes the Secretary of the Interior to issue leases for the development of geothermal steam and Do.bills: H. R. 7481, H. R. 9508. associated geothermal resources on public lands.
S. 1830, Mr. Jackson et al.; S. 3041, Mr. Gravel; H. R. Alaska Native Land Claims Settlement. Includes provisions for indigenous people to receive 2 per- Do.10193, H. R. 13142, H. R. 14212 (Mr. Pollock). cent of the revenues received by the Federal Government from mineral leases on public lands.
They would receive this amount until the amount reached $500 million. Most of the revenue wouldcome from moneys thatthe Federal Government would otherwise pay to the State as its share of theincome from Federal mineral and oil leases.
S. 1919, Mr. Magnuson by request; H.R. 12151, Mr. Rooney Provides that under the Natural Gas Pipeline Safety Act, Federal funds may be given to States which Commerce, mInenby request. act as agents for the Secretary of Transportation in enforcing Federal safety standards for pipeline merce.
facilities or the transportation of gas subject to the jurisdiction of the Federal Power Commissionunder the Natural Gas Act
S. 3579, Mr. Prouy --- Permits home heating fuel oil to be imported into the United States for use by ultimate consumers Finance.within the New England States without regard to any quantitative limitations or other import re-strictions under the Trade Expansion Act. Directs the Secretary of the Interior to issue licenses forthe importation of home heating fuel oil if such persons establish to the satisfaction of the Secretarythat home heating fuel oil to be imported by him or for his account under such license will be sold foruse by ultimate consumers only within the New England States. Authorizes the Secretary to pre-scribe terms and conditions for the issuance of such licenses. Provides that the importation of homeheating fuel oil shall not affect the allocation of imports and issuance of licenses under PresidentialProclamation No. 3279.
H.R. 10799, Mr. Conte; related bills: H.R. 10800, H.R. Provides for the elimination over a 10-year period of the mandatory oil importcontrol program. Pro- Ways and Means.10801, 1 013, and others. hibits the imposition of import quotas or other mandatory restrictions on or afterJan. 1, 1980, with
respect to the importation of crude oil and its derivatives and products.
ir Affairs.
nd Means.
ir Affairs I-'by,,
state and Foreign Coin-

S. 3477, Mr.Stevens and Mr. Bellmon related bills:S. 3486, Subdivides the States into oil production districts. Establishes maximum levels of imports for the Finance.H. R. 16126. H.R. 16146, H.R. 16171, and others. various districts.
H.R. 6554, Mr. Tunney… 45,--------------and-other -Directs the Secretary of the Interior ta accelerate all necessary administrative and legal steps to Interior and Insular Affairs.clear title to all oil shale lands. Directs the Secretary to submit to Congress within 6 months otterenactment of this act a research and development program for oil shale lands. Sets standardsand limits for authorized test leasing. Prohibits production leasing until July 1, 1973. Allows theSecretary to make contractual agreements with private entities and to utilize joint efforts withother Government agencies to carry out research and development programs. Allows, after 1973,the exchange of lands by the Government to facilitate production leasing.
S.J. Pea. 184, Mr. Tower…----------------Authorizes the Secretary of the Interior to ~condoct a study of solar rays with a view to determining Commerce.the potential of such rays as an alternative source of electrical energy.
SJ. Res. 185, Mr. Tower…----------------Authorizes the Secretary of the Interior to conduct a study of the tides of oceans and other bodies Do.of water with a view to determining the potential of such tides as an alternative source of electricalenergy.
ENVIRONMENTAL PROTECTION
H.R. 15783, Mr. McClure ----------------- Extends the life of the Public Land Law Review Commission. Declares it to be the policy of Congress Interior.that immediate action should be undertaken toward developing and implementing new programsto control and prevent the pollution and other destruction of our land, waters, atmosphere, andscenic heritage. Directs the Commission to formulate recommendations to protect the environ-ment and to submit a report not later than Dec. 31, 1974.
S. 3042, Mr. Gravel et al . Provides for the study and evaluation of the air and water pollution and other environmental effects Public Works.of underground uses of nuclear energy for excavation and other purposes. Creates a 15-man studyCommission composed of leading scientific experts. Provides that the Commission report theirfindings to the President and the Congress within a year. Provides that the Commission shallevaluate the following environmental risks attendant upon the underground use of nuclear energy:(I) the effect on the public health and welfare; (2) the effect on terrestrial, marine, and freshwater ecosystems, including the generation of earthquakes and other seismic activity and othergeophysical phenomena; and (3) the transport of radioactivity through the environment Requiresthe Commission to evaluate the risks attendant upon the use of nuclear energy to remove orlower natural biological barriers which may cause the introduction of nonindigenous species intoecosystems
S. 7 Mr. Muskie; H.R. 4148, Mr. Blatnik, Public Law 91- Amends the Federal Water Pollution Control Act, as amended, to control and clean up discharges Do.2b. 0t oil from vessels and onshore and offshore facilities, and to conduct a demonstration program for
the elimination or control of acid or other mine water pollution resulting from active or abandonedmines. Sec. 21, directed primarily to the Atimic Energy Commiss on and Corps of Engineers, re-quires that any applicant for a Federal license or permit obtain certification of reasonable assur-ance of compliance with water quality standards from a State before that applicant can receive anylicense or permit.
S. 212, Messrs. Anderson and Aiken; related bills: H. R. Amends the Atomic Energy Act of 1954, as amended: (1) to make the Atomic Energy Commission Atomic Energy.9647, S. 1883, S. 2768. responsible for regulation of discharges of heat from nuclear powerplants to cooling waters; (2) to
eliminate the "Finding of Practical Value" of sec. 102 and to substitute requirement that AEClicense all nuclear power facilities under sec 103 (commercial) unless the applicant for a ceoseand AEC can demonstrate that the fac lity's function will be primarily research and development,in which case it can be licensed under sec. 104 (Medical Therapy and Research and Development);and (3) to provide for greater participation of the Justice Department in consideration of licensesfor nuclear power-plants.
S. 524, Mr. Jackson; H.R. 659, Mr. Saylor; related bills: Establishes a State-Federal program for the regulation of surface mining operations. Provides for the Interior and I nsular Affairs.H.R 222, 2505,12363. preparation of State plans for the reclamation of surface-mined areas and authorizes 50 percent
grants to cover the Federal share in the Federal-State program. Authorizes the Secretary of theInterior to make Investigations of surface mines, and to conduct an accelerated program of researchand experiments.
t'A
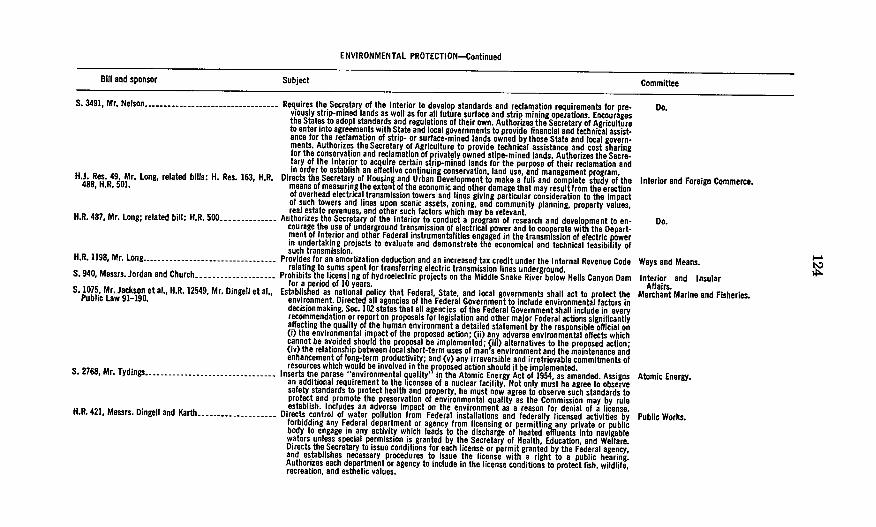
ENVIRONMENTAL PROTECTION-Continued
Bill and sponsor Subject Committee
S. 3491, Mr. Nelson ------------------ Requires the Secretary of the Interior to develop standards and reclamation requirements for pre- Do.viously strip-mined lands as well as for all future surface and strip mining operations. Encouragesthe States to adopt standards and regulations of their own. Authorizes the Secretary of Agricultureto enter into agreements with State and local governments to provide financia and technical assist-ance for the reclamation of strip- or surface-mined lands owned by those State and local govern-ments. Authorizes the Secretary of Agriculture to provide technical assistance and cost sharingfor the conservation and reclamation of privately owned stipe-mined lands. Authorizes the Secre-tary of the Interior to acquire certain strip-mined lands for the purpose of their reclamation andin order to establish an effective continuing conservation, land use, and management program.H.J. Res. 49 Mr. Long, related hills: H. Res. 163, N.R. Directs the Secretary of Noosing and Urban Development to make a full and complete study of the Interior and Foreign Commerce.488, H.R. 901. means of measuring the extent of the economic and other damage that may result from the erectionof overhead electrical transmission towers and lines giving particular consideration to the impactof such towers and lines upon scenic assets, zoning, and community planning, property values,real estate revenues, and other such factors which may be relevant.H.R. 487, Mr. Long; related bill: H.R. 500 -------- Authorizes the Secretary of the Interior to conduct a program of research and development to en- -0o.
courage the one of underground transmission of electrical power and to cooperate with the Depart-ment of Interior and other Federal instrumentalities engaged in the transmission of electricroein undertaking projects to evaluate and demonstrate the economical and technical feasib ity ofsuch transmission.H.R. 1198, Mr. Long ------------------ Prov ides for an amortization deduction and an increased tax credit under the Internal Revenue Code Ways and Means.relating to sums spent fo r transferring electric transmission lines underground.S. 40, Messrs. Jordan and Church ----------- Prohibits the licensi ng of hydroelectric projects on the Middle Snake River below Hells Canyon Dam Interior and Insularfor a period of 10 years. Affairs.S. 1075, Mr. Jackson et at., H.R. 12549, Mr. Dingell et at., Established as national policy that Federal, State, and local governments shall act to protect the Merchant Marine and Fisheries.Public Law 91-190. environment. Directed all agencies of the Federal Government to include environmental factors indecisionmaking. Sec. 102 states that all agencies of the Federal Government shall include in everyrecomnmendation or report on proposals for legislation and other major Federal actions significantlyaffecting the quality of the human environment a detailed statement by the responsible official on(i) the environmental impact of the proposed action; (ii) any adverse environmental effects whichcannot be avoided should the proposal be implemented; (iii) alternatives to the proposed action;(iv) the relationship between local short-term uses of man's environment and the maintenance andenhancement of long-term productivity; and (v) any irreversible and irretrievable commitments ofresources which would be involved in the proposed action should it be implemented.S. 2768, Mr. Tydings -I----------------nserts tna phrase "environmental quality' in the Atomic Energy Act of 1954, as amended. Assigns Atomic Energy.an additional requirement to the licensee of a nuclear facility. Not only must he agree to observesafety standards to protect health and property, ho must now agree to observe such standards toprotect and promote the preservation of environmental quality us the Commission may by ruleestablish. Includes an adverse impact on the environment as u reason for denial of a license.tl.R. 421, Messrs. Dingell sod Karth ----------- Oirects control of water pollution from Federal installations and federally licensed activities by Public Works.forbidding any Federal department or agency from licensing or permitting any private or publicbody to engage in any activity which leads to the discharge of heated el uents inot navigablewaters unless special permission is granted by the Secretary of Health, Education, and Welfare.Directs the Secretary to issue con ditions for each license or permit grunted by the Federal agency,and establishes necessary procedures to issue the license with a right to a public hearing.Authorizes each department or agency to include in the license conditions to protect fish, wildlife,recreation, and esthetic values.
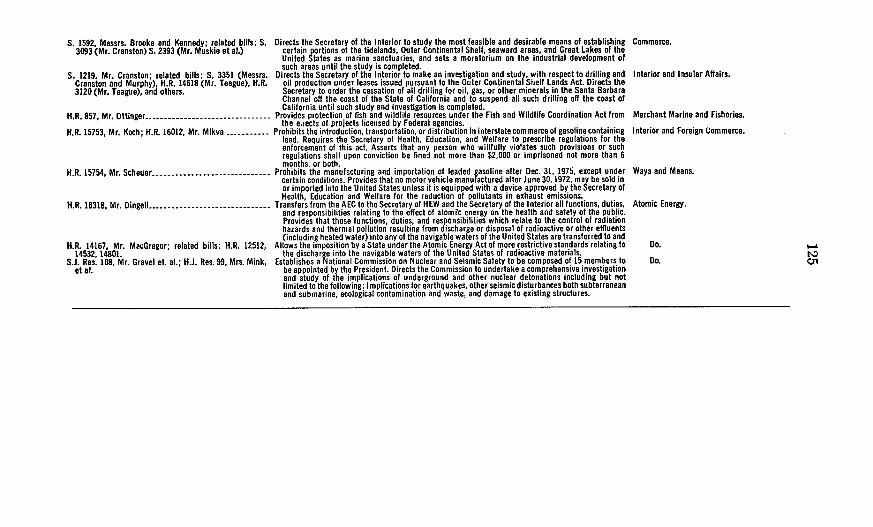
S. 1592, Messrs. Brooke and Kennedy; related bills: S. Directs the Secretary of the Interior to study the most feasible and desirable means of establishing Commerce.3093 (Mr. Cranston) S. 2393 (Mr. Muskie et al.) certain portions of the tidelands, Outer Continental Shelf, seaward areas, and Great Lakes of the
United States as marine sanctuaries, and sets a moratorium on the industrial development ofsuch areas until the study is completed.
S. 1219, Mr. Cranston; related bills: S. 3351 (Messrs. Directs the Secretary of the Interior to make an investigation and study, with respect to drilling and Interior and Insular Affairs.Cranston and Murphy), H.R. 14618 (Mr. Teague), H.R. oil production under leases issued pursuant to the Outer Continental Shelf Lands Act. Directs the3120 (Mr. Teague), and others. Secretary to order the cessation of all drilling for oil, gas, or other minerals in the Santa Barbara
Channel off the coast of the State of California and to suspend all such drilling off the coast ofCalifornia until such study and investigation is completed.
H.R. 857, Mr. Ottinger - Provides protection of fish and wildlife resources under the Fish and Wildlife Coordination Act from Merchant Marine and Fisheries.the ejiects of projects licensed by Federal agencies.
H.R. 15753, Mr. Koch; H.R. 16012, Mr. Mikva -Prohibits the introduction, transportation, ordistribution in interstatecommerce of gasolinecontaining Interior and Foreign Commerce.lead. Requires the Secretary of Health, Education, and Welfare to prescribe regulations for theenforcement of this act. Asserts that any person who willfully violates such provisions or suchregulations shall upon conviction be fined not more than $2,000 or imprisoned not more than 6months, or both.
H.R. 15754, Mr. Scheuer ---------------- Prohihits thea ma nu facturing and importation of leaded gasoline after Dec. 31, 1975, except under Ways and Means.certain conditions. Provides that no motor vehicle manufactured after June 30, 1972, may be s Id inor imported into the United States unless it is equipped with a device approved by the ecretary ofHealth, Education and Welfare for the reduction of pollutants in exhaust emissions.
H.R. 16318, Mr. Dingell -Transfers from the AEC to the Secretary of HEW and the Secretary of the Interior all functions, duties, Atomic Energy.and responsibilities relating to the effect of atomic energy on the health and safety of the public.Provides that those functions, duties, and responsibilities which relate to the control of radiationhazards and thermal pollution resulting from discharge or disposal of radioactive or other effluents(including heated water) into any of the navigable waters of the United States are transferred to and
H.R. 14167, Mr. MacGregor; related bills: H.R. 12512, Allows the imposition by a State under the Atomic Energy Act of more restrictive standards relating to Do.14532, 14801. the discharge into the navigable waters of the United States of radioactive materials.
S.J. Res. 108, Mr. Gravel et. al.; HiJ. Res. 99, Mrs. Mink, Establishes a National Commission on Nuclear and Seismic Safety to be composed of 15 members to Do.et al. be appointed by the President. Directs the Commission to undertake a comprehensive investigation
and study of the implications of underground and other nuclear detonations including but notlimited to the following: I mplications for earthquakes, other seismic disturbances both subterraneanand submarine, ecological contamination and waste, and damage to existing structures.
I'n

APPENDIX II
PUBLISHED HEARINGS AND REPORTS OF CONGRESSIONAL COMMITTEESRELATING TO POLLUTION AND ENVIRONMENTAL QUALITY, 1965-69
HOUSECommittee on Education and Labor
"Uranium miners compensation." Hearings before the Select Subcommitteeon Labor on H. R. 14558 and H. R. .16302. 90th Cong., 1st sess., 1967, 185 p.
"Coal mine health and safety." Hearings before General Subcommittee onLabor on H. R. 4047, H. R. 4295, and H. R. 7976. 91st Cong., 1st. sess.,1969, 2 vols., 658 and 100 p.
Committee on Foreign Affairs"International implications of dumping poisonous gas and waste into oceans."
Hearings before Subcommittee on International Organizations and Move-ments, 91st Cong., 1st sess., 1969, 151 p.
Committee on Government Operations"Critical need for a national inventory of industrial wastes. (Water pollution
control and abatement)." 30th report by the * * * 90th Cong., 1st sess.,1967, H. Rept. 1579, 34 p.
"Federal air pollution R. & D. on sulfur oxides pollution abatement." Hear-ings before a Subcommittee of the * * * 90th Cong., 1st sess., 1967, 95 p.
"Effects of population growth on natural resources and the environment."Hearings before Subcommittee, 91st Cong., 1st sess., 1969, 256 p.
"Environmental dangers of open-air testing of lethal chemicals." 10th reportby the * * * 91st Cong., 1st sess., 1969, H. Rept. No. 91-633, 62 p.
"Federal air pollution research and development, interim report on sulfuroxides pollution abatement R. & D." 2d report by the *** 91st Cong., 1stsess., 1969, 21 p.
"1966-68 survey of water pollution control and abatement at Federalinstallations." 1st report by the * * * 91st Cong., 1st sess., 1969, 159 p.
"Transferring environmental evaluation functions to Environmental QualityCouncil." Hearing before Subcommittee, 91st Cong., 1st sess., :on H.R.11952, 19656 p.
"Transportation of hazardous materials." Hearing before the Subcommitteeon Government Activities, 91st Cong., 1st sess., 1969, 44 p.
Committee on Interstate and Foreign Commerce"Natural gas pipeline safety." Hearings before the Subcommittee on
Communications and Power, on H.R. 6551 and S. 1166, 90th Cong., 1stand 2nd sess., 1967-1968, 244 p.
"Air pollution control research into fuels and motor vehicles." Hearing beforethe Subcommittee on Public Health and Welfare, 91st Cong., 1st sess., onH. R. 12085, 1969, 125 p.
"Pipeline safety, 1969." Hearing before Subcommittee on Communicationsand Power, 91st Cong., 1st sess., 1969, 109 p.
"Review of electronic products radiation hazards." Hearings, 91st Cong.,1st sess., 1169, 303 p.
Committee on Merchant Marine and Fisheries"Council on Environmental Quality." Report to accompany H.R. 12549,
91st Cong., 1st sess., 1969, H. Rept. 378, 2 parts, 37 p."Environmental quality." Hearings before Subcommittee on Fisheries and
Wildlife Conservation, on H.R. 6750, 91st Cong., 1st sess., 1969, 472 p."Oil pollution." Hearings on H.R. 6495, H.R. 6609, H.R. 6794, and H.R.
7325, 91st Cong., 1st sess., 1969, 493 p.(126)

127
Committee on Public Works"Water pollution-1967." Hearings, 90th Cong., 1st sess., 1967, 249 p."Federal water pollution control act amendments, 1968." Hearings, on H.R.
15906 and related bills. 90th Cong., 2d sess., 1968, 718 P."Federal water pollution control act amendments, 1969.' Hearing on H.R.
4148 and related bills, 91st Cong., 1st sess., 1969, 677 p."Oil spillage, Santa Barbara, California." Hearing before Subcommittee on
Flood Control and Subcommittee on Rivers and Harbors, 91st Cong.,1st sess., 1969, 310 p.
"Water quality improvement act of 1969." Report from the * * * toaccompany H.R. 4148, 91st Cong., 1st sess., 1969, 60 p. H. Rept. 91-127.
Committee on Science and Astronautics"The adequacy of technology for pollution abatement." Hearings before the
Subcommittee on Science, Research and Development, 89th Cong., 2dsess., 1966, 915 p.
"Adequacy of technology for pollution abatement." Report of ResearchManagement Advisory Panel through Subcommittee on Science, Research,and Development, 89th Cong., 2d sess., 1966, 17 p. Committee print.
"Environmental pollution-a challenge to science and technology." Reportof the Subcommittee on Science, Research and Development. 89th Cong.,2d sess., 1966, 60 p. Committee print.
"Environmental quality." Hearings before the Subcommittee on Science,Research and Development on H.R. 7796, 13211 and 14506, 90th Cong.,1st sess., 1967, 588 p.
"Managing the environment." Report of the Subcommittee on ScienceResearch and Development, 90th Cong., 1st sess., 1967, 59 p. Committeeprint.
House Committee on Science and Astronautics and Senate Committee on Interior andInsular Affairs
"A National policy for the environment." A Congressional White Papersubmitted to Congress under the auspices both Committees. 90th Cong.,2d sess., 1968, 19 p.
SENATE3Committee on Commerce
"Overhead and underground transmission lines." Hearings before the SenateCommerce Committee on S. 2507, S. 2508, May 1966. 89th Cong., 2d sess.,1966, 393 p.
"Natural gas pipeline safety regulations." Hearings on S. 1166, 90th Cong.,1st sess., 1967, 426 p.
"Effects of pesticides on sports and commercial fisheries." Hearings beforethe Subcommittee on Energy, Natural Resources, and the Environment,91st Cong., 1st sess., 1969, pt. 1, 278 p.
"Gas pipeline safety oversight." Hearings before Subcommittee on SurfaceTransportation, 91st Cong., 1st sess., 1969, 55 p.
Committees on Commerce and Public Works"Electric vehicles and other alternatives to internal combustion engine."
Joint hearings on S. 451 and S. 453, 90th Cong., 1st sess., 1967, 550 p.Committee on the District of Columbia
"Problems of air pollution in the District of Columbia." Hearings before theSubcommittee on Business and Commerce and the Subcommittee on Pub-lic Health, Education and Welfare, and Safety. 90th Cong., 1st sess., 1967,909 p.
Committee on Government Operations"Establish a Select Committee on Technology and the Human Environment."
Hearings before the Subcommittee on Intergovernmental Relations on S.Res. 68. 90th Cong., 1st sess., 1967, 409 p.
"Establish A Select Senate Committee on Technology and the HumanEnvironment." Hearings before the Subcommittee on Intergovernmentalrelations, 91st Cong., 1st sess., on S. Res. 78, 1969, 334 p.
Committee on Interior and Insular Affairs"Surface mining reclamation." Hearings on S. 3132, S. 3116 and S. 217. 90th
Cong., 1st sess., 1967, 28 p."Joint Colloquium on a national policy for the environment." Hearing. 90th
Cong., 2d sess., 1968, 233 p.
128
"National environmental policy." Hearing on S. 1075, S. 237, and S. 1752,91st Cong., 1st sess., 1969, 234 p.
"National environmental policy act of 1969." Report from the * * * to ac-company S. 1075, 91st Cong., 1st sess., 1969, 48 p.
Committee on Labor and Public Welfare"Water pollution, 1969". Hearings before Subcommittee on Air and Water
Pollution, on S. 7 and S. 544, 91st Cong., 1st sess., 1969, pt. 4, p. 919-1584.
Committee on Public Works"Air pollution, 1967 (Air Quality Act.)" Hearings before the Subcommittee
on Air and Water Pollution on S. 780. 90th Cong., 1st sess., 1967, Pts. 2-4,pp. 747-2694.
"Water pollution, 1967." Hearings before the Subcommittee on Air andWater Pollution, 90th Cong., 1st sess., 1967, pts. 1, 2; 721 p.
"Air pollution." Hearings before the Subcommittee on Air and Water Pollu-tion, 90th Cong., 2d sess., 1968, 808 p.
"Air quality criteria." Staff report for the Subcommittee on Air and WaterPollution, 90th Cong., 2d sess., 1968, 69 p., Committee print.
"Themal pollution." Hearings before the Subcommittee on Air and WaterPollution. 90th Cong., 2d sess., 1968, 3 pts, 1060 p.
"Waste management research and environmental quality." Hearings beforethe Subcommittee on Air and Water Pollution 90th Cong., 2d sess., 1968,451 p.
"Water pollution." Hearings before the Subcommittee on Air and WaterPollution on S. 2525 and S. 3206. 2 pts, 822 p.
"Amending Federal water pollution control act, as amended, and for'otherpurposes." Report of the * * * to accompany S. 7, 91st Cong., 1st sess.,1969, 120 p.
"Clean Air Act amendments of 1969." Report of the * * * to accompanyS. 2276, 91st Cong., 1st sess., 1969, 14 p.
'Water pollution, 1969." Hearings before Subcommittee on Air and WaterPollution, on S. 7 and S. 544, 91st Cong., 1st sess., 1969, 3 pts., 918 p.
Joint Committee on Atomic Energy"Licensing and regulation of nuclear reactors." Hearings, 90th Cong., 1st
sess., 1967, 497 p."Radiation exposure of uranium miners." Hearings, 90th Cong., 1st sess.
1967, 1373 p."Environmental effects of producing electric power." Hearings, 91st Cong.
1st sess., 1969, pt. 1, 1108 p."Radiation standards for uranium mining." Hearings before Subcommittee on
Research, Development, and Radiation, 91st Cong., 1st sess., 1969, 414 p."Selected materials on environmental effects of producing electric power."
Joint committee print, 91st Cong., 1 st sess., 1969, 553 p.
APPENDIX III
SELECTED ARTICLES ON ENERGY DEVELOPMENT
Cheryl Prihoda, Library Services Division, Legislative Reference ServiceBattelle Memorial Institute, Columbus, Ohio. Pacific Northwest Laboratories.
A review and comparison of selected United States energy forecasts;prepared for the Executive Office of the President, Office of Science andTechnology, Energy Policy Staff. Washington, For sale by the Supt. ofDoes., U.S. Govt. Print. Off., 1969 [i.e., 1970] 79 p.
Boydstun, L. B., Allen, G. H., Garcia, F. G.Reaction of marine fishes around warmwater discharge from an atomic
steam-generating plant. Progressive fish-culturist, v. 32, Jan. 1970: 9-16.Charlier, Roger Henri.
Tidal energy. Sea frontiers, v. 15, Nov.-Dec. 1969: 339-348."On November 26, 1966, on the Rance River in Brittany, near the
erstwhile pirate town of St. Malo, the cofferdams were removed fromthe turbines of the first hydroelectric plant to use the energy of the tides.Full operation of the plant began in 1967."
Competing needs of forest and cities tested. Congressional quarterly weeklyreport, v. 27, Nov. 7, 1969: 2223-2226.
Discusses proposal by New Jersey power companies to make Tocks IslandReservoir and Dam part of a much larger pumped storage project. Con-servationists fear that the natural beauty and value of the immediate area,especially Sunfish Pond, will be seriously damaged.
Does Uncle Sam give a dam? Consumer report, v. 35, Mar. 1970: 170-173."Congress has a rare chance to end private exploitation of a vast public
resource," hydroelectric power.Energy for the world's technology. New scientist, v. 44, Nov. 13, 1969: 1-24.
"The fuel industries are continually searching for more efficient ways offinding, extracting, and using fuel, and this feature section of NEW SCIEN-TIST reflects some of the aspects of that work," Specific articles on coal,fuel cells, nuclear power.
Glaser, Peter E.Beyond nuclear power-the larger-scale use of solar energy. Transactions
of the New York Academy of Sciences, v. 31, Dec. 1969: 951-967."The following discussion of the future use of solar energy does not
predict; it defines an alternative to guide the planning of future power-generating capacity so we will not deteriorate the quality of our space-ship' earth."
References, p. 966-967.Graham, Frank, Jr.
Tempest in a nuclear teapot. Audubon, v. 72, Mar. 1970: 12-19.Horton, Jack K.
Nuclear power-promise or problem? Edison Electric Institute bulletin,v. 37, June-July 1969: 207-212.
"The opportunities available to the United States from nuclearpower-from the economic, the environmental and natural resourcestandpoints-suggest that more promises than problems are evidentin our nuclear future."
Jensen, Albert C.Fish and power plants. Conservationist, v. 24, Dec.-Jan. 1969-1970: 2-6.
"The Storm King Mountain pumped-storage project generatedintense controversy and a study of the fish life near Cornwall-on-theHudson. Here are the results."
Luce, Charles F.Power for tomorrow: the siting dilemma. Record of the Association of
the Bar of the City of New York, v. 25, Jan. 1970: 13-26.Considers the dilemma between protection of the environment and
location of electric power plants in the New York City metropolitanarea, the present law, and possible improvements.
(129)
130
Lyle, Royster, Jr.The Marble Valley Controversy. National parks magazine, v. 43, Nov. 1969:
14-17."Proposed pumped storage plant and reservoirs on Virginia's Calf-
pasture River meet opposition from local residents and conservationists."McHale, John.
World energy resources in the futrue. Futures, v. 1, Sept. 1968: 4-13.Main, Jeremy.
A peak load of trouble for the utilities. Fortune, v. 80, Nov. 1969: 116-119,194, 196, 200, 205.
"The lights may go out while a sluggish industry struggles withmanagement failures, construction delays, and growing public resistanceto new plants and transmission lines."
Millsap, Ralph H.Nuclear energy's environmental advantages. Edison Electric Institute
bulletin, v. 37, Oct. 1969: 333-336.A New river. Environment, v. 12, Jan.-Feb. 1970: 36-40.
"The nuclear power plants now planned for the shores of the Great Lakeswill discharge heated water equal to the volume of flow of the MississippiRiver at its mouth."
Novick, Sheldon.Earthquake at Giza. Environment, v. 12, Jan.-Feb. 1970: 2-15.
"The atomic burial grounds at the Hanford Reservation are the mostcostly tombs since the days of the pharoahs-and hold as much radio-activity as would be released in a nuclear war."
[Nuclear power plans for New Hampshire; a symposium.] Forest notes, no. 100,fall 1969: 2-10.
A forum consisting of 4 articles by authors with different viewpoints onnuclear power plans for New Hampshire.
Contents: Electric power and the environment, by W. C. Tallman.-Nuclear reactors, a threat to the environment, by J. W. Parker.-The needfor effective regulations, by R. P. Shapiro.-Reasonable doubt should beresolved, by Raymond Brighton.
Pace, Clark.When built-in growth strikes back. Exchange, v. 30, Oct. 1969: 6-13.
"Everybody is using more power, and the utilities, suffering under anembarrassment of riches, symbolized by blackouts and threats of black-outs, can't build plants fast enough."
Palisades PWR Power Station-a special survey. Nuclear engineering inter-national, v. 15, Jan. 1970: 27-42.
Partial contents.-Palisades PWR nuclear power station, by K. Swarts.-Sitework & plant construction, by J. Lescoe.-Steam and power conversionsystem, by K. Swarts.
Phillips, James G.Electric power problems. [Washington] Editorial Research Reports, 1969.
939-956 p. (Editorial research reports, Dec. 17, 1969, v. 2, no. 23).Reichle, Leonard F. C.
Nuclear power-1970-80. Public utilities fortnightly, v. 85, Feb. 12, 1970:36-43.
"The author predicts that nuclear stations soon will be the predomi-nant type of power producer among larger-size units during the 1970's."
Seaborg, Glenn T.Environment . . . and what to do about it; part II. American forecasts, v.
75, Oct. 1969: 22-23, 54-56.The chairman of the U.S. Atomic Energy Commission attempts to
clear up some of the misunderstanding and apprehension a large segmentof the public shares over the safety of nuclear plants, and reviews". . . a few ways in which nuclear technologies are contributing to ourunderstanding of the environment and allowing us to improve ourrelationship to it."
Seaborg, Glenn T.Looking ahead in nuclear power. Edison Electric Institute bulletin, v. 37,
June-July 1969: 188-195, 231.Author speaks ". . . in defense of nuclear power and in support of the
conservation of our natural resources and the improvement of ourenvironment."

131
Seaborg, Glenn T.The nuclear plant and our energy needs. Public utilities fortnightly, v. 85,
Feb. 12, 1970: 19-26."The chairman of the Atomic Energy Commission discusses nuclear
power and some of the problems that have concerned both the publicand industry."
U.S. Federal Power Commission. Bureau of Power.A review of Consolidated Edison Company 1969 power supply problems
and ten-year expansion plans. [Washington] 1969. 89 p.Wicklein, John.
Where will you be when the lights go out-again? Washington monthly,v. 1, Sept. 1969: 8-22.
"Since the Northeast Blackout of November, 1965, there have been 37major, cascading power failures across the country." Discusses whatought to be done, including reliability proposals before Congress.
0